0001042893false00010428932025-02-252025-02-25
UNITED STATES
SECURITIES AND EXCHANGE COMMISSION
Washington, D.C. 20549
FORM 8-K
CURRENT REPORT
Pursuant to Section 13 or 15(d)
of the Securities Exchange Act of 1934
Date of Report (date of earliest event reported): February 25, 2025
INNOVEX INTERNATIONAL, INC.
(Exact name of registrant as specified in its charter)
|
|
|
|
|
|
|
|
|
|
Delaware |
|
001-13439 |
|
74-2162088 |
(State or other jurisdiction of incorporation) |
|
(Commission File Number) |
|
(I.R.S. Employer Identification No.) |
|
|
|
|
|
|
19120 Kenswick Drive, Humble, Texas |
|
77338 |
(Address of principal executive offices) |
|
(Zip Code) |
Registrant’s telephone number, including area code: 346-398-0000
Check the appropriate box below if the Form 8-K filing is intended to simultaneously satisfy the filing obligation of the registrant under any of the following provisions (see General Instruction A.2):
☐ Written communications pursuant to Rule 425 under the Securities Act (17 CFR 230.425)
☐ Soliciting material pursuant to Rule 14a-12 under the Exchange Act (17 CFR 240.14a-12)
☐ Pre-commencement communications pursuant to Rule 14d-2(b) under the Exchange Act (17 CFR 240.14d-2(b))
☐ Pre-commencement communications pursuant to Rule 13e-4(c) under the Exchange Act (17 CFR 240.13e-4(c))
Securities registered pursuant to Section 12(b) of the Act:
|
|
|
|
|
|
|
|
|
|
Title of each class |
|
Trading symbol(s) |
|
Name of each exchange on which registered |
Common Stock, $.01 par value per share |
|
INVX |
|
New York Stock Exchange |
Indicate by check mark whether the registrant is an emerging growth company as defined in Rule 405 of the Securities Act of 1933 (§230.405 of this chapter) or Rule 12b-2 of the Securities Exchange Act of 1934 (§240.12b-2 of this chapter).
Emerging growth company ☐
If an emerging growth company, indicate by check mark if the registrant has elected not to use the extended transition period for complying with any new or revised financial accounting standards provided pursuant to Section 13(a) of the Exchange Act. ☐
Item 2.02 Results of Operations and Financial Condition.
On February 25, 2025, Innovex International, Inc. (the “Company”) issued a press release announcing its results for the year ended December 31, 2024. A copy of the press release is furnished as Exhibit 99.1 hereto and is incorporated herein by reference.
The information in this Item 2.02, including Exhibit 99.1, is being furnished and shall not be deemed “filed” for the purpose of Section 18 of the Securities Exchange Act of 1934, as amended (the “Exchange Act”), or otherwise subject to the liabilities of that section, nor shall such information be deemed incorporated by reference into any filing under the Securities Act of 1933, as amended (the “Securities Act”), or the Exchange Act.
Item 7.01 Regulation FD Disclosure.
On February 25, 2025, the Company posted the Q4 2024 Earnings Presentation (the “Presentation”) to the “Investors” section of its website at www.innovex-inc.com. A copy of the Presentation is furnished as Exhibit 99.2 hereto and is incorporated herein by reference.
The information in this Item 7.01, including Exhibit 99.2, is being furnished and shall not be deemed “filed” for the purpose of Section 18 of the Exchange Act, or otherwise subject to the liabilities of that section, nor shall such information be deemed incorporated by reference into any filing under the Securities Act or the Exchange Act.
The Company announces material information to the public through a variety of means, including filings with the Securities and Exchange Commission, press releases, public conference calls, and on the Company’s investor relations website (https://investors.innovex-inc.com) as means of disclosing material non-public information and for complying with its disclosure obligations under Regulation FD.
Item 9.01 Financial Statements and Exhibits.
(d) Exhibits.
SIGNATURE
Pursuant to the requirements of the Securities Exchange Act of 1934, the Registrant has duly caused this report to be signed on its behalf by the undersigned hereunto duly authorized.
|
|
|
|
|
|
INNOVEX INTERNATIONAL, INC. |
|
|
By: |
|
/s/ Kendal Reed |
|
|
Kendal Reed |
|
|
Chief Financial Officer |
Date: February 25, 2025
Exhibit 99.1
Innovex Announces Fourth-Quarter 2024 Results
HOUSTON, February 25, 2025 – Innovex International, Inc. (NYSE: INVX) (“Innovex,” the “Company” or “we”) today announced financial and operating results for the fourth quarter and full year of 2024.
Fourth Quarter Highlights
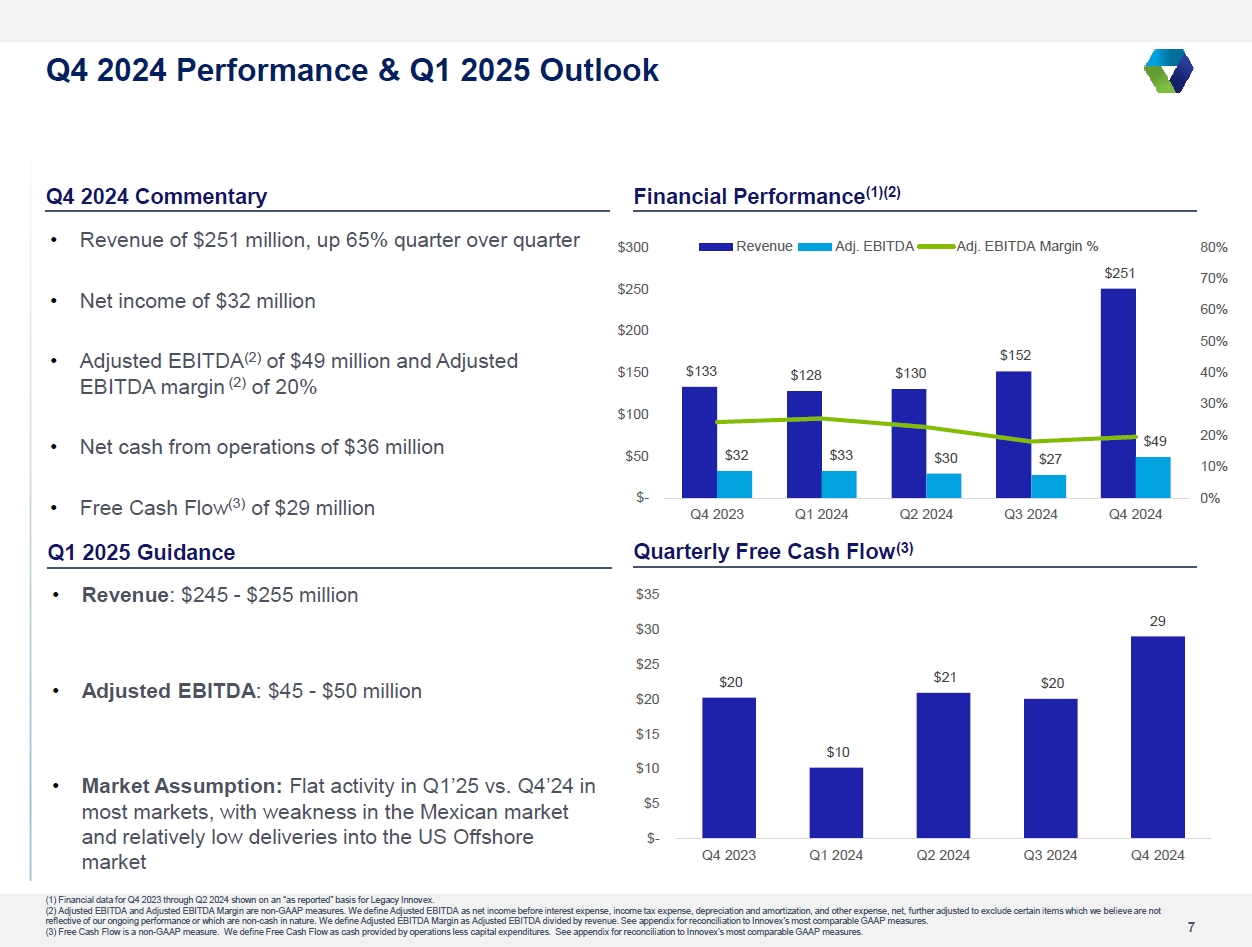
•Revenue1 of $251 million, up 65% quarter over quarter
•Net Income of $32 million, net income margin of 13%
•Adjusted EBITDA2 of $49 million and Adjusted EBITDA margin2 of 20%
•Net Cash Provided by Operating Activities of $36 million
•Free Cash Flow2 of $29 million
•Income from Operations of $27 million
•Return on Capital Employed2 of 12%
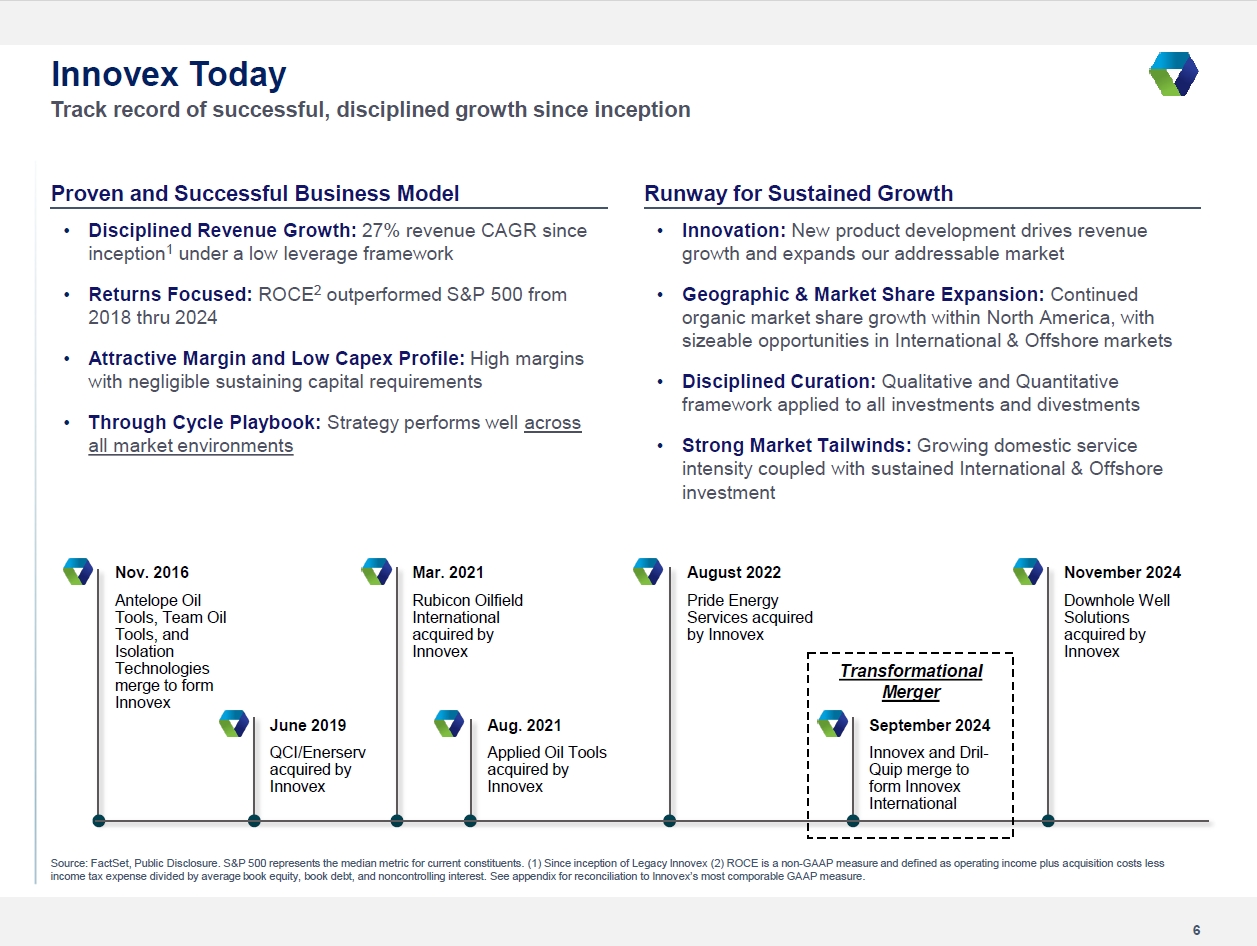
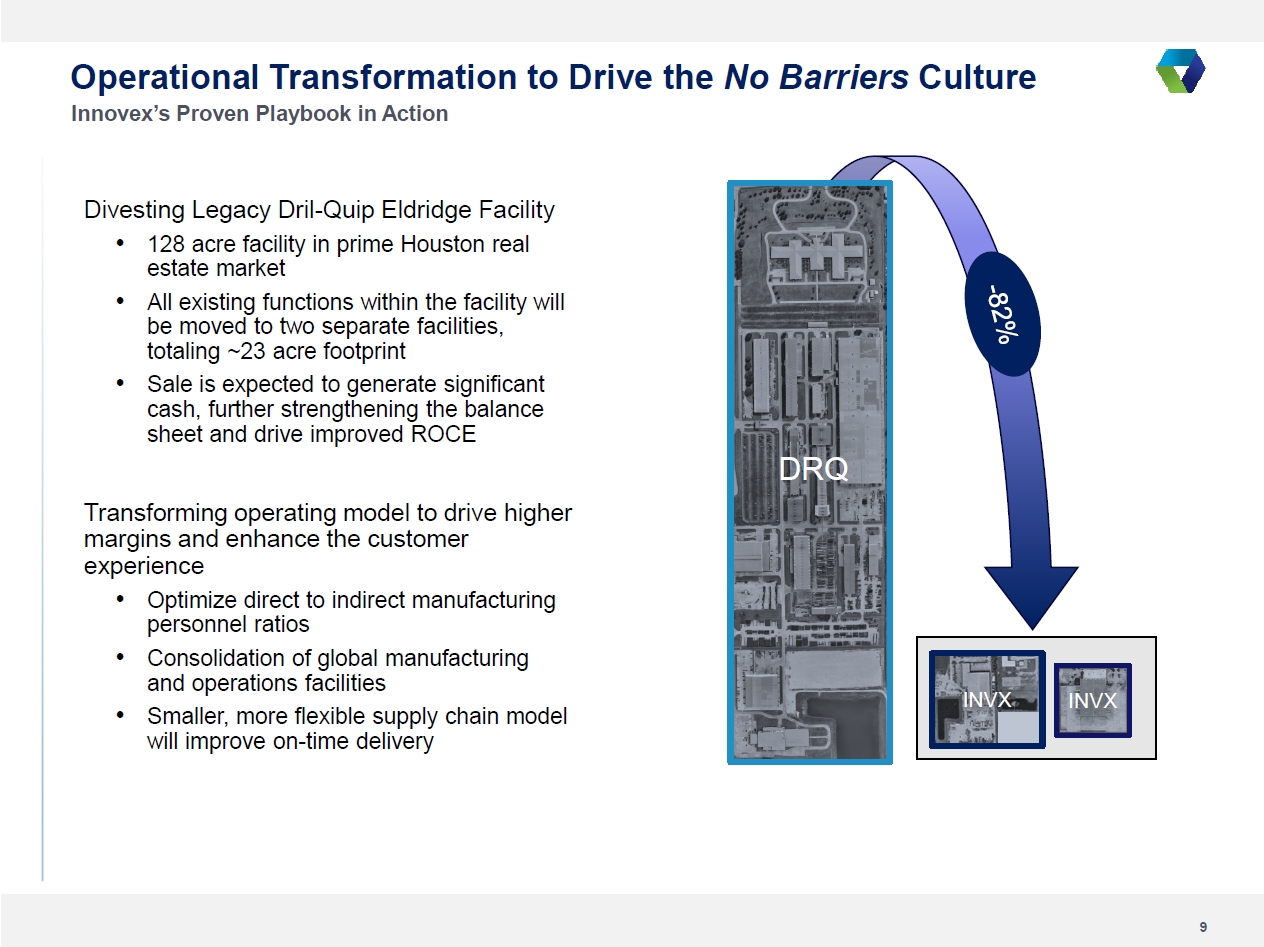
•Announced intended divestiture of Dril-Quip’s 128 acre Eldridge facility, an important step to improve margins, efficiency, and returns on invested capital
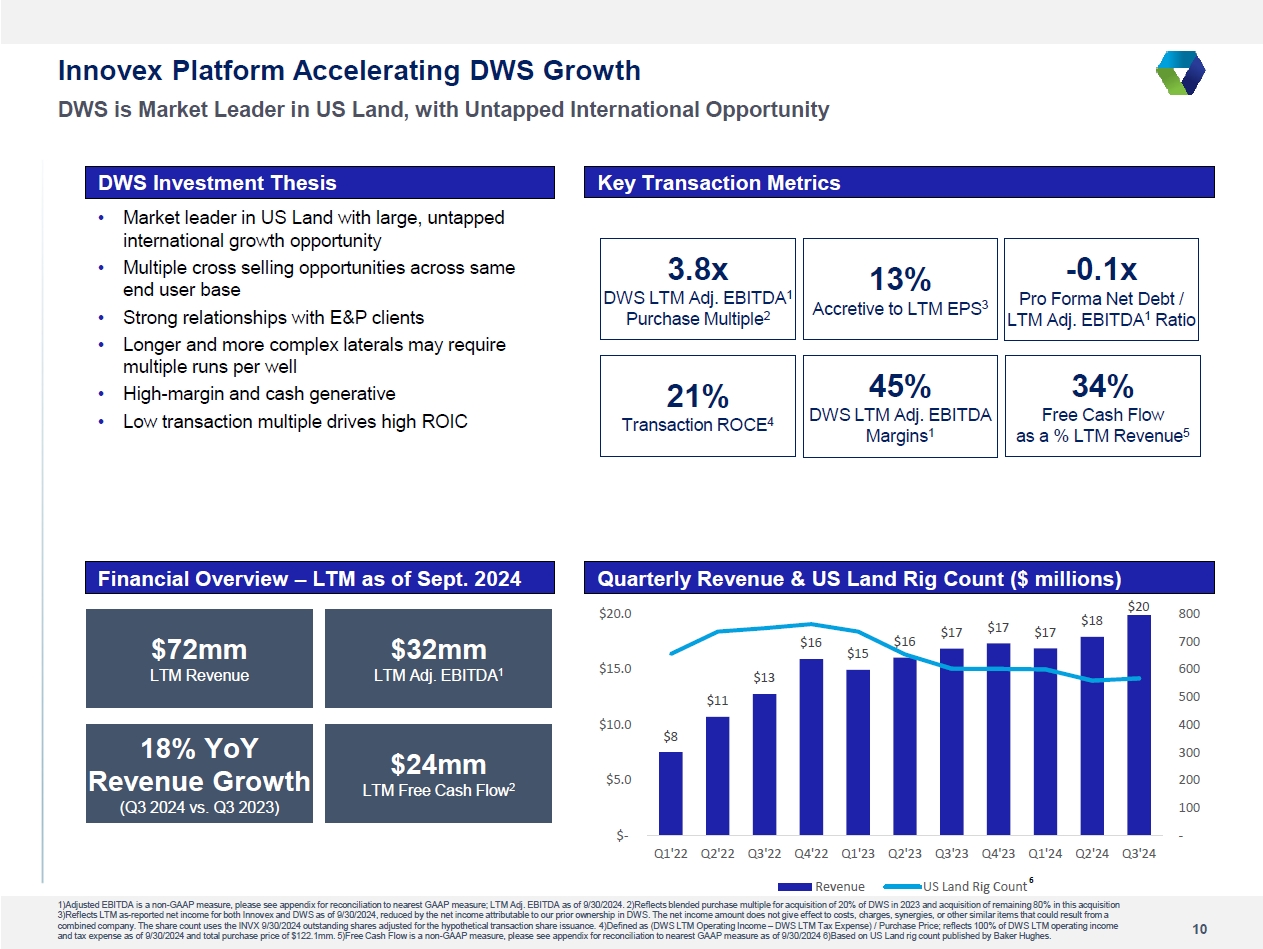
•Acquired Downhole Well Solutions (“DWS”), the US market leader in proprietary drilling optimization tools, with untapped international market growth opportunities
Key Subsequent Events
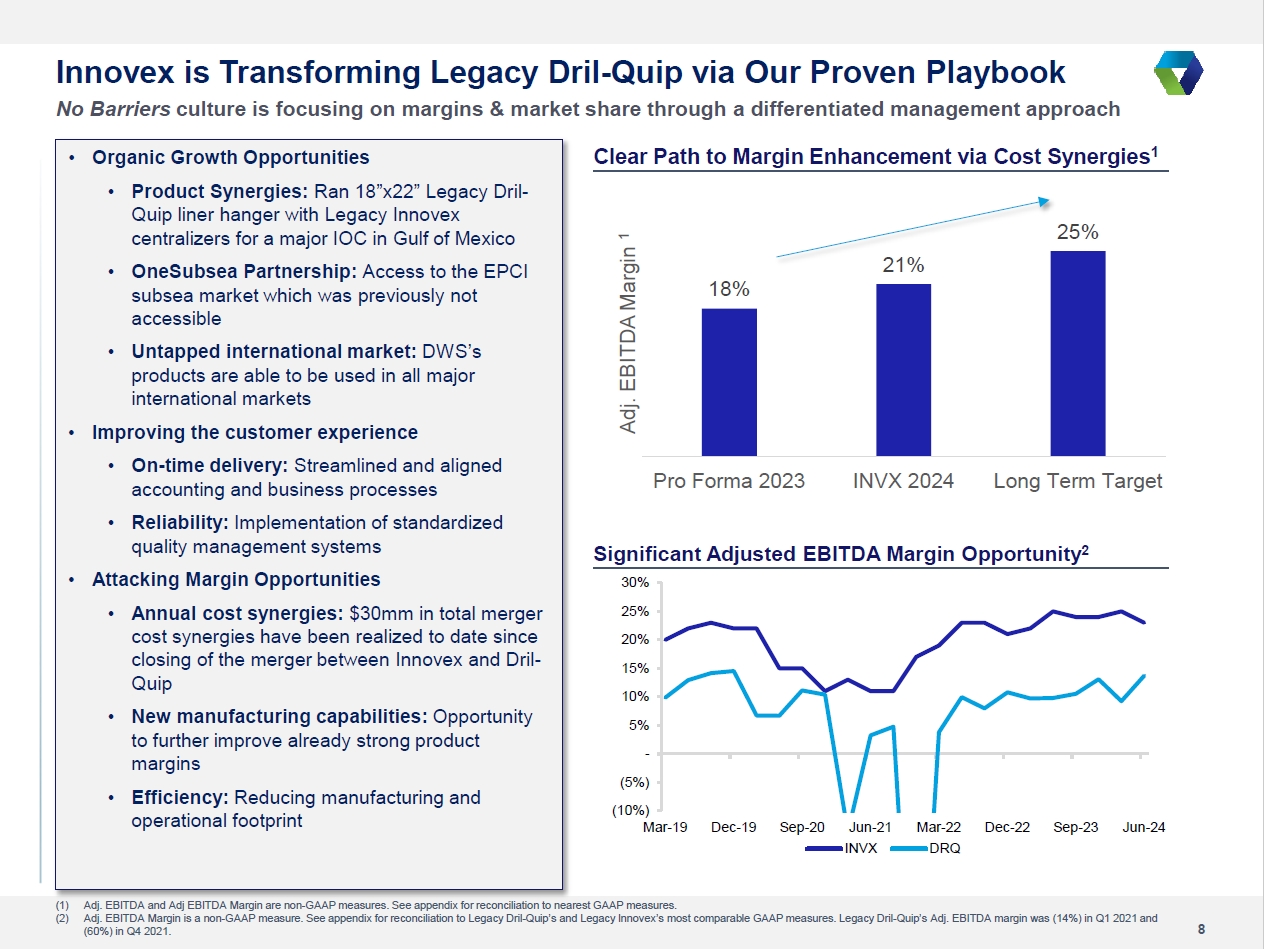
•Fully realized our targeted $30 million of annualized merger cost synergies just five months after closing of the merger between Innovex Downhole Solutions, Inc, and Dril-Quip, Inc.
•Acquired SCF Machining Corp (“SCF”) to further increase margins and supply chain flexibility
•Signed Master Service Agreement with OneSubsea to provide wellheads on Integrated / EPCI contracts
•Announcing $100 million share buyback authorization
(1)Q4 2024 revenue comprised the first full quarter of consolidated Dril-Quip and Innovex financials post-merger, which closed on September 6, 2024
(2)Adjusted EBITDA, Adjusted EBITDA Margin, Free Cash Flow and Return on Capital Employed (“ROCE”) are non-GAAP measures. Reconciliations of Adjusted EBITDA to net income, Adjusted Free Cash Flow to net cash provided by operating activities and ROCE to income from operations, the most directly comparable financial measures presented in accordance with GAAP, are outlined in the reconciliation tables accompanying this release.
Adam Anderson, CEO commented, “This was an outstanding fourth quarter, in which we began to see the results of our operational transformation. While we are still in the early stages, we are encouraged by positive progress on our plans to increase margins, drive organic growth, and elevate the customer experience. Our “No-Barriers” culture, in conjunction with the execution of our proven playbook, is once again yielding positive results for both our customers and our shareholders.”
Kendal Reed, CFO continued, “I am excited to share that we have met our total merger cost synergy target of $30 million in annualized savings much sooner than anticipated. We continue to identify opportunities for further margin enhancement and growth, while maintaining a strong and conservative balance sheet. Our capital-light business model has allowed us to convert a high proportion of our EBITDA to free cash flow.”
Financial Summary
(in thousands)
|
|
|
|
|
|
|
|
|
|
|
|
|
|
|
|
|
|
|
|
|
|
|
Three Months Ended |
|
|
Twelve Months Ended |
|
|
|
December 31,
2024 |
|
|
September 30,
2024 |
|
|
December 31,
2023 |
|
|
December 31,
2024 |
|
|
December 31,
2023 |
|
Revenue |
|
$ |
250,687 |
|
|
$ |
151,817 |
|
|
$ |
133,190 |
|
|
$ |
660,803 |
|
|
$ |
555,539 |
|
Net Income |
|
$ |
31,789 |
|
|
$ |
82,586 |
|
|
$ |
18,448 |
|
|
$ |
140,325 |
|
|
$ |
73,926 |
|
Net Income Margin |
|
|
13 |
% |
|
|
54 |
% |
|
|
14 |
% |
|
|
21 |
% |
|
|
13 |
% |
Adjusted EBITDA (1) |
|
$ |
49,063 |
|
|
$ |
27,411 |
|
|
$ |
32,332 |
|
|
$ |
138,501 |
|
|
$ |
131,754 |
|
Adjusted EBITDA Margin (1) |
|
|
20 |
% |
|
|
18 |
% |
|
|
24 |
% |
|
|
21 |
% |
|
|
24 |
% |
Net cash provided by (used in) operating activities |
|
$ |
36,345 |
|
|
$ |
21,722 |
|
|
$ |
21,385 |
|
|
$ |
93,439 |
|
|
$ |
75,864 |
|
Free Cash Flow (1) |
|
$ |
28,718 |
|
|
$ |
20,051 |
|
|
$ |
20,243 |
|
|
$ |
79,845 |
|
|
$ |
60,377 |
|
Income from operations |
|
$ |
26,912 |
|
|
$ |
(13,218 |
) |
|
$ |
23,302 |
|
|
$ |
49,075 |
|
|
$ |
97,282 |
|
ROCE (1) |
|
nm |
|
|
nm |
|
|
nm |
|
|
|
12 |
% |
|
|
22 |
% |
(1)Adjusted EBITDA, Adjusted EBITDA Margin, Free Cash Flow and Return on Capital Employed (“ROCE”) are non-GAAP financial measures. See definition of these measures and the reconciliation of GAAP to non-GAAP financial measures in the Supplemental Information tables below. Given ROCE is calculated over a 12 month period, ROCE for the three months ended December 31, 2024, September 30, 2024, and December 31, 2023 are not meaningful ("nm") and therefore have been excluded herein.
Operational & Financial Results
Kendal Reed, CFO commented, “We are pleased by the resilience of both our NAM Land and International and Offshore businesses despite the slowdown of activity. We continue to grow our addressable market by increasing our scope of products and entering new geographic regions.
“Highly accretive acquisition targets, such as DWS and SCF, continue to provide high returning opportunities for reinvestment of our strong free cash flow. DWS was able to grow market share in the US Land market over the course of 2024, despite the US Land rig count decreasing by 13% compared to 2023. We remain highly selective and committed to only pursuing opportunities that fit our high-return, capital-light, small ticket/big impact business proposition while never exceeding one turn of EBITDA in leverage. While we continue to see many intriguing opportunities, our board has also authorized a $100 million share buyback program that will provide a competing use of capital to M&A as well as an additional lever to drive higher ROCE and return capital to shareholders.”
Adam Anderson, CEO concluded. “We see numerous opportunities for organic growth through revenue synergies and untapped international markets. We have already begun seeing these opportunities materialize. We recently combined legacy Innovex and legacy Dril-Quip products on a well for a major IOC in the Gulf of Mexico. We have also begun to deploy DWS products in Canada, Latin America, and the Middle East, leveraging Innovex’s global distribution. We anticipate our newly formed partnership with OneSubsea will allow us to grow our market share in subsea wellheads by providing a collaborative EPCI solution that will benefit our customers with increased choice. We continue to focus on improving our margins, enhancing customer experience, and unlocking value for our shareholders.”
Balance Sheet, Debt, Cash Flow & Other
Net cash provided by operating activities was $36 million and capital expenditures were $8 million (approximately 3% of revenue) for the fourth quarter of 2024.
Innovex generated free cash flow of $29 million during the fourth quarter of 2024 and ended the quarter with $73 million of cash and cash equivalents and $35 million of total debt. Innovex’s total debt balance at the end of the quarter represented 0.26x trailing twelve month Adjusted EBITDA, with $78 million of availability under its revolving credit facility.
Innovex believes in maintaining conservative levels of leverage and ample liquidity in order to maximize strategic flexibility and allow the Company to capitalize on M&A opportunities with strong quantitative and qualitative characteristics.
Return on Capital Employed (“ROCE”)
Innovex’s dedication to efficient capital allocation and prudent investment, combined with our capital light business model, enable us to generate strong returns on our invested capital. Income from operations during the fourth quarter of 2024 was $27 million. Return on Capital Employed (“ROCE”) for the twelve months ended 12/31/2024 was 12%. We remain focused on capital efficiency, which we believe is a key driver of sustainable value creation for our shareholders.
Q1 2025 Guidance
Looking to the first quarter of 2025, Innovex expects to generate $245 - $255 million in total revenue, assuming a flat rig count environment in most markets, with weakness in the Mexican market and relatively low deliveries into the US Offshore market. Innovex expects to generate Adjusted EBITDA of $45 - $50 million in the first quarter of 2025.
Conference Call Details
The Company will host a conference call to discuss financial and operational results on Wednesday, February 26, 2024, at 9:00 a.m. Central Time (10:00 a.m. Eastern Time).
The call will be webcast live and can be accessed by the following link:
https://events.q4inc.com/attendee/250443617
Or by phone:
USA / International Toll +1 (646) 307-1963
USA - Toll-Free (800) 715-9871
Conference ID1774704
Participants are encouraged to join the call approximately 10 minutes prior to the start time to ensure a proper connection. A replay of the call will be available on Innovex’s Investor Relations website shortly after the end of the call.
New Share Repurchase Program
On February 25, 2025, our board of directors approved a new share repurchase program (the “New Share Repurchase Program”) that authorizes repurchases of up to an aggregate of $100 million of our outstanding common stock. In connection with the New Share Repurchase Program, all share repurchase plans previously authorized by the Dril-Quip board of directors have been terminated. The New Share Repurchase Program does not require us to repurchase a specific number of shares or have an expiration date. The New Share Repurchase Program may be suspended or discontinued by our board of directors at any time without prior notice. The authorized repurchases will be made from time to time in the open market, through block trades or in privately negotiated transactions. The timing, volume and nature of share repurchases will be at the discretion of our management and dependent on market conditions, applicable securities laws and other factors, and may be suspended or discontinued at any time. The cost of the shares that are repurchased will be funded from any funds of the Company legally available therefore. Any shares repurchased under the program will be cancelled.
About Innovex International, Inc.
Innovex International, Inc (NYSE: INVX) is a Houston-based company established in 2024 following the merger of Dril-Quip, Inc and Innovex Downhole Solutions, Inc.
Our comprehensive portfolio extends throughout the lifecycle of the well, and innovative product integration ensures seamless transitions from one well phase to the next, driving efficiency, lowering cost, and reducing the rig site service footprint for the customer.
With locations throughout North America, Latin America, Europe, the Middle East and Asia, no matter where you need us, our team is readily available with technical expertise, conventional and innovative technologies, and ever-present customer service.
Forward-Looking Statements
Certain statements contained in this press release and oral statements made regarding the matters addressed in this release constitute “forward-looking statements” within the meaning of the Private Securities Litigation Reform Act of 1995. These forward-looking statements are subject to risks, uncertainties and other factors, many of which are outside of Innovex’s control, that could cause actual results to differ materially from the results discussed in the forward-looking statements.
Forward-looking statements can be identified by the use of forward-looking terminology including “may,” “believe,” “expect,” “intend,” “anticipate,” “plan,” “should,” “estimate,” “continue,” “potential,” “will,” “hope” or other similar words and include the Company’s expectation of future performance contained herein. These statements discuss future expectations, contain projections of results of operations or of financial condition, or state other “forward-looking” information. You are cautioned not to place undue reliance on any forward-looking statements, which can be affected by assumptions used or by risks or uncertainties. Consequently, no forward- looking statements can be guaranteed. When considering these forward-looking statements, you should keep in mind the risks related to the merger between Innovex Downhole Solutions, Inc. and Dril-Quip, Inc. (the “Merger”) and the acquisition by Innovex of Downhole Well Solutions, LLC (the “Acquisition”), including the ultimate outcome and results of integrating operations, the effects of the Merger and the Acquisition (including the Company’s future financial condition, results of operations, strategy and plans), potential adverse reactions or changes to business relationships resulting from the completion of the Merger and the Acquisition, expected benefits from the Merger and the Acquisition and the ability of the Company to
realize those benefits, the significant costs required to integrate operations, whether Merger or Acquisition-related litigation will occur and, if so, the results of any litigation, settlements and investigations, the risks related to economic conditions and other factors that might affect the timing and amount of the New Share Repurchase Program and other factors noted in the Company’s Annual Report on Form 10-K, any Quarterly Reports on Form 10-Q and the other documents that the Company files with the Securities and Exchange Commission. The risk factors and other factors noted therein could cause actual results to differ materially from those contained in any forward-looking statement. Innovex disclaims any duty to update and does not intend to update any forward-looking statements, all of which are expressly qualified by the statements in this section, to reflect events or circumstances after the date of this press release, except as may be required by law.
Investor Relations Contact
Avinash Cuddapah
Sr. Director – Investor Relations investors@innovex-inc.com
(346) 398-0000
|
|
|
|
|
|
|
|
|
|
|
|
|
|
|
|
|
|
|
|
|
Innovex International, Inc. |
|
Condensed Consolidated Statements of Operations and Comprehensive Income |
|
(in thousands, except share and per share amounts) |
|
(Unaudited) |
|
|
|
|
|
|
|
|
|
|
|
|
|
|
|
|
|
|
|
Three Months Ended |
|
|
Twelve Months Ended |
|
|
|
December 31,
2024 |
|
|
September 30,
2024 |
|
|
December 31,
2023 |
|
|
December 31,
2024 |
|
|
December 31,
2023 |
|
Revenues |
|
$ |
250,687 |
|
|
$ |
151,817 |
|
|
$ |
133,190 |
|
|
$ |
660,803 |
|
|
$ |
555,539 |
|
|
|
|
|
|
|
|
|
|
|
|
|
|
|
|
|
Cost of revenues |
|
|
165,817 |
|
|
|
99,138 |
|
|
|
84,739 |
|
|
|
428,172 |
|
|
|
360,102 |
|
Selling, general and administrative expenses |
|
|
38,278 |
|
|
|
37,984 |
|
|
|
18,689 |
|
|
|
116,181 |
|
|
|
72,797 |
|
(Gain) loss on sale of assets |
|
|
(167 |
) |
|
|
(169 |
) |
|
|
35 |
|
|
|
(654 |
) |
|
|
106 |
|
Depreciation and amortization |
|
|
12,039 |
|
|
|
7,786 |
|
|
|
6,083 |
|
|
|
31,207 |
|
|
|
22,659 |
|
Impairment of long-lived assets |
|
|
- |
|
|
|
- |
|
|
|
- |
|
|
|
3,522 |
|
|
|
266 |
|
Acquisition costs |
|
|
7,808 |
|
|
|
20,296 |
|
|
|
342 |
|
|
|
33,300 |
|
|
|
2,327 |
|
Income from operations |
|
$ |
26,912 |
|
|
$ |
(13,218 |
) |
|
$ |
23,302 |
|
|
$ |
49,075 |
|
|
$ |
97,282 |
|
|
|
|
|
|
|
|
|
|
|
|
|
|
|
|
|
Interest expense |
|
|
375 |
|
|
|
729 |
|
|
|
792 |
|
|
|
2,430 |
|
|
|
5,506 |
|
Other expense (income), net |
|
|
700 |
|
|
|
(269 |
) |
|
|
483 |
|
|
|
298 |
|
|
|
385 |
|
Equity method earnings |
|
|
(386 |
) |
|
|
(1,018 |
) |
|
|
(1,460 |
) |
|
|
(2,616 |
) |
|
|
(2,975 |
) |
(Gain on) reduction of bargain purchase |
|
|
6,847 |
|
|
|
(92,659 |
) |
|
|
- |
|
|
|
(85,812 |
) |
|
|
- |
|
Gain on consolidation of equity method investment |
|
|
(8,037 |
) |
|
|
- |
|
|
|
- |
|
|
|
(8,037 |
) |
|
|
- |
|
Income before income taxes |
|
$ |
27,413 |
|
|
$ |
79,999 |
|
|
$ |
23,487 |
|
|
$ |
142,812 |
|
|
$ |
94,366 |
|
|
|
|
|
|
|
|
|
|
|
|
|
|
|
|
|
Income tax expense (benefit) |
|
|
(4,376 |
) |
|
|
(2,587 |
) |
|
|
5,039 |
|
|
|
2,487 |
|
|
|
20,440 |
|
Net income |
|
$ |
31,789 |
|
|
$ |
82,586 |
|
|
$ |
18,448 |
|
|
$ |
140,325 |
|
|
$ |
73,926 |
|
Foreign currency translation adjustment |
|
|
(10,607 |
) |
|
|
2,457 |
|
|
|
2,057 |
|
|
|
(10,969 |
) |
|
|
(1,753 |
) |
Comprehensive income |
|
$ |
21,182 |
|
|
$ |
85,043 |
|
|
$ |
20,505 |
|
|
$ |
129,356 |
|
|
$ |
72,173 |
|
|
|
|
|
|
|
|
|
|
|
|
|
|
|
|
|
Earnings per common share |
|
|
|
|
|
|
|
|
|
|
|
|
|
|
|
Basic |
|
$ |
0.47 |
|
|
$ |
2.03 |
|
|
$ |
0.60 |
|
|
$ |
2.82 |
|
|
$ |
2.39 |
|
Diluted |
|
$ |
0.47 |
|
|
$ |
1.99 |
|
|
$ |
0.57 |
|
|
$ |
2.77 |
|
|
$ |
2.29 |
|
Weighted average common shares outstanding |
|
|
|
|
|
|
|
|
|
|
|
|
|
|
|
Basic |
|
|
67,889,524 |
|
|
|
40,728,902 |
|
|
|
30,928,647 |
|
|
|
49,727,093 |
|
|
|
30,928,647 |
|
Diluted |
|
|
68,044,174 |
|
|
|
41,530,978 |
|
|
|
32,239,512 |
|
|
|
50,627,004 |
|
|
|
32,338,518 |
|
|
|
|
|
|
|
|
|
|
|
|
|
|
Innovex International, Inc. |
|
Condensed Consolidated Balance Sheets |
|
(in thousands) |
|
(Unaudited) |
|
|
|
|
|
|
|
|
|
|
|
|
|
|
|
|
|
December 31,
2024 |
|
|
September 30,
2024 |
|
|
December 31,
2023 |
|
Assets |
|
|
|
|
|
|
|
|
|
Current assets |
|
|
|
|
|
|
|
|
|
Cash and restricted cash |
|
$ |
73,278 |
|
|
$ |
99,895 |
|
|
$ |
7,406 |
|
Trade receivables, net |
|
|
239,506 |
|
|
|
225,067 |
|
|
|
118,360 |
|
Inventories |
|
|
271,173 |
|
|
|
297,519 |
|
|
|
141,188 |
|
Other current assets |
|
|
57,434 |
|
|
|
54,851 |
|
|
|
21,318 |
|
Total current assets |
|
|
641,391 |
|
|
|
677,332 |
|
|
|
288,272 |
|
|
|
|
|
|
|
|
|
|
|
Noncurrent assets |
|
|
|
|
|
|
|
|
|
Property and equipment, net |
|
|
190,786 |
|
|
|
182,230 |
|
|
|
52,424 |
|
Equity method investment |
|
|
- |
|
|
|
19,923 |
|
|
|
20,025 |
|
Goodwill and net intangibles |
|
|
168,539 |
|
|
|
59,719 |
|
|
|
65,740 |
|
Right of use leases - operating |
|
|
54,873 |
|
|
|
47,352 |
|
|
|
32,673 |
|
Deferred tax asset, net |
|
|
134,540 |
|
|
|
138,523 |
|
|
|
14,017 |
|
Other long-term assets |
|
|
7,354 |
|
|
|
7,704 |
|
|
|
2,149 |
|
Total noncurrent assets |
|
|
556,092 |
|
|
|
455,451 |
|
|
|
187,028 |
|
|
|
|
|
|
|
|
|
|
|
Total assets |
|
$ |
1,197,483 |
|
|
$ |
1,132,783 |
|
|
$ |
475,300 |
|
|
|
|
|
|
|
|
|
|
|
Liabilities and stockholders’ equity |
|
|
|
|
|
|
|
|
|
Current liabilities |
|
|
|
|
|
|
|
|
|
Accounts payable |
|
$ |
65,201 |
|
|
$ |
83,613 |
|
|
$ |
32,035 |
|
Accrued expenses |
|
|
60,593 |
|
|
|
55,884 |
|
|
|
28,736 |
|
Operating lease liabilities |
|
|
10,547 |
|
|
|
9,093 |
|
|
|
7,358 |
|
Other current liabilities |
|
|
15,850 |
|
|
|
15,520 |
|
|
|
670 |
|
Current portion of long-term debt and finance lease obligations |
|
|
10,467 |
|
|
|
10,695 |
|
|
|
9,824 |
|
Total current liabilities |
|
|
162,658 |
|
|
|
174,805 |
|
|
|
78,623 |
|
|
|
|
|
|
|
|
|
|
|
Noncurrent liabilities |
|
|
|
|
|
|
|
|
|
Long-term debt and finance lease obligations |
|
|
24,901 |
|
|
|
12,351 |
|
|
|
40,566 |
|
Operating lease liabilities |
|
|
45,153 |
|
|
|
39,314 |
|
|
|
27,159 |
|
Other long-term liabilities |
|
|
6,615 |
|
|
|
1,962 |
|
|
|
31 |
|
Total noncurrent liabilities |
|
|
76,669 |
|
|
|
53,627 |
|
|
|
67,756 |
|
Total Liabilities |
|
$ |
239,327 |
|
|
$ |
228,432 |
|
|
$ |
146,379 |
|
|
|
|
|
|
|
|
|
|
|
Total stockholders’ equity |
|
$ |
958,156 |
|
|
$ |
904,351 |
|
|
$ |
328,921 |
|
|
|
|
|
|
|
|
|
|
|
Total liabilities and stockholders’ equity |
|
$ |
1,197,483 |
|
|
$ |
1,132,783 |
|
|
$ |
475,300 |
|
|
|
|
|
|
|
|
|
|
|
|
|
|
|
|
|
|
|
|
|
|
Innovex International, Inc. |
|
Condensed Consolidated Statement of Cash Flows |
|
(in thousands, except share and per share amounts) |
|
(Unaudited) |
|
|
|
|
|
|
|
|
|
|
|
|
|
|
|
|
|
|
|
Three Months Ended |
|
|
Twelve Months Ended |
|
|
|
December 31,
2024 |
|
|
September 30,
2024 |
|
|
December 31,
2023 |
|
|
December 31,
2024 |
|
|
December 31,
2023 |
|
Cash flows from operating activities |
|
|
|
|
|
|
|
|
|
|
|
|
|
|
|
Net income |
|
$ |
31,789 |
|
|
$ |
82,586 |
|
|
$ |
18,448 |
|
|
$ |
140,325 |
|
|
$ |
73,926 |
|
Adjustments to reconcile net income to net cash provided by (used in) operating activities |
|
|
9,782 |
|
|
|
(71,311 |
) |
|
|
11,367 |
|
|
|
(42,185 |
) |
|
|
24,071 |
|
Changes in operating assets and liabilities, net of amounts related to acquisitions |
|
|
(5,226 |
) |
|
|
10,447 |
|
|
|
(8,430 |
) |
|
|
(4,701 |
) |
|
|
(22,133 |
) |
Net cash provided by operating activities |
|
$ |
36,345 |
|
|
$ |
21,722 |
|
|
$ |
21,385 |
|
|
$ |
93,439 |
|
|
$ |
75,864 |
|
|
|
|
|
|
|
|
|
|
|
|
|
|
|
|
|
Cash flows used in investing activities |
|
|
|
|
|
|
|
|
|
|
|
|
|
|
|
Payments on acquisitions, net of cash acquired |
|
$ |
(65,521 |
) |
|
$ |
- |
|
|
$ |
- |
|
|
$ |
(65,521 |
) |
|
$ |
- |
|
Capital expenditures |
|
|
(7,627 |
) |
|
|
(1,671 |
) |
|
|
(1,142 |
) |
|
|
(13,594 |
) |
|
|
(15,487 |
) |
Proceeds from sale of property and equipment |
|
|
1,194 |
|
|
|
1,074 |
|
|
|
322 |
|
|
|
3,247 |
|
|
|
1,410 |
|
Equity method investment |
|
|
- |
|
|
|
- |
|
|
|
- |
|
|
|
- |
|
|
|
(18,350 |
) |
Cash acquired in stock based business combination |
|
|
- |
|
|
|
154,312 |
|
|
|
- |
|
|
|
154,312 |
|
|
|
- |
|
Net cash provided by (used in) investing activities |
|
$ |
(71,954 |
) |
|
$ |
153,715 |
|
|
$ |
(820 |
) |
|
$ |
78,444 |
|
|
$ |
(32,427 |
) |
|
|
|
|
|
|
|
|
|
|
|
|
|
|
|
|
Cash flows provided by financing activities |
|
|
|
|
|
|
|
|
|
|
|
|
|
|
|
Net borrowings (repayments) on line of credit |
|
$ |
14,000 |
|
|
$ |
- |
|
|
$ |
(8,050 |
) |
|
$ |
(9,200 |
) |
|
$ |
(23,800 |
) |
Net repayments on term loan |
|
|
(1,249 |
) |
|
|
(2,533 |
) |
|
|
(1,250 |
) |
|
|
(6,282 |
) |
|
|
(5,400 |
) |
Payments on finance leases |
|
|
(1,561 |
) |
|
|
(1,386 |
) |
|
|
(1,126 |
) |
|
|
(5,698 |
) |
|
|
(3,865 |
) |
Dividend payment |
|
|
- |
|
|
|
(74,983 |
) |
|
|
- |
|
|
|
(74,983 |
) |
|
|
- |
|
Other financing |
|
|
(50 |
) |
|
|
(6,388 |
) |
|
|
(11,107 |
) |
|
|
(6,909 |
) |
|
|
(11,500 |
) |
Net cash provided by (used in) financing activities |
|
$ |
11,140 |
|
|
$ |
(85,290 |
) |
|
$ |
(21,533 |
) |
|
$ |
(103,072 |
) |
|
$ |
(44,565 |
) |
|
|
|
|
|
|
|
|
|
|
|
|
|
|
|
|
Effect of exchange rate changes on cash and cash equivalents |
|
|
(2,148 |
) |
|
|
(608 |
) |
|
|
67 |
|
|
|
(2,939 |
) |
|
|
118 |
|
|
|
|
|
|
|
|
|
|
|
|
|
|
|
|
|
Net change in cash and cash equivalents |
|
$ |
(26,617 |
) |
|
$ |
89,539 |
|
|
$ |
(901 |
) |
|
$ |
65,872 |
|
|
$ |
(1,010 |
) |
Non-GAAP Measures
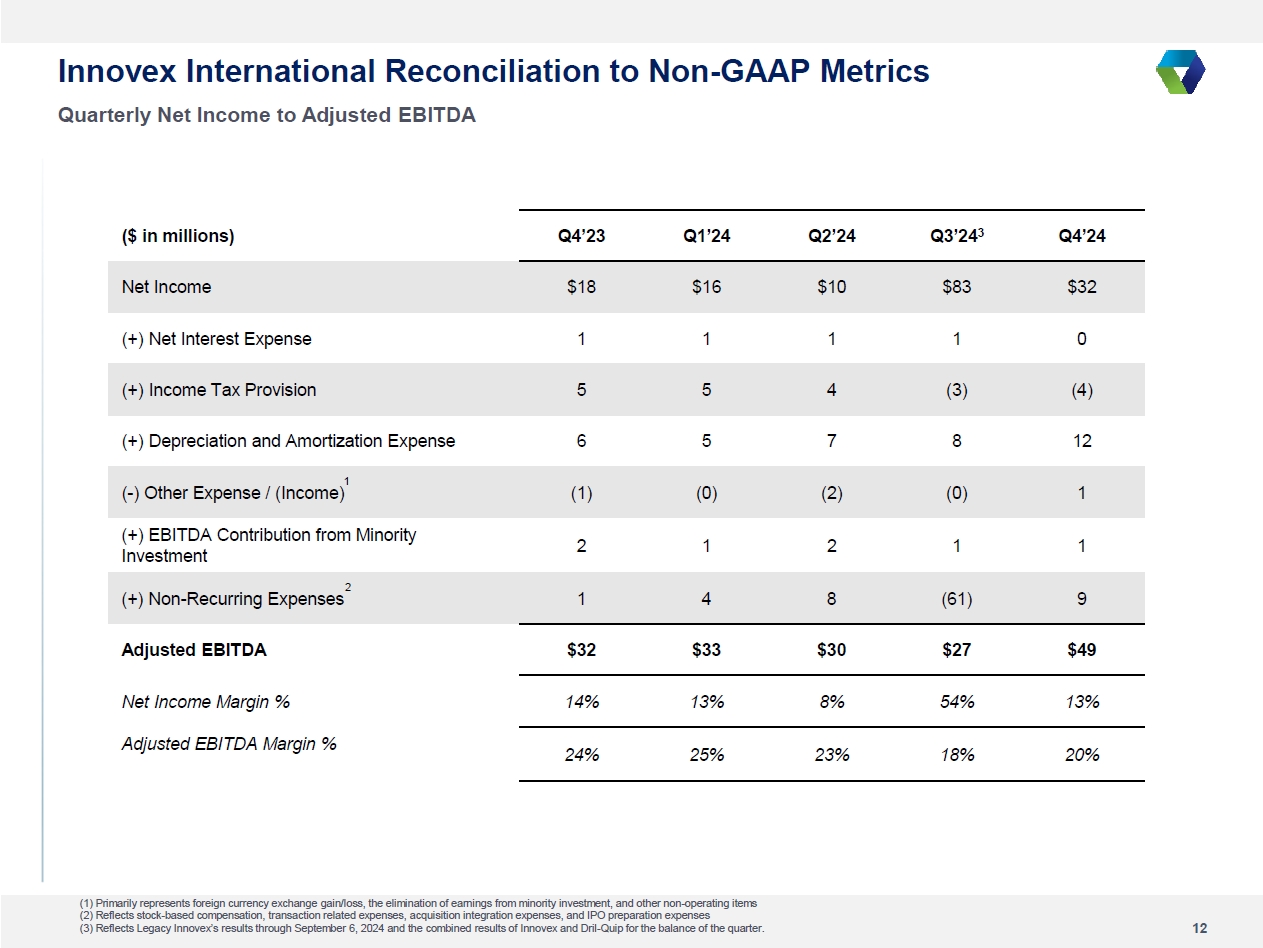
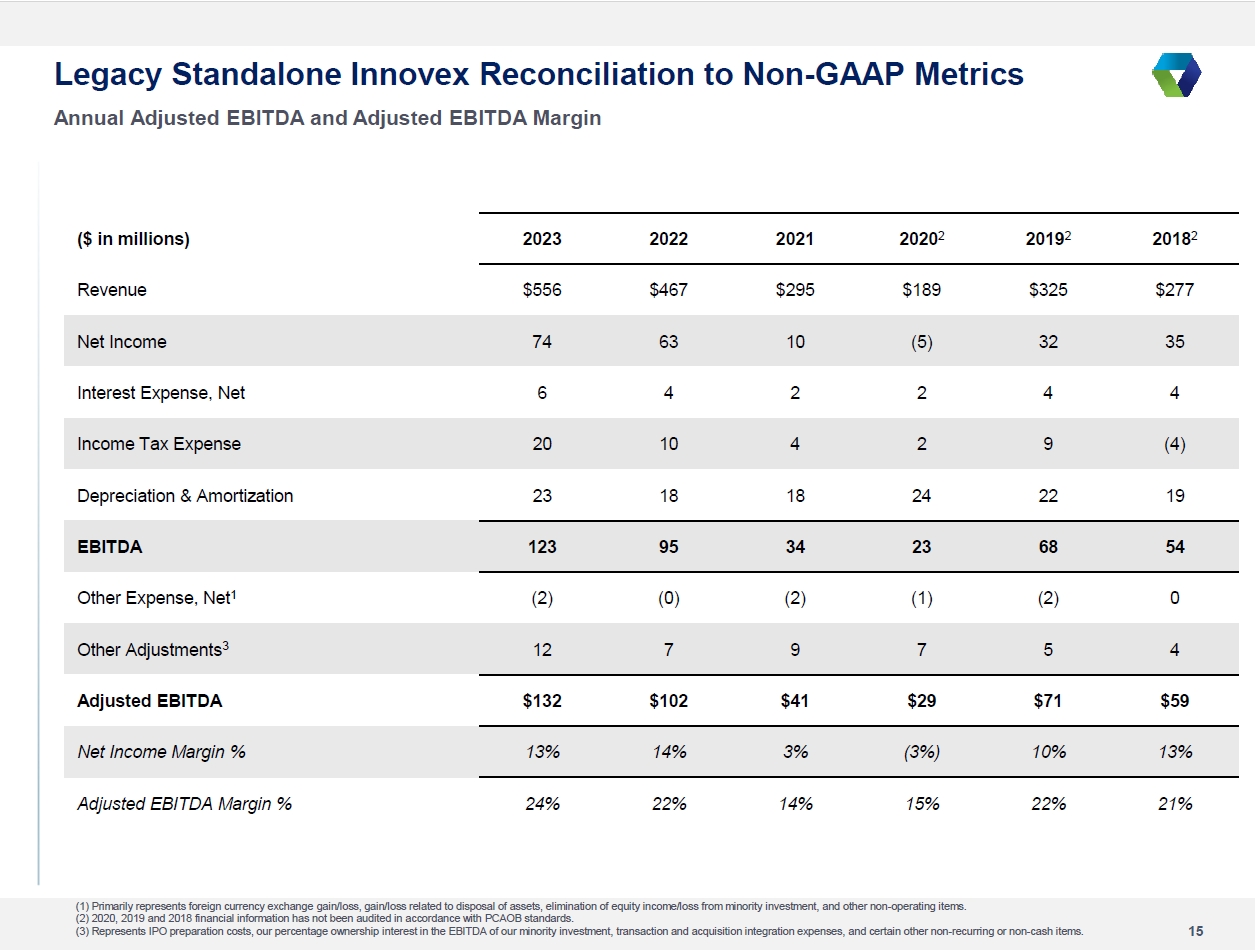
Adjusted EBITDA and Adjusted EBITDA Margin
We define Adjusted EBITDA (a non-GAAP measure) as net income before interest expense, income tax expense, depreciation and amortization, (gain)/loss on sale of assets and other expense, net, further adjusted to exclude certain items which we believe are not reflective of our ongoing performance or which are non-cash in nature. Management uses Adjusted EBITDA to assess the profitability of our business operations and to compare our operating performance to our competitors without regard to the impact of financing methods and capital structure and excluding costs that management believes do not reflect our ongoing operating performance. We track Adjusted EBITDA on an absolute dollar basis and as a percentage of revenue, which we refer to as Adjusted EBITDA Margin.
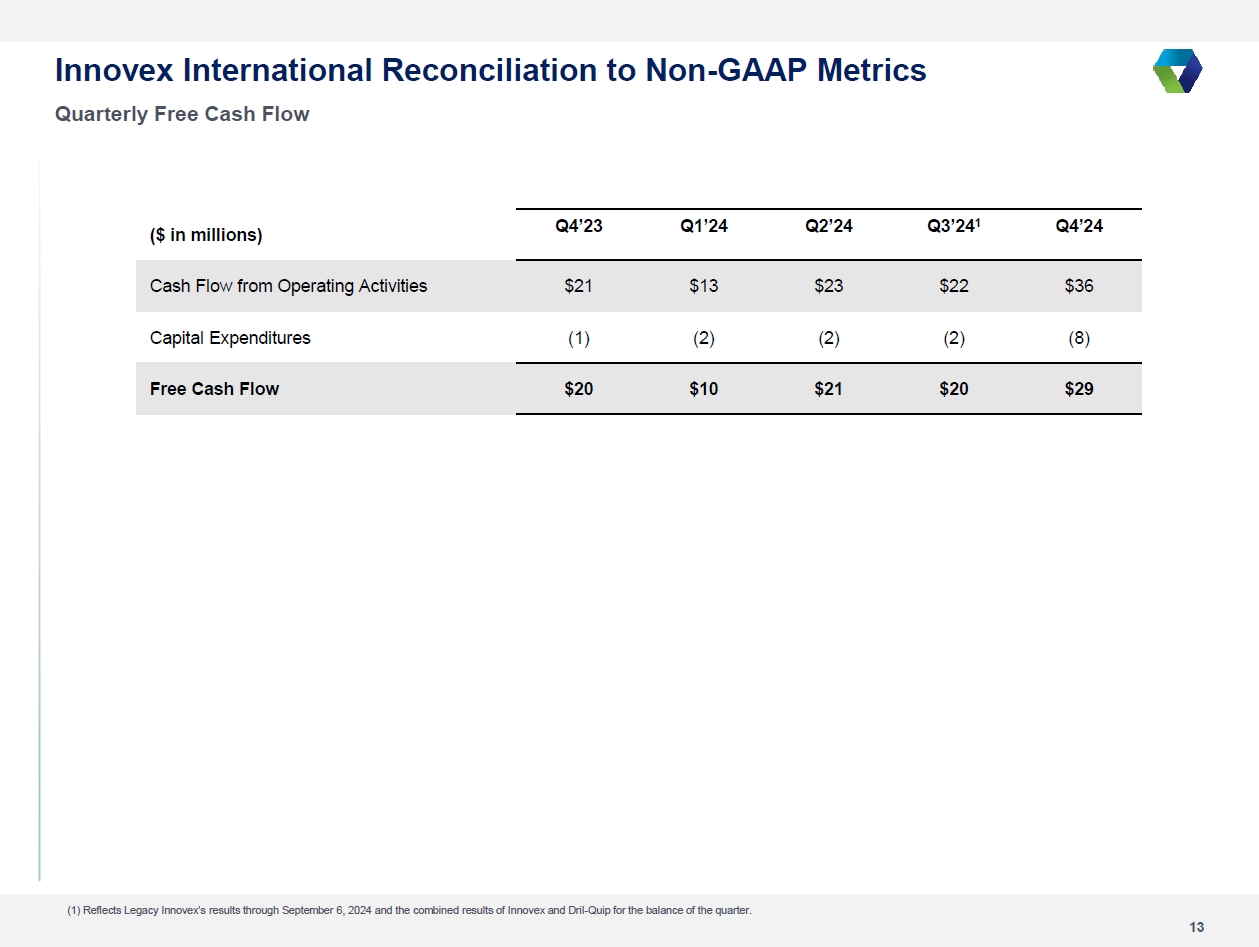
Free Cash Flow
We also utilize Free Cash Flow (a non-GAAP measure) to evaluate the cash generated by our operations and results of operations. We define Free Cash Flow as net cash provided by operating activities less capital expenditures, as presented in our Consolidated Statements of Cash Flows. Management believes Free Cash Flow is useful because it demonstrates the cash that was available in the period that was in excess of our needs to fund our capital expenditures. We track Free Cash Flow both on an absolute dollar basis and as a percentage of revenue. Free Cash Flow does not represent our residual cash flow available for discretionary expenditures, as we have non-discretionary expenditures, including, but not limited to, principal payments required under the terms of our credit facility, which are not deducted in calculating Free Cash Flow.
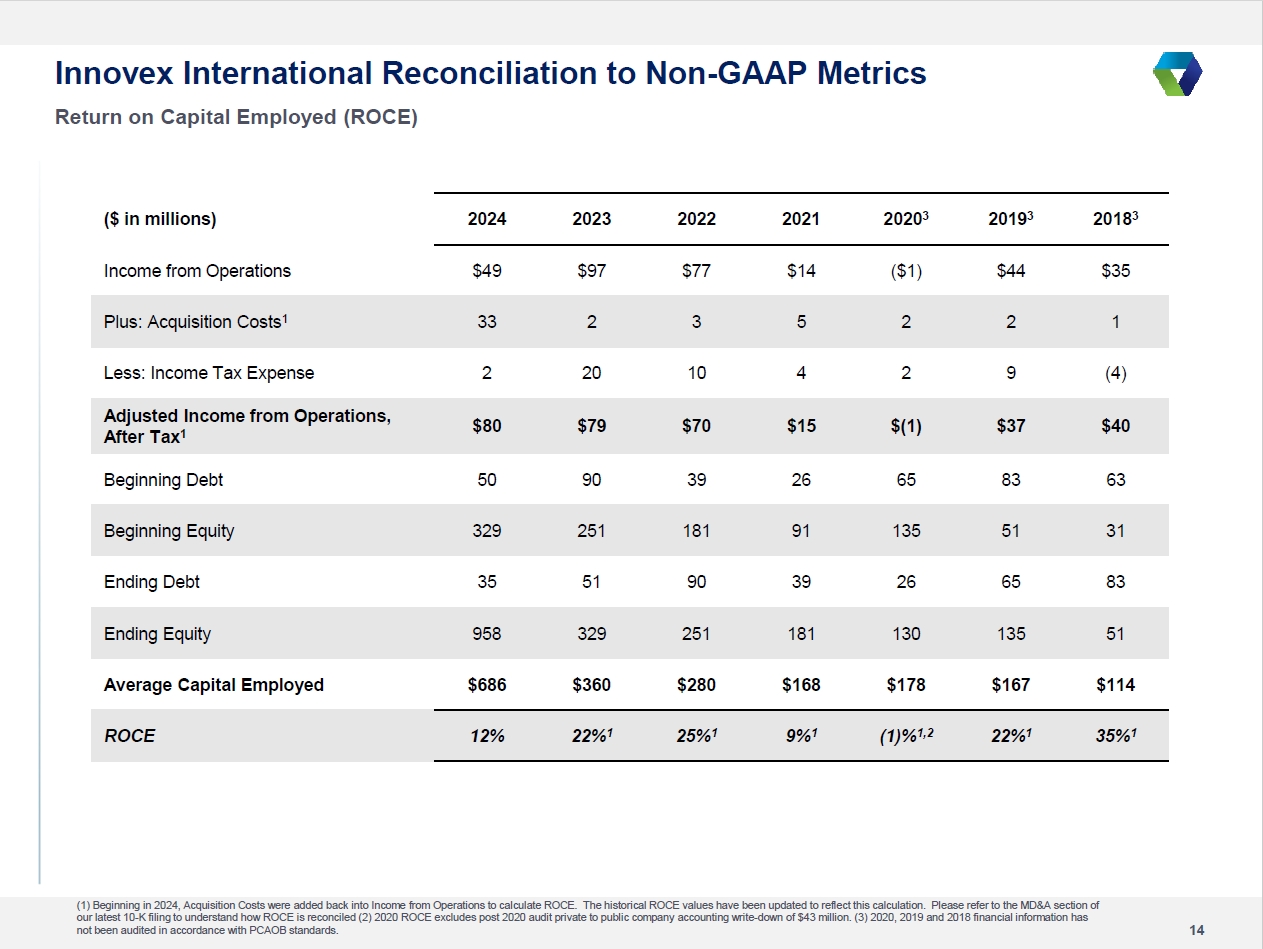
Return on Capital Employed (ROCE)
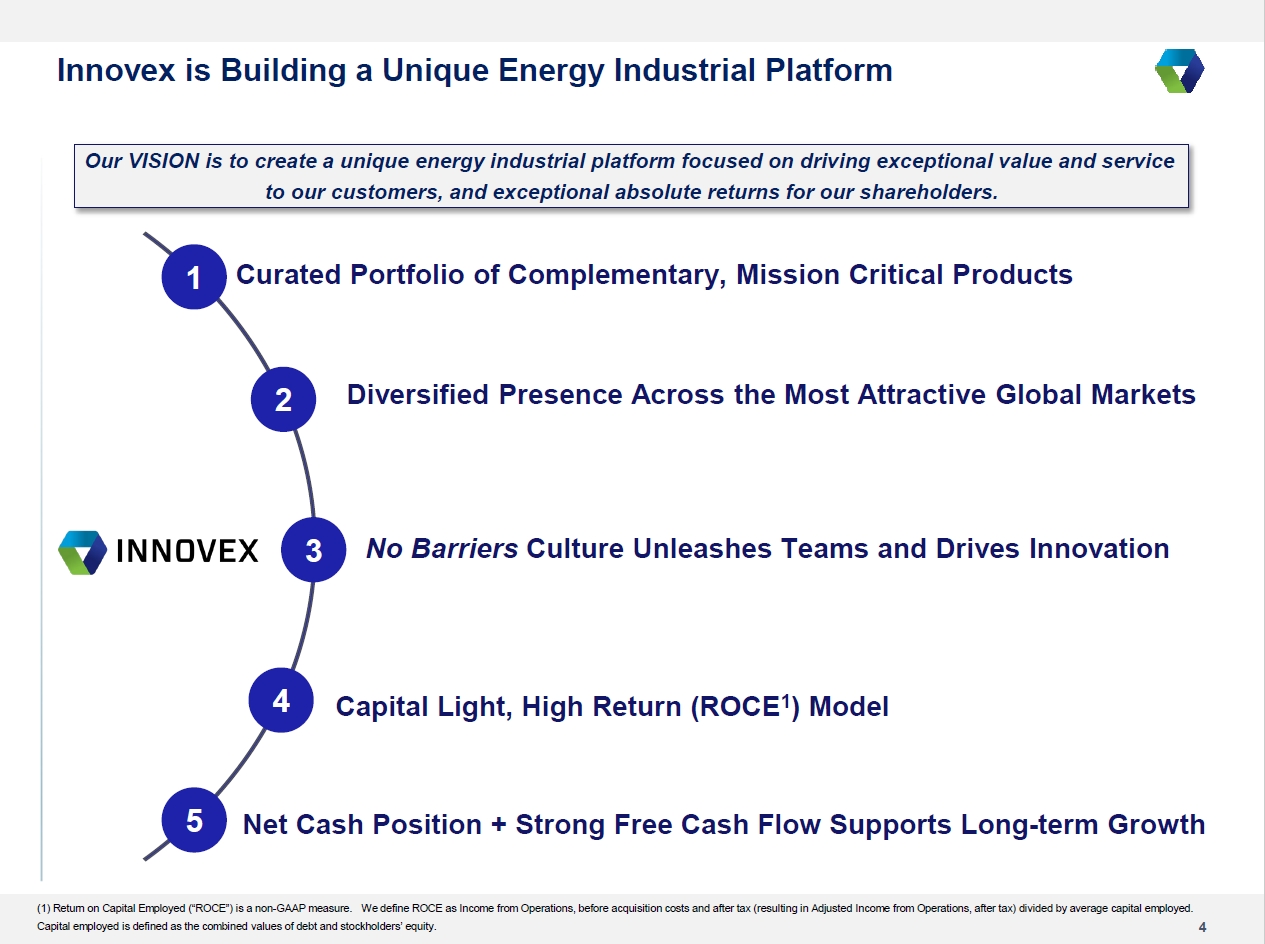
We utilize Return on Capital Employed ("ROCE") (a non-GAAP measure) to assess the effectiveness of our capital allocation over time and to compare our capital efficiency to our competitors. We define ROCE as Income from Operations, before acquisition costs and after tax (resulting in Adjusted Income from Operations, after tax) divided by average capital employed. Capital employed is defined as the combined values of debt and stockholders’ equity.
Adjusted EBITDA, Adjusted EBITDA Margin, Free Cash Flow and ROCE do not represent and should not be considered alternatives to, or more meaningful than, net income and net cash provided by operating activities, or any other measure of financial performance presented in accordance with GAAP as measures of our financial performance. Our computation of Adjusted EBITDA, Free Cash Flow and ROCE may differ from computations of similarly titled measures of other companies. For a reconciliation of these non-GAAP measures to the most directly comparable GAAP measure, see tables below.
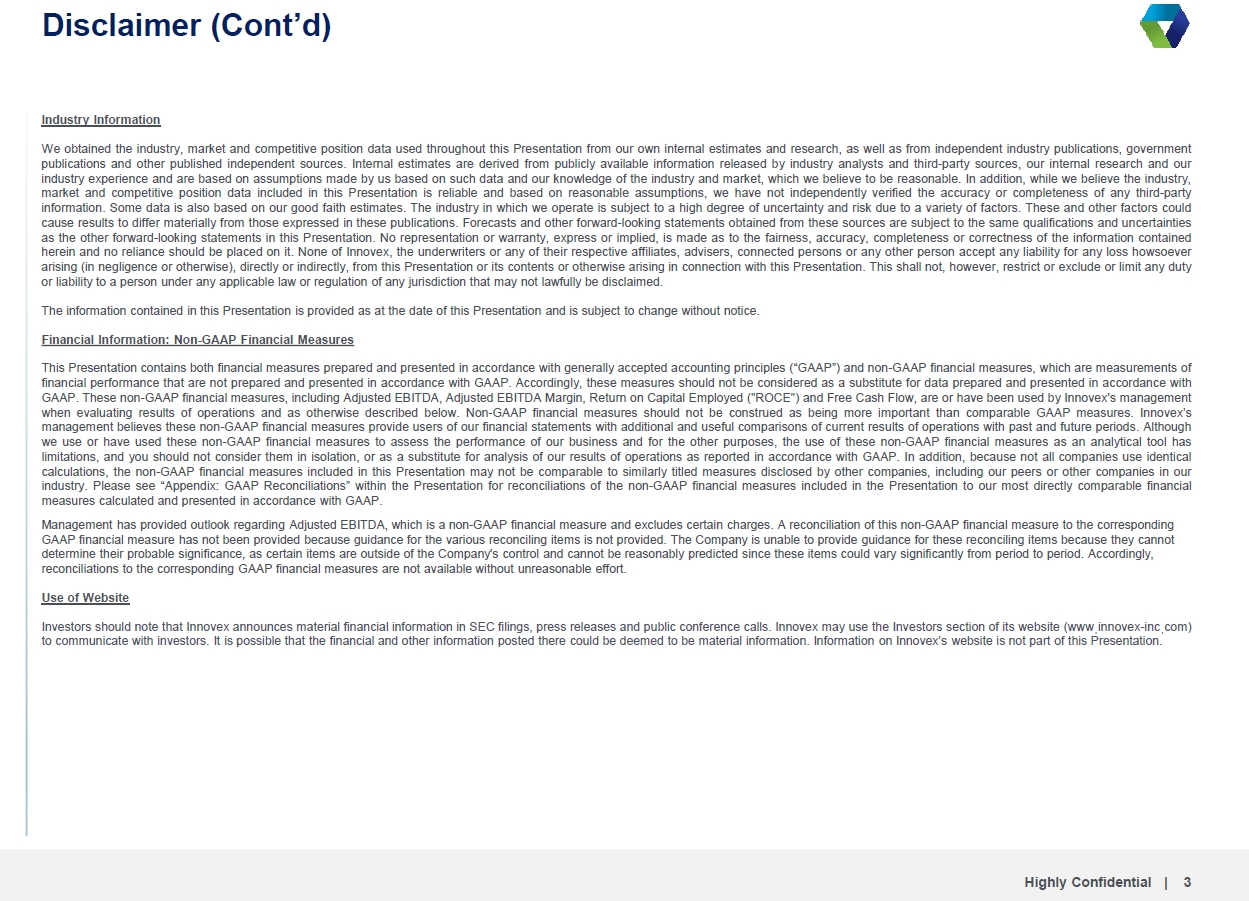
Management has provided outlook regarding Adjusted EBITDA, which is a non-GAAP financial measure and excludes certain charges. A reconciliation of this non-GAAP financial measure to the corresponding GAAP financial measure has not been provided because guidance for the various reconciling items is not provided. The Company is unable to provide guidance for these reconciling items because they cannot determine their probable significance, as certain items are outside of the Company's control and cannot be reasonably predicted since these items could vary significantly from period to period. Accordingly, reconciliations to the corresponding GAAP financial measures are not available without unreasonable effort.
|
|
|
|
|
|
|
|
|
|
|
|
|
|
|
|
|
|
|
|
|
Innovex International, Inc. |
|
Reconciliation of Net Income to Adjusted EBITDA |
|
(in thousands) |
|
(Unaudited) |
|
|
|
|
|
|
|
|
|
|
|
|
|
|
|
|
|
|
|
Three Months Ended |
|
|
Twelve Months Ended |
|
|
|
December 31,
2024 |
|
|
September 30,
2024 |
|
|
December 31,
2023 |
|
|
December 31,
2024 |
|
|
December 31,
2023 |
|
Revenue |
|
$ |
250,687 |
|
|
$ |
151,817 |
|
|
$ |
133,190 |
|
|
$ |
660,803 |
|
|
$ |
555,539 |
|
|
|
|
|
|
|
|
|
|
|
|
|
|
|
|
|
Net income |
|
$ |
31,789 |
|
|
$ |
82,586 |
|
|
$ |
18,448 |
|
|
$ |
140,325 |
|
|
$ |
73,926 |
|
Interest expense |
|
|
375 |
|
|
|
729 |
|
|
|
792 |
|
|
|
2,430 |
|
|
|
5,506 |
|
Income tax expense (benefit) |
|
|
(4,376 |
) |
|
|
(2,587 |
) |
|
|
5,039 |
|
|
|
2,487 |
|
|
|
20,440 |
|
Depreciation and amortization |
|
|
12,039 |
|
|
|
7,786 |
|
|
|
6,083 |
|
|
|
31,207 |
|
|
|
22,659 |
|
EBITDA |
|
$ |
39,827 |
|
|
$ |
88,514 |
|
|
$ |
30,362 |
|
|
$ |
176,449 |
|
|
$ |
122,531 |
|
|
|
|
|
|
|
|
|
|
|
|
|
|
|
|
|
Other non-operating (income) expense, net (1) |
|
|
700 |
|
|
|
(269 |
) |
|
|
483 |
|
|
|
298 |
|
|
|
385 |
|
(Gain) loss on sale of assets |
|
|
(167 |
) |
|
|
(169 |
) |
|
|
35 |
|
|
|
(654 |
) |
|
|
106 |
|
Impairment of long-lived assets |
|
|
- |
|
|
|
- |
|
|
|
- |
|
|
|
3,522 |
|
|
|
266 |
|
Acquisition costs (2) |
|
|
7,808 |
|
|
|
20,296 |
|
|
|
342 |
|
|
|
33,300 |
|
|
|
2,327 |
|
Equity method adjustment (3) |
|
|
661 |
|
|
|
790 |
|
|
|
250 |
|
|
|
3,202 |
|
|
|
1,735 |
|
(Gain on) reduction of bargain purchase |
|
|
6,847 |
|
|
|
(92,659 |
) |
|
|
- |
|
|
|
(85,812 |
) |
|
|
- |
|
Gain on consolidation of equity method investment |
|
|
(8,037 |
) |
|
|
- |
|
|
|
- |
|
|
|
(8,037 |
) |
|
|
- |
|
Stock based compensation |
|
|
1,424 |
|
|
|
10,908 |
|
|
|
470 |
|
|
|
13,248 |
|
|
|
1,962 |
|
IPO preparation expenses (4) |
|
|
- |
|
|
|
- |
|
|
|
390 |
|
|
|
2,985 |
|
|
|
2,442 |
|
Adjusted EBITDA |
|
$ |
49,063 |
|
|
$ |
27,411 |
|
|
$ |
32,332 |
|
|
$ |
138,501 |
|
|
$ |
131,754 |
|
|
|
|
|
|
|
|
|
|
|
|
|
|
|
|
|
Net Income (Loss) % Revenue |
|
|
13 |
% |
|
|
54 |
% |
|
|
14 |
% |
|
|
21 |
% |
|
|
13 |
% |
Adjusted EBITDA Margin |
|
|
20 |
% |
|
|
18 |
% |
|
|
24 |
% |
|
|
21 |
% |
|
|
24 |
% |
(1)Primarily represents foreign currency exchange gain/loss, gain/loss on lease terminations, and other non-operating items.
(2)Consists of legal, accounting, advisory fees, and other integration costs associated with acquisitions, primarily related to Dril-Quip and DWS. These acquisition costs are one-time in nature and represent expenses that we do not view as normal operating expenses necessary to operate our business.
(3)Reflects the elimination of our percentage of interest expense, depreciation, amortization and other non-recurring expenses included within equity method earnings relating to our previously unconsolidated investment in DWS.
(4)Reflects legal, consulting and accounting fees and expenses related to the preparation of Legacy Innovex's initial public offering.
|
|
|
|
|
|
|
|
|
|
|
|
|
Innovex International, Inc. |
|
Reconciliation of Income from Operations to ROCE |
|
(in thousands) |
|
(Unaudited) |
|
|
|
|
|
|
|
|
|
|
|
|
|
Twelve Months Ended |
|
|
|
December 31,
2024 |
|
|
September 30,
2024 |
|
|
December 31,
2023 |
|
Income from operations |
|
$ |
49,075 |
|
|
$ |
45,465 |
|
|
$ |
97,282 |
|
Plus: Acquisition Costs |
|
|
33,300 |
|
|
|
25,834 |
|
|
|
2,327 |
|
Less: Income tax expense |
|
|
(2,487 |
) |
|
|
(11,901 |
) |
|
|
(20,440 |
) |
Adjusted income from operations, after tax |
|
$ |
79,888 |
|
|
$ |
59,398 |
|
|
$ |
79,169 |
|
|
|
|
|
|
|
|
|
|
|
Beginning debt |
|
$ |
50,390 |
|
|
$ |
69,997 |
|
|
$ |
89,119 |
|
Beginning equity |
|
$ |
328,921 |
|
|
$ |
307,946 |
|
|
$ |
251,280 |
|
Ending debt |
|
|
35,368 |
|
|
|
23,046 |
|
|
|
50,390 |
|
Ending equity |
|
|
958,156 |
|
|
|
904,351 |
|
|
|
328,921 |
|
Average capital employed |
|
$ |
686,418 |
|
|
$ |
652,670 |
|
|
$ |
359,855 |
|
|
|
|
|
|
|
|
|
|
|
ROCE |
|
|
12 |
% |
|
|
9 |
% |
|
|
22 |
% |
|
|
|
|
|
|
|
|
|
|
|
|
|
|
|
|
|
|
|
|
|
Innovex International, Inc. |
|
Reconciliation of Net Cash from Operations to Free Cash Flow |
|
(in thousands) |
|
(Unaudited) |
|
|
|
|
|
|
|
|
|
|
|
|
|
|
|
|
|
|
|
Three Months Ended |
|
|
Twelve Months Ended |
|
|
|
December 31,
2024 |
|
|
September 30,
2024 |
|
|
December 31,
2023 |
|
|
December 31,
2024 |
|
|
December 31,
2023 |
|
Net cash provided by (used in) operating activities |
|
$ |
36,345 |
|
|
$ |
21,722 |
|
|
$ |
21,385 |
|
|
$ |
93,439 |
|
|
$ |
75,864 |
|
Capital expenditures |
|
|
(7,627 |
) |
|
|
(1,671 |
) |
|
|
(1,142 |
) |
|
|
(13,594 |
) |
|
|
(15,487 |
) |
Free Cash Flow |
|
$ |
28,718 |
|
|
$ |
20,051 |
|
|
$ |
20,243 |
|
|
$ |
79,845 |
|
|
$ |
60,377 |
|
|
|
|
|
|
|
|
|
|
|
|
|
|
|
|
|
|
|
|
|
|
Innovex International, Inc. |
|
Geographic Revenue Details |
|
(in thousands) |
|
(Unaudited) |
|
|
|
|
|
|
|
|
|
|
|
|
|
|
|
|
|
|
|
Three Months Ended |
|
|
Twelve Months Ended |
|
|
|
December 31,
2024 |
|
|
September 30,
2024 |
|
|
December 31,
2023 |
|
|
December 31,
2024 |
|
|
December 31,
2023 |
|
North America Onshore ("NAM") |
|
|
|
|
|
|
|
|
|
|
|
|
|
|
|
Product revenues |
|
$ |
75,397 |
|
|
$ |
79,668 |
|
|
$ |
68,275 |
|
|
$ |
286,802 |
|
|
$ |
297,176 |
|
Rental revenues |
|
|
10,123 |
|
|
|
5,228 |
|
|
|
2,150 |
|
|
|
19,305 |
|
|
|
10,839 |
|
Service revenues |
|
|
17,254 |
|
|
|
13,411 |
|
|
|
14,923 |
|
|
|
54,952 |
|
|
|
58,100 |
|
Revenue - North America Onshore |
|
$ |
102,774 |
|
|
$ |
98,307 |
|
|
$ |
85,348 |
|
|
$ |
361,059 |
|
|
$ |
366,115 |
|
|
|
|
|
|
|
|
|
|
|
|
|
|
|
|
|
International & Offshore |
|
|
|
|
|
|
|
|
|
|
|
|
|
|
|
Product revenues |
|
$ |
108,675 |
|
|
$ |
46,975 |
|
|
$ |
39,363 |
|
|
$ |
240,592 |
|
|
$ |
163,626 |
|
Rental revenues |
|
|
17,039 |
|
|
|
4,172 |
|
|
|
6,614 |
|
|
|
30,977 |
|
|
|
20,507 |
|
Service revenues |
|
|
22,199 |
|
|
|
2,363 |
|
|
|
1,865 |
|
|
|
28,175 |
|
|
|
5,291 |
|
Revenue - International & Offshore |
|
$ |
147,913 |
|
|
$ |
53,510 |
|
|
$ |
47,842 |
|
|
$ |
299,744 |
|
|
$ |
189,424 |
|
|
|
|
|
|
|
|
|
|
|
|
|
|
|
|
|
Total Revenue |
|
$ |
250,687 |
|
|
$ |
151,817 |
|
|
$ |
133,190 |
|
|
$ |
660,803 |
|
|
$ |
555,539 |
|

v3.25.0.1
| X |
- DefinitionBoolean flag that is true when the XBRL content amends previously-filed or accepted submission.
| Name: |
dei_AmendmentFlag |
| Namespace Prefix: |
dei_ |
| Data Type: |
xbrli:booleanItemType |
| Balance Type: |
na |
| Period Type: |
duration |
|
| X |
- DefinitionFor the EDGAR submission types of Form 8-K: the date of the report, the date of the earliest event reported; for the EDGAR submission types of Form N-1A: the filing date; for all other submission types: the end of the reporting or transition period. The format of the date is YYYY-MM-DD.
| Name: |
dei_DocumentPeriodEndDate |
| Namespace Prefix: |
dei_ |
| Data Type: |
xbrli:dateItemType |
| Balance Type: |
na |
| Period Type: |
duration |
|
| X |
- DefinitionThe type of document being provided (such as 10-K, 10-Q, 485BPOS, etc). The document type is limited to the same value as the supporting SEC submission type, or the word 'Other'.
| Name: |
dei_DocumentType |
| Namespace Prefix: |
dei_ |
| Data Type: |
dei:submissionTypeItemType |
| Balance Type: |
na |
| Period Type: |
duration |
|
| X |
- DefinitionAddress Line 1 such as Attn, Building Name, Street Name
| Name: |
dei_EntityAddressAddressLine1 |
| Namespace Prefix: |
dei_ |
| Data Type: |
xbrli:normalizedStringItemType |
| Balance Type: |
na |
| Period Type: |
duration |
|
| X |
- Definition
+ References
+ Details
| Name: |
dei_EntityAddressCityOrTown |
| Namespace Prefix: |
dei_ |
| Data Type: |
xbrli:normalizedStringItemType |
| Balance Type: |
na |
| Period Type: |
duration |
|
| X |
- DefinitionCode for the postal or zip code
| Name: |
dei_EntityAddressPostalZipCode |
| Namespace Prefix: |
dei_ |
| Data Type: |
xbrli:normalizedStringItemType |
| Balance Type: |
na |
| Period Type: |
duration |
|
| X |
- DefinitionName of the state or province.
| Name: |
dei_EntityAddressStateOrProvince |
| Namespace Prefix: |
dei_ |
| Data Type: |
dei:stateOrProvinceItemType |
| Balance Type: |
na |
| Period Type: |
duration |
|
| X |
- DefinitionA unique 10-digit SEC-issued value to identify entities that have filed disclosures with the SEC. It is commonly abbreviated as CIK. Reference 1: http://www.xbrl.org/2003/role/presentationRef
-Publisher SEC
-Name Exchange Act
-Number 240
-Section 12
-Subsection b-2
| Name: |
dei_EntityCentralIndexKey |
| Namespace Prefix: |
dei_ |
| Data Type: |
dei:centralIndexKeyItemType |
| Balance Type: |
na |
| Period Type: |
duration |
|
| X |
- DefinitionIndicate if registrant meets the emerging growth company criteria. Reference 1: http://www.xbrl.org/2003/role/presentationRef
-Publisher SEC
-Name Exchange Act
-Number 240
-Section 12
-Subsection b-2
| Name: |
dei_EntityEmergingGrowthCompany |
| Namespace Prefix: |
dei_ |
| Data Type: |
xbrli:booleanItemType |
| Balance Type: |
na |
| Period Type: |
duration |
|
| X |
- DefinitionCommission file number. The field allows up to 17 characters. The prefix may contain 1-3 digits, the sequence number may contain 1-8 digits, the optional suffix may contain 1-4 characters, and the fields are separated with a hyphen.
| Name: |
dei_EntityFileNumber |
| Namespace Prefix: |
dei_ |
| Data Type: |
dei:fileNumberItemType |
| Balance Type: |
na |
| Period Type: |
duration |
|
| X |
- DefinitionTwo-character EDGAR code representing the state or country of incorporation.
| Name: |
dei_EntityIncorporationStateCountryCode |
| Namespace Prefix: |
dei_ |
| Data Type: |
dei:edgarStateCountryItemType |
| Balance Type: |
na |
| Period Type: |
duration |
|
| X |
- DefinitionThe exact name of the entity filing the report as specified in its charter, which is required by forms filed with the SEC. Reference 1: http://www.xbrl.org/2003/role/presentationRef
-Publisher SEC
-Name Exchange Act
-Number 240
-Section 12
-Subsection b-2
| Name: |
dei_EntityRegistrantName |
| Namespace Prefix: |
dei_ |
| Data Type: |
xbrli:normalizedStringItemType |
| Balance Type: |
na |
| Period Type: |
duration |
|
| X |
- DefinitionThe Tax Identification Number (TIN), also known as an Employer Identification Number (EIN), is a unique 9-digit value assigned by the IRS. Reference 1: http://www.xbrl.org/2003/role/presentationRef
-Publisher SEC
-Name Exchange Act
-Number 240
-Section 12
-Subsection b-2
| Name: |
dei_EntityTaxIdentificationNumber |
| Namespace Prefix: |
dei_ |
| Data Type: |
dei:employerIdItemType |
| Balance Type: |
na |
| Period Type: |
duration |
|
| X |
- DefinitionLocal phone number for entity.
| Name: |
dei_LocalPhoneNumber |
| Namespace Prefix: |
dei_ |
| Data Type: |
xbrli:normalizedStringItemType |
| Balance Type: |
na |
| Period Type: |
duration |
|
| X |
- DefinitionBoolean flag that is true when the Form 8-K filing is intended to satisfy the filing obligation of the registrant as pre-commencement communications pursuant to Rule 13e-4(c) under the Exchange Act. Reference 1: http://www.xbrl.org/2003/role/presentationRef
-Publisher SEC
-Name Exchange Act
-Number 240
-Section 13e
-Subsection 4c
| Name: |
dei_PreCommencementIssuerTenderOffer |
| Namespace Prefix: |
dei_ |
| Data Type: |
xbrli:booleanItemType |
| Balance Type: |
na |
| Period Type: |
duration |
|
| X |
- DefinitionBoolean flag that is true when the Form 8-K filing is intended to satisfy the filing obligation of the registrant as pre-commencement communications pursuant to Rule 14d-2(b) under the Exchange Act. Reference 1: http://www.xbrl.org/2003/role/presentationRef
-Publisher SEC
-Name Exchange Act
-Number 240
-Section 14d
-Subsection 2b
| Name: |
dei_PreCommencementTenderOffer |
| Namespace Prefix: |
dei_ |
| Data Type: |
xbrli:booleanItemType |
| Balance Type: |
na |
| Period Type: |
duration |
|
| X |
- DefinitionTitle of a 12(b) registered security. Reference 1: http://www.xbrl.org/2003/role/presentationRef
-Publisher SEC
-Name Exchange Act
-Number 240
-Section 12
-Subsection b
| Name: |
dei_Security12bTitle |
| Namespace Prefix: |
dei_ |
| Data Type: |
dei:securityTitleItemType |
| Balance Type: |
na |
| Period Type: |
duration |
|
| X |
- DefinitionName of the Exchange on which a security is registered. Reference 1: http://www.xbrl.org/2003/role/presentationRef
-Publisher SEC
-Name Exchange Act
-Number 240
-Section 12
-Subsection d1-1
| Name: |
dei_SecurityExchangeName |
| Namespace Prefix: |
dei_ |
| Data Type: |
dei:edgarExchangeCodeItemType |
| Balance Type: |
na |
| Period Type: |
duration |
|
| X |
- DefinitionBoolean flag that is true when the Form 8-K filing is intended to satisfy the filing obligation of the registrant as soliciting material pursuant to Rule 14a-12 under the Exchange Act. Reference 1: http://www.xbrl.org/2003/role/presentationRef
-Publisher SEC
-Name Exchange Act
-Number 240
-Section 14a
-Subsection 12
| Name: |
dei_SolicitingMaterial |
| Namespace Prefix: |
dei_ |
| Data Type: |
xbrli:booleanItemType |
| Balance Type: |
na |
| Period Type: |
duration |
|
| X |
- DefinitionTrading symbol of an instrument as listed on an exchange.
| Name: |
dei_TradingSymbol |
| Namespace Prefix: |
dei_ |
| Data Type: |
dei:tradingSymbolItemType |
| Balance Type: |
na |
| Period Type: |
duration |
|
| X |
- DefinitionBoolean flag that is true when the Form 8-K filing is intended to satisfy the filing obligation of the registrant as written communications pursuant to Rule 425 under the Securities Act. Reference 1: http://www.xbrl.org/2003/role/presentationRef
-Publisher SEC
-Name Securities Act
-Number 230
-Section 425
| Name: |
dei_WrittenCommunications |
| Namespace Prefix: |
dei_ |
| Data Type: |
xbrli:booleanItemType |
| Balance Type: |
na |
| Period Type: |
duration |
|
Innovex (NYSE:INVX)
Gráfico Histórico do Ativo
De Jan 2025 até Fev 2025

Innovex (NYSE:INVX)
Gráfico Histórico do Ativo
De Fev 2024 até Fev 2025

