This Quarterly Bitcoin Signal Suggests A Big Move Is Coming In March
07 Março 2023 - 9:37PM
NEWSBTC
Bitcoin price action has historically been abysmal in March.
Although seasonality suggests not to expect very much this month, a
quarterly bullish crossover could result in a massive move up
before the month is over. Bitcoin Quarterly Recurrence Points
To More Upside While the market panics as Bitcoin clings onto
$22,000, higher timeframe signals could be pointing to a surprise
to the upside before the month ends. In technical analysis,
the higher the timeframe, the more dominant the signal. Put more
simply, monthly charts trump weekly charts which are more important
than daily charts. Related Reading: Bitcoin Bullish Crossover
That Last Brought 1,000% ROI Is Back Quarterly charts are often
ignored because little action takes place for a full 90 days. Three
months pass between open and close, leaving a long time for market
conditions to change and candle to develop. This also means signals
fire less often, but are much more meaningful. Which is why the
latest signal on the Bitcoin quarterly chart is so significant. The
3-month candle could have more to climb | BTCUSD on TradingView.com
Stochastic Suggests The Beginning Of A Bigger Recovery Originally
spotted by market psychology coach Christopher Inks, the 3M
Stochastic has crossed bullish after touching down on oversold
conditions. In past instances, this resulted in a massive bullish
candle — much larger than what has developed in Q1 2023 thus
far. Bitcoin is barely holding onto 30% of a 50% rebound from
lows. Previous examples of this signal resulted in rallies of 117%
and 246% the two times the crossover occurred. More importantly,
each explosive quarterly candle kicked off two years of bull
market, with the lows of the quarterly candle never retested
again. Related Reading: This Fractal Suggests Bitcoin Price
Could Nearly Double In 30 Days Bulls aren’t completely safe,
despite the powerful signal of a possible trend change. Crossing
bearish historically results in an equally powerful down candle,
which could cripple any chance of a recovery a while longer. Such a
scenario has never happened before, but isn’t impossible. How
March closes means a lot more than just the monthly, it also means
the fate of the quarterly close and possibly the confirmation of a
new trend. Follow @TonyTheBullBTC on Twitter or join the
TonyTradesBTC Telegram for exclusive daily market insights and
technical analysis education. Please note: Content
is educational and should not be considered investment
advice. Featured image from iStockPhoto, Charts from
TradingView.com
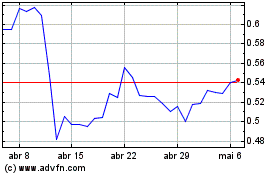
Ripple (COIN:XRPUSD)
Gráfico Histórico do Ativo
De Mar 2024 até Abr 2024

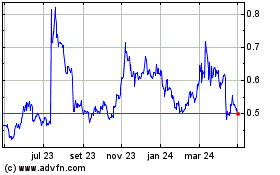
Ripple (COIN:XRPUSD)
Gráfico Histórico do Ativo
De Abr 2023 até Abr 2024
