Bitcoin Falls Below $25,000 As Whales Show Elevated Activity
15 Março 2023 - 11:30AM
NEWSBTC
Bitcoin has fallen below the $25,000 level during the past day as
on-chain data shows signs of elevated activity from the whales.
Bitcoin Whale Transaction Count Has Shot Up Recently According to
data from the on-chain analytics firm Santiment, whale activity
surged to the highest level in four months yesterday. The relevant
indicator here is the “whale transaction count,” which measures the
total amount of transfers taking place on the Bitcoin blockchain
that are worth at least $1 million in value. When the value of this
metric is high, it means a large number of whale transactions are
occurring on the network right now. Such a trend shows that these
humongous holders have an active interest in trading the
cryptocurrency currently. Since the sheer scale of coins involved
in whale transactions can be quite large, a sizeable number of them
happening at once can cause noticeable ripples in the price of the
asset. Because of this reason, high whale transaction count values
can foreshadow high volatility for the asset in the near term. On
the other hand, when the indicator has low values, it means whales
aren’t showing much activity at the moment, and thus, they may not
have too much interest in BTC. Naturally, this kind of trend can
precede a calmer market. Related Reading: Bitcoin Price Corrects
Sharply But This Support Might Spark Another Increase Now, here is
a chart that shows the trend in the Bitcoin whale transaction
counts over the last few months: The value of the metric seems to
have been quite high in recent days | Source: Santiment on Twitter
As shown in the above graph, the Bitcoin whale transaction count
observed a big boost in its value as the latest surge in the price
of the cryptocurrency took shape. The indicator’s value hit the
highest value since November 2022, about four months ago, as the
BTC price peaked around the $26,500 level, a 9-month high for the
asset. Related Reading: Bitcoin Forms Bump And Run Reversal Bottom,
Target Is Over $100,000 As the whale transaction count can’t
differentiate between selling and buying transfers, elevated values
of the indicator alone are often not enough to say what kind of
behavior these investors are showing exactly, only that they are
active currently. Though, some information can perhaps be deduced
by looking at the accompanying price trend. For example, during the
price plunge a week or so back, the whales made a large number of
transfers, following which the asset hit a local low and climbed
out in a sharp rise, suggesting that the transactions may have been
for accumulating at the low prices. In the current case, however,
the asset’s value has gone downhill since whale transactions have
spiked, with the price now under the $25,000 mark, which may imply
that a decent chunk of these transactions might have been made for
selling purposes. If this is the case, it would turn out that these
Bitcoin whales possibly saw the latest price surge as just a quick
profit-taking opportunity and not a push toward a long-term rise.
BTC Price At the time of writing, Bitcoin is trading around
$24,700, up 12% in the last week. Looks like the price of the asset
has shot up over the past couple of days | Source: BTCUSD on
TradingView Featured image from iStock.com, charts from
TradingView.com, Santiment.net
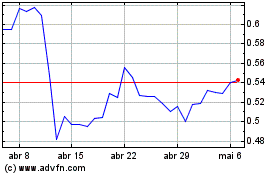
Ripple (COIN:XRPUSD)
Gráfico Histórico do Ativo
De Mar 2024 até Abr 2024

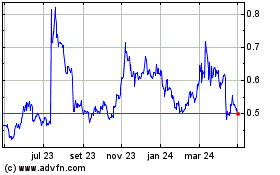
Ripple (COIN:XRPUSD)
Gráfico Histórico do Ativo
De Abr 2023 até Abr 2024
