TIDMBT.A
RNS Number : 2400L
BT Group PLC
12 May 2022
Financial results
Results for the full year to 31 March 2022
BT Group plc
12 May 2022
Philip Jansen, Chief Executive, commenting on the results, said

 "BT Group has again delivered a strong operational performance
 thanks to the efforts of our colleagues across the business. Openreach
 continues to build like fury, having now passed 7.2m premises with
 1.8m connections; a strong and growing early take-up rate of 25%.
 Meanwhile, our 5G network now covers more than 50% of the UK population.
 We have the best networks in the UK and we're continuing to invest
 at an unprecedented pace to provide unrivalled connectivity for
 our customers. At the same time we're seeing record customer satisfaction
 scores across the business.

 "We have finalised the sports joint venture with Warner Bros. Discovery
 to improve our content offering to customers, aligning our business
 with a new global content powerhouse. Separately, we have strengthened
 our strategic partnership and key customer relationship with Sky,
 having now extended our reciprocal channel supply deal into the
 next decade and agreed a MoU to extend our co-provisioning agreement.

 "Our modernisation continues at pace and we are extending our cost
 savings target of GBP2bn by end FY24 to GBP2.5bn by end FY25. We
 delivered EBITDA growth of 2% this year as strong savings from
 our modernisation programme more than offset weaker revenues from
 our enterprise businesses due to well-known market challenges.

 "While the economic outlook remains challenging, we're continuing
 to invest for the future and I am confident that BT Group is on
 the right track. As a result, we are today reconfirming our FY23
 outlook for revenue growth, EBITDA of at least GBP7.9bn and also
 the reinstatement of our full year FY22 dividend, as promised,
 at 7.7 pence per share."
BT Group plc (BT.L) today announced its results for the full
year to 31 March 2022.
Strong progress in strategic priorities:
-- Positive leading indicators: Highest ever BT Group NPS
results; low Ofcom complaints; churn near record lows
-- BT Group and Warner Bros. Discovery agreed to form a new
premium sports joint venture bringing together BT Sport and
Eurosport UK
-- Agreed with Sky a new longer-term reciprocal channel supply deal beyond 2030
-- Openreach signed a MoU on a framework with Sky on FTTP
co-provisioning; Sky engineers to complete the majority of their
FTTP in-premises provisioning activities on Openreach's FTTP
network
-- FTTP footprint at 7.2m with annualised Q4 build rate of over
3m premises; take up of 1.8m driven by Equinox
-- 5G network now covers over 50% of the UK population; our 5G
ready customer base is over 7.2m and EE is once again named as
having the best 5G and 4G network by RootMetrics
-- Achieved gross annualised cost savings now totalling
GBP1.5bn; increased target to GBP2.5bn by end FY25, within the
previously communicated cost to achieve of GBP1.3bn
Adjusted EBITDA growth and return of full year dividend:
-- Revenue GBP20.9bn, down 2%, reflecting revenue decline in
Enterprise and Global offset by growth in Openreach, with Consumer
flat for the year and returning to growth in Q4; adjusted(1)
revenue down 2%
-- Adjusted(1) EBITDA GBP7.6bn, up 2%, with revenue decline more
than offset by lower costs from our modernisation programmes, tight
cost management, and lower indirect commissions
-- Reported profit before tax GBP2.0bn, up 9%, due to increased
EBITDA offsetting higher finance expense
-- Reported profit after tax GBP1.3bn, down 13%, due to remeasurement of our deferred tax balance
-- Net cash inflow from operating activities GBP5.9bn;
normalised free cash flow(1) GBP1.4bn, down 5%, due to higher cash
capital expenditure, offset by higher EBITDA and lower tax and
lease payments
-- Capital expenditure GBP5.3bn, up 25%. Capital expenditure
excluding spectrum GBP4.8bn, up 14% primarily due to continued
higher spend on our fibre infrastructure and mobile networks
-- IAS 19 gross pensions deficit GBP1.1bn, (31 March 2021:
GBP5.1bn) due to an increase in real discount rate, deficit
contributions paid, changes to demographic assumptions and positive
asset returns
-- FY22 final dividend declared at 5.39p per share, bringing the
full year total, as promised, to 7.70p per share
-- Outlook for FY23: adjusted(1) revenue to grow year on year;
adjusted(1) EBITDA of at least GBP7.9bn; capital expenditure
excluding spectrum of around GBP4.8bn; normalised free cash flow of
GBP1.3bn to GBP1.5bn.
(1) See Glossary on page 3.
Full year to 31 March                         2022             2021              Change
                                   ===============  ===============
                                              GBPm             GBPm                   %
=================================  ===============  ===============  ==================
Reported measures
Revenue                                     20,850           21,331                 (2)
Profit before tax                            1,963            1,804                   9
Profit after tax                             1,274            1,472                (13)
Basic earnings per share                     12.9p            14.8p                (13)
Net cash inflow from operating
 activities                                  5,910            5,963                 (1)
Full year dividend                           7.70p                -                 N/A
Capital expenditure(1,2)                     5,286            4,216                  25
=================================  ===============  ===============  ==================

Adjusted measures
Adjusted(1) Revenue                         20,845           21,370                 (2)
Adjusted(1) EBITDA                           7,577            7,415                   2
Adjusted(1) basic earnings
 per share                                   20.3p            18.9p                   7
Normalised free cash flow(1)                 1,392            1,459                 (5)
Capital expenditure(1) excluding
 spectrum                                    4,807            4,216                  14
Net debt(1)                                 18,009           17,802             GBP207m
=================================  ===============  ===============  ==================
Customer-facing unit results for the full year to 31 March
2022
                        Adjusted(1) revenue                  Adjusted(1) EBITDA                     Normalised free
                                                                                                      cash flow(1)
Full year
 to 31 March        2022        2021       Change        2022        2021       Change        2022        2021       Change
============
                    GBPm        GBPm            %        GBPm        GBPm%                    GBPm        GBPm            %
============  ==========  ==========  ===========  ==========  ==========   ==========  ==========  ==========  ===========
Consumer           9,858       9,885            -       2,262       2,128            6         917         714           28
Enterprise         5,157       5,449          (5)       1,636       1,704          (4)         791       1,352         (41)
Global             3,362       3,731         (10)         456         596         (23)         131         187         (30)
Openreach          5,441       5,244            4       3,179       2,937            8         448         486          (8)
Other                 27          23           17          44          50         (12)       (895)     (1,280)           30
Intra-group
 items           (3,000)     (2,962)          (1)           -           -            -           -           -            -
============  ==========  ==========  ===========  ==========  ==========  ===========  ==========  ==========  ===========
Total             20,845      21,370          (2)       7,577       7,415            2       1,392       1,459          (5)
============  ==========  ==========  ===========  ==========  ==========  ===========  ==========  ==========  ===========


Fourth
 quarter
 to 31 March         2022         2021       Change        2022         2021       Change       2022       2021       Change
============
                     GBPm         GBPm            %        GBPm         GBPm%                   GBPm       GBPm            %
============  ===========  ===========  ===========  ==========  ===========   ==========  =========  =========  ===========
Consumer            2,416        2,391            1         557          518            8
Enterprise          1,290        1,363          (5)         384          436         (12)
Global                837          908          (8)         135          156         (13)
Openreach           1,373        1,346            2         811          726           12
Other                   7            5           40        (18)         (24)           25
Intra-group
 items              (755)        (727)          (4)           -            -            -
============  ===========  ===========  ===========  ==========  ===========  ===========  =========  =========  ===========
Total               5,168        5,286          (2)       1,869        1,812            3        513        629         (18)
============  ===========  ===========  ===========  ==========  ===========  ===========  =========  =========  ===========
Performance against FY22 outlook
                               FY22 performance       FY22 outlook
                               ================  =================
Change in adjusted(1) revenue         Down (2)%        Down c.(2)%
Adjusted(1) EBITDA                     GBP7.6bn  GBP7.5bn-GBP7.7bn
Capital expenditure(1)                 GBP4.8bn         c.GBP4.9bn
Normalised free cash flow(1)           GBP1.4bn  GBP1.1bn-GBP1.3bn
=============================  ================  =================
(1) See Glossary on page 3.
(2) Includes investment in spectrum of GBP479m.
Glossary of alternative performance measure
Adjusted             Before specific items. Adjusted results are consistent
                      with the way that financial performance is measured
                      by management and assist in providing an additional
                      analysis of the reported trading results of the Group.
EBITDA               Earnings before interest, tax, depreciation and amortisation.
Adjusted EBITDA      EBITDA before specific items, share of post tax profits/losses
                      of associates and joint ventures and net non-interest
                      related finance expense.
Free cash            Net cash inflow from operating activities after net
 flow                 capital expenditure.
Capital expenditure  Additions to property, plant and equipment and intangible
                      assets.
Normalised           Free cash flow (net cash inflow from operating activities
 free cash flow       after net capital expenditure) after net interest paid
                      and payment of lease liabilities, before pension deficit
                      payments (including cash tax benefit), payments relating
                      to spectrum, and specific items. For non-tax related
                      items the adjustments are made on a pre-tax basis.
                      It excludes cash flows that are determined at a corporate
                      level independently of ongoing trading operations such
                      as dividends, share buybacks, acquisitions and disposals,
                      and repayment and raising of debt.
Net debt             Loans and other borrowings and lease liabilities (both
                      current and non-current), less current asset investments
                      and cash and cash equivalents, including items which
                      have been classified as held for sale on the balance
                      sheet. Currency denominated balances within net debt
                      are translated into sterling at swapped rates where
                      hedged. Fair value adjustments and accrued interest
                      applied to reflect the effective interest method are
                      removed.
Specific items       Items that in management's judgement need to be disclosed
                      separately by virtue of their size, nature or incidence.
                      In the current period these relate to retrospective
                      regulatory matters, restructuring charges, divestment-related
                      items, Covid-19 related items, net interest expense
                      on pensions, tax charge on specific items and the impact
                      of the change in tax rate on our deferred tax balances.
BT Group NPS         Group NPS tracks changes in our customers' perceptions
                      of BT. This is a combined measure of 'promoters' minus
                      'detractors' across our business units. Group NPS measures
                      Net Promoter Score in our retail business and Net Satisfaction
                      in our wholesale business.
5G ready             EE consumer customers receiving or capable of receiving
                      5G network connection using one or both of a 5G enabled
                      handset and a 5G enabled SIM.
===================  ===============================================================
We assess the performance of the Group using a variety of
alternative performance measures. Reconciliations from the most
directly comparable IFRS measures are in Additional Information on
pages 33 to 34.
Click on, or paste the following link into your web browser, to
view the associated PDF document.
http://www.rns-pdf.londonstockexchange.com/rns/2400L_1-2022-5-12.pdf
This information is provided by RNS, the news service of the
London Stock Exchange. RNS is approved by the Financial Conduct
Authority to act as a Primary Information Provider in the United
Kingdom. Terms and conditions relating to the use and distribution
of this information may apply. For further information, please
contact rns@lseg.com or visit www.rns.com.
RNS may use your IP address to confirm compliance with the terms
and conditions, to analyse how you engage with the information
contained in this communication, and to share such analysis on an
anonymised basis with others as part of our commercial services.
For further information about how RNS and the London Stock Exchange
use the personal data you provide us, please see our Privacy
Policy.
END
FR ELLBFLELBBBD
(END) Dow Jones Newswires
May 12, 2022 02:02 ET (06:02 GMT)
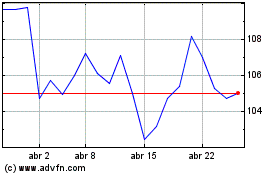
Bt (LSE:BT.A)
Gráfico Histórico do Ativo
De Mar 2024 até Abr 2024

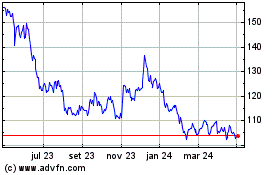
Bt (LSE:BT.A)
Gráfico Histórico do Ativo
De Abr 2023 até Abr 2024
