Polkadot (DOT) Struggles Near $6.30 – Is Now The Time To Accumulate?
17 Junho 2024 - 3:30AM
NEWSBTC
Technical indicators are casting a shadow over Polkadot, the
blockchain interoperability stalwart. The token has dipped below
the Ichimoku Cloud, signaling a clear downtrend. Adding to the
bearish outlook, both the conversion line and the baseline of the
Ichimoku indicator loom above the current price, intensifying the
negative sentiment. Related Reading: XRP Whale Goes On Shopping
Spree: 27 Million Coins Snapped Up As Price Dips Polkadot (DOT) is
entangled in a fierce battle with a relentless bear. Once soaring
high with its promise of connecting different blockchains, the
token now grapples with breaching the stubborn $7 resistance level.
Over the past two weeks, it has slipped to as low as $6.16,
stirring unease among investors. A saving grace might be found in
the proximity to the lower Bollinger Band, which hints at oversold
conditions. This could trigger a short-term bounce if buying
pressure surges. Holding The Line: $6.20 Support Zone In Focus The
next few days could be pivotal for DOT. All eyes are glued to the
$6.20 consolidation zone, which will likely determine the course of
the coming battles. If DOT can successfully hold this ground, it
could establish a base for a bullish reversal, especially if it
manages to breach past the resistance at $6.30. However, a breach
of this critical support level could lead to a demoralizing plunge
towards $6.00 or even lower, if the bears tighten their grip.
Analyst Sounds Bullish Trumpet Despite Bearish Symphony While the
current market sentiment surrounding Polkadot seems bleak, there’s
a sign of hope on the horizon.. Prominent crypto analyst Michaël
van de Poppe sees a silver lining amidst the storm clouds. He views
DOT’s descent towards the crucial support zone as a golden
opportunity to accumulate the asset at a discount. $DOT reaching
the crucial area of support and the area for accumulation. Given
the upcoming RWA narrative and the large number of projects within
the Polkadot ecosystem, this one is going to be a great mover in
the coming years. pic.twitter.com/2ssYuzGJtZ — Michaël van de Poppe
(@CryptoMichNL) June 15, 2024 This strategic play aligns with the
burgeoning interest in Real World Assets (RWAs) and the
ever-expanding universe of projects within the Polkadot ecosystem.
Van de Poppe believes these factors, coupled with a potential
breakout, could propel DOT towards significant growth in the years
to come. Van de Poppe’s analysis identifies a critical support
range for DOT between $5.67 and $6.11. He emphasizes the importance
of establishing a higher low within this zone to maintain bullish
momentum. The analyst also highlights two significant resistance
levels that DOT must conquer for a triumphant breakout. The first
hurdle lies around $9.30, while the ultimate test lies near $17.00,
which would involve closing a price gap. Related Reading: Breakout
Alert! Chainlink (LINK) On Verge Of Major Surge, Analyst Says
Polkadot: Bumpy Ride Ahead? Polkadot’s short-term future appears
uncertain. While technical indicators suggest a bearish bias, the
analyst’s perspective offers a glimmer of hope for long-term
investors. The $6.30 support zone will be the battleground where
the fate of DOT will be decided in the coming days. If the bulls
can successfully defend this territory, a potential breakout fueled
by ecosystem growth and the RWA narrative could be on the horizon.
However, if the bears breach this crucial support level, DOT might
face a period of extended consolidation or even a deeper
correction. Featured image from Shutterstock, chart from
TradingView
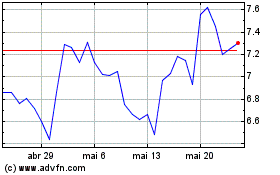
Polkadot (COIN:DOTUSD)
Gráfico Histórico do Ativo
De Mai 2024 até Jun 2024

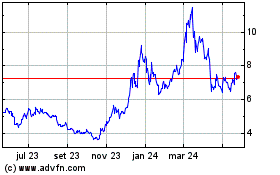
Polkadot (COIN:DOTUSD)
Gráfico Histórico do Ativo
De Jun 2023 até Jun 2024
