Ethereum Longs Crushed! Who Got Burned In The $62 Million Fire Sale?
13 Junho 2024 - 4:44AM
NEWSBTC
Ethereum (ETH) bulls got a taste of fire on June 11th as the
altcoin’s derivatives market witnessed a dramatic surge in long
liquidations. According to data from Coinglass, this event marked
the highest level of long liquidations since May 23rd, signifying a
significant correction for traders who bet on rising prices.
Related Reading: Shiba Inu Loses 14% In Last 7 Days – Will The
Misery Worsen? Crimson Chart: Long Positions Liquidated
Overconfident investors piled into long positions, essentially
placing a wager that Ethereum’s price would climb. However, the
market had other plans. An unexpected price drop sent shivers down
the spines of these bulls, triggering a wave of liquidations. As
the price dipped below a certain threshold set by the exchange
(known as the margin requirement), these positions were forcefully
closed to prevent further losses for the unfortunate traders. The
result? A collective sigh of relief for some exchanges, but a hefty
bill for liquidated bulls, totaling over $60 million on that
fateful day. Positive Funding Rate Offers A Glimmer Of Hope While
the market correction sent shockwaves through the Ethereum
derivatives landscape, a silver lining emerged in the form of a
positive Funding Rate. This metric essentially reflects the fees
paid by traders holding short positions (betting on a price
decline) to those holding long positions. In simpler terms, a
positive Funding Rate indicates a stronger demand for long
positions, suggesting that even amidst the carnage, some investors
remain optimistic about Ethereum’s long-term prospects. This
positivity is further bolstered by the fact that ETH’s Funding Rate
hasn’t dipped into negative territory since May 3rd. A Temporary
Hiccup? The jury’s still out on whether this event represents a
fleeting blip or a more concerning trend. While the positive
Funding Rate offers a glimmer of hope, the significant drop in
derivatives activity paints a different picture. The past 24 hours
have seen a worrying decline in both options trading volume (down
50%) and Open Interest (total outstanding contracts, down 2%). This
suggests a potential flight from the market, with fewer
participants actively trading options contracts or holding open
positions. Ether Price Forecast Meanwhile, the current Ethereum
price prediction by CoinCodex suggests a 2.46% rise to $3,636 by
July 13, 2024. Despite this positive outlook, the market sentiment
remains bearish. The Fear & Greed Index stands at 70 (Greed),
indicating strong investor interest. Related Reading: Solana
Searching For Direction: Will SOL Break Free Or Fall Flat? Over the
last 30 days, Ethereum has shown significant volatility, with
positive gains on 53% of the days and an overall price fluctuation
of 8.63%. While the short-term forecast is optimistic, the mixed
signals highlight the need for cautious investment given the
current market unpredictability. Featured image from SignatureCare
Emergency Center, chart from TradingView
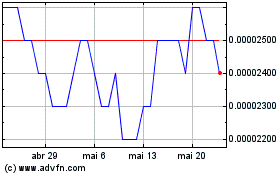
SHIBA INU (COIN:SHIBUSD)
Gráfico Histórico do Ativo
De Mai 2024 até Jun 2024

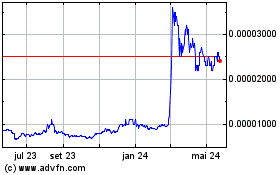
SHIBA INU (COIN:SHIBUSD)
Gráfico Histórico do Ativo
De Jun 2023 até Jun 2024
