Pay vs Performance Disclosure - USD ($)
|
12 Months Ended |
Dec. 31, 2023 |
Dec. 31, 2022 |
Jan. 01, 2022 |
Jan. 02, 2021 |
| Pay vs Performance Disclosure |
|
|
|
|
| Pay vs Performance Disclosure, Table |
As highlighted in “Compensation Discussion and Analysis,” one of the primary principles of our compensation program is to ensure that there is a substantial portion of compensation of executive officer pay that is at-risk and is highly dependent on Cadence’s short-term and long-term financial, operational, and stock price performance. For our executives, over 75% of their opportunity is tied to long-term equity incentives which will depend on our stock price performance while roughly 10% to 15% of our executive pay is tied to annual financial and operational performance. As a result, we would expect that our Compensation Actually Paid in the table below will have a stronger correlation with our TSR and stock price performance than our annual financial and operational performance. We expect a strong correlation to stock price performance through the combination of (a) having a significant portion of executive pay tied to long-term incentives (“LTI”) and (b) using options as part of our annual LTI mix (50% for our CEO and 34% for our other NEOs) and periodic LTP awards that require meeting material stock price growth hurdles before any value is delivered to our executives. Driven by continued strong business performance (including increased revenues, operating margin, and net income) Cadence’s stock price increased by approximately 70% in 2023. In the charts and descriptions of the relationships presented below we note the following:
| |
(a) |
We show two Principal Executive Officers (“PEOs”) over the four-year period due to our CEO transition in 2021 (Dr. Devgan is PEO #1 for 2023, 2022 and 2021 and Mr. Tan is PEO #2 for 2021 and 2020). |
| |
(b) |
There is a notable difference in the Compensation Actually Paid for 2020 compared to 2021 despite continued stock price performance in 2021. The higher Compensation Actually Paid values for 2020 when compared to 2021 reflect three primary factors: (a) the Compensation Actually Paid calculation measures the change in fair value of equity awards (not the absolute value), (b) our stock price grew 97% in 2020 compared to a 37% increase in 2021 indicating that the change in the fair value of equity awards would be larger in 2020 compared to 2021, and (c) we had five LTP tranches as part of the 2020 calculation (two outstanding LTP I awards and three outstanding LTP III awards) compared to four LTP tranches as part of the 2021 calculation (one outstanding LTP I award and three outstanding LTP III awards). |
| |
(c) |
There is also a notable difference in the Compensation Actually Paid for 2023 compared to 2022 given strong stock price performance in 2023. The higher Compensation Actually Paid values for 2023 when compared to 2022 reflect two primary factors: (a) the Compensation Actually Paid calculation measures the change in fair value of equity awards (not the absolute value), (b) our stock price grew 70% in 2023 compared to a 14% decrease in 2022 indicating that the change in the fair value of equity awards would be larger in 2023 compared to 2022. | The following table sets forth additional compensation information of our PEO and our other (non-PEO) NEOs along with TSR, net income, and non-GAAP operating income performance results for our fiscal years 2020, 2021, 2022 and 2023.
|
|
|
|
|
|
|
|
|
|
|
|
|
|
|
|
|
|
|
|
|
|
|
|
|
|
|
|
|
|
|
|
|
|
|
|
|
|
|
|
|
|
|
|
|
|
|
| |
|
|
|
|
|
|
|
|
|
|
|
|
|
|
|
|
|
|
|
Value of Initial Fixed $100
|
|
|
|
|
|
|
|
|
|
|
|
|
|
|
|
|
|
|
|
|
|
|
|
|
|
|
|
|
|
|
|
|
|
|
|
|
|
|
|
|
|
|
|
|
|
|
|
|
|
|
|
|
|
|
|
|
|
|
|
|
|
|
|
|
|
|
|
|
|
|
|
|
|
|
|
| 2023 |
|
|
$17,341,862 |
|
|
|
$119,135,192 |
|
|
|
N/A |
|
|
|
N/A |
|
|
|
$ 5,291,144 |
|
|
|
$34,337,386 |
|
|
$393 |
|
$211 |
|
|
$1,041,144,000 |
|
|
|
$1,717,212,000 |
|
|
|
|
|
|
|
|
|
|
|
|
| 2022 |
|
|
$32,216,034 |
|
|
|
$ 24,757,155 |
|
|
|
N/A |
|
|
|
N/A |
|
|
|
$10,293,930 |
|
|
|
$ 7,377,865 |
|
|
$232 |
|
$135 |
|
|
$ 848,952,000 |
|
|
|
$1,436,000,000 |
|
|
|
|
|
|
|
|
|
|
|
|
| 2021 |
|
|
$21,735,794 |
|
|
|
$ 39,820,493 |
|
|
|
$11,166,016 |
|
|
|
$60,351,290 |
|
|
|
$ 5,188,515 |
|
|
|
$14,539,214 |
|
|
$269 |
|
$190 |
|
|
$ 695,955,000 |
|
|
|
$1,111,000,000 |
|
|
|
|
|
|
|
|
|
|
|
|
| 2020 |
|
|
N/A |
|
|
|
N/A |
|
|
|
$ 9,604,640 |
|
|
|
$93,290,140 |
|
|
|
$ 4,251,412 |
|
|
|
$21,315,667 |
|
|
$197 |
|
$142 |
|
|
$ 590,644,000 |
|
|
|
$ 944,000,000 |
|
(1) |
NEOs included in the above compensation columns reflect the following: |
|
|
|
|
|
|
|
|
|
|
|
|
|
|
| |
|
Dr. Devgan Dr. Devgan |
|
— — |
|
Messrs. Wall, Zaman, Cunningham and Teng Messrs. Wall, Zaman, Cunningham and Teng |
|
|
Dr. Devgan |
|
Mr. Tan |
|
Messrs. Wall, Zaman, Teng and Beckley |
|
|
— |
|
Mr. Tan |
|
Messrs. Devgan, Wall, and Teng and Ms. Flaminia |
(2) |
Amounts reported in this column represent (i) the total compensation as reported in the Summary Compensation Table for the applicable year in the case of Dr. Devgan and Mr. Tan (for each year they served as PEO) and (ii) the average of the total compensation as reported in the Summary Compensation Table for Cadence’s other NEOs for the applicable year. |
(3) |
The fair value or change in fair value, as applicable, of equity awards in the “Compensation Actually Paid” columns has been estimated pursuant to the guidance in Accounting Standards Codification Topic No. 718: Compensation–Stock Compensation (“ASC Topic 718”). The fair values of restricted share awards that are subject to solely service-based vesting criteria equals the closing price on applicable year-end date(s) or, in the case of vesting dates, the closing price on the applicable vesting dates. The fair values of LTP awards that vest upon the attainment of both stock price targets and TSR hurdles relative to a group of peer companies were estimated with a Monte Carlo simulation model as of the applicable year-end date(s) using the same methodology as used to estimate the grant date fair value, but using each company’s closing stock price on the applicable revaluation date as the current market price and volatility assumptions and risk free rates determined as of the revaluation date based on the length of the LTP award’s remaining performance measurement period. The vest date values of the LTP awards equals the closing price on the applicable vesting dates. The fair values of stock options were estimated using the Black Scholes option pricing model as of the applicable year-end or vesting date(s), using the same methodology as used to estimate the grant date fair value but using (a) the closing stock price on applicable revaluation date as the current market price, (b) an expected remaining life assumption that is based on the stock options remaining contractual term as the applicable revaluation date and the degree to which the revaluation date stock price is greater than or less than the exercise price, with stock options that have an exercise price that is less than the revaluation date stock price having a shorter remaining expected life and stock options that have an exercise price that is greater than the revaluation date stock price having a longer remaining expected life, (c) expected volatility assumptions and risk free rates determined as of the revaluation date based on the length of the expected remaining life, and (d) an expected dividend rate of 0%. For additional information on the assumptions used to estimate the fair value of the awards, see the Notes to Consolidated Financial Statements in Cadence’s Annual Reports on Form 10-K for the fiscal year ended December 31, 2023 and prior fiscal years. |
(4) |
Compensation Actually Paid to PEO #1 (Dr. Devgan) reflects the following adjustments from Total compensation reported in the Summary Compensation Table: |
|
|
|
|
|
|
|
|
|
|
|
|
|
|
|
|
|
|
|
|
|
| |
|
|
|
|
|
|
|
|
Total Reported in Summary Compensation Table (SCT) |
|
|
$ |
17,341,862 |
|
|
|
$ |
32,216,034 |
|
|
|
$ |
21,735,794 |
|
|
|
|
— |
|
|
|
|
|
|
|
|
|
|
|
|
|
|
|
|
|
|
|
|
|
|
Less, value of Stock Awards reported in SCT |
|
|
($ |
15,392,704 |
|
|
|
($ |
30,098,153 |
|
|
|
($ |
19,996,360 |
) |
|
|
|
— |
|
Plus, Year-End value of Awards Granted in Fiscal Year that are Unvested and Outstanding |
|
|
$ |
20,512,907 |
|
|
|
$ |
33,730,111 |
|
|
|
$ |
20,926,797 |
|
|
|
|
— |
|
Plus, Change in Fair Value of Prior Years awards that are Outstanding and Unvested |
|
|
$ |
65,834,172 |
|
|
|
($ |
31,069,495 |
) |
|
|
($ |
4,318,614 |
) |
|
|
|
— |
|
Plus, FMV of Awards Granted and Vested in the indicated Year |
|
|
$ |
1,733,185 |
|
|
|
$ |
962,229 |
|
|
|
$ |
557,207 |
|
|
|
|
— |
|
Plus, Change in Fair Value (from prior year-end) of Prior Year awards that Vested this year |
|
|
$ |
29,105,769 |
|
|
|
$ |
19,016,429 |
|
|
|
$ |
20,915,668 |
|
|
|
|
|
|
Less Prior Year Fair Value of Prior Year awards that Failed to vest this year |
|
|
($ |
0 |
) |
|
|
($ |
0 |
) |
|
|
($ |
0 |
) |
|
|
|
|
|
|
|
|
|
|
|
|
|
|
|
|
|
|
|
|
|
|
|
|
|
|
Total Adjustments |
|
|
$ |
101,793,329 |
|
|
|
($ |
7,458,879 |
) |
|
|
$ |
18,084,699 |
|
|
|
|
|
|
|
|
|
|
|
|
|
|
|
|
|
|
|
|
|
|
|
|
|
|
|
|
|
|
$ |
119,135,192 |
|
|
|
$ |
24,757,155 |
|
|
|
$ |
39,820,493 |
|
|
|
|
|
|
|
|
|
|
|
|
|
|
|
|
|
|
|
|
|
|
|
|
|
|
|
(5) |
Compensation Actually Paid to PEO #2 (Mr. Tan) reflects the following adjustments from Total compensation reported in the Summary Compensation Table: |
|
|
|
|
|
|
|
|
|
|
|
|
|
|
|
|
|
|
|
|
|
| |
|
|
|
|
|
|
|
|
Total Reported in Summary Compensation Table (SCT) |
|
|
|
— |
|
|
|
|
— |
|
|
|
$ |
11,166,016 |
|
|
|
$ |
9,604,640 |
|
|
|
|
|
|
|
|
|
|
|
|
|
|
|
|
|
|
|
|
|
|
Less, value of Stock Awards reported in SCT |
|
|
|
|
|
|
|
|
— |
|
|
|
($ |
8,999,650 |
) |
|
|
($ |
7,498,545 |
) |
Plus, Year-End value of Awards Granted in Fiscal Year that are Unvested and Outstanding |
|
|
|
— |
|
|
|
|
— |
|
|
|
$ |
12,344,763 |
|
|
|
$ |
16,413,875 |
|
Plus, Change in Fair Value of Prior Years awards that are Outstanding and Unvested |
|
|
|
— |
|
|
|
|
— |
|
|
|
$ |
6,806,871 |
|
|
|
$ |
48,081,970 |
|
Plus, FMV of Awards Granted and Vested in the indicated Year |
|
|
|
— |
|
|
|
|
— |
|
|
|
$ |
1,003,000 |
|
|
|
$ |
1,244,473 |
|
Plus, Change in Fair Value (from prior year-end) of Prior Year awards that Vested this year |
|
|
|
— |
|
|
|
|
— |
|
|
|
$ |
38,030,290 |
|
|
|
$ |
25,443,727 |
|
Less Prior Year Fair Value of Prior Year awards that Failed to vest this year |
|
|
|
— |
|
|
|
|
— |
|
|
|
($ |
0 |
) |
|
|
($ |
0 |
) |
|
|
|
|
|
|
|
|
|
|
|
|
|
|
|
|
|
|
|
|
|
Total Adjustments |
|
|
|
— |
|
|
|
|
— |
|
|
|
$ |
49,185,274 |
|
|
|
$ |
83,685,500 |
|
|
|
|
|
|
|
|
|
|
|
|
|
|
|
|
|
|
|
|
|
|
|
|
|
|
— |
|
|
|
|
— |
|
|
|
$ |
60,351,290 |
|
|
|
$ |
93,290,140 |
|
|
|
|
|
|
|
|
|
|
|
|
|
|
|
|
|
|
|
|
|
|
(6) |
The average Compensation Actually Paid to the non-PEO NEOs reflects the following adjustments from Total compensation reported in the Summary Compensation Table: |
|
|
|
|
|
|
|
|
|
|
|
|
|
|
|
|
|
| |
|
|
|
|
|
|
|
|
|
|
|
|
Total Reported in Summary Compensation Table (SCT) |
|
$ |
5,291,144 |
|
|
$ |
10,293,930 |
|
|
$ |
5,188,515 |
|
|
$ |
4,251,412 |
|
|
|
|
|
|
|
|
|
|
|
|
|
|
|
|
|
|
Less, value of Stock Awards reported in SCT |
|
($ |
4,105,718 |
) |
|
($ |
9,032,300 |
) |
|
($ |
3,999,937 |
) |
|
($ |
3,206,240 |
) |
Plus, Year-End value of Awards Granted in Fiscal Year that are Unvested and Outstanding |
|
$ |
5,483,961 |
|
|
$ |
10,165,513 |
|
|
$ |
5,017,287 |
|
|
$ |
6,219,548 |
|
Plus, Change in Fair Value of Prior Years awards that are Outstanding and Unvested |
|
$ |
16,894,138 |
|
|
($ |
11,766,789 |
) |
|
($ |
1,923,004 |
) |
|
$ |
8,360,210 |
|
Plus, FMV of Awards Granted and Vested in the indicated Year |
|
$ |
314,241 |
|
|
$ |
216,729 |
|
|
$ |
208,366 |
|
|
$ |
236,946 |
|
Plus, Change in Fair Value (from prior year-end) of Prior Year awards that Vested this year |
|
$ |
10,459,620 |
|
|
$ |
7,500,782 |
|
|
$ |
10,047,986 |
|
|
$ |
5,453,791 |
|
Less Prior Year Fair Value of Prior Year awards that Failed to vest this year |
|
($ |
0 |
) |
|
($ |
0 |
) |
|
($ |
0 |
) |
|
($ |
0 |
) |
|
|
|
|
|
|
|
|
|
|
|
|
|
|
|
|
|
Total Adjustments |
|
$ |
29,046,242 |
|
|
($ |
2,916,064 |
) |
|
$ |
9,350,699 |
|
|
$ |
17,064,255 |
|
|
|
|
|
|
|
|
|
|
|
|
|
|
|
|
|
|
|
|
$ |
34,337,386 |
|
|
$ |
7,377,865 |
|
|
$ |
14,539,214 |
|
|
$ |
21,315,667 |
|
|
|
|
|
|
|
|
|
|
|
|
|
|
|
|
|
|
(7) |
Peer group TSR reflects the S&P 500 Information Technology Index performance as reflected in our Annual Report on Form 10-K for the fiscal year ended December 31, 2023 pursuant to Item 201(e) of Regulation S-K. For Cadence’s and the peer group’s TSR, each year reflects what the cumulative value of $100 would be, including reinvestment of dividends, if such amount were invested on December 28, 2019. |
(8) |
We identified Non-GAAP Operating Income Dollars as our company selected measure which is defined as operating income adjusted for amortization of acquired intangibles, stock-based compensation expense, non-qualified deferred compensation expenses or credits, restructuring charges or credits, acquisition- and integration-related costs, and special charges. |
|
|
|
|
| Company Selected Measure Name |
Non-GAAP Operating Income
|
|
|
|
| Named Executive Officers, Footnote |
(1) |
NEOs included in the above compensation columns reflect the following: |
|
|
|
|
|
|
|
|
|
|
|
|
|
|
| |
|
Dr. Devgan Dr. Devgan |
|
— — |
|
Messrs. Wall, Zaman, Cunningham and Teng Messrs. Wall, Zaman, Cunningham and Teng |
|
|
Dr. Devgan |
|
Mr. Tan |
|
Messrs. Wall, Zaman, Teng and Beckley |
|
|
— |
|
Mr. Tan |
|
Messrs. Devgan, Wall, and Teng and Ms. Flaminia |
|
|
|
|
| Peer Group Issuers, Footnote |
Peer group TSR reflects the S&P 500 Information Technology Index performance as reflected in our Annual Report on Form 10-K for the fiscal year ended December 31, 2023 pursuant to Item 201(e) of Regulation S-K. For Cadence’s and the peer group’s TSR, each year reflects what the cumulative value of $100 would be, including reinvestment of dividends, if such amount were invested on December 28, 2019.
|
|
|
|
| Adjustment To PEO Compensation, Footnote |
(4) |
Compensation Actually Paid to PEO #1 (Dr. Devgan) reflects the following adjustments from Total compensation reported in the Summary Compensation Table: |
|
|
|
|
|
|
|
|
|
|
|
|
|
|
|
|
|
|
|
|
|
| |
|
|
|
|
|
|
|
|
Total Reported in Summary Compensation Table (SCT) |
|
|
$ |
17,341,862 |
|
|
|
$ |
32,216,034 |
|
|
|
$ |
21,735,794 |
|
|
|
|
— |
|
|
|
|
|
|
|
|
|
|
|
|
|
|
|
|
|
|
|
|
|
|
Less, value of Stock Awards reported in SCT |
|
|
($ |
15,392,704 |
|
|
|
($ |
30,098,153 |
|
|
|
($ |
19,996,360 |
) |
|
|
|
— |
|
Plus, Year-End value of Awards Granted in Fiscal Year that are Unvested and Outstanding |
|
|
$ |
20,512,907 |
|
|
|
$ |
33,730,111 |
|
|
|
$ |
20,926,797 |
|
|
|
|
— |
|
Plus, Change in Fair Value of Prior Years awards that are Outstanding and Unvested |
|
|
$ |
65,834,172 |
|
|
|
($ |
31,069,495 |
) |
|
|
($ |
4,318,614 |
) |
|
|
|
— |
|
Plus, FMV of Awards Granted and Vested in the indicated Year |
|
|
$ |
1,733,185 |
|
|
|
$ |
962,229 |
|
|
|
$ |
557,207 |
|
|
|
|
— |
|
Plus, Change in Fair Value (from prior year-end) of Prior Year awards that Vested this year |
|
|
$ |
29,105,769 |
|
|
|
$ |
19,016,429 |
|
|
|
$ |
20,915,668 |
|
|
|
|
|
|
Less Prior Year Fair Value of Prior Year awards that Failed to vest this year |
|
|
($ |
0 |
) |
|
|
($ |
0 |
) |
|
|
($ |
0 |
) |
|
|
|
|
|
|
|
|
|
|
|
|
|
|
|
|
|
|
|
|
|
|
|
|
|
|
Total Adjustments |
|
|
$ |
101,793,329 |
|
|
|
($ |
7,458,879 |
) |
|
|
$ |
18,084,699 |
|
|
|
|
|
|
|
|
|
|
|
|
|
|
|
|
|
|
|
|
|
|
|
|
|
|
|
|
|
|
$ |
119,135,192 |
|
|
|
$ |
24,757,155 |
|
|
|
$ |
39,820,493 |
|
|
|
|
|
|
|
|
|
|
|
|
|
|
|
|
|
|
|
|
|
|
|
|
|
|
|
(5) |
Compensation Actually Paid to PEO #2 (Mr. Tan) reflects the following adjustments from Total compensation reported in the Summary Compensation Table: |
|
|
|
|
|
|
|
|
|
|
|
|
|
|
|
|
|
|
|
|
|
| |
|
|
|
|
|
|
|
|
Total Reported in Summary Compensation Table (SCT) |
|
|
|
— |
|
|
|
|
— |
|
|
|
$ |
11,166,016 |
|
|
|
$ |
9,604,640 |
|
|
|
|
|
|
|
|
|
|
|
|
|
|
|
|
|
|
|
|
|
|
Less, value of Stock Awards reported in SCT |
|
|
|
|
|
|
|
|
— |
|
|
|
($ |
8,999,650 |
) |
|
|
($ |
7,498,545 |
) |
Plus, Year-End value of Awards Granted in Fiscal Year that are Unvested and Outstanding |
|
|
|
— |
|
|
|
|
— |
|
|
|
$ |
12,344,763 |
|
|
|
$ |
16,413,875 |
|
Plus, Change in Fair Value of Prior Years awards that are Outstanding and Unvested |
|
|
|
— |
|
|
|
|
— |
|
|
|
$ |
6,806,871 |
|
|
|
$ |
48,081,970 |
|
Plus, FMV of Awards Granted and Vested in the indicated Year |
|
|
|
— |
|
|
|
|
— |
|
|
|
$ |
1,003,000 |
|
|
|
$ |
1,244,473 |
|
Plus, Change in Fair Value (from prior year-end) of Prior Year awards that Vested this year |
|
|
|
— |
|
|
|
|
— |
|
|
|
$ |
38,030,290 |
|
|
|
$ |
25,443,727 |
|
Less Prior Year Fair Value of Prior Year awards that Failed to vest this year |
|
|
|
— |
|
|
|
|
— |
|
|
|
($ |
0 |
) |
|
|
($ |
0 |
) |
|
|
|
|
|
|
|
|
|
|
|
|
|
|
|
|
|
|
|
|
|
Total Adjustments |
|
|
|
— |
|
|
|
|
— |
|
|
|
$ |
49,185,274 |
|
|
|
$ |
83,685,500 |
|
|
|
|
|
|
|
|
|
|
|
|
|
|
|
|
|
|
|
|
|
|
|
|
|
|
— |
|
|
|
|
— |
|
|
|
$ |
60,351,290 |
|
|
|
$ |
93,290,140 |
|
|
|
|
|
|
|
|
|
|
|
|
|
|
|
|
|
|
|
|
|
|
|
|
|
|
| Non-PEO NEO Average Total Compensation Amount |
$ 5,291,144
|
$ 10,293,930
|
$ 5,188,515
|
$ 4,251,412
|
| Non-PEO NEO Average Compensation Actually Paid Amount |
$ 34,337,386
|
7,377,865
|
14,539,214
|
21,315,667
|
| Adjustment to Non-PEO NEO Compensation Footnote |
(6) |
The average Compensation Actually Paid to the non-PEO NEOs reflects the following adjustments from Total compensation reported in the Summary Compensation Table: |
|
|
|
|
|
|
|
|
|
|
|
|
|
|
|
|
|
| |
|
|
|
|
|
|
|
|
|
|
|
|
Total Reported in Summary Compensation Table (SCT) |
|
$ |
5,291,144 |
|
|
$ |
10,293,930 |
|
|
$ |
5,188,515 |
|
|
$ |
4,251,412 |
|
|
|
|
|
|
|
|
|
|
|
|
|
|
|
|
|
|
Less, value of Stock Awards reported in SCT |
|
($ |
4,105,718 |
) |
|
($ |
9,032,300 |
) |
|
($ |
3,999,937 |
) |
|
($ |
3,206,240 |
) |
Plus, Year-End value of Awards Granted in Fiscal Year that are Unvested and Outstanding |
|
$ |
5,483,961 |
|
|
$ |
10,165,513 |
|
|
$ |
5,017,287 |
|
|
$ |
6,219,548 |
|
Plus, Change in Fair Value of Prior Years awards that are Outstanding and Unvested |
|
$ |
16,894,138 |
|
|
($ |
11,766,789 |
) |
|
($ |
1,923,004 |
) |
|
$ |
8,360,210 |
|
Plus, FMV of Awards Granted and Vested in the indicated Year |
|
$ |
314,241 |
|
|
$ |
216,729 |
|
|
$ |
208,366 |
|
|
$ |
236,946 |
|
Plus, Change in Fair Value (from prior year-end) of Prior Year awards that Vested this year |
|
$ |
10,459,620 |
|
|
$ |
7,500,782 |
|
|
$ |
10,047,986 |
|
|
$ |
5,453,791 |
|
Less Prior Year Fair Value of Prior Year awards that Failed to vest this year |
|
($ |
0 |
) |
|
($ |
0 |
) |
|
($ |
0 |
) |
|
($ |
0 |
) |
|
|
|
|
|
|
|
|
|
|
|
|
|
|
|
|
|
Total Adjustments |
|
$ |
29,046,242 |
|
|
($ |
2,916,064 |
) |
|
$ |
9,350,699 |
|
|
$ |
17,064,255 |
|
|
|
|
|
|
|
|
|
|
|
|
|
|
|
|
|
|
|
|
$ |
34,337,386 |
|
|
$ |
7,377,865 |
|
|
$ |
14,539,214 |
|
|
$ |
21,315,667 |
|
|
|
|
|
|
|
|
|
|
|
|
|
|
|
|
|
|
|
|
|
|
| Compensation Actually Paid vs. Total Shareholder Return |
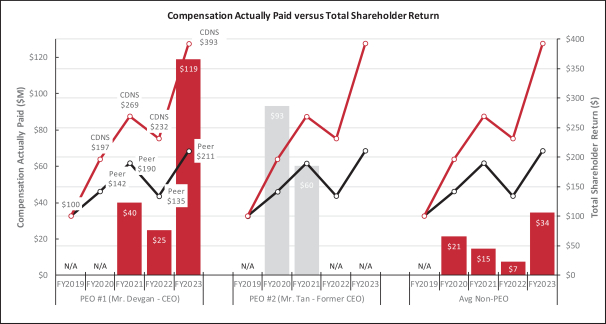
Compensation Actually Paid versus Total Shareholder Return As indicated above, we believe there is a strong alignment between Compensation Actually Paid and our TSR as we have outperformed our peer group. Specifically, when our stock price has grown (in 2020, 2021, and 2023), the Compensation Actually Paid has been above our Summary Compensation Table values and when our stock price has decreased (2022) the Compensation Actually Paid has been below our Summary Compensation Table values (and lower than prior years). The 2020 Compensation Actually Paid values for Mr. Tan reflect the impact of prior option awards and prior LTP awards that had meaningful changes in fair value because of our significant stock price gains in 2020. As noted above, the lower Compensation Actually Paid values in 2021 compared to 2020 are a result of several factors including lower price growth and fewer outstanding LTP awards included in the calculations. The higher Compensation Actually Paid values in 2023 compared to 2022 are a result of several factors including significant stock price growth and the use of options and periodic LTP grants in the program.
|
|
|
|
| Compensation Actually Paid vs. Net Income |
Compensation Actually Paid versus GAAP Net Income and non-GAAP Operating Income (Company Selected Metric) As alluded to above, and compared to correlation with TSR, we see a weaker correlation between our financial and operational metrics and Compensation Actually Paid. In each of the past three years our GAAP Net Income and non-GAAP Operating Income has grown; however, our Compensation Actually Paid has varied over that same period of time (higher values in 2020, 2021, 2023 and lower values in 2022). This underscores that our compensation program is materially tied to stock price performance and creates alignment with the stockholder experience.
|
|
|
|
| Compensation Actually Paid vs. Company Selected Measure |
|
|
|
|
| Tabular List, Table |
The following is a list of financial performance and non-financial performance measures, which in our assessment represent the most important measures used by Cadence to link Compensation Actually Paid to the NEOs for 2023: Revenue Non-GAAP Operating Income Dollars Non-GAAP Operating Income Margin Stock Price Performance Cadence Culture Modifier
|
|
|
|
| Total Shareholder Return Amount |
$ 393
|
232
|
269
|
197
|
| Peer Group Total Shareholder Return Amount |
211
|
135
|
190
|
142
|
| Net Income (Loss) |
$ 1,041,144,000
|
$ 848,952,000
|
$ 695,955,000
|
$ 590,644,000
|
| Company Selected Measure Amount |
1,717,212,000
|
1,436,000,000
|
1,111,000,000
|
944,000,000
|
| Minimum Stock Price |
10.00%
|
|
|
|
| Maximum Stock Price |
15.00%
|
|
|
|
| Increase in Stock Price |
|
|
37.00%
|
97.00%
|
| Measure:: 1 |
|
|
|
|
| Pay vs Performance Disclosure |
|
|
|
|
| Name |
Revenue
|
|
|
|
| Measure:: 2 |
|
|
|
|
| Pay vs Performance Disclosure |
|
|
|
|
| Name |
Non-GAAP Operating Income Dollars
|
|
|
|
| Non-GAAP Measure Description |
We identified Non-GAAP Operating Income Dollars as our company selected measure which is defined as operating income adjusted for amortization of acquired intangibles, stock-based compensation expense, non-qualified deferred compensation expenses or credits, restructuring charges or credits, acquisition- and integration-related costs, and special charges.
|
|
|
|
| Measure:: 3 |
|
|
|
|
| Pay vs Performance Disclosure |
|
|
|
|
| Name |
Non-GAAP Operating Income Margin
|
|
|
|
| Measure:: 4 |
|
|
|
|
| Pay vs Performance Disclosure |
|
|
|
|
| Name |
Stock Price Performance
|
|
|
|
| Measure:: 5 |
|
|
|
|
| Pay vs Performance Disclosure |
|
|
|
|
| Name |
Cadence Culture Modifier
|
|
|
|
| Dr. Devgan [Member] |
|
|
|
|
| Pay vs Performance Disclosure |
|
|
|
|
| PEO Total Compensation Amount |
$ 17,341,862
|
$ 32,216,034
|
$ 21,735,794
|
|
| PEO Actually Paid Compensation Amount |
$ 119,135,192
|
$ 24,757,155
|
$ 39,820,493
|
|
| PEO Name |
Dr. Devgan
|
Dr. Devgan
|
Dr. Devgan
|
|
| Mr. Tan [Member] |
|
|
|
|
| Pay vs Performance Disclosure |
|
|
|
|
| PEO Total Compensation Amount |
|
|
$ 11,166,016
|
$ 9,604,640
|
| PEO Actually Paid Compensation Amount |
|
|
$ 60,351,290
|
$ 93,290,140
|
| PEO Name |
|
|
Mr. Tan
|
Mr. Tan
|
| PEO | Dr. Devgan [Member] | Value of Stock Awards reported in SCT [Member] |
|
|
|
|
| Pay vs Performance Disclosure |
|
|
|
|
| Adjustment to Compensation, Amount |
$ (15,392,704)
|
$ (30,098,153)
|
$ (19,996,360)
|
|
| PEO | Dr. Devgan [Member] | YearEnd value of Awards Granted in Fiscal Year that are Unvested and Outstanding [Member] |
|
|
|
|
| Pay vs Performance Disclosure |
|
|
|
|
| Adjustment to Compensation, Amount |
20,512,907
|
33,730,111
|
20,926,797
|
|
| PEO | Dr. Devgan [Member] | Change in Fair Value of Prior Years awards that are Outstanding and Unvested [Member] |
|
|
|
|
| Pay vs Performance Disclosure |
|
|
|
|
| Adjustment to Compensation, Amount |
65,834,172
|
(31,069,495)
|
(4,318,614)
|
|
| PEO | Dr. Devgan [Member] | FMV of Awards Granted and Vested in the indicated Year [Member] |
|
|
|
|
| Pay vs Performance Disclosure |
|
|
|
|
| Adjustment to Compensation, Amount |
1,733,185
|
962,229
|
557,207
|
|
| PEO | Dr. Devgan [Member] | Change in Fair Value (from prior yearend) of Prior Year awards that Vested this year [Member] |
|
|
|
|
| Pay vs Performance Disclosure |
|
|
|
|
| Adjustment to Compensation, Amount |
29,105,769
|
19,016,429
|
20,915,668
|
|
| PEO | Dr. Devgan [Member] | Prior Year Fair Value of Prior Year awards that Failed to vest this year [Member] |
|
|
|
|
| Pay vs Performance Disclosure |
|
|
|
|
| Adjustment to Compensation, Amount |
0
|
0
|
0
|
|
| PEO | Dr. Devgan [Member] | Total Adjustments [Member] |
|
|
|
|
| Pay vs Performance Disclosure |
|
|
|
|
| Adjustment to Compensation, Amount |
101,793,329
|
(7,458,879)
|
18,084,699
|
|
| PEO | Mr. Tan [Member] | Value of Stock Awards reported in SCT [Member] |
|
|
|
|
| Pay vs Performance Disclosure |
|
|
|
|
| Adjustment to Compensation, Amount |
|
|
(8,999,650)
|
$ (7,498,545)
|
| PEO | Mr. Tan [Member] | YearEnd value of Awards Granted in Fiscal Year that are Unvested and Outstanding [Member] |
|
|
|
|
| Pay vs Performance Disclosure |
|
|
|
|
| Adjustment to Compensation, Amount |
|
|
12,344,763
|
16,413,875
|
| PEO | Mr. Tan [Member] | Change in Fair Value of Prior Years awards that are Outstanding and Unvested [Member] |
|
|
|
|
| Pay vs Performance Disclosure |
|
|
|
|
| Adjustment to Compensation, Amount |
|
|
6,806,871
|
48,081,970
|
| PEO | Mr. Tan [Member] | FMV of Awards Granted and Vested in the indicated Year [Member] |
|
|
|
|
| Pay vs Performance Disclosure |
|
|
|
|
| Adjustment to Compensation, Amount |
|
|
1,003,000
|
1,244,473
|
| PEO | Mr. Tan [Member] | Change in Fair Value (from prior yearend) of Prior Year awards that Vested this year [Member] |
|
|
|
|
| Pay vs Performance Disclosure |
|
|
|
|
| Adjustment to Compensation, Amount |
|
|
38,030,290
|
25,443,727
|
| PEO | Mr. Tan [Member] | Prior Year Fair Value of Prior Year awards that Failed to vest this year [Member] |
|
|
|
|
| Pay vs Performance Disclosure |
|
|
|
|
| Adjustment to Compensation, Amount |
|
|
0
|
0
|
| PEO | Mr. Tan [Member] | Total Adjustments [Member] |
|
|
|
|
| Pay vs Performance Disclosure |
|
|
|
|
| Adjustment to Compensation, Amount |
|
|
49,185,274
|
83,685,500
|
| Non-PEO NEO | Value of Stock Awards reported in SCT [Member] |
|
|
|
|
| Pay vs Performance Disclosure |
|
|
|
|
| Adjustment to Compensation, Amount |
(4,105,718)
|
(9,032,300)
|
(3,999,937)
|
(3,206,240)
|
| Non-PEO NEO | YearEnd value of Awards Granted in Fiscal Year that are Unvested and Outstanding [Member] |
|
|
|
|
| Pay vs Performance Disclosure |
|
|
|
|
| Adjustment to Compensation, Amount |
5,483,961
|
10,165,513
|
5,017,287
|
6,219,548
|
| Non-PEO NEO | Change in Fair Value of Prior Years awards that are Outstanding and Unvested [Member] |
|
|
|
|
| Pay vs Performance Disclosure |
|
|
|
|
| Adjustment to Compensation, Amount |
16,894,138
|
(11,766,789)
|
(1,923,004)
|
8,360,210
|
| Non-PEO NEO | FMV of Awards Granted and Vested in the indicated Year [Member] |
|
|
|
|
| Pay vs Performance Disclosure |
|
|
|
|
| Adjustment to Compensation, Amount |
314,241
|
216,729
|
208,366
|
236,946
|
| Non-PEO NEO | Change in Fair Value (from prior yearend) of Prior Year awards that Vested this year [Member] |
|
|
|
|
| Pay vs Performance Disclosure |
|
|
|
|
| Adjustment to Compensation, Amount |
10,459,620
|
7,500,782
|
10,047,986
|
5,453,791
|
| Non-PEO NEO | Prior Year Fair Value of Prior Year awards that Failed to vest this year [Member] |
|
|
|
|
| Pay vs Performance Disclosure |
|
|
|
|
| Adjustment to Compensation, Amount |
0
|
0
|
0
|
0
|
| Non-PEO NEO | Total Adjustments [Member] |
|
|
|
|
| Pay vs Performance Disclosure |
|
|
|
|
| Adjustment to Compensation, Amount |
$ 29,046,242
|
$ (2,916,064)
|
$ 9,350,699
|
$ 17,064,255
|