BlackRock Smaller Companies Trust Plc Portfolio Update
22 Janeiro 2024 - 11:35AM
UK Regulatory
TIDMBRSC

The information contained in this release was correct as at 31 December 2023.
Information on the Company's up to date net asset values can be found on the
London Stock Exchange Website at

https://www.londonstockexchange.com/exchange/news/market-news/market-news
-home.html.

BLACKROCK SMALLER COMPANIES TRUST PLC (LEI:549300MS535KC2WH4082)

All information is at 31 December 2023 and unaudited.
Performance at month end is calculated on a Total Return basis based on NAV per
share with debt at fair value

                                    One month  Three months  One   Three  Five
                                    %          %             year  years  years
                                                             %     %      %
Net asset value                     8.3        6.5           0.8   -4.5   31.0
Share price                         5.7        11.4          5.2   -14.4  29.9
Numis ex Inv Companies + AIM Index  8.5        6.9           3.2   -3.3   24.0

Sources:  BlackRock and Datastream

At month end

Net asset value Capital only (debt at par value):    1,468.79p
Net asset value Capital only (debt at fair value):   1,514.77p
Net asset value incl. Income (debt at par value)1:   1,491.33p
Net asset value incl. Income (debt at fair value)1:  1,537.31p
Share price:                                         1,382.00p
Discount to Cum Income NAV (debt at par value):      7.3%
Discount to Cum Income NAV (debt at fair value):     10.1%
Net yield2:                                          2.9%
Gross assets3:                                       £788.4m
Gearing range as a % of net assets:                  0-15%
Net gearing including income (debt at par):          7.6%
Ongoing charges ratio (actual)4:                     0.7%
Ordinary shares in issue5:                           48,202,292

 1. Includes net revenue of 22.54p
 2. Yield calculations are based on dividends announced in the last 12 months as
at the date of release of this announcement and comprise the first interim
dividend of 15.00 pence per share (announced on 26 October 2023, ex-dividend on
2 November 2023, and paid on 4 December 2023) and the final dividend of 25.50
pence per share (announced on 05 May 2023, ex-date on 18 May 2023, and paid 27
June 2023).
 3. Includes current year revenue.
 4. The Company's ongoing charges are calculated as a percentage of average
daily net assets and using the management fee and all other operating expenses
excluding finance costs, direct transaction costs, custody transaction charges,
VAT recovered, taxation and certain non-recurring items for year ended 28
February 2023.
 5. Excludes 1,791,231 ordinary shares held in treasury.

Sector Weightings       % of portfolio
Industrials             33.3
Consumer Discretionary  19.4
Financials              16.4
Basic Materials         8.6
Technology              7.9
Consumer Staples        4.1
Energy                  2.9
Telecommunications      2.5
Real Estate             2.1
Health Care             1.5
Communication Services  1.3
                        -----
Total                   100.0
                        =====

Country Weightings  % of portfolio
United Kingdom      98.4
United States       1.0
Ireland             0.6
                    -----
Total               100.0
                    =====

Ten Largest Equity Investments  % of portfolio
Company
Gamma Communications            2.5
Workspace Group                 2.3
Hill & Smith                    2.2
Chemring Group                  2.1
4imprint Group                  2.1
CVS Group                       2.1
YouGov                          2.1
Watches of Switzerland          1.9
Bloomsbury Publishing           1.9
Breedon                         1.9

Commenting on the markets, Roland Arnold, representing the Investment Manager
noted:
During December the Company's NAV per share rose by 8.3% to 1,537.31p on a total
return basis, while our benchmark index returned 8.5%. For comparison the large
cap FTSE 100 Index lagged small & mid-caps for a second consecutive month,
returning 3.9%.

December proved to be a strong end to 2023, with equity markets reacting to
continued falls in inflation, further normalisation in the jobs market, and the
narrative of central bank pivots. This resulted in further decline in US 10-year
treasury rate from 4.95% to 3.88% in one month, and a broad rally for equity
markets. In the US the Federal Reserve (Fed), in its last meeting of the year,
sent a signal that it would begin cutting interest rates in 2024. Although the
US payrolls data in November painted a picture of a labour market gradually
cooling, wage growth was still too high to be consistent with inflation falling
back to the Fed's 2% policy target and the unemployment rate ticked lower. In
addition, though the US Consumer Price Index (CPI) for November largely matched
expectations, it showed that core services inflation was proving to be sticky.
The European Central Bank (ECB) and the Bank of England (BOE) signalled that
interest rate cuts remained some way off. In Europe, policymakers stuck to the
script of policy being set at sufficiently restrictive levels for as long as
necessary. In the UK, inflation plummeted to a two-year low of 3.9%, markets
predicted BOE interest rate cuts in 2024.

The attractive valuations of UK companies continued to catch the eyes of
strategic buyers through December, with bowling alley operator Ten Entertainment
being the latest target. The company soared after receiving a bid from US
private equity group, Trive Capital. Similarly, our holding in GlobalData caught
the attention of private equity group, Inflexion, which is acquiring a 40% stake
in GlobalData's Healthcare operation. The deal will net the company £434m, which
will be used to fund further acquisitions. Shares in IntegraFin, operator of the
UK investment platform Transact, rose in response to solid full year results,
demonstrating the strength of its platform and ability to take market share
against a challenging backdrop.

The strength of the market rally during December created a headwind to
performance, with a number of the largest detractors to performance coming from
shares in the benchmark that we do not own that outperformed; Paragon, Carnival
and Smart Metering Systems, were all up between 25%-45%. While there will always
be periods where shares that we don't own (rightly or wrongly) rally, it is
particularly frustrating when the largest three relative detractors fall into
this bucket. Shares in digital payments business Boku, underperformed the market
during December. There was no negative news flow that impacted the shares, and
post month end the shares have rebounded.

Since the end of 2021 rising interest rates have been weighing on the valuations
of long-duration, higher growth shares in the stock market. As a result, UK
small & mid-caps have continued to underperform large caps and we are now in the
deepest and longest cycle of underperformance in recent history; worse than the
Global Financial Crisis, COVID, Brexit, Tech sell-off or Black Monday. The
fourth quarter of 2023 saw markets reflect the expectation of rate cuts in 2024
in response to easing inflation data. However, as we have entered 2024, the
backup in bond yields has led to a volatile start to the year in equity markets.

Against this backdrop, the question remains, what is the catalysts for this
trend to change? Unfortunately, there is no simple answer. While there are many
headwinds to the UK SMID market; economic uncertainty, political uncertainty,
the structural flow issues in the UK market, the risk of more pervasive
inflation, to name a few, we remind ourselves and take comfort in the fact that
many of our holdings continue to deliver against their objectives. Furthermore,
we believe we are closer to the end of monetary tightening and at some point, we
are confident that investors will decide the balance of probabilities is in
favour of the opportunities, that the risks are more than adequately priced in,
and that an increased allocation to UK Small and Midcaps is warranted.

As ever, we remain focused on the micro, industry level change and stock
specific analysis and the opportunities we are seeing today in our universe are
as exciting as ever. Historically, periods of heightened volatility have been
followed by strong returns for the strategy and presented excellent investment
opportunities.

We thank shareholders for your ongoing support.

     1Source: BlackRock as at 31 December 2023

22 January 2023

ENDS

Latest information is available by typing www.blackrock.com/uk/brsc on the
internet, "BLRKINDEX" on Reuters, "BLRK" on Bloomberg or "8800" on Topic 3 (ICV
terminal).  Neither the contents of the Manager's website nor the contents of
any website accessible from hyperlinks on the Manager's website (or any other
website) is incorporated into, or forms part of, this announcement.


This information was brought to you by Cision http://news.cision.com


END
(END) Dow Jones Newswires
January 22, 2024 09:35 ET (14:35 GMT)
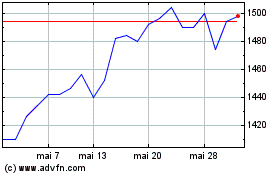
Blackrock Smaller (LSE:BRSC)
Gráfico Histórico do Ativo
De Nov 2024 até Dez 2024

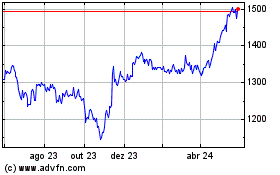
Blackrock Smaller (LSE:BRSC)
Gráfico Histórico do Ativo
De Dez 2023 até Dez 2024
