Victoria PLC - Interim Results
23 Novembro 1999 - 5:01AM
UK Regulatory
RNS Number:2420B
Victoria PLC
23 November 1999


Victoria P.L.C. - Interim Results For The Six Months To 2
October 1999


CHAIRMAN'S STATEMENT

RESULTS
I am pleased to report that, notwithstanding difficult trading
conditions  in the UK, we have achieved a continuing  increase
in  profits and earnings for the six months to 2 October 1999.
Profit  before tax is 32.2% higher than last year, at #624,000
(1998: #472,000). Earnings per share increased 28.9% to  5.94p
(1998: 4.61p).

Cashflow  remained strongly positive, with net  borrowings  at
the  end  of the period of #4.08 million (1998: #5.49 million)
representing gearing of 23.3% (1998: 34.5%).

UNITED KINGDOM
The  UK  market  remained subdued for the first  half  of  our
financial  year, and our sales in this market reflected  these
difficult  market  conditions. The fact that  our  competitors
have   found  the  market  equally  difficult  is  of   little
consolation.  Our response to these poor market conditions  is
to  manage  our product offering and service levels to  secure
the  best possible share of trade. Our new Tudor Twist product
introduced  on 1 June this year has already proved  to  be  an
outstanding success and further new products are scheduled for
launch in the second half year.

During  the  period,  we  have  also  joined  with  other   UK
manufacturers in forming the Carpet Foundation to promote  the
attractions of carpet to consumers.

Exports  from  the  UK have continued to be difficult  as  the
pound  has  remained  strong  and  price-led  competition  has
intensified. Although our export sales were lower than in  the
first half of last year, we remain committed to these markets.

Westwood Yarns has continued to contribute strongly,  and  its
high quality yarns are a source of advantage to the group.

AUSTRALIA
The  Australian  market  has been buoyant  during  the  period
resulting in higher sales than last year. This has  led  to  a
good  increase  in  profitability,  particularly  due  to  the
increased  spinning  capacity  installed  at  Castlemaine   in
November 1998 being used for the full six month period.

CANADA
After  a  very  strong performance in the first half  of  last
year,  the  Canadian market quietened down during  the  second
half and continued quieter during the first half of this year.
This  has  led  to a reduced contribution from our  associated
company, Colin Campbell & Sons compared to last year.

PROPERTY
We  continue  to make good progress on the sale of  our  Green
Street property and further information on this is set out  in
a circular to shareholders which will be posted today. Since I
last  reported  to  you  at the AGM, we have  secured  outline
planning  consent for the development of the  site.  This  has
taken  some five years overall and now opens the way  for  the
sale to be completed, subject to shareholders' consent.

The  complete  relocation from the Green Street property  onto
one site has long been an objective of the Company because  of
the increase in operational efficiency which will result. With
the  building  work at Worcester Road now nearing  completion,
the old site should be vacated before the end of the financial
year,  allowing us to secure these benefits and  clearing  the
way for completion of the sale.

CAPITAL EXPENDITURE
Capital  expenditure  of  #1.94  million  during  the   period
included on the new IT system in the UK and new plant  in  the
UK  and  Australia, together with stage payments  on  the  new
office and factory buildings at our main manufacturing site in
Kidderminster.

We  are determined to continue investing in the future of  the
business  and have recently taken the decision to  expand  the
capacity  of  our  Australian spinning mill.  This  Australian
Dollar  6.63 million (#2.65 million) project will  reduce  the
dependence of the carpet mill on outside spinners and  at  the
same  time  provide additional profits. Work on  this  project
will commence during the second half of this financial year.

PROSPECTS
In  the  UK,  it  is encouraging to us that despite  the  poor
trading conditions to which I referred earlier, current  sales
levels have improved over recent weeks. Orders are now running
at  a  higher level than last year and our new product ranges,
which are impacting on both our UK subsidiaries, are exceeding
our expectations.

Although  the  Australian market has now returned  to  a  more
normal  state  after the very active first few months  of  the
year,  we  still  expect to see a continuing good  performance
from Australia.

Over the near future we expect to see additional benefits from
the   current  and  proposed  investments  in  the   business,
particularly  the  major  projects in site  consolidation  and
increased  spinning capacity. This policy  of  reinvesting  to
maintain  and  further  develop  our  strong  market  position
underpins  our  confidence in the continued  progress  of  the
Group.

R. M. GILBERT
Chairman
23 November 1999


GROUP PROFIT AND LOSS ACCOUNT


                              Six months  Six months   Year to
                                      to          to
                               2 October          30   3 April
                                           September
                                    1999        1998      1999
                               Unaudited   Unaudited   Audited
                        Note        #000        #000      #000

Turnover                          16,901      17,096    34,800
Cost of sales                     12,188      12,318    25,033
                                --------    --------  --------
Gross profit                       4,713       4,778     9,767
Distribution costs                 3,084       3,142     5,850
Administration costs               1,086       1,044     2,279
Other operating income               270         104       272
                                --------    --------   -------
Operating profit                     813         696     1,910
Interest payable                     204         260       446
Share of profits of
associated undertaking                15          36        40
                                 -------     -------   -------
Profit on ordinary
activities before                    624         472     1,504
taxation
Taxation on profit on
ordinary activities                  217         156       493
                                 -------     -------   -------
Profit for the period                407         316     1,011
Dividends proposed                     -           -       309
                                 -------     -------   -------

Retained earnings                    407         316       702
                                --------     -------   -------
Earnings per share -       2       5.94p       4.61p    14.73p
basic
Earnings per share -               5.90p       4.59p    14.63p
diluted
Dividends per share        3           -           -     4.50p
                                --------     -------   -------


CONSOLIDATED BALANCE SHEET

                              Six months  Six months   Year to
                                      to          to
                               2 October          30   3 April
                                           September
                                    1999        1998      1999
                               Unaudited   Unaudited   Audited
                                    #000        #000      #000

Fixed assets
Tangible assets                   13,762      11,997    12,379
Investment in associated             212         217       215
undertaking                      -------     -------   -------
                                  13,974      12,214    12,594
Current assets
Stock                              8,849       9,154     9,135
Debtors                            6,066       6,027     5,714
Cash                                 229          15       169
                                 -------     -------   -------
                                  15,144      15,196    15,018

Creditors - amounts falling
due within one year
- Borrowings                     (2,417)     (3,833)   (2,342)
- Other                          (6,556)     (5,338)   (6,115)
                                 -------     -------   -------
Net current assets                 6,171       6,025     6,561
                                 -------     -------   -------
Total assets less current         20,145      18,239    19,155
liabilities
Creditors - amounts falling
due after
more than one year
- Borrowings                     (1,895)     (1,672)   (1,321)
- Other                             (70)        (63)      (70)
Provision for liabilities
and charges - deferred             (691)       (584)     (691)
taxation
Net assets                        17,489      15,920    17,073
                                --------     -------   -------
Capital and reserves
(equity)
Share capital                      1,715       1,715     1,715
Share premium account                749         749       749
Revaluation reserve                3,006       2,909     3,005
Profit and loss account           12,019      10,547    11,604
                                 -------     -------   -------

Total shareholders' funds         17,489      15,920    17,073
                                --------     -------   -------


CONSOLIDATED CASH FLOW STATEMENT

                              Six months  Six months  Year to
                                      to          to
                               2 October          30  3 April
                                           September
                                    1999        1998     1999
                               Unaudited   Unaudited  Audited
                                    #000        #000     #000

Operating profit                     813         696    1,910
Depreciation charges                 556         521    1,035
Profit on sale of fixed             (61)         (3)     (12)
assets
Decrease/(Increase) in               466         954    1,714
working capital
Exchange rate difference on
consolidation                          4       (501)     (89)
Net cash inflow from
operating activities               1,778       1,667    4,558
                                --------    --------  -------
Returns on investment and
servicing of finance
Interest paid                      (100)       (199)    (336)
Hire purchase interest             (104)        (61)    (110)
                                   (204)       (260)    (446)
                                --------    --------  -------
Taxation
UK corporation tax (paid)              -        (42)    (219)
Overseas tax paid                      -           -        -
                                       -        (42)    (219)
                                --------    --------  -------
Capital expenditure and
financial investment
Payments to acquire tangible
fixed assets                     (1,939)       (587)  (1,055)
Receipts from sales of
tangible fixed assets                 67          24       79
Return of capital in
associated undertaking                19          12       12
                                 (1,853)       (551)    (964)
Equity dividends paid              (309)       (240)    (240)
                                --------    --------  -------
Financing
Debt due within one year
  Repayment of secured loans          99       (168)    (168)
Increase in long term loans          457         322     (93)
Capital element of hire
purchase payments                  (259)       (262)    (547)
Receipts from financing of           273          40       80
assets
                                     570        (68)    (728)
Increase / (decrease) in            (18)         506    1,961
cash                            --------    --------  -------


NOTES TO THE INTERIM STATEMENTS

1. Basis of preparation
   The  results for the year ended 3 April 1999 are  extracts
   from  the  Group  report and accounts as  filed  with  the
   Registrar  of  Companies. These were audited and  reported
   upon  without  qualification  under  section  235  of  the
   Companies Act 1985.

2. Earnings per share
   The  earnings  per  share are based on 6,860,556  ordinary
   shares in issue throughout each period.

3. Dividends
   No interim dividend is proposed.


Enquiries:

Alan R Bullock                  Mark Lee
Group Managing Director         Group Finance Director
Victoria P.L.C.                 Victoria P.L.C.
Tel: 01562 823400               Tel: 01562 823400

John Folliott Vaughan           Fiona Tooley
Director of Corporate Finance   Director
Albert E Sharp Securities       Citigate Dewe Rogerson Ltd.
Tel: 0121 683 7212              Tel: 0121 631 2299

End

IR GLMZMVZRLLMM
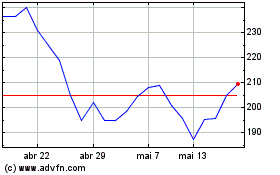
Victoria (LSE:VCP)
Gráfico Histórico do Ativo
De Jun 2024 até Jul 2024

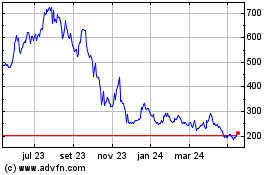
Victoria (LSE:VCP)
Gráfico Histórico do Ativo
De Jul 2023 até Jul 2024
