Victoria PLC Half-Year Results -2-
29 Novembro 2012 - 5:00AM
UK Regulatory
As at 29 September 2012 (unaudited)
                                            As at         As at          As at
                                      29 Sep 2012    1 Oct 2011    31 Mar 2012
                                           GBP000        GBP000         GBP000
----------------------------------  -------------  ------------  -------------

 Non-current assets
 Intangible assets                            742           778            742
 Property, plant and equipment             24,132        25,368         24,978
 Investment property                          180           180            180
 Investment in associated company             636           559            558
 Deferred tax asset                           805           823            812
----------------------------------
 Total non-current assets                  26,495        27,708         27,270
----------------------------------  -------------  ------------  -------------

 Current assets
 Inventories                               25,435        26,066         25,966
 Trade and other receivables               12,215        12,562         11,676
 Current tax asset                            216          ----           ----
 Cash at bank and in hand                   1,576           769            806
 Total current assets                      39,442        39,397         38,448
----------------------------------
 Total assets                              65,937        67,105         65,718
----------------------------------  -------------  ------------  -------------

 Current liabilities
 Trade and other payables                  14,661        14,865         13,467
 Current tax liabilities                     ----           426             31
 Financial liabilities                      9,567         7,851          8,165
----------------------------------
 Total current liabilities                 24,228        23,142         21,663
----------------------------------  -------------  ------------  -------------

 Non-current liabilities
 Trade and other payables                   2,040         2,387          2,253
 Other financial liabilities                  355           931            388
 Deferred tax liabilities                     773         1,395          1,094
 Total non-current liabilities              3,168         4,713          3,735
----------------------------------  -------------  ------------  -------------

 Total liabilities                         27,396        27,855         25,398
 Net assets                                38,541        39,250         40,320
----------------------------------  -------------  ------------  -------------

 Equity
 Issued share capital                       1,758         1,736          1,736
 Share premium                                829           829            829
 Retained earnings                         35,764        36,500         37,575
 Share-based payment reserve                  190           185            180
----------------------------------  -------------  ------------  -------------
 Total equity                              38,541        39,250         40,320
----------------------------------  -------------  ------------  -------------
Condensed Consolidated Statement of Changes in Equity
For the 26 weeks ended 30 September 2012 (unaudited)
                                      Share     Share   Retained   Share based     Total
                                    capital   premium   earnings       payment    equity
                                                                       reserve
                                     GBP000    GBP000     GBP000        GBP000    GBP000
---------------------------------  --------  --------  ---------  ------------  --------
 At 3 April 2011                      1,736       829     37,067           130    39,762
 Profit for the period                 ----      ----        802          ----       802
 Other comprehensive loss for
  the period                           ----      ----      (952)          ----     (952)
 Dividends paid                        ----      ----      (417)          ----     (417)
 Movement in share-based payment
  reserve                              ----      ----       ----            55        55
 At 1 October 2011                    1,736       829     36,500           185    39,250
---------------------------------  --------  --------  ---------  ------------  --------

 At 3 April 2011                      1,736       829     37,067           130    39,762
 Profit for the period                 ----      ----      1,086          ----     1,086
 Other comprehensive income
  for the period                       ----      ----         72          ----        72
 Dividends paid                        ----      ----      (660)          ----     (660)
 Movement in share-based payment
  reserve                              ----      ----       ----            50        50
 Deferred tax on share option
  scheme                               ----      ----         10          ----        10
---------------------------------
 At 31 March 2012                     1,736       829     37,575           180    40,320
---------------------------------  --------  --------  ---------  ------------  --------

 At 1 April 2012                      1,736       829     37,575           180    40,320
 Loss for the period                   ----      ----    (1,113)          ----   (1,113)
 Other comprehensive loss for
  the period                           ----      ----      (212)          ----     (212)
 Dividends paid                        ----      ----      (486)          ----     (486)
 Movement in share-based payment
  reserve                              ----      ----       ----            32        32
 Issue of share capital in
  connection with exercise of
  share options under LTIP plan          22      ----       ----          (22)      ----
---------------------------------  --------  --------  ---------  ------------  --------
 At 29 September 2012                 1,758       829     35,764           190    38,541
---------------------------------  --------  --------  ---------  ------------  --------
Condensed Consolidated Statement of Cash Flows
For the 26 weeks ended 29 September 2012 (unaudited)
                                                      26 weeks      26 weeks       52 weeks
                                                         ended         ended          ended
                                                   29 Sep 2012    1 Oct 2011    31 Mar 2012
                                          Notes         GBP000        GBP000         GBP000
---------------------------------------  ------  -------------  ------------  -------------
 Net cash inflow/(outflow) from
  operating activities                     8a              517         (185)            885
---------------------------------------  ------  -------------  ------------  -------------

 Investing activities
 Purchases of property, plant
  and equipment                                          (652)         (898)        (1,464)
 Acquisition of intangible assets                         ----         (400)          (400)
 Proceeds on disposal of property,
  plant and equipment                                       15           103             85
 Net cash used in investing activities                   (637)       (1,195)        (1,779)
---------------------------------------  ------  -------------  ------------  -------------

 Financing activities
 Repayment of loans                                       ----         (312)          (973)
 Receipts from financing of assets                          67           195            321
 Repayment of obligations under
  finance leases/HP                                      (246)         (440)          (872)
 Dividends paid                                          (486)         (417)          (660)
 Net cash used in financing activities                   (665)         (974)        (2,184)
---------------------------------------  ------  -------------  ------------  -------------

 Net decrease in cash and cash
  equivalents                                            (785)       (2,354)        (3,078)

 Cash and cash equivalents at
  beginning of period                                  (6,920)       (3,866)        (3,866)

 Effect of foreign exchange rate
  changes                                                    2          (47)             24
---------------------------------------  ------  -------------  ------------  -------------
 Cash and cash equivalents at
  end of period                            8b          (7,703)       (6,267)        (6,920)
---------------------------------------  ------  -------------  ------------  -------------
Notes to the Condensed Half-year Financial Statements
For the 26 weeks ended 29 September 2012 (unaudited)
1. General information
These condensed consolidated financial statements for the 26
weeks ended 29 September 2012 have not been audited or reviewed by
the Auditor. They were approved by the Board of Directors on 28
November 2012.
The information for the 52 weeks ended 31 March 2012 does not
constitute statutory accounts as defined in Section 434 of the
Companies Act 2006. A copy of the statutory accounts for that year
has been delivered to the Registrar of Companies. The Auditor's
report on those accounts was unqualified and did not include a
reference to any matter to which the Auditor drew attention by way
of emphasis without qualifying the report and did not contain
statements under Section 498(2) or 498(3) of the Companies Act
2006.
2. Basis of preparation and accounting policies
These condensed consolidated financial statements should be read
in conjunction with the Group's financial statements for the 52
weeks ended 31 March 2012, which were prepared in accordance with
IFRSs as adopted by the European Union.
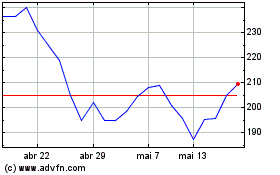
Victoria (LSE:VCP)
Gráfico Histórico do Ativo
De Jun 2024 até Jul 2024

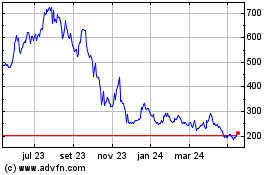
Victoria (LSE:VCP)
Gráfico Histórico do Ativo
De Jul 2023 até Jul 2024
