O�Reilly Automotive, Inc. (�O�Reilly� or �the Company�) (Nasdaq:
ORLY) today announced revenues and earnings for the first quarter
ended March 31, 2008. Sales for the three months ended March 31,
2008, totaled $646 million, up 5.4% from $613 million for the same
period a year ago. Gross profit for the first quarter of 2008
increased to $288 million (or 44.6% of sales) from $269 million (or
43.9% of sales) for the first quarter of 2007, representing an
increase of 7.1%. Selling, General and Administrative expenses
increased to $214 million (or 33.2% of sales) for the first quarter
of 2008 from $192 million (or 31.3% of sales) for the first quarter
of 2007, representing an increase of 11.6%. Net income for the
first quarter ended March 31, 2008, totaled $46.3 million, down
4.3% from $48.4 million for the same period in 2007. Diluted
earnings per common share for the first quarter of 2008 decreased
4.8% to $0.40 on 116.3 million shares compared to $0.42 for the
first quarter of 2007 on 115.5 million shares. �With softer sales
resulting from a very challenging macro environment, our first
quarter results were short of our expectations. However, even in
the midst of these obstacles, we were able to increase gross profit
to 44.6% of sales.� Greg Henslee, CEO and Co-President stated,
�Although customer demand in our markets during the first quarter
was sluggish, we continue to see opportunity to expand our market
share on both the DIY and DIFM sides of our business. We remain
excited about our upcoming acquisition of CSK Auto Corporation
(�CSK�) and look forward to implementing our dual market strategy
in CSK�s markets. Team O�Reilly will remain focused on our core
values of customer service and expense control as we move forward
in 2008.� Comparable store sales for stores open at least one year
decreased 0.4% for the first quarter of 2008 compared to a 6.8%
increase in the first quarter of 2007. �We opened 37 new stores
during the first quarter and are on track to hit our revised target
of 140 to 150 new stores in 2008,� stated Ted Wise, COO and
Co-President. �As we expand in 2008, our Team remains dedicated to
the O�Reilly culture and values that have made us successful for
over 50 years. Our goal to be the dominant supplier in each of our
markets continues to be our top priority, and we will continue to
move toward that goal by providing industry leading customer
service and parts availability. This will be a historical year for
O�Reilly as we look forward to completing the CSK acquisition and
beginning the integration process.� Assuming no significant change
in the macroeconomic environment, the Company estimates that
diluted earnings per share for the second quarter of 2008 will be
approximately $0.47 to $0.51 with an expected comparable store
sales increase of 3% to 5%. The Company projects full-year earnings
to range from $1.81 to $1.85 per share, which has been adjusted
slightly downward from the original guidance provided on February
20, 2008 of $1.84 to $1.88 per share, with an expected comparable
store sales increase of 3% to 5%. The Company will host a
conference call Wednesday, April 23, 2008, at 10:00 a.m. central
time to discuss its results as well as future expectations.
Investors may listen to the conference call live on the Company�s
web site, www.oreillyauto.com, by clicking on �Investor Relations�
then �News Room.� A replay of the call will also be available on
the Company�s website following the conference call. We invite
interested analysts to join our call. The dial-in number for the
call is (706) 643-0114, the conference call ID number is 42380760.
O�Reilly Automotive, Inc. is one of the largest specialty retailers
of automotive aftermarket parts, tools, supplies, equipment and
accessories in the United States, serving both the do-it-yourself
and professional installer markets. Founded in 1957 by the O�Reilly
family, the Company operated 1,867 stores in the states of Alabama,
Arkansas, Florida, Georgia, Illinois, Indiana, Iowa, Kansas,
Kentucky, Louisiana, Minnesota, Mississippi, Missouri, Montana,
Nebraska, North Carolina, North Dakota, Ohio, Oklahoma, South
Carolina, South Dakota, Tennessee, Texas, Virginia, Wisconsin and
Wyoming as of March 31, 2008. The Company claims the protection of
the safe-harbor for forward-looking statements within the meaning
of the Private Securities Litigation Reform Act of 1995. These
statements can be identified by forward-looking words such as
�expect,� �believe,� �anticipate,� �should,� �plan,� �intend,�
�estimate,� �project,� �will� or similar words. In addition,
statements contained within this press release that are not
historical facts are forward-looking statements, such as statements
discussing among other things, expected growth, store development
and expansion strategy, business strategies, future revenues and
future performance. These forward-looking statements are based on
estimates, projections, beliefs and assumptions and are not
guarantees of future events and results. Such statements are
subject to risks, uncertainties and assumptions, including, but not
limited to, competition, product demand, the market for auto parts,
the economy in general, inflation, consumer debt levels,
governmental approvals, our ability to hire and retain qualified
employees, risks associated with the integration of acquired
businesses, weather, terrorist activities, war and the threat of
war. Actual results may materially differ from anticipated results
described or implied in these forward-looking statements. Please
refer to the Risk Factors sections of the Company�s Form 10-K for
the year ended December 31, 2007, for more details. O�REILLY
AUTOMOTIVE, INC. AND SUBSIDIARIES CONDENSED CONSOLIDATED BALANCE
SHEETS (In thousands, except share data) � � March 31,2008 March
31,2007 December 31,2007 (Unaudited) (Unaudited) (Note) Assets
Current assets: Cash and cash equivalents $ 113,287 $ 90,217 $
47,555 Accounts receivable, net 93,123 87,309 84,242 Amounts
receivable from vendors 47,293 46,828 48,263 Inventory 892,583
825,206 881,761 Other current assets � 20,331 � � 21,129 � 40,483 �
Total current assets 1,166,617 1,070,689 1,102,304 � Property and
equipment, at cost 1,534,819 1,276,410 1,479,779 Accumulated
depreciation and amortization � 408,856 � � 345,319 � 389,619 � Net
property and equipment 1,125,963 931,091 1,090,160 � Notes
receivable, less current portion 24,253 29,151 25,437 Goodwill
50,583 49,312 50,447 Other assets � 30,320 � � 13,385 � 11,389 �
Total assets $ 2,397,736 � $ 2,093,628 $ 2,279,737 � � Liabilities
and shareholders' equity Current liabilities: Accounts payable $
417,128 $ 372,061 $ 380,683 Accrued payroll 27,445 25,130 23,739
Accrued benefits and withholdings 46,536 44,905 43,463 Deferred
income taxes 10,364 10,111 6,235 Other current liabilities 61,530
44,996 49,536 Current portion of long-term debt � 25,323 � � 312 �
25,320 � Total current liabilities 588,326 497,515 528,976 �
Long-term debt, less current portion 75,068 100,390 75,149 Deferred
income taxes 26,651 32,297 27,241 Other liabilities 56,678 42,941
55,894 � Shareholders' equity: Common stock, $0.01 par value:
Authorized shares � 245,000,000 Issued and outstanding shares �
115,481,606 as of March 31, 2008, 114,126,459 as of March 31, 2007
and 115,260,564 as of December 31, 2007 1,155 1,141 1,153
Additional paid-in capital 448,173 408,532 441,731 Retained
earnings 1,202,724 1,010,812 1,156,393 Accumulated other
comprehensive loss � (1,039 ) � -- � (6,800 ) Total shareholders�
equity � 1,651,013 � � 1,420,485 � 1,592,477 � Total liabilities
and shareholders� equity $ 2,397,736 � $ 2,093,628 $ 2,279,737 � �
Note: The balance sheet at December 31, 2007 has been derived from
the audited consolidated financial statements at that date, but
does not include all of the information and footnotes required by
accounting principles generally accepted in the United States for
complete financial statements. O'REILLY AUTOMOTIVE, INC. AND
SUBSIDIARIES CONDENSED CONSOLIDATED STATEMENTS OF INCOME
(Unaudited) (In thousands, except per share data) � Three Months
Ended March 31, 2008 � 2007 � Sales $ 646,220 $ 613,145 Cost of
goods sold, including warehouse and distribution expenses � 357,726
� 343,864 � Gross profit 288,494 269,281 Selling, general and
administrative expenses � 214,338 � 192,089 � Operating income
74,156 77,192 Other expense, net � 450 � 10 � Income before income
taxes 73,706 77,182 Provision for income taxes � 27,375 � 28,775 �
Net income $ 46,331 $ 48,407 � Net income per common share $ 0.40 $
0.42 � Net income per common share � assuming dilution $ 0.40 $
0.42 � Weighted-average common shares outstanding � 115,386 �
113,936 Adjusted weighted-average common shares outstanding �
assuming dilution � 116,291 � 115,537 O'REILLY AUTOMOTIVE, INC. AND
SUBSIDIARIES CONDENSED CONSOLIDATED STATEMENTS OF CASH FLOWS
(Unaudited) (In thousands) � Three Months Ended March 31, 2008 �
2007 � Net cash provided by operating activities $ 118,854 $
128,631 � Investing activities: Purchases of property and equipment
(59,186 ) (64,089 ) Proceeds from sale of property and equipment
1,367 223 Payments received on notes receivable 1,193 1,132 Other �
48 � � (1,402 ) � Net cash used in investing activities (56,578 )
(64,136 ) � Financing activities: Proceeds from issuance of
long-term debt -- 16,450 Tax benefit of stock options exercised 549
1,418 Principal payments of long-term debt (79 ) (26,226 ) Net
proceeds from issuance of common stock � 2,986 � � 4,177 � � Net
cash provided by/(used in) financing activities 3,456 (4,181 ) �
Net increase in cash and cash equivalents 65,732 60,314 Cash and
cash equivalents at beginning of period � 47,555 � � 29,903 � �
Cash and cash equivalents at end of period $ 113,287 � $ 90,217 �
O'REILLY AUTOMOTIVE, INC. AND SUBSIDIARIESSELECTED FINANCIAL
INFORMATION(Unaudited) � March 31, 2008 � 2007 � Inventory turnover
(1) 1.6 1.6 Inventory turnover, net of payables (2) 3.0 2.8 � AP to
inventory (3) 46.7% 45.1% Debt-to-capital (4) 5.7% 6.6% Return on
equity (5) 12.2% 13.9% Return on assets (6) 8.4% 9.4% Three Months
Ended March 31, 2008 � 2007 Other Information (in thousands):
Capital Expenditures $ 59,186 $ 64,089 Depreciation and
Amortization $ 21,492 $ 17,436 Interest Expense $ 1,371 $ 749 Lease
and Rental Expense $ 14,861 $ 13,694 � Sales per weighted-average
square foot (7) $ 50.71 $ 53.82 � Square footage (in thousands)
12,735 11,339 � Sales per weighted-average store (in thousands) (8)
$ 346 $ 361 � Store count: New stores, net (9) 37 47 Total stores
1,867 1,687 � Total employment 24,017 22,493 � (1) Calculated as
cost of sales for the last 12 months divided by average inventory.
Average inventory is calculated as the average of inventory for the
trailing four quarters used in determining the numerator. � (2)
Calculated as cost of sales for the last 12 months divided by
average net inventory. Average net inventory is calculated as the
average of inventory less accounts payable for the trailing four
quarters used in determining the numerator. � (3) Accounts payable
divided by inventory. � (4) The sum of long-term debt and current
portion of long-term debt, divided by the sum of long-term debt,
current portion of long-term debt and total shareholders' equity. �
(5) Last 12 months net income divided by average shareholders'
equity. Average shareholders' equity is calculated as the average
of shareholders' equity for the trailing four quarters used in
determining the numerator. � (6) Last 12 months net income divided
by average total assets. Average total assets is calculated as the
average total assets for the trailing four quarters used in
determining the numerator. � (7) Total sales less jobber sales,
divided by weighted-average square feet. Weighted-average sales per
square foot is weighted to consider the approximate dates of store
openings or expansions. � (8) Total sales less jobber sales,
divided by weighted-average stores. Weighted- average sales per
store is weighted to consider the approximate dates of store
openings or expansions. � (9) New stores, net reflects the closing
of 2 stores during the first quarter of 2008, there were no store
closings in the first quarter of 2007.
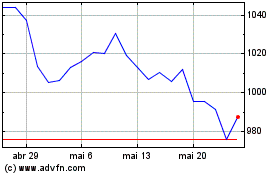
O Reilly Automotive (NASDAQ:ORLY)
Gráfico Histórico do Ativo
De Jun 2024 até Jul 2024

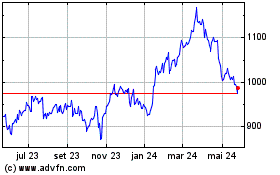
O Reilly Automotive (NASDAQ:ORLY)
Gráfico Histórico do Ativo
De Jul 2023 até Jul 2024
