Wynn Beats, Doubles Dividend - Analyst Blog
20 Abril 2011 - 5:52AM
Zacks
Wynn Resorts Ltd. (WYNN) reported its
first-quarter 2011 adjusted earnings of $1.38 per share,
comprehensively beating the Zacks Consensus Estimate of 73 cents
and the year-earlier earnings of 27 cents. On a GAAP basis, net
income was $173.8 million or $1.39 per share versus $27.0 million
or 22 cents per share recorded in the comparable quarter last
year.
The results were boosted by higher-than-expected revenues. Net
revenue climbed 38.7% year over year to $1,260.3 million outpacing
the Zacks Consensus Estimate of $1,133.0 million. The
outperformance was primarily attributable to its booming Macau
operations and improved performance at Las Vegas.
Macau Operations
Net revenue at Wynn Macau was $865.7 million, up 46.6% year over
year, primarily driven by a significant increase in table games
turnover in the VIP segment, which rose 44.7% from the prior-year
period to $29.3 billion.
The VIP table games win in the quarter was 2.69% based on
turnover, but was slightly below the expected range of 2.7% to 3.0%
and significantly higher than 2.70% recorded in the prior-year
quarter.
However, table games in the mass market category expanded 29.2%
year over year to $682.5 million. Mass market table games win rate
was 27.9%, well above the expected range of 21% to 23% and 22.2%
recorded in the year-earlier quarter.
Average daily rate (ADR) at Wynn Macau was $307, up from $282 in
the year-ago quarter. However, occupancy level plummeted to 88.6%
from 90.7% in the prior-year quarter.
Non-gaming revenues at Wynn Macau shot up 50.2% to $94.2 million
from the prior-year quarter, primarily aided by higher hotel and
retail revenues. These revenues leaped 79.1% and 37.7%,
respectively, driven by the addition of Encore rooms and three new
boutiques at Encore. Retail revenues benefited from strong
same-store sales growth.
Including Encore, Wynn Resorts currently boasts 499 tables (263
VIP tables, 225 mass market tables and 11 poker tables) and 1,015
slot machines in Macau.
Las Vegas Operations
Wynn Resorts’ revenue from Las Vegas operations increased 24.0%
year over year to $394.6 million. Net casino revenue was $194.2
million, up 39.2% from the prior-year period. Gross non-casino
revenues grew 10.8% year over year to $249.0 million, driven by
increased revenues from all non-gaming segments.
With the global economy recovering gradually, Wynn reported an
upside in room revenues, which jumped 13.4% year over year to $88.0
million. ADR also rose 18.2%, but occupancy fell 1.7%, due to 2.3%
fewer rooms available for sale during the quarter, due to the
remodeling of the rooms at Wynn Las Vegas. This room remodeling is
expected to be completed in the second quarter of 2011.
Balance Sheet
Exiting the quarter, Wynn Resorts’ total cash balances were $1.4
billion. Total debt outstanding was $3.2 billion, including
approximately $2.6 billion of the Wynn Las Vegas debt and $551
million of the Wynn Macau debt.
During the quarter, company also doubled its quarterly dividend
to 50 cents per share. The dividend will be payable on May 17, 2011
to shareholders of record as of May 3, 2011.
Our Take
We remain optimistic on the company based on its improving
fundamental growth prospects. Wynn Macau’s contribution to the
company’s earnings has increased significantly in the last few
years.
Moreover, business at Las Vegas is also rebounding with
increased room rates and conventional bookings. Hence, based on the
strong first quarter results and dividend hike, we expect estimates
to go up in the coming days.
Wynn Resorts’ close competitor MGM Resorts
International (MGM) will release its first-quarter 2011
earnings on May 2, 2011.
Wynn Resorts currently retains a Zacks #2 Rank, which translates
into a short-term Buy rating. We are also maintaining our long-term
Outperform recommendation on the stock.
MGM RESORTS INT (MGM): Free Stock Analysis Report
WYNN RESRTS LTD (WYNN): Free Stock Analysis Report
Zacks Investment Research
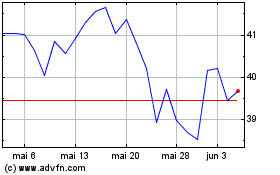
MGM Resorts (NYSE:MGM)
Gráfico Histórico do Ativo
De Jun 2024 até Jul 2024

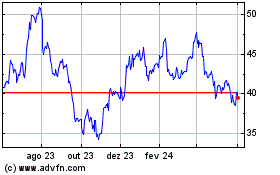
MGM Resorts (NYSE:MGM)
Gráfico Histórico do Ativo
De Jul 2023 até Jul 2024
