Wynn Resorts Misses in Q3 - Analyst Blog
20 Outubro 2011 - 9:30AM
Zacks
Wynn Resorts
Ltd. (WYNN) reported third quarter 2011 adjusted
earnings of $1.05 per share. The quarter’s earnings missed the
Zacks Consensus Estimate of $1.17 but improved considerably from 39
cents earned in the prior-year quarter. On a GAAP basis, earnings
per share were $1.01 versus a loss of 27 cents recorded in the
comparable quarter last year.
Net revenue climbed 29.1% year over
year to $1,298.3 million. The growth was primarily attributable to
the business boom in Macau and improved performance at Las
Vegas.
Macau
Operations
Net revenue at Wynn Macau was
$951.4 million, up 41.7% year over year, primarily driven by a
significant increase in the table games turnover in the VIP
segment, which rose 45.0% from the prior-year period to $31.4
billion.
The VIP table games win in the
quarter was 2.95% based on turnover, in line with the expected
range of 2.7% to 3.0% and higher than 2.88% recorded in the
prior-year quarter.
Table games in the mass market
category expanded 16.4% year over year to $704.3 million. The mass
market table games win rate was 27.7%, in line with the expected
range of 26% to 28% and above 22.8% recorded in the year-earlier
quarter.
Average daily rate (ADR) at Wynn
Macau was $315, up from $287 in the year-ago quarter. The
property’s occupancy level also leaped to 93.7% from 87.6% in the
prior-year quarter.
Non-gaming revenues at Wynn Macau
increased 32.4% to $102.6 million from the prior-year quarter aided
by solid performance from all non-casino segments. Including
Encore, Wynn Resorts currently boasts of 509 tables (286 VIP
tables, 212 mass market tables and 11 poker tables) and 943 slot
machines in Macau.
Las Vegas
Operations
Wynn Resorts’ revenue from Las
Vegas operations grew 3.7% year over year to $346.9 million. Net
casino revenue was $126.9 million, down 8.3% from the prior-year
period. Gross non-casino revenue grew 11.1% year over year to
$265.9 million, buoyed by improved revenues from all non-gaming
segments.
With the global economy recovering
gradually, Wynn reported an upside in room revenues, which jumped
18.7% year over year to $89.7 million. ADR also rose 14.2% to $240,
and occupancy increased 0.5 percentage points to 88.3%. During
the
quarter, Wynn had 3.1% of total rooms unavailable because of
an air rebalancing project, versus 6.2% of the rooms due to
renovations in the third quarter of 2010.
Balance Sheet
Exiting the quarter, Wynn Resorts’
total cash balance was $1.8 billion. Total debt outstanding was
$3.1 billion, including obligations of approximately $2.6 billion
for Wynn Las Vegas and $513.0 million for Wynn Macau.
Our Take
We remain positive on Wynn Resorts’
strong brand equity and strategic positioning to command a premium
rate relative to the overall gaming and lodging industry. Moreover,
we remain encouraged by the company’s healthy
balance sheet, relatively low capital requirements and ability to
execute in a difficult operating environment. The company’s recent
quarterly growth was entirely Macau driven as the performance at
Las Vegas was sluggish.
On the flip side, the competitive
environment at both at Macau and Las Vegas is heating up. The
company recently received its long-awaited approval from the Macau
Government for development at the Cotai Strip. Here too, Wynn
Resorts’ peer Las Vegas Sands Corp. (LVS) intends
to come up with a portion of its Parcel 5 and 6 developments in
2012, while another major competitor MGM Resorts
International (MGM) is also awaiting an approval for land.
These apart, there are domestic players also who are eager to tap
Cotai.
Accordingly, we have a Zacks #2
Rank (short-term Buy rating) on the shares. We also reiterate our
long-term Neutral recommendation.
LAS VEGAS SANDS (LVS): Free Stock Analysis Report
MGM RESORTS INT (MGM): Free Stock Analysis Report
WYNN RESRTS LTD (WYNN): Free Stock Analysis Report
WYNN RESRTS LTD (WYNN): Free Stock Analysis Report
Zacks Investment Research
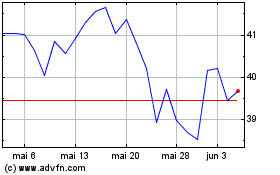
MGM Resorts (NYSE:MGM)
Gráfico Histórico do Ativo
De Jun 2024 até Jul 2024

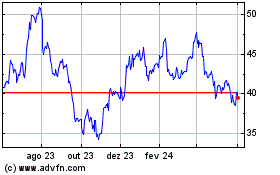
MGM Resorts (NYSE:MGM)
Gráfico Histórico do Ativo
De Jul 2023 até Jul 2024
