Standard Register Reports 2004 Fourth Quarter and Full-Year Results
DAYTON, Ohio, Feb. 21 /PRNewswire-FirstCall/ -- Standard Register
(NYSE:SR) today reported financial results for the fourth quarter
and full year 2004, ended January 2, 2005. Fourth Quarter Results
of Operations Total revenue on continuing operations for the fourth
quarter was $236.2 million, an increase of 6.8 percent over the
$221.1 million for the prior year. Net income for the quarter was
$13.4 million, or $0.47 per share, versus a net loss of $24.4
million, or $0.86 per share for the comparable 2003 quarter. As
previously announced, the Company sold its Equipment Service
business to Pitney Bowes near the end of the fourth quarter for
$16.8 million. Under the asset purchase agreement, the buyer
assumed selected operating liabilities and purchased substantially
all of the assets of the business, with the exception of
approximately $3.0 million in accounts receivable retained for
collection by Standard Register. The transaction produced a net
after tax gain of $12.8 million, equivalent to $0.45 per share. The
Company has reported the results of operations for the Equipment
Service business and the gain on its sale as a discontinued
operation. The following table, which presents information in a
non-GAAP format, is intended to facilitate a comparative analysis
of the fourth quarters of 2004 and 2003 by isolating the effect on
earnings of several noteworthy items. Effect on Fourth Quarter
Earnings [$ Millions] Continuing Operations 2004 2003 Change
Restructuring Expense -1.6 -3.9 2.3 Asset Impairment Expense -0.1
-5.1 5.0 Pension Loss Amortization -4.4 -2.3 -2.1 Pension
Settlement Expense -25.2 25.2 All Other Operations 6.5 3.2 3.3
Pretax Profit / (Loss) 0.4 -33.3 33.7 Income Tax 0.0 -11.8 11.8 Net
Profit /(Loss) 0.4 -21.5 21.9 Net Profit / (Loss) on Discontinued
Operations Operations 0.2 -2.9 3.1 Gain on Sale 12.8 12.8 Total
13.0 -2.9 15.9 Total Net Profit / (Loss) 13.4 -24.4 37.8 Fourth
quarter expenses for restructuring, asset impairment, pension loss
amortization, and pension settlement were $6.1 million in the
current year, versus $36.5 million in 2003. All other operations
contributed $6.5 million to pretax profits on continuing operations
in the quarter, compared to $3.2 million in the prior year. The
fourth quarter accounting calendar contained an extra week in 2004,
which on a pro-rata basis added an estimated $17 million to revenue
on continuing operations. "Adjusting for the extra week, the fourth
quarter reflected a continuation of a relatively stable revenue
trend established over the preceding five consecutive quarters,
which stands in stark contrast to the declines experienced in 2002
and 2003," said Dennis L. Rediker, president and chief executive
officer of Standard Register. "Excluding the effects of
restructuring and asset impairment expenses, our level of
profitability has improved in each successive quarter of this year,
reflecting the relatively stable revenue pattern and lower costs,"
added Rediker. Total Year Results of Operations Revenue on
continuing operations for 2004 was $890.2 million, compared to
$894.3 million for 2003. The net loss for the year was $30.2
million, or $1.06 per share, versus a net loss of $39.1 million, or
$1.38 per share. The following table, which presents information in
a non-GAAP format, is intended to facilitate a comparative analysis
of the total years 2004 and 2003 by isolating the effect on
earnings of several noteworthy items. Effect on Total Year Earnings
[$ Millions] Continuing Operations 2004 2003 Change Restructuring
Expense -13.6 -20.0 6.4 Asset Impairment Expense -48.5 -15.9 -32.6
Pension Loss Amortization -17.4 -8.5 -8.9 Pension Settlement
Expense -25.2 25.2 All Other Operations 6.4 8.1 -1.7 Pretax Profit
/ (Loss) -73.1 -61.5 -11.6 Income Tax -28.4 -23.5 -4.9 Net Profit
/(Loss) -44.7 -38.0 -6.7 Net Profit / (Loss) on Discontinued
Operations Operations 1.7 -1.1 2.8 Gain on Sale 12.8 12.8 Total
14.5 -1.1 15.6 Total Net Profit / (Loss) -30.2 -39.1 8.9
Restructuring, impairment, pension loss amortization, and pension
settlement expenses totaled $79.5 million in 2004, versus $69.6
million in 2003. All other operations contributed $6.4 million to
pretax profit on continuing operations in 2004, compared to $8.1
million in the previous year. "We succeeded in bringing relative
stability to the top line, but as a result of a competitive
marketplace, we have not yet recovered all of the paper cost
increases incurred during 2004 and our gross margin was lower,"
said Rediker. "Our on-going cost-reduction program has helped our
results, however, as indicated by SG&A expense to revenue
ratios that improved in each quarter as the year progressed," added
Rediker. Financial Condition Cash flow was strong in the quarter.
The balance of net debt, defined as total debt less cash and
short-term investments, declined by $30.3 million during the fourth
quarter. Excluding the $16.8 million in proceeds from the sale of
the Equipment Services business, net cash flow was a positive $13.5
million during the quarter - after satisfying $7.2 million in
capital expenditures, $2.7 million in restructuring spending, and
$6.6 million in dividend payments. Net cash flow, defined as the
change in net debt, improved in each quarter as the year progressed
and accumulated to a positive $12.4 million for the total year. At
year-end, net debt stood at $37.3 million, equivalent to 15.4
percent of total capital, reflecting a very strong financial
condition. Outlook "We anticipate that revenue for the first
quarter 2005 will come in below that for the just completed fourth
quarter, recognizing typical seasonal patterns and the extra week
in the 2004 fourth quarter, and we expect our total year revenue to
show modest growth on a 52-week fiscal year basis. We have made
good progress toward our previously announced goal to achieve a
five-point improvement in pretax operating profit as a percent of
revenue for the second half 2005, compared to the first half 2004,"
said Rediker. Presentation of Information in This Press Release
This press release presents information that excludes restructuring
and impairment expense, and amortization of prior years' pension
losses. These financial measures are considered non-GAAP. Generally
a non-GAAP financial measure is a numerical measure of a company's
performance, financial position, or cash flows where amounts are
either excluded or included not in accordance with generally
accepted accounting principles. Standard Register believes that
this information will enhance an overall understanding of its
financial performance due to the non-operational nature in the
above items and the significant change from period to period. The
presentation of non-GAAP information is not meant to be considered
in isolation or as a substitute for results prepared in accordance
with accounting principles generally accepted in the United States.
Conference Call Standard Register president and chief executive
officer Dennis L. Rediker, and chief financial officer Craig J.
Brown, will host a conference call at 9 a.m. EST on February 23,
2005, to review the fourth quarter and year-end results. The call
can be accessed via an audio webcast which is accessible at:
http://www.standardregister.com/investorcenter . About Standard
Register Standard Register (NYSE:SR) is a leading information
solutions company, with more than 90 years of innovation in
improving the way business gets done in healthcare, financial
services, manufacturing and other industries. The company helps
organizations increase efficiency, reduce costs, enhance security
and grow revenue by effectively capturing, managing and using
information. Its offerings range from document and label solutions
to e-business solutions to consulting and managed services. More
information is available at http://www.standardregister.com/ . Safe
Harbor Statement This report includes forward-looking statements
covered by the Private Securities Litigation Reform Act of 1995.
Because such statements deal with future events, they are subject
to various risks and uncertainties and actual results for fiscal
year 2005 and beyond could differ materially from the Company's
current expectations. Forward-looking statements are identified by
words such as "anticipates," "projects," "expects," "plans,"
"intends," "believes," "estimates," "targets," and other similar
expressions that indicate trends and future events. Factors that
could cause the Company's results to differ materially from those
expressed in forward-looking statements include, without
limitation, variation in demand and acceptance of the Company's
products and services, the frequency, magnitude and timing of paper
and other raw-material-price changes, general business and economic
conditions beyond the Company's control, timing of the completion
and integration of acquisitions, the consequences of competitive
factors in the marketplace, cost-containment strategies, and the
Company's success in attracting and retaining key personnel.
Additional information concerning factors that could cause actual
results to differ materially from those projected is contained in
the Company's filing with The Securities and Exchange Commission,
including its report on Form 10-K for the year ended December 28,
2003. The Company undertakes no obligation to revise or update
forward-looking statements as a result of new information since
these statements may no longer be accurate or timely. THE STANDARD
REGISTER COMPANY STATEMENT OF OPERATIONS (In Thousands, except Per
Share Amounts) Fourth Quarter Y-T-D 14 Weeks 13 Weeks 53 Weeks 52
Weeks Ended Ended Ended Ended 2-Jan-05 28-Dec-03 2-Jan-05 28-Dec-03
TOTAL REVENUE $236,162 $221,125 $890,249 $894,270 COST OF SALES
153,297 138,558 565,980 552,867 GROSS MARGIN 82,865 82,567 324,269
341,403 COSTS AND EXPENSES Research and Development 2,660 3,566
12,900 17,236 Selling, General and Administrative 66,355 91,755
276,995 300,598 Depreciation and Amortization 11,183 10,960 42,909
46,145 Goodwill impairment - - 47,059 - Asset Impairment 77 5,059
1,418 15,910 Restructuring 1,552 3,876 13,609 19,951 TOTAL COSTS
AND EXPENSES 81,827 115,216 394,890 399,840 INCOME (LOSS) FROM
CONTINUING OPERATIONS 1,038 (32,649) (70,621) (58,437) OTHER INCOME
(EXPENSE) Interest Expense (716) (779) (2,646) (4,055) Investment
and Other Income 77 87 209 982 Total Other Expense (639) (692)
(2,437) (3,073) INCOME (LOSS) FROM CONTINUING OPERATIONS BEFORE
INCOME TAXES 399 (33,341) (73,058) (61,510) Income Tax Expense
(Benefit) 56 (11,876) (28,362) (23,533) NET INCOME (LOSS) FROM
CONTINUING OPERATIONS 343 (21,465) (44,696) (37,977) DISCONTINUED
OPERATIONS Income (loss) from discontinued operations, net of taxes
195 (2,920) 1,658 (1,090) Gain on sale of discontinued operations,
net of taxes 12,820 - 12,820 - NET INCOME (LOSS) $13,358 ($24,385)
($30,218) ($39,067) Average Number of Shares Outstanding - Basic
and Diluted 28,543 28,543 28,536 28,320 BASIC AND DILUTED EARNINGS
(LOSS) PER SHARE Income (loss) from continuing operations $0.01
($0.76) ($1.57) ($1.34) Income (loss) from discontinued operations
0.01 (0.10) 0.06 (0.04) Gain on sale of discontinued operations
0.45 - 0.45 - Net income (loss) per share $0.47 ($0.86) ($1.06)
($1.38) Dividends Paid Per Share $0.23 $0.23 $0.92 $0.92 BALANCE
SHEET (In Thousands) 2-Jan-05 28-Dec-03 ASSETS Cash & Short
Term Investments $44,088 $76,959 Accounts Receivable 128,396
125,943 Inventories 51,796 49,757 Other Current Assets 27,960
31,247 Total Current Assets 252,240 283,906 Plant and Equipment
147,160 165,538 Goodwill and Intangible Assets 19,746 68,623
Deferred Taxes 86,505 74,209 Other Assets 37,322 36,681 Total
Assets $542,973 $628,957 LIABILITIES AND SHAREHOLDERS' EQUITY
Current Portion Long-Term Debt $80,549 $12 Current Liabilities
108,475 99,811 Deferred Compensation 16,832 15,526 Long-Term Debt
867 125,000 Retiree Healthcare 46,826 49,769 Pension Liability
83,273 89,608 Other Long-Term Liabilities 746 643 Shareholders'
Equity 205,405 248,588 Total Liabilities and Shareholders' Equity
$542,973 $628,957 DATASOURCE: Standard Register CONTACT: Media,
Julie McEwan, +1-937-221-1845, or , or Investors, Robert J.
Cestelli, +1-937-221-1304, or , both of Standard Register Web site:
http://www.standardregister.com/
http://www.standardregister.com/investorcenter
Copyright
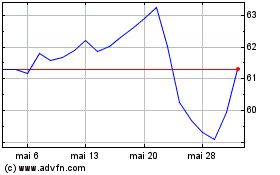
Spire (NYSE:SR)
Gráfico Histórico do Ativo
De Jun 2024 até Jul 2024

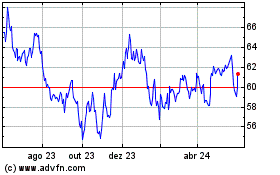
Spire (NYSE:SR)
Gráfico Histórico do Ativo
De Jul 2023 até Jul 2024
