Income Financial Results for the Six Months Ending June 30, 2009
26 Agosto 2009 - 11:03AM
Marketwired Canada
INCOME FINANCIAL TRUST ("Income Financial") announces semi-annual financial
results for the six months ending June 30, 2009.


The six month period ending June 30, 2009 was one of the most tumultuous periods
in financial market history. Against this backdrop, the market prices of the
financial services stocks in the portfolio mirrored this activity reaching lows
in early March but recovering significantly by the end of June.


The net asset value as at June 30 ended $1.04 higher to $9.22 per unit over the
six month period. Total variable distributions of $0.3268 cents per unit were
made during the period. A total of 131 distributions totaling $22.49 per unit
have been paid since inception (February 1999).


Selected Financial Information from the Statement of Operations:
For the six months ending June 30, 2009

                                                                ($ Millions)

Income                                                                0.880

Expenses                                                             (0.302)
                                                                     -------

Net investment income                                                 0.578

Realized option premiums and gain (loss) on sale of investments      (5.457)

Change in unrealized depreciation of investments                      9.735
                                                                     -------

Increase in net assets from operations before distributions           4.856

Comparative financial information is available in documents filed on
www.sedar.com.


Income Financial invests primarily in North American financial services
companies whose shares are included in the TSX Financial Services Index, the S&P
Financials Index or the S&P MidCap Financials Index. Quadravest Capital
Management Inc. actively manages the portfolio.
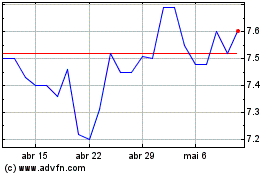
Income Financial (TSX:INC.UN)
Gráfico Histórico do Ativo
De Abr 2024 até Mai 2024

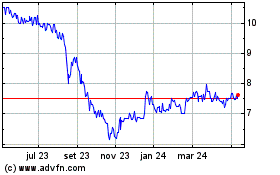
Income Financial (TSX:INC.UN)
Gráfico Histórico do Ativo
De Mai 2023 até Mai 2024
