CEMATRIX Corporation Reports Thirds Quarter Financial Results
14 Novembro 2013 - 12:32PM
Marketwired Canada
CEMATRIX Corporation (TSX VENTURE:CVX) (the "Corporation" or the "Company" or
"CEMATRIX") is pleased to announce the release of its consolidated financial
results for the quarter and nine months ended September 30, 2013.


Third Quarter Highlights


--  The Company recorded third quarter sales of $1,847,970, which when added
    to the first six month`s sales of $4,788,060 results in record sales for
    the first nine months of $6,636,030;
--  On a year to date basis, the Company reported earnings of $39,641; up by
    $209,809 from the same period in 2012. The improvement is principally
    due to the increase in sales and the gross margin on these sales
    combined with reduced operating and finance costs. The sales increase
    has been in the Infrastructure market where the Company has benefitted
    from a large project in Ontario.
--  The Company reported a third quarter loss of $56,214 as compared to
    profit of $222,127 in the same quarter in 2012. The decline is
    principally due to a decline in sales in the Western Canada Oil & Gas
    sector as compared to the same quarter of 2012. Infrastructure sales
    year to date have increased $1,176,108 or 27% and Western Canada Oil &
    Gas sales decreased by $145,960 due to the timing of projects between
    the two periods.
--  The Company added $3.2 million of sales orders bringing the total
    contracted work to $9.6 million, of which $8.0 million is scheduled for
    2013 and $1.6 is scheduled for 2014.

Financial Results

Selected financial information for the quarters and nine months ended
September 30, 2013 and 2012 is as follows:

                                                 Quarter ended September 30
                                         2013           2012         Change
                               ---------------------------------------------

Revenue                           $ 1,847,970    $ 2,367,047    $  (519,077)
                                   -----------    -----------    -----------

Gross margin                          372,512        688,893       (316,381)

Operating expenses                   (431,740)      (426,639)        (5,101)
                                   -----------    -----------    -----------

Operating income (loss)               (59,228)       262,254       (321,482)

Finance costs and other items         (24,976)       (28,913)         3,937
                                   -----------    -----------    -----------
Income (loss) before income
taxes                                 (84,204)       233,341       (317,545)
Provision of deferred taxes            29,502              -         29,502
                                   -----------    -----------    -----------
Income (loss) attributable to
common shareholders                   (54,702)       233,341       (288,043)
Unrealized foreign exchange
gain (loss) on translation of
foreign subsidiary                     (1,512)       (11,214)         9,702
                                   -----------    -----------    -----------
Comprehensive income (loss)       $   (56,214)   $   222,127    $  (278,341)
                                   -----------    -----------    -----------
                                   -----------    -----------    -----------

Income (loss) per common
share                             $    (0.002)   $     0.006    $    (0.008)
                                   -----------    -----------    -----------
                                   -----------    -----------    -----------

                                             Nine months ended September 30
                                         2013           2012         Change
                               ---------------------------------------------

Revenue                           $ 6,636,030    $ 5,605,882    $ 1,030,148
                                   -----------    -----------    -----------

Gross margin                        1,473,447      1,326,127        147,320

Operating expenses                 (1,353,930)    (1,393,330)        39,400
                                   -----------    -----------    -----------

Operating income (loss)               119,517        (67,203)       186,720

Finance costs and other items         (71,511)       (99,396)        27,885
                                   -----------    -----------    -----------
Income (loss) before income
taxes                                  48,006       (166,599)       214,605
Provision of deferred taxes           (11,919)             -        (11,919)
                                   -----------    -----------    -----------
Income (loss) attributable to
common shareholders                    36,087       (166,599)   $   202,686
Unrealized foreign exchange
gain (loss) on translation of
foreign subsidiary                      3,554         (3,569)         7,123
                                   -----------    -----------    -----------
Comprehensive income (loss)       $    39,641    $  (170,168)   $   209,809
                                   -----------    -----------    -----------
                                   -----------    -----------    -----------

Income (loss) per common
share                             $     0.001    $    (0.005)   $     0.006
                                   -----------    -----------    -----------
                                   -----------    -----------    -----------


The Company has placed numerous bids on other projects currently scheduled to be
completed in late 2013, but is unable to ascertain at this time how many of
these projects, if any, will result in 2013 contracted work for the Company.


This press release should be read in conjunction with the Corporation's
unaudited Consolidated Financial Statements and Management Discussion and
Analysis for the quarter and nine months ended September 30, 2013, both of which
can be found on SEDAR.


CEMATRIX is an Alberta corporation with its head offices in Calgary, Alberta.
The Corporation, through its wholly owned subsidiary, is a manufacturer and
supplier of technologically advanced cellular concrete products with
applications in a variety of markets, including oil and gas construction and
infrastructure construction. Cellular concrete provides a cost and labour saving
solution as a replacement for rigid and other insulating materials in
frost-susceptible or permafrost conditions. Cellular concrete is also used in
void filling situations and as a replacement for granular fills and weak or
unstable soils.


Neither TSX Venture Exchange nor its Regulation Services Provider (as that term
is defined in the policies of the TSX Venture Exchange) accepts responsibility
for the adequacy or accuracy of this release.


Forward-looking information: This news release contains certain information that
is forward looking and is subject to important risks and uncertainties (such
statements are usually accompanied by words such as "anticipate", expect",
"would' or other similar words). Forward looking statements in this document are
intended to provide CEMATRIX security holders and potential investors with
information regarding CEMATRIX and its subsidiaries' future financial and
operations plans and outlook. All forward looking statements reflect CEMATRIX's
beliefs and assumptions based on information available at the time the
statements were made. Readers are cautioned not to place undue reliance on this
forward looking information. CEMATRIX undertakes no obligation to update or
revise forward looking information except as required by law. For additional
information on the assumptions made and the risks and uncertainties which may
cause actual results to differ from the anticipated results, refer the
CEMATRIX's Management Discussion and Analysis dated November 13, 2013 under
CEMATRIX's profile on SEDAR at www.sedar.com and other reports filed by CEMATRIX
with Canadian securities regulators.


FOR FURTHER INFORMATION PLEASE CONTACT:
CEMATRIX Corporation
Jeff Kendrick
President and Chief Executive Officer
(403) 219-0484


The Howard Group
Jeff Walker
Investor Relations Phone
(888) 221-0915 or (403) 221-0915
jeff@howardgroupinc.com
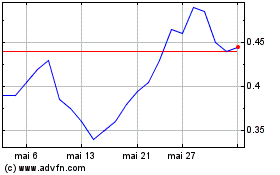
Cematrix (TSXV:CVX)
Gráfico Histórico do Ativo
De Dez 2024 até Jan 2025

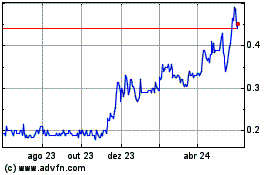
Cematrix (TSXV:CVX)
Gráfico Histórico do Ativo
De Jan 2024 até Jan 2025
