Total Gabon: Third Quarter 2019 Financial Statements
15 Novembro 2019 - 2:46PM
Business Wire
Regulatory News:
Total Gabon (Paris:EC):
Main financial
indicators
3Q19
2Q19
3Q19
vs.
2Q19
9M19
9M18
9M19
vs.
9M18
Average Brent price
$/b
62.0
68.9
-10%
64.6
72.1
-10%
Average Total Gabon crude price(1)
$/b
60.4
65.7
-8%
61.7
68.1
-9%
Crude oil production
from fields operated by Total Gabon
kb/d(2)
24.1
24.4
-1%
23.8
24.7
-4%.
Crude oil production
from Total Gabon interests(3)
kb/d
31.7
33.4
-5%
32.3
36.6
-12%
Sales volumes(1)
Mb(4)
3.09
3.45
-10%
9.06
9.12
-1%
Revenue(5)
M$
205
245
-16%
614
697
-12%
Funds generated from operations(6)
M$
157
63
n.a.
304
225
+35%
Capital expenditure
M$
21
34
-38%
90
87
+3%
Net income
M$
17
15
+13%
42
254
n.a.
- Excluding profit oil reverting to the Gabonese Republic as per
production sharing contracts.
- kb/d: thousand barrels per day.
- Including profit oil reverting to the Gabonese Republic as per
production sharing contracts.
- Mb: million barrels.
- Revenue from hydrocarbon sales and services (transportation,
processing and storage), including profit oil reverting to the
Gabonese Republic as per production sharing contracts.
- Funds generated from operations are comprised of the operating
cash flow, the gains or losses on disposals of assets and the
working capital changes.
Third quarter and nine months
2019 results
Selling prices
Reflecting the higher Brent prices, the average selling price of
the Mandji crude oil grade marketed by Total Gabon averaged 60.4
$/b during the third quarter 2019, down 8% compared to the second
quarter 2019.
During the first nine months 2019, the average selling price
(61.7 $/b) was 9% lower compared to the first nine months 2018.
Production
Total Gabon’s equity share of operated and non-operated oil
production1 was 31,700 barrels per day in the third quarter 2019,
down 5% compared to the second quarter 2019, due mainly to:
- partial unavailability of assets caused by compression and sand
issues on the non operated Grondin field,
- the natural decline of the fields,
partially compensated by:
- additional volumes from the Torpille field redevelopment
campaign.
During the first nine months 2019, Total Gabon’s equity share of
operated and non-operated oil production(1) was 32,300 barrels per
day, down 12% compared to the first nine months 2018, mainly due
to:
- the sale of onshore assets on September 30, 2018;
- the natural decline of the fields,
partially compensated by:
- additional volumes from the Torpille field redevelopment
campaign.
Revenues
Revenues amounted to $205 million during the third quarter 2019,
down 16% compared to the second quarter 2019, mainly due to lower
average prices and volumes sold.
Revenues amounted to $614 million during the first nine months
2019, down 12% compared to the first nine months 2018, mainly due
to lower average prices and to a lesser extent by lower volumes
sold.
Funds generated from operations
Cash flow from operations amounted to $157 million during the
third quarter 2019, a significant increase compared to the second
quarter 2019, and to $304 million during the first nine months
2019, up 35% compared to the first nine months 2018, mainly due to
the decrease in working capital related to lower revenues and to
the crude oil lifting program.
Capital expenditure
Capital expenditure amounted to $21 million during the third
quarter 2019, down 38% compared to the second quarter 2019 and to
$90 million during the first nine months 2019, stable compared to
the first nine months 2018. This includes the initial phase of the
Torpille field redevelopment, integrity works on offshore assets
and the living quarter of the Grondin field.
Net income
Net income amounted to $17 million in the third quarter 2019, an
increase compared to the second quarter 2019 ($15 million).
Net income amounted to $42 million in the first nine months
2019, a significant decline compared to the net income of the first
nine months 2018 ($254 million) which comprised the disposal of the
remaining 32.9% interest in the Rabi-Kounga field.
Highlights since the beginning
of the third quarter 2019
Board of Directors’ Meeting on August 29, 2019
The Board of Directors of Total Gabon met on August 29, 2019 and
reviewed the financial statements for the first-half 2019 which
were published through a press release and on the Company's
website, as well as the Interim 2019 Financial Report for the
period ending June 30, 2019.
1Including profit oil reverting to the Gabonese Republic as per
production sharing contracts.
Total Gabon Société anonyme incorporated in
Gabon with a Board of Directors and share capital of $76,500,000
Headquarters: Boulevard Hourcq, Port-Gentil, BP 525, Gabonese
Republic www.total.ga Registered in Port-Gentil: 2000 B
00011
View source
version on businesswire.com: https://www.businesswire.com/news/home/20191115005426/en/
Media contact: actionnariat-totalgabon@total.com
TotalEnergies EP Gabon (EU:EC)
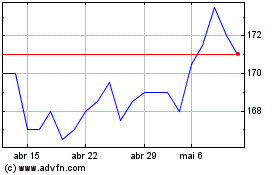
Gráfico Histórico do Ativo
De Jan 2025 até Fev 2025

TotalEnergies EP Gabon (EU:EC)
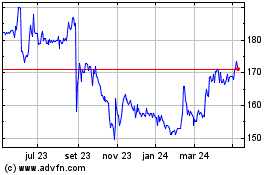
Gráfico Histórico do Ativo
De Fev 2024 até Fev 2025
