Total Gabon: First-Quarter 2020 Results
29 Maio 2020 - 2:49PM
Business Wire
Regulatory News:
Total Gabon (Paris:EC):
Main Financial Indicators
Q1 20
Q1 19
Q1 20 vs Q1 19
Average Brent price
$/b
50.1
63.1
-21%
Average Total Gabon crude price (1)
$/b
40.6
57.7
-30%
Crude oil production
from fields operated by Total Gabon
kb/d(2)
21.7
22.8
-5%
Crude oil production
from Total Gabon interests (3)
kb/d
27.9
31.9
-13%
Sales volumes (1)
Mb(4)
2.34
2.52
-7%
Revenues (5)
$M
113
164
-31%
Funds generated from operations (6)
$M
55
83
-34%
Capital expenditure
$M
11
35
n/a
Net income
$M
(8)
10
n/a
- Excluding profit oil reverting to the Gabonese Republic as per
production sharing contracts.
- kb/d: Thousand barrels per day
- Including profit oil reverting to the Gabonese Republic as per
production sharing contracts.
- Mb: Million barrels.
- Revenue from hydrocarbon sales and services (transportation,
processing and storage), including profit oil reverting to the
Gabonese Republic as per production sharing contracts.
- Funds generated from operations are comprised of the operating
cash flow, the gains or losses on disposals of assets and the
working capital changes.
First Quarter 2020 Results
Selling Price
The average selling price of the crude oil grade marketed by
Total Gabon averaged $40.6 per barrel, during the first quarter
2020, down 30% compared to first quarter 2019. In addition to the
lower Brent price, the price differential related to the oil grade
produced by Total Gabon has also deteriorated following the trend
that has begun late 2019. The drop in oil price has been especially
significant in March 2020.
Production
Total Gabon’s equity share of operated and non-operated oil
production1 amounted to 27,900 barrels per day during the first
quarter 2020 down 13% compared to the first quarter 2019, due
mainly to:
- Partial unavailability of assets caused by compression and sand
issues on the non-operated Grondin sector;
- The natural decline of the fields.
This was partly offset by:
- The gains from the well interventions campaign during the first
quarter on the operated fields.
Revenues
Revenues amounted to $113 million in the first quarter 2020,
down 31% compared to the first quarter 2019, mainly impacted by the
declining average selling price during the quarter.
Funds Generated From Operations
Cash flow from operations amounted to $55 million in the first
quarter 2020, a strong decrease compared to the first quarter 2019.
This is mainly due to the declining average selling price during
the quarter. However, the cash position has improved during the
quarter.
Capital Expenditure
Capital expenditure amounted to $11 million in the first quarter
2020, down significantly compared to the first quarter 2019. This
includes mainly the installation of a gas pipeline intended at
first to improve the gas lift activation of wells from the Grondin
sector. Its commissioning has been delayed due the landlock of
public transport in Gabon.
Net Income
Net income for the first quarter 2020 amounted to ($8) million,
mainly impacted by the lower revenues.
Highlights since the beginning of the first quarter
2020
Board of Directors Meeting of March 25, 2020
The Board of Directors approved on March 25, 2020 the accounts
for the year ending December 31, 2019 and decided that it will
recommend at the Annual Meeting on May 29, 2020 that shareholders
approve the payment of a dividend of $11 per share, same as
previous year, for a total payout of $49.5 million.
Health and oil crisis
Following the dual health and oil crisis, the Company has
communicated on April 20, 2020 on the implementation of an action
plan to substantially reduce its costs and capital expenditures for
2020. This plan has not been modified and its implementation is
carried out as planned.
1Including profit oil reverting to the Gabonese Republic as per
production sharing contracts.
View source
version on businesswire.com: https://www.businesswire.com/news/home/20200529005578/en/
Media contact: actionnariat-totalgabon@total.com
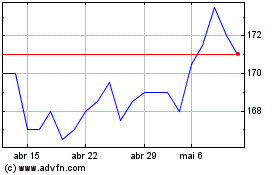
TotalEnergies EP Gabon (EU:EC)
Gráfico Histórico do Ativo
De Jan 2025 até Fev 2025

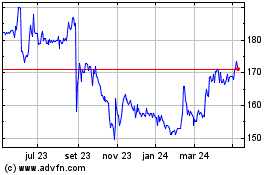
TotalEnergies EP Gabon (EU:EC)
Gráfico Histórico do Ativo
De Fev 2024 até Fev 2025
