true
Q1
--12-31
0001615063
0001615063
2023-01-01
2023-03-31
0001615063
2024-02-22
0001615063
2023-03-31
0001615063
2022-12-31
0001615063
2022-01-01
2022-03-31
0001615063
us-gaap:ServiceMember
2023-01-01
2023-03-31
0001615063
us-gaap:ServiceMember
2022-01-01
2022-03-31
0001615063
INSE:ProductSalesMember
2023-01-01
2023-03-31
0001615063
INSE:ProductSalesMember
2022-01-01
2022-03-31
0001615063
us-gaap:CommonStockMember
2022-12-31
0001615063
us-gaap:AdditionalPaidInCapitalMember
2022-12-31
0001615063
us-gaap:AccumulatedOtherComprehensiveIncomeMember
2022-12-31
0001615063
us-gaap:RetainedEarningsMember
2022-12-31
0001615063
us-gaap:CommonStockMember
2021-12-31
0001615063
us-gaap:AdditionalPaidInCapitalMember
2021-12-31
0001615063
us-gaap:AccumulatedOtherComprehensiveIncomeMember
2021-12-31
0001615063
us-gaap:RetainedEarningsMember
2021-12-31
0001615063
2021-12-31
0001615063
us-gaap:CommonStockMember
2023-01-01
2023-03-31
0001615063
us-gaap:AdditionalPaidInCapitalMember
2023-01-01
2023-03-31
0001615063
us-gaap:AccumulatedOtherComprehensiveIncomeMember
2023-01-01
2023-03-31
0001615063
us-gaap:RetainedEarningsMember
2023-01-01
2023-03-31
0001615063
us-gaap:CommonStockMember
2022-01-01
2022-03-31
0001615063
us-gaap:AdditionalPaidInCapitalMember
2022-01-01
2022-03-31
0001615063
us-gaap:AccumulatedOtherComprehensiveIncomeMember
2022-01-01
2022-03-31
0001615063
us-gaap:RetainedEarningsMember
2022-01-01
2022-03-31
0001615063
us-gaap:CommonStockMember
2023-03-31
0001615063
us-gaap:AdditionalPaidInCapitalMember
2023-03-31
0001615063
us-gaap:AccumulatedOtherComprehensiveIncomeMember
2023-03-31
0001615063
us-gaap:RetainedEarningsMember
2023-03-31
0001615063
us-gaap:CommonStockMember
2022-03-31
0001615063
us-gaap:AdditionalPaidInCapitalMember
2022-03-31
0001615063
us-gaap:AccumulatedOtherComprehensiveIncomeMember
2022-03-31
0001615063
us-gaap:RetainedEarningsMember
2022-03-31
0001615063
2022-03-31
0001615063
srt:RestatementAdjustmentMember
us-gaap:SoftwareDevelopmentMember
2023-01-01
2023-03-31
0001615063
us-gaap:ShortTermContractWithCustomerMember
srt:RestatementAdjustmentMember
2023-01-01
2023-03-31
0001615063
INSE:CapitalizedSoftwareMember
srt:RestatementAdjustmentMember
2023-01-01
2023-03-31
0001615063
INSE:CapitalizedSoftwareMember
srt:RestatementAdjustmentMember
2022-01-01
2022-03-31
0001615063
INSE:PreviousRevisionMember
us-gaap:SoftwareDevelopmentMember
2023-01-01
2023-03-31
0001615063
srt:RestatementAdjustmentMember
2023-01-01
2023-03-31
0001615063
srt:RestatementAdjustmentMember
2023-03-31
0001615063
us-gaap:ServiceMember
srt:RestatementAdjustmentMember
2023-01-01
2023-03-31
0001615063
us-gaap:ServiceMember
srt:RestatementAdjustmentMember
2022-01-01
2022-03-31
0001615063
INSE:ProductSalesMember
srt:RestatementAdjustmentMember
2023-01-01
2023-03-31
0001615063
INSE:ProductSalesMember
srt:RestatementAdjustmentMember
2022-01-01
2022-03-31
0001615063
srt:RestatementAdjustmentMember
2022-01-01
2022-03-31
0001615063
srt:RevisionOfPriorPeriodAccountingStandardsUpdateAdjustmentMember
2022-01-01
2022-03-31
0001615063
srt:RevisionOfPriorPeriodAccountingStandardsUpdateAdjustmentMember
2023-03-31
0001615063
srt:RevisionOfPriorPeriodReclassificationAdjustmentMember
2023-03-31
0001615063
srt:RevisionOfPriorPeriodReclassificationAdjustmentMember
us-gaap:AccumulatedOtherComprehensiveIncomeMember
2023-03-31
0001615063
srt:RevisionOfPriorPeriodReclassificationAdjustmentMember
us-gaap:OtherNoncurrentLiabilitiesMember
2023-03-31
0001615063
srt:ScenarioPreviouslyReportedMember
2023-03-31
0001615063
INSE:PreviousRevisionMember
2023-03-31
0001615063
srt:ScenarioPreviouslyReportedMember
2023-01-01
2023-03-31
0001615063
srt:RevisionOfPriorPeriodReclassificationAdjustmentMember
2023-01-01
2023-03-31
0001615063
srt:ScenarioPreviouslyReportedMember
us-gaap:ServiceMember
2023-01-01
2023-03-31
0001615063
srt:RevisionOfPriorPeriodReclassificationAdjustmentMember
us-gaap:ServiceMember
2023-01-01
2023-03-31
0001615063
srt:ScenarioPreviouslyReportedMember
INSE:ProductSalesMember
2023-01-01
2023-03-31
0001615063
srt:RevisionOfPriorPeriodReclassificationAdjustmentMember
INSE:ProductSalesMember
2023-01-01
2023-03-31
0001615063
srt:ScenarioPreviouslyReportedMember
2022-01-01
2022-03-31
0001615063
srt:RevisionOfPriorPeriodReclassificationAdjustmentMember
2022-01-01
2022-03-31
0001615063
srt:ScenarioPreviouslyReportedMember
us-gaap:ServiceMember
2022-01-01
2022-03-31
0001615063
srt:RevisionOfPriorPeriodReclassificationAdjustmentMember
us-gaap:ServiceMember
2022-01-01
2022-03-31
0001615063
srt:ScenarioPreviouslyReportedMember
INSE:ProductSalesMember
2022-01-01
2022-03-31
0001615063
srt:RevisionOfPriorPeriodReclassificationAdjustmentMember
INSE:ProductSalesMember
2022-01-01
2022-03-31
0001615063
srt:ScenarioPreviouslyReportedMember
us-gaap:CommonStockMember
2023-03-31
0001615063
srt:ScenarioPreviouslyReportedMember
us-gaap:AdditionalPaidInCapitalMember
2023-03-31
0001615063
srt:ScenarioPreviouslyReportedMember
us-gaap:AccumulatedOtherComprehensiveIncomeMember
2023-03-31
0001615063
srt:ScenarioPreviouslyReportedMember
us-gaap:RetainedEarningsMember
2023-03-31
0001615063
INSE:PreviousRevisionMember
us-gaap:CommonStockMember
2023-03-31
0001615063
INSE:PreviousRevisionMember
us-gaap:AdditionalPaidInCapitalMember
2023-03-31
0001615063
INSE:PreviousRevisionMember
us-gaap:AccumulatedOtherComprehensiveIncomeMember
2023-03-31
0001615063
INSE:PreviousRevisionMember
us-gaap:RetainedEarningsMember
2023-03-31
0001615063
srt:RevisionOfPriorPeriodReclassificationAdjustmentMember
us-gaap:CommonStockMember
2023-03-31
0001615063
srt:RevisionOfPriorPeriodReclassificationAdjustmentMember
us-gaap:AdditionalPaidInCapitalMember
2023-03-31
0001615063
srt:RevisionOfPriorPeriodReclassificationAdjustmentMember
us-gaap:AccumulatedOtherComprehensiveIncomeMember
2023-03-31
0001615063
srt:RevisionOfPriorPeriodReclassificationAdjustmentMember
us-gaap:RetainedEarningsMember
2023-03-31
0001615063
srt:ScenarioPreviouslyReportedMember
us-gaap:CommonStockMember
2022-03-31
0001615063
srt:ScenarioPreviouslyReportedMember
us-gaap:AdditionalPaidInCapitalMember
2022-03-31
0001615063
srt:ScenarioPreviouslyReportedMember
us-gaap:AccumulatedOtherComprehensiveIncomeMember
2022-03-31
0001615063
srt:ScenarioPreviouslyReportedMember
us-gaap:RetainedEarningsMember
2022-03-31
0001615063
srt:ScenarioPreviouslyReportedMember
2022-03-31
0001615063
srt:RevisionOfPriorPeriodReclassificationAdjustmentMember
us-gaap:CommonStockMember
2022-03-31
0001615063
srt:RevisionOfPriorPeriodReclassificationAdjustmentMember
us-gaap:AdditionalPaidInCapitalMember
2022-03-31
0001615063
srt:RevisionOfPriorPeriodReclassificationAdjustmentMember
us-gaap:AccumulatedOtherComprehensiveIncomeMember
2022-03-31
0001615063
srt:RevisionOfPriorPeriodReclassificationAdjustmentMember
us-gaap:RetainedEarningsMember
2022-03-31
0001615063
srt:RevisionOfPriorPeriodReclassificationAdjustmentMember
2022-03-31
0001615063
srt:ScenarioPreviouslyReportedMember
INSE:AccountingStandardsUpdateMember
2023-01-01
2023-03-31
0001615063
INSE:PreviousRevisionMember
INSE:AccountingStandardsUpdateMember
2023-01-01
2023-03-31
0001615063
srt:RevisionOfPriorPeriodReclassificationAdjustmentMember
INSE:AccountingStandardsUpdateMember
2023-01-01
2023-03-31
0001615063
srt:ScenarioPreviouslyReportedMember
INSE:AccountingStandardsUpdateMember
2022-12-31
0001615063
INSE:PreviousRevisionMember
INSE:AccountingStandardsUpdateMember
2022-12-31
0001615063
srt:RevisionOfPriorPeriodReclassificationAdjustmentMember
INSE:AccountingStandardsUpdateMember
2022-12-31
0001615063
srt:ScenarioPreviouslyReportedMember
INSE:AccountingStandardsUpdateMember
2023-03-31
0001615063
INSE:PreviousRevisionMember
INSE:AccountingStandardsUpdateMember
2023-03-31
0001615063
srt:RevisionOfPriorPeriodReclassificationAdjustmentMember
INSE:AccountingStandardsUpdateMember
2023-03-31
0001615063
srt:ScenarioPreviouslyReportedMember
INSE:AccountingStandardsUpdateMember
2022-01-01
2022-03-31
0001615063
srt:RevisionOfPriorPeriodReclassificationAdjustmentMember
INSE:AccountingStandardsUpdateMember
2022-01-01
2022-03-31
0001615063
srt:ScenarioPreviouslyReportedMember
INSE:AccountingStandardsUpdateMember
2021-12-31
0001615063
srt:RevisionOfPriorPeriodReclassificationAdjustmentMember
INSE:AccountingStandardsUpdateMember
2021-12-31
0001615063
srt:ScenarioPreviouslyReportedMember
INSE:AccountingStandardsUpdateMember
2022-03-31
0001615063
srt:RevisionOfPriorPeriodReclassificationAdjustmentMember
INSE:AccountingStandardsUpdateMember
2022-03-31
0001615063
2022-01-01
2022-01-31
0001615063
2022-01-01
2022-12-31
0001615063
INSE:IncentivePlanMember
us-gaap:RestrictedStockUnitsRSUMember
2022-12-31
0001615063
INSE:IncentivePlanMember
us-gaap:RestrictedStockUnitsRSUMember
2023-01-01
2023-03-31
0001615063
INSE:IncentivePlanMember
us-gaap:RestrictedStockUnitsRSUMember
2023-03-31
0001615063
us-gaap:PerformanceSharesMember
2023-01-01
2023-03-31
0001615063
us-gaap:PerformanceSharesMember
srt:MinimumMember
2023-01-01
2023-03-31
0001615063
us-gaap:PerformanceSharesMember
srt:MaximumMember
2023-01-01
2023-03-31
0001615063
us-gaap:RestrictedStockUnitsRSUMember
srt:MaximumMember
2023-01-01
2023-03-31
0001615063
us-gaap:RestrictedStockUnitsRSUMember
us-gaap:ShareBasedCompensationAwardTrancheThreeMember
2023-01-01
2023-03-31
0001615063
us-gaap:RestrictedStockUnitsRSUMember
us-gaap:ShareBasedCompensationAwardTrancheThreeMember
2022-01-01
2022-12-30
0001615063
us-gaap:RestrictedStockUnitsRSUMember
2023-01-01
2023-03-31
0001615063
us-gaap:RestrictedStockUnitsRSUMember
2022-01-01
2022-03-31
0001615063
INSE:MacquarieCorporateHoldingsPtyLimitedMember
2023-03-31
0001615063
INSE:MacquarieCorporateHoldingsPtyLimitedMember
2023-01-01
2023-03-31
0001615063
INSE:MacquarieCorporateHoldingsPtyLimitedMember
2022-01-01
2022-03-31
0001615063
INSE:ConsultancyAgreementMember
INSE:RichardWeilMember
2021-12-30
2021-12-31
0001615063
INSE:ConsultancyAgreementMember
INSE:RichardWeilMember
us-gaap:SubsequentEventMember
2023-06-29
2023-06-30
0001615063
INSE:ConsultancyAgreementMember
2023-01-01
2023-03-31
0001615063
INSE:ConsultancyAgreementMember
2022-01-01
2022-03-31
0001615063
INSE:AmendedEmploymentAgreementMember
INSE:FormerExecutiveVicePresidentAndChiefStrategyOfficerMember
2023-01-09
2023-01-10
0001615063
INSE:AmendedEmploymentAgreementMember
INSE:FormerExecutiveVicePresidentAndChiefStrategyOfficerMember
srt:MinimumMember
2023-01-09
2023-01-10
0001615063
INSE:AmendedEmploymentAgreementMember
INSE:FormerExecutiveVicePresidentAndChiefStrategyOfficerMember
srt:MaximumMember
2023-01-09
2023-01-10
0001615063
us-gaap:SubsequentEventMember
2023-12-31
0001615063
INSE:GamingMember
us-gaap:ServiceMember
2023-01-01
2023-03-31
0001615063
INSE:VirtualsportsMember
us-gaap:ServiceMember
2023-01-01
2023-03-31
0001615063
INSE:InteractiveMember
us-gaap:ServiceMember
2023-01-01
2023-03-31
0001615063
INSE:LeisureMember
us-gaap:ServiceMember
2023-01-01
2023-03-31
0001615063
INSE:CorporateFunctionsMember
us-gaap:ServiceMember
2023-01-01
2023-03-31
0001615063
INSE:GamingMember
INSE:ProductSalesMember
2023-01-01
2023-03-31
0001615063
INSE:VirtualsportsMember
INSE:ProductSalesMember
2023-01-01
2023-03-31
0001615063
INSE:InteractiveMember
INSE:ProductSalesMember
2023-01-01
2023-03-31
0001615063
INSE:LeisureMember
INSE:ProductSalesMember
2023-01-01
2023-03-31
0001615063
INSE:CorporateFunctionsMember
INSE:ProductSalesMember
2023-01-01
2023-03-31
0001615063
INSE:GamingMember
2023-01-01
2023-03-31
0001615063
INSE:VirtualsportsMember
2023-01-01
2023-03-31
0001615063
INSE:InteractiveMember
2023-01-01
2023-03-31
0001615063
INSE:LeisureMember
2023-01-01
2023-03-31
0001615063
INSE:CorporateFunctionsMember
2023-01-01
2023-03-31
0001615063
INSE:GamingMember
us-gaap:ServiceMember
2022-01-01
2022-03-31
0001615063
INSE:VirtualsportsMember
us-gaap:ServiceMember
2022-01-01
2022-03-31
0001615063
INSE:InteractiveMember
us-gaap:ServiceMember
2022-01-01
2022-03-31
0001615063
INSE:LeisureMember
us-gaap:ServiceMember
2022-01-01
2022-03-31
0001615063
INSE:CorporateFunctionsMember
us-gaap:ServiceMember
2022-01-01
2022-03-31
0001615063
INSE:GamingMember
INSE:ProductSalesMember
2022-01-01
2022-03-31
0001615063
INSE:VirtualsportsMember
INSE:ProductSalesMember
2022-01-01
2022-03-31
0001615063
INSE:InteractiveMember
INSE:ProductSalesMember
2022-01-01
2022-03-31
0001615063
INSE:LeisureMember
INSE:ProductSalesMember
2022-01-01
2022-03-31
0001615063
INSE:CorporateFunctionsMember
INSE:ProductSalesMember
2022-01-01
2022-03-31
0001615063
INSE:GamingMember
2022-01-01
2022-03-31
0001615063
INSE:VirtualsportsMember
2022-01-01
2022-03-31
0001615063
INSE:InteractiveMember
2022-01-01
2022-03-31
0001615063
INSE:LeisureMember
2022-01-01
2022-03-31
0001615063
INSE:CorporateFunctionsMember
2022-01-01
2022-03-31
0001615063
country:GB
2023-01-01
2023-03-31
0001615063
country:GB
2022-01-01
2022-03-31
0001615063
country:GR
2023-01-01
2023-03-31
0001615063
country:GR
2022-01-01
2022-03-31
0001615063
INSE:RestOfWorldMember
2023-01-01
2023-03-31
0001615063
INSE:RestOfWorldMember
2022-01-01
2022-03-31
0001615063
country:GB
2023-03-31
0001615063
country:GB
2022-12-31
0001615063
country:GR
2023-03-31
0001615063
country:GR
2022-12-31
0001615063
INSE:RestOfWorldMember
2023-03-31
0001615063
INSE:RestOfWorldMember
2022-12-31
0001615063
us-gaap:SalesRevenueNetMember
us-gaap:CustomerConcentrationRiskMember
INSE:CustomerOneMember
2023-01-01
2023-03-31
0001615063
us-gaap:SalesRevenueNetMember
us-gaap:CustomerConcentrationRiskMember
INSE:CustomerOneMember
2022-01-01
2022-03-31
0001615063
us-gaap:AccountsReceivableMember
us-gaap:CustomerConcentrationRiskMember
INSE:NoCustomerMember
2023-01-01
2023-03-31
0001615063
us-gaap:AccountsReceivableMember
us-gaap:CustomerConcentrationRiskMember
INSE:CustomerOneMember
2022-01-01
2022-12-31
0001615063
INSE:TwoThousandTwentyThreePlanMember
us-gaap:SubsequentEventMember
2023-04-10
0001615063
INSE:TwoThousandTwentyThreePlanMember
us-gaap:PerformanceSharesMember
INSE:AmendmentToEmploymentContractOfWeilAndPierceMember
2023-01-31
0001615063
INSE:TwoThousandTwentyThreePlanMember
INSE:StockPriceBasedRSUsMember
INSE:AmendmentToEmploymentContractOfWeilAndPierceMember
2023-01-31
iso4217:USD
xbrli:shares
iso4217:USD
xbrli:shares
xbrli:pure
INSE:Instrument
INSE:Integer
iso4217:EUR
iso4217:GBP
UNITED
STATES
SECURITIES
AND EXCHANGE COMMISSION
Washington,
D.C. 20549
FORM
10-Q/A
☒
QUARTERLY REPORT PURSUANT TO SECTION 13 OR 15(d) OF THE SECURITIES EXCHANGE ACT OF 1934
For
the quarterly period ended March 31, 2023
OR
☐
TRANSITION REPORT PURSUANT TO SECTION 13 OR 15(d) OF THE SECURITIES EXCHANGE ACT OF 1934
For
the transition period _______________
Commission
File Number: 001-36689
INSPIRED
ENTERTAINMENT, INC.
(Exact
name of registrant as specified in its charter)
| Delaware |
|
47-1025534 |
| (State
or other jurisdiction of |
|
(I.R.S.
Employer |
| incorporation
or organization) |
|
Identification
Number) |
| |
|
|
| 250
West 57th Street, Suite 415 |
|
|
| New
York, NY |
|
10107 |
| (Address
of principal executive offices) |
|
(Zip
Code) |
Registrant’s
telephone number, including area code: (646) 565-3861
Indicate
by check mark whether the registrant (1) has filed all reports required to be filed by Section 13 or 15(d) of the Securities Exchange
Act of 1934 during the preceding 12 months (or for such shorter period that the registrant was required to file such reports), and (2)
has been subject to such filing requirements for the past 90 days. Yes ☒ No ☐
Indicate
by check mark whether the registrant has submitted electronically every Interactive Date File required to be submitted pursuant to Rule
405 of Regulation S-T (§232.405 of this chapter) during the preceding 12 months (or for such shorter period that the registrant
was required to submit such files). Yes ☒ No ☐
Indicate
by check mark whether the registrant is a large accelerated filer, an accelerated filer, a non-accelerated filer, a smaller reporting
company or an emerging growth company. See definitions of “large accelerated filer”, “accelerated filer,” “smaller
reporting company,” and “emerging growth company” in Rule 12b-2 of the Exchange Act.
| Large
accelerated filer ☐ |
|
Accelerated
filer ☒ |
| Non-accelerated
filer ☐ |
|
Smaller
reporting company ☒ |
| |
|
Emerging
growth company ☐ |
If
an emerging growth company, indicate by check mark if the registrant has elected not to use the extended transition period for complying
with any new or revised financial accounting standards provided pursuant to Section 13(a) of the Exchange Act. ☐
Indicate
by check mark whether the registrant is a shell company (as defined in Rule 12b-2 of the Exchange Act). Yes ☐ No ☒
Securities
registered pursuant to Section 12(b) of the Act:
| Title
of each class |
|
Trading
Symbol(s) |
|
Name
of each exchange on which registered |
| Common
stock, par value $0.0001 per share |
|
INSE |
|
The
NASDAQ Stock Market LLC |
As
of May 5, 2023, there were 26,267,352 shares of the Company’s common stock issued and outstanding.
As of February 22, 2024, there were 26,219,021 shares of the Company’s common stock issued and outstanding.
TABLE
OF CONTENTS
CAUTIONARY
NOTE REGARDING FORWARD-LOOKING STATEMENTS
References
in this report to “we,” “us,” “our,” the “Company” and “Inspired” refer to
Inspired Entertainment, Inc. and its subsidiaries unless the context suggests otherwise.
Certain
statements and other information set forth in this report, including in Item 2, “Management’s Discussion and Analysis of
Financial Condition and Results of Operations” and elsewhere herein, may relate to future events and expectations, and as such
constitute “forward-looking statements” within the meaning of Section 21E of the Securities Exchange Act of 1934, as amended
(the “Exchange Act”), and Section 27A of the Securities Act of 1933, as amended (the “Securities Act”). Our forward-looking
statements include, but are not limited to, statements regarding our business strategy, plans and objectives and our expected or contemplated
future operations, results, financial condition, beliefs and intentions. In addition, any statements that refer to projections, forecasts
or other characterizations or predictions of future events or circumstances, including any underlying assumptions on which such statements
are expressly or implicitly based, are forward-looking statements. The words “anticipate”, “believe”, “continue”,
“can”, “could”, “estimate”, “expect”, “intend”, “may”, “might”,
“plan”, “possible”, “potential”, “predict”, “project”, “scheduled”,
“seek”, “should”, “would” and similar expressions, among others, and negatives expressions including
such words, may identify forward-looking statements.
Our
forward-looking statements reflect our current expectations about our future results, performance, liquidity, financial condition, prospects
and opportunities, and are based upon information currently available to us, our interpretation of what we believe to be significant
factors affecting our business and many assumptions regarding future events. Actual results, performance, liquidity, financial condition,
prospects and opportunities could differ materially from those expressed in, or implied by, our forward-looking statements. This could
occur as a result of various risks and uncertainties, including the following:
| |
● |
government
regulation of our industries; |
| |
|
|
| |
● |
our
ability to compete effectively in our industries; |
| |
|
|
| |
● |
the
effect of evolving technology on our business; |
| |
|
|
| |
● |
our
ability to renew long-term contracts and retain customers, and secure new contracts and customers; |
| |
|
|
| |
● |
our
ability to maintain relationships with suppliers; |
| |
|
|
| |
● |
our
ability to protect our intellectual property; |
| |
|
|
| |
● |
our
ability to protect our business against cybersecurity threats; |
| |
|
|
| |
● |
our
ability to successfully grow by acquisition as well as organically; |
| |
|
|
| |
● |
fluctuations
due to seasonality; |
| |
|
|
| |
● |
our
ability to attract and retain key members of our management team; |
| |
|
|
| |
● |
our
need for working capital; |
| |
|
|
| |
● |
our
ability to secure capital for growth and expansion; |
| |
|
|
| |
● |
changing
consumer, technology and other trends in our industries; |
| |
|
|
| |
● |
our
ability to successfully operate across multiple jurisdictions and markets around the world; |
| |
|
|
| |
● |
changes
in local, regional and global economic and political conditions; and |
| |
|
|
| |
● |
other
factors described in the reports and documents we file from time to time with the U.S. Securities and Exchange Commission (the “SEC”). |
In
light of these risks and uncertainties, and others discussed in this report, there can be no assurance that any matters covered by our
forward-looking statements will develop as predicted, expected or implied. Readers should not place undue reliance on any forward-looking
statements. Except as expressly required by the federal securities laws, we undertake no obligation to publicly update or revise any
forward-looking statements, whether as a result of new information, future events, changed circumstances or any other reason. We advise
you to carefully review the reports and documents we file from time to time with the SEC.
EXPLANATORY
NOTE
This
Amendment No. 1 to Form 10-Q (this “Amendment” or “Form 10-Q/A”) amends the Annual Report on Form 10-Q for the
quarter ended March 31, 2023 originally filed with the Securities and Exchange Commission (“SEC”) on May 10, 2023 (the
“Original Filing”) by Inspired Entertainment, Inc. (the “Company,” “we,” “our” or “us”).
Restatement
and Revision
As
previously reported by the Company in a Current Report on Form 8-K filed with the SEC on November 8, 2023, the Audit Committee (the
“Audit Committee”) of the Board of Directors of the Company, in consultation with the Company’s management,
determined that (i) the Company’s previously issued audited consolidated financial statements
as of December 31, 2021 and 2022 and for the years ended December 31, 2020, 2021 and 2022 included in the Company’s Annual Report
on Form 10-K, (ii) associated
reports of the Company’s independent registered public accounting firm, Marcum LLP (“Marcum”), and (iii) the Company’s previously issued
unaudited condensed consolidated financial statements during those years and for the first and second quarters of 2023
included in the Company’s Quarterly Reports on Form 10-Q (the “Subject Periods”) contained accounting errors
relating to the compliance with U.S. GAAP in connection with the Company’s accounting policies for capitalizing software
development costs. The errors related primarily to the application of the relevant accounting standards to projects, including the
timing of capitalization with respect to software development projects and the nature of costs eligible for
capitalization.
As
a result of these errors, the Audit Committee determined that the Company’s previously issued consolidated financial
statements for the Subject Periods should no longer be relied upon and should be restated. Similarly, any previously issued or filed
reports, press releases, earnings releases, investor presentations or other communications of the Company describing the
Company’s financial results or other financial information relating to the Subject Periods should no longer be relied
upon.
Additionally,
the previous reports of Marcum on the Company’s
consolidated financial statements as of December 31, 2021 and 2022 and for the years ended December 31, 2020,
2021 and 2022 likewise should no longer be relied upon.
As
of the date of this report, the Company has filed with the SEC an amendment to its Annual Report on Form 10-K for the year ended December
31, 2022 and to the Quarterly Report on Form 10-Q for the period ended June 30, 2023 that include financial statements that amend and
restate the previously issued unaudited consolidated financial statements originally filed with such filings and reports. The foregoing
Quarterly Reports amend and restate the financial statements as of and for the comparable 2022 periods.
This
quarterly report on Form 10-Q for the three months ended March 31, 2023 includes financial statements that amend and restate the Company’s
unaudited financial statements as of and for the three month periods ended March 31, 2023 and 2022. Please see Note 2 to the unaudited
financial statements included in this Quarterly Report on Form 10-Q for a discussion of the restatement and the impact on the specific
accounts in such unaudited financial statements.
Although
on December 31, 2023, the Company was a smaller reporting company, as defined in Rule 12b-2 promulgated under the Exchange Act, the Company ceased to be a
smaller reporting company for periods on and after January 1, 2024.
Changes
Reflected in the Restatement
For
the convenience of the reader, this Amendment sets forth our Original Filing in its entirety, as amended by the changes related to the
restatement. This Amendment does not reflect events occurring after the filing of our Original Filing, or modify or update those disclosures,
except as applicable in our financial statement footnote subsequent event disclosures. The following sections of our Original Filing
have been amended:
●
Part I- Item 1 – Business;
●
Part I - Item 1A Risk Factors;
●
Part I – Item 4 Controls and Procedures;
●
Part II - Item 7 - Management’s Discussion and Analysis of Financial Condition and Results of Operations; and
●
Part II - Item 8 - Financial Statements.
This
Amendment has been signed as of the date hereof and all certifications of our Principal Executive Officer and Principal Financial Officer
are given as the date hereof. Accordingly, this Amendment should be read in conjunction with our filings made with the Securities and
Exchange Commission subsequent to the filing of the Original Filing, including any amendments to those filings.
Restatement
Background
As
previously reported by the Company on a Current Report on Form 8-K filed with the SEC on March 23, 2023, on March 17, 2023, the
Company dismissed Marcum as its independent registered public accounting firm, and engaged KPMG LLP
(“KPMG”) as the Company’s independent registered public accounting firm for the fiscal year ending December 31,
2023 and the related interim periods. In connection with the preparation of the financial statements of the Company for the
quarterly period ended September 30, 2023, KPMG identified certain accounting errors relating to compliance with U.S. GAAP in
connection with the Company’s accounting policies for capitalizing software development costs. The errors related primarily to
the application of the relevant accounting standards to projects, including the timing of capitalization with respect to software
development projects and the nature of costs eligible for capitalization.
As previously reported by the Company on Form 8-K filed with the SEC on
November 8, 2023, on November 2, 2023, the Audit Committee,, in consultation with the Company’s management, determined that (i)
the Company’s previously issued audited consolidated financial statements
as of December 31, 2021 and 2022 and for the years ended December 31, 2020, 2021 and 2022 included in the Company’s Annual Report
on Form 10-K, (ii) associated reports of the Company’s independent
registered public accounting firm, and (iii) the Company’s previously issued unaudited condensed consolidated financial statements
during those years and for the first and second quarters of 2023 included in the Company’s Quarterly Reports on Form 10-Q contained
the accounting errors set forth above. Following the determination by the Audit Committee, the Company retained independent accounting
consultants and undertook an investigation with respect to the appropriate accounting treatment of its software development costs and
other matters.
As
previously reported by the Company on a Current Report on Form 8-K filed with the SEC on November 29, 2023, on November 22, 2023,
the Company dismissed KPMG as its independent registered public accounting firm and re-engaged Marcum as the Company’s
independent registered public accounting firm for the fiscal year ending December 31, 2023 and the related interim
periods.
Other
Adjustments
In addition to the material software development matters described above,
various other material and immaterial prior period errors or misstatements have been identified including in the areas of revenue, inventory,
leasing, pension, earnings per share and other reclassification and minor items. For additional information regarding the revision of
prior interim periods see Part I, Item 1 “Financial Statements and Supplementary Data-Note 2 to the Consolidated Financial Statements
- Restatement of Previously Issued Financial Statements.”
Internal
Control Over Financial Reporting
Management
has reassessed its evaluation of the effectiveness of its internal control over financial reporting as of December 31, 2022, based
on the framework established in Internal Control-Integrated Framework (2013) issued by the Committee of Sponsoring
Organizations of the Treadway Commission. Management has concluded that, due to the additional material weaknesses identified
relating to the failure to properly design and operate monitoring control activities, the Company did not maintain effective
internal control over financial reporting as of December 31, 2022. As such, Management’s Reports on Internal Control over
Financial Reporting as of December 31, 2022 should no longer be relied upon. For a description of the material weakness in internal
control over financial reporting and actions taken, and to be taken, to address the material weakness, see Part II, Item 8
“Financial Statements and Supplementary Data” and Item 9A. “Controls and Procedures” of this Form 10-K/A. In
addition, the Company’s independent registered public accounting firm has restated its report on the Company’s internal
control over financial reporting to add additional material weaknesses and continues to issue an adverse opinion.
PART
I - FINANCIAL INFORMATION
ITEM
1. FINANCIAL STATEMENTS
INSPIRED
ENTERTAINMENT, INC. AND SUBSIDIARIES
CONDENSED
CONSOLIDATED BALANCE SHEETS
(in
millions, except share data)
| | |
March
31, 2023,
as
restated | | |
December
31, 2022,
as
restated | |
| | |
(Unaudited) | | |
| |
| Assets | |
| | | |
| | |
| Cash | |
$ | 27.8 | | |
$ | 25.0 | |
| Accounts receivable, net | |
| 32.9 | | |
| 40.4 | |
| Inventory | |
| 34.6 | | |
| 30.3 | |
| Prepaid expenses and other current assets | |
| 30.7 | | |
| 31.2 | |
| Total current assets | |
| 126.0 | | |
| 126.9 | |
| | |
| | | |
| | |
| Property and equipment, net | |
| 47.4 | | |
| 45.1 | |
| Software development costs, net | |
| 19.5 | | |
| 18.3 | |
| Other acquired intangible assets subject to amortization, net | |
| 14.3 | | |
| 14.6 | |
| Goodwill | |
| 57.0 | | |
| 55.5 | |
| Operating lease right of use asset | |
| 15.7 | | |
| 16.0 | |
| Costs of obtaining and fulfilling customer contracts, net | |
| 7.7 | | |
| 7.0 | |
| Other assets | |
| 4.1 | | |
| 3.8 | |
| Total assets | |
$ | 291.7 | | |
$ | 287.2 | |
| | |
| | | |
| | |
| Liabilities and Stockholders’ Deficit | |
| | | |
| | |
| Current liabilities | |
| | | |
| | |
| Accounts payable | |
$ | 22.2 | | |
$ | 23.7 | |
| Accrued expenses | |
| 35.6 | | |
| 29.0 | |
| Corporate tax and other current taxes payable | |
| 3.4 | | |
| 10.1 | |
| Deferred revenue, current | |
| 4.9 | | |
| 4.6 | |
| Operating lease liabilities | |
| 4.0 | | |
| 3.9 | |
| Other current liabilities | |
| 3.2 | | |
| 3.6 | |
| Total current liabilities | |
| 73.3 | | |
| 74.9 | |
| | |
| | | |
| | |
| Long-term debt | |
| 285.5 | | |
| 277.6 | |
| Finance lease liabilities, net of current portion | |
| 1.2 | | |
| 1.2 | |
| Deferred revenue, net of current portion | |
| 2.3 | | |
| 2.8 | |
| Operating lease liabilities | |
| 11.9 | | |
| 12.3 | |
| Other long-term liabilities | |
| 4.0 | | |
| 4.0 | |
| Total liabilities | |
| 378.2 | | |
| 372.8 | |
| | |
| | | |
| | |
| Commitments and contingencies | |
| - | | |
| | |
| | |
| | | |
| | |
| Stockholders’ deficit | |
| | | |
| | |
| Preferred stock; $0.0001 par value; 1,000,000 shares authorized | |
| — | | |
| — | |
| Common stock; $0.0001 par value; 49,000,000 shares authorized; 26,263,070 shares and 25,909,516 shares issued and outstanding at March 31, 2023 and December 31, 2022, respectively | |
| — | | |
| — | |
| Additional paid in capital | |
| 381.2 | | |
| 378.2 | |
| Accumulated other comprehensive income | |
| 48.3 | | |
| 50.8 | |
| Accumulated deficit | |
| (516.0 | ) | |
| (514.6 | ) |
| Total stockholders’ deficit | |
| (86.5 | ) | |
| (85.6 | ) |
| Total liabilities and stockholders’ deficit | |
$ | 291.7 | | |
$ | 287.2 | |
The
accompanying notes are an integral part of these unaudited condensed consolidated financial statements.
INSPIRED
ENTERTAINMENT, INC. AND SUBSIDIARIES
CONDENSED
CONSOLIDATED STATEMENTS OF OPERATIONS AND COMPREHENSIVE INCOME (LOSS)
(in
millions, except share and per share data)
(Unaudited)
| | |
2023, as restated | | |
2022, as restated | |
| | |
Three Months Ended
March 31, | |
| | |
2023, as restated | | |
2022, as restated | |
| Revenue: | |
| | | |
| | |
| Service | |
$ | 57.5 | | |
$ | 56.0 | |
| Product sales | |
| 7.4 | | |
| 4.3 | |
| Total revenue | |
| 64.9 | | |
| 60.3 | |
| | |
| | | |
| | |
| Cost of sales: | |
| | | |
| | |
| Cost of service (1) | |
| (15.0 | ) | |
| (16.8 | ) |
| Cost of product sales | |
| (6.7 | ) | |
| (2.5 | ) |
| Selling, general and administrative expenses | |
| (29.2 | ) | |
| (23.2 | ) |
| Acquisition and integration related transaction expenses | |
| — | | |
| (0.2 | ) |
| Depreciation and amortization | |
| (9.4 | ) | |
| (10.7 | ) |
| Net operating income | |
| 4.6 | | |
| 6.9 | |
| | |
| | | |
| | |
| Other expense | |
| | | |
| | |
| Interest expense, net | |
| (6.3 | ) | |
| (6.5 | ) |
| Gain on disposal of business | |
| — | | |
| 0.9 | |
| Other finance income | |
| 0.1 | | |
| 0.3 | |
| | |
| | | |
| | |
| Total other expense, net | |
| (6.2 | ) | |
| (5.3 | ) |
| | |
| | | |
| | |
| Income tax benefit (expense) | |
| 0.2 | | |
| (0.1 | ) |
| Net (loss) income | |
| (1.4 | ) | |
| 1.5 | |
| | |
| | | |
| | |
| Other comprehensive income: | |
| | | |
| | |
| Foreign currency translation (loss) gain | |
| (2.9 | ) | |
| 3.5 | |
| Reclassification of loss on hedging instrument to comprehensive income | |
| 0.2 | | |
| 0.2 | |
| Actuarial gains on pension plan | |
| 0.2 | | |
| 0.1 | |
| Other comprehensive income | |
| (2.5 | ) | |
| 3.8 | |
| | |
| | | |
| | |
| Comprehensive (loss) income | |
$ | (3.9 | ) | |
$ | 5.3 | |
| | |
| | | |
| | |
| Net income (loss) per common share – basic | |
$ | (0.05 | ) | |
$ | 0.05 | |
| Net income (loss) per common share - diluted | |
$ | (0.05 | ) | |
$ | 0.05 | |
| | |
| | | |
| | |
| Weighted average number of shares outstanding during the period – basic | |
| 27,974,182 | | |
| 28,437,052 | |
| Weighted average number of shares outstanding during the period – diluted | |
| 27,974,182 | | |
| 29,362,382 | |
| Supplemental disclosure of stock-based compensation expense | |
| | | |
| | |
| Stock-based compensation included in: | |
| | | |
| | |
| Selling, general and administrative expenses | |
$ | (2.9 | ) | |
$ | (2.8 | ) |
The
accompanying notes are an integral part of these unaudited condensed consolidated financial statements.
INSPIRED
ENTERTAINMENT, INC. AND SUBSIDIARIES
CONDENSED
CONSOLIDATED STATEMENTS OF STOCKHOLDERS’ DEFICIT
THREE
MONTHS ENDED MARCH 31, 2023
(in
millions, except share data)
(Unaudited)
| | |
Shares | | |
Amount | | |
capital | | |
income | | |
deficit | | |
deficit | |
| | |
Common stock | | |
Additional paid in | | |
Accumulated other comprehensive | | |
Accumulated | | |
Total stockholders’ | |
| | |
Shares | | |
Amount | | |
capital | | |
income | | |
deficit | | |
deficit | |
| | |
| | |
| | |
| | |
| | |
| | |
| |
| Balance as of December 31, 2022, as restated | |
| 25,909,516 | | |
| — | | |
| 378.2 | | |
| 50.8 | | |
| (514.6 | ) | |
| (85.6 | ) |
| Foreign currency translation adjustments | |
| — | | |
| — | | |
| — | | |
| (2.9 | ) | |
| — | | |
| (2.9 | ) |
| Actuarial gains on pension plan | |
| — | | |
| — | | |
| — | | |
| 0.2 | | |
| — | | |
| 0.2 | |
| Reclassification of loss on hedging instrument to comprehensive income | |
| — | | |
| — | | |
| — | | |
| 0.2 | | |
| — | | |
| 0.2 | |
| Issuances under stock plans | |
| 353,554 | | |
| — | | |
| — | | |
| — | | |
| — | | |
| — | |
| Stock-based compensation expense | |
| — | | |
| — | | |
| 3.0 | | |
| — | | |
| — | | |
| 3.0 | |
| Net loss | |
| — | | |
| — | | |
| — | | |
| — | | |
| (1.4 | ) | |
| (1.4 | ) |
| Balance as of March 31, 2023, as restated | |
| 26,263,070 | | |
$ | — | | |
$ | 381.2 | | |
$ | 48.3 | | |
$ | (516.0 | ) | |
$ | (86.5 | ) |
The
accompanying notes are an integral part of these unaudited condensed consolidated financial statements.
INSPIRED
ENTERTAINMENT, INC. AND SUBSIDIARIES
CONDENSED
CONSOLIDATED STATEMENTS OF STOCKHOLDERS’ DEFICIT
THREE
MONTHS ENDED MARCH 31, 2022
(in
millions, except share data)
(Unaudited)
| | |
Common stock | | |
Additional paid in | | |
Accumulated other comprehensive | | |
Accumulated | | |
Total stockholders’ | |
| | |
Shares | | |
Amount | | |
capital | | |
income | | |
deficit | | |
deficit | |
| | |
| | |
| | |
| | |
| | |
| | |
| |
| Balance as of December 31, 2021, as restated | |
| 26,433,562 | | |
| — | | |
| 372.3 | | |
| 43.8 | | |
| (524.8 | ) | |
| (108.7 | ) |
| Balance | |
| 26,433,562 | | |
| — | | |
| 372.3 | | |
| 43.8 | | |
| (524.8 | ) | |
| (108.7 | ) |
| | |
| | | |
| | | |
| | | |
| | | |
| | | |
| | |
| Foreign currency translation adjustments | |
| — | | |
| — | | |
| — | | |
| 3.5 | | |
| — | | |
| 3.5 | |
| Actuarial gains on pension plan | |
| — | | |
| — | | |
| — | | |
| 0.1 | | |
| — | | |
| 0.1 | |
| Reclassification of loss on hedging instrument to comprehensive income | |
| — | | |
| — | | |
| — | | |
| 0.2 | | |
| — | | |
| 0.2 | |
| Issuances under stock plans | |
| 447,060 | | |
| — | | |
| — | | |
| — | | |
| — | | |
| — | |
| Stock-based compensation expense | |
| — | | |
| — | | |
| 2.7 | | |
| — | | |
| — | | |
| 2.7 | |
| Net income | |
| — | | |
| — | | |
| — | | |
| — | | |
| 1.5 | | |
| 1.5 | |
| Net income (loss) | |
| — | | |
| — | | |
| — | | |
| — | | |
| 1.5 | | |
| 1.5 | |
| Balance as of March 31, 2022, as restated | |
| 26,880,622 | | |
$ | — | | |
$ | 375.0 | | |
$ | 47.6 | | |
$ | (523.3 | ) | |
$ | (100.7 | ) |
| Balance | |
| 26,880,622 | | |
$ | — | | |
$ | 375.0 | | |
$ | 47.6 | | |
$ | (523.3 | ) | |
$ | (100.7 | ) |
The
accompanying notes are an integral part of these unaudited condensed consolidated financial statements.
INSPIRED
ENTERTAINMENT, INC. AND SUBSIDIARIES
CONDENSED
CONSOLIDATED STATEMENTS OF CASH FLOWS
(in
millions)
(Unaudited)
| | |
2023, as restated | | |
2022, as restated | |
| | |
Three Months Ended
March 31, | |
| | |
2023, as restated | | |
2022, as restated | |
| Cash flows from operating activities: | |
| | | |
| | |
| Net (loss) income | |
$ | (1.4 | ) | |
$ | 1.5 | |
| Adjustments to reconcile net loss to net cash provided by operating activities: | |
| | | |
| | |
| Depreciation and amortization | |
| 9.4 | | |
| 10.7 | |
| Amortization of right of use asset | |
| 0.8 | | |
| 1.0 | |
| Profit on sale of trade and assets | |
| — | | |
| (0.9 | ) |
| Stock-based compensation expense | |
| 2.9 | | |
| 2.8 | |
| Contract cost expense | |
| (2.6 | ) | |
| (1.6 | ) |
| Reclassification of loss on hedging instrument to comprehensive income | |
| 0.2 | | |
| 0.2 | |
| Non-cash interest expense relating to senior debt | |
| 0.3 | | |
| 0.4 | |
| Changes in assets and liabilities: | |
| | | |
| | |
| Accounts receivable | |
| 8.3 | | |
| (2.2 | ) |
| Inventory | |
| (3.5 | ) | |
| (11.6 | ) |
| Prepaid expenses and other assets | |
| 1.0 | | |
| — | |
| Corporate tax and other current taxes payable | |
| (6.2 | ) | |
| (7.2 | ) |
| Accounts payable | |
| (2.1 | ) | |
| 4.2 | |
| Deferred revenues and customer prepayment | |
| (0.2 | ) | |
| — | |
| Accrued expenses | |
| 5.6 | | |
| 7.1 | |
| Operating lease liabilities | |
| (0.9 | ) | |
| (1.0 | ) |
| Other long-term liabilities | |
| — | | |
| (0.7 | ) |
| Net cash provided by operating activities | |
| 11.6 | | |
| 2.7 | |
| | |
| | | |
| | |
| Cash flows from investing activities: | |
| | | |
| | |
| Purchases of property and equipment | |
| (5.5 | ) | |
| (5.6 | ) |
| Acquisition of subsidiary company assets | |
| — | | |
| (0.6 | ) |
| Disposal of trade and assets | |
| — | | |
| 1.3 | |
| Acquisition of third-party company trade and assets | |
| (0.6 | ) | |
| — | |
| Purchases of capital software | |
| (2.8 | ) | |
| (3.9 | ) |
| Net cash used in investing activities | |
| (8.9 | ) | |
| (8.8 | ) |
| | |
| | | |
| | |
| Cash flows from financing activities: | |
| | | |
| | |
| Repayments of finance leases | |
| (0.5 | ) | |
| (0.1 | ) |
| Net cash used in financing activities | |
| (0.5 | ) | |
| (0.1 | ) |
| | |
| | | |
| | |
| Effect of exchange rate changes on cash | |
| 0.6 | | |
| (0.8 | ) |
| Net increase (decrease) in cash | |
| 2.8 | | |
| (7.0 | ) |
| Cash, beginning of period | |
| 25.0 | | |
| 47.8 | |
| Cash, end of period | |
$ | 27.8 | | |
$ | 40.8 | |
| | |
| | | |
| | |
| Supplemental cash flow disclosures | |
| | | |
| | |
| Cash paid during the period for interest | |
$ | 0.1 | | |
$ | 0.2 | |
| Cash paid during the period for income taxes | |
$ | 0.1 | | |
$ | — | |
| Cash paid during the period for operating leases | |
$ | 2.1 | | |
$ | 1.7 | |
| | |
| | | |
| | |
| Supplemental disclosure of noncash investing and financing activities | |
| | | |
| | |
| Lease liabilities arising from obtaining right of use assets | |
$ | (0.1 | ) | |
$ | — | |
| Property and equipment transferred to inventory | |
$ | — | | |
$ | 0.6 | |
The
accompanying notes are an integral part of these unaudited condensed consolidated financial statements.
1.
Nature of Operations, Management’s Plans and Summary of Significant Accounting Policies, as restated
Company
Description and Nature of Operations
We
are a global gaming technology company, supplying content, platform, gaming terminals and other products and services to online and land-based
regulated lottery, betting and gaming operators worldwide through a broad range of distribution channels, predominantly on a business-to-business
basis. We provide end-to-end digital gaming solutions (i) on our own proprietary and secure network, which accommodates a wide range
of devices, including land-based gaming machine terminals, mobile devices and online computer applications and (ii) through third party
networks. Our content and other products can be found through the consumer-facing portals of our interactive customers and, through our
land-based customers, in licensed betting offices, adult gaming centers, pubs, bingo halls, airports, motorway service areas and leisure
parks.
Management
Liquidity Plans
As
of March 31, 2023, the Company’s cash on hand was $27.8 million, and the Company had working capital in addition to cash of $24.9
million. The Company recorded a net loss of $1.4 million and net income of $1.5 million for the three months ended March 31, 2023 and
2022, respectively. Net income/losses include non-cash stock-based compensation of $2.9 million and $2.8 million for the three months
ended March 31, 2023 and 2022, respectively. Historically, the Company has generally had positive cash flows from operating activities
and has relied on a combination of cash flows provided by operations and the incurrence of debt and/or the refinancing of existing debt
to fund its obligations. Cash flows provided by operations amounted to $11.6 million and $2.7 million for the three months ended March
31, 2023 and 2022, respectively. The change year on year was due primarily to improved working capital levels, with the three months
ended March 31, 2023 benefitting from favorable receipts due to the timing of sales, and the three months ended March 31, 2022 showing
significant inventory increases after the Company made the strategic decision to secure components and protect sales in a challenging
global supply chain market. Working capital of $52.7 million includes a non-cash settled item of $4.9 million of deferred income. Management
currently believes that, absent any long-term coronavirus (“COVID-19”) impact (see below), the Company’s cash balances
on hand, cash flows expected to be generated from operations, ability to control and defer capital projects and amounts available from
the Company’s external borrowings will be sufficient to fund the Company’s net cash requirements through May 2024.
There
have been no COVID-19 restrictions in the United Kingdom since July 2021 and social distancing measures throughout Greece and Italy are
no longer in force as of the second quarter of 2022. There have been no COVID-19 restrictions in the United States and social distancing
measures are no longer in force. While states have varying requirements based on occupation, no mandates related to, or would prohibit,
our normal business operations.
Basis
of Presentation
The
accompanying unaudited interim condensed consolidated financial statements have been prepared in accordance with accounting principles
generally accepted in the United States of America (“U.S. GAAP”) for interim financial information and pursuant to the instructions
to Form 10-Q and Article 8 of Regulation S-X of the United States Securities and Exchange Commission (“SEC”). Certain information
or footnote disclosures normally included in financial statements prepared in accordance with U.S. GAAP have been condensed or omitted,
pursuant to the rules and regulations of the SEC for interim financial reporting. Accordingly, they do not include all the information
and footnotes necessary for a comprehensive presentation of financial position, results of operations, or cash flows. It is management’s
opinion, however, that the accompanying unaudited interim condensed consolidated financial statements include all adjustments, consisting
of a normal recurring nature, which are necessary for a fair presentation of the financial position, operating results and cash flows
for the periods presented.
The
accompanying unaudited interim condensed consolidated financial statements should be read in conjunction with the Company’s consolidated
financial statements and notes thereto for the years ended December 31, 2022 and 2021. The financial information as of December 31, 2022
is derived from the audited consolidated financial statements presented in the Company’s Annual Report on Form 10-K/A filed with
the SEC on February 27, 2024. The interim results for the three months ended March 31, 2023 are not necessarily indicative of the results
to be expected for the year ending December 31, 2023 or for any future interim periods.
Newly
Adopted Accounting Standards
On
January 1, 2023, the Company adopted Topic 326 Financial Instruments – Credit Losses (“ASC 326”). ASC 326 affects loans,
debt securities, trade receivables, and any other financial assets that have the contractual right to receive cash. It requires an entity
to recognize expected credit losses rather than incurred losses for financial assets and requires a modified retrospective transition
approach through a cumulative-effect adjustment to retained earnings as of the beginning of the period of adoption.
The
adoption of ASC 326 did not have a material impact. Disclosures with respect to allowances for credit losses are given in footnote 4
to these financial statements.
2.
Restatement of Previously Issued Financial Statements
Restatement
Background
On
November 2, 2023, the Company in concurrence with the Company’s audit committee, concluded that our 2023 and 2022 consolidated
financial statements and our unaudited consolidated financial statements as of and for each of the first two quarterly periods in
2023 and all quarterly periods in 2022, included in our Quarterly Reports on Form 10-Q for the respective periods(collectively the
“Prior Period Financial Statements”), should no longer be relied upon due to misstatements that are described below, and
that we would restate such financial statements to make the necessary accounting corrections. Details of the restated consolidated
financial statements as of March 31, 2023 and for the three months ended March 31, 2023 and 2022 are provided below
(“Restatement Items”). Details of the restated consolidated financial statements as of December
31, 2022 are provided in the amendment to the Company’s Annual Report on Form 10-K/A for the year ended December 31, 2022, filed
with the SEC as of the date of this report.
The
Restatements Items reflect adjustments to correct errors in certain financial statement areas including capitalized software and costs
to fulfill a contract, revenue and costs to obtain a contract, inventory, goodwill and intangibles, leasing, pension, and other reclassifications
and immaterial errors identified. The nature and impact of these adjustments are described below and also detailed in the tables below.
The Company issued a revision for capitalized software and related amortization
expense in the quarterly report on Form 10-Q filed on August 11, 2023 for the period ended June 30, 2023 (the “Revision”).This
revision related to certain completed software development projects that were, but should not have been, delayed in the shift from work
in progress to completed projects. Consequently, the commencement of amortization for certain projects was delayed and the reported amortization
was lower than the actual amortization. The Revision covers the period ended March 31, 2023 and the year ended December 31, 2022 and is
distinct from the capitalized software restatements below. The tables below have been updated to separate the impact of the Restatement
Items from the Revision.
Restatement
Items
Capitalized
software and Costs to fulfill a contract – The Company historically assessed and applied incorrectly the accounting frameworks
for developing external use software under ASC 985-20, Costs of Software to Be Sold, Leased or Marketed, and internal-use software
under ASC 350-40, Intangibles – Goodwill and Other – Internal-Use Software and ASC 340-40, Other Assets and Deferred
Costs – Contracts with Customers. In addition,
the Company determined routine software updates and certain minor software enhancements were inappropriately
capitalized and capitalized labor rates inappropriately included certain indirect costs including overhead, and non-development
activities. Consequently, certain amortization was inappropriate.
The corrections resulted in a decrease in Software development costs, net of $17.6 million and an increase in Cost of obtaining and fulfilling
customer contracts, of $7.2 million as of March 31, 2023. The corrections resulted in an
increase to Selling, general and administrative expenses of $1.1 million and $0.5 million as well as a decrease in Depreciation and amortization
of $1.1 million and $0.7 million for the three months ended March 31, 2023 and 2022, respectively.
In addition, the Revision resulted in a decrease in Software development costs, net of $1.0 million for the three months ended
March 31, 2023. Refer to reference “a” below.
Revenue
and Costs to obtain a contract – The Company identified
corrections needed related to ASC 606, Revenue from Contracts with Customers.
The Company identified certain performance obligations were delivered and therefore should
have been recognized at a specific point in time (rather than over time). Additionally, we identified
that (i) for certain Interactive Aggregator contracts, revenue should have been reported on a net, rather than gross, basis and (ii)
certain parts the Company acquired and sold to its contract manufacturer should not have
been reported as revenue. These two items have no impact to profit. The Company also identified
an immaterial contract that should have been recognized as sales type lease rather than
an operating lease. Lastly, the Company had historically expensed certain commissions
in the period incurred instead of capitalizing and amortizing them under the accounting framework for costs to obtain contracts with
customers pursuant to ASC 606, Revenue from Contracts with Customers, and ASC 340-40, Other Assets and Deferred Costs – Contracts
with Customers. The corrections resulted in a decrease in Property and equipment, net of $0.3
million as of
March 31, 2023. The corrections also resulted in a decrease in Deferred revenue, current of $0.2
million, a decrease
in Deferred revenue, net of current position of $0.9
million as of March
31, 2023 and an increase in Costs of obtaining and fulfilling
customer contracts, net of $0.8
million as of March
31, 2023. The corrections also resulted in a decrease in Revenue - service of $0.7
million and $1.0
million for the three
months ended March 31, 2023 and 2022, respectively, a $0.3
million decrease in
Revenue – product sales for the three months ended March 31, 2023 and an $0.7
million increase in
Revenue – product sales for the three months ended March 31, 2022, a decrease in Cost of sales – service of $2.3
million and $1.9
million for the three
months ended March 31, 2023 and 2022, respectively, and a $0.2
million decrease and
$0.5
million increase in
Cost of sales – product sales for the three months ended March 31, 2023 and 2022, respectively. The corrections also resulted in
an increase in Depreciation and amortization increased by $1.6
million and $1.4
million for the three
months ended March 31, 2023 and 2022, respectively. Refer
to reference “b” below. Note 6, “Contract Liabilities and Other Disclosures”
and Note 16, “Segment Reporting and Geographic Information” have also been corrected.
Inventory – The
Company identified an error in the amount capitalized for field
inventory, repair and consumable items. The correction resulted in a decrease of inventory of $1.9 million for the three
months ended March 31, 2023. Refer to reference “c” below. Note 5,
“Inventory” has also been corrected.
Goodwill
and intangibles – Through review of the appropriate
reporting units and asset groups to assess impairments at under ASC 350, Intangibles –
Goodwill and Other and ASC 360, Property, Plant and Equipment,
the Company identified a triggering event in the first quarter of 2020, related to the beginning
of the COVID-19 pandemic, for which impairment assessment was required for (i) Server Based Gaming (“SBG”)
and Acquired Business
reporting units and (ii) all landbased asset groups. Based on the assessment, we determined that an impairment of acquired business
goodwill and long-lived assets occurred in the first quarter of 2020. Additionally, we determined
that a significant number of synergies existed from the acquisition in the fourth quarter of 2019 and therefore a portion of the acquisition
goodwill should have been reallocated to other reporting units upon acquisition. The corrections resulted in a decrease of Depreciation and amortization of $0.1 million for the three months ended March 31, 2022 and
a decrease in Other acquired intangible assets subject to amortization, net of $1.2 million as of March 31, 2023. Refer to reference “d” below.
Leasing –
The Company identified errors related to leasing, which primarily related to the Company not historically including in-substance
fixed payments related to certain leases according to the accounting framework in ASC 842, Leases. The corrections resulted
in an increase in Operating lease right of use asset of $7.6 million, an increase in current Operating lease liabilities of $1.2
million and an increase in long-term Operating lease liabilities of $6.3 million as of March 31, 2023. Refer
to reference “e” below. Note 13, “Leases” has also been
corrected.
Basic
and diluted net
income (loss) per share
– An error to shares outstanding primarily relates to the Company not including
deferred settlement equity awards that had vested in the number of outstanding shares used in the calculation of basic and diluted weighted
average number of shares outstanding pursuant to ASC 260, Earnings Per Share. Refer to reference “h” below. Note 9,
“Net earnings (loss) per share” has also been corrected.
Pension
– The Company had corrections to pension that primarily related to no longer updating the plan liability/ asset quarterly to
comply with US GAAP. The corrections resulted in a reclassification of $1.8 million from Accumulated other comprehensive income to Other
long-term liabilities as of March 31, 2023. In addition, the Company corrected the benefit obligation and fair value of plan assets for
the buy-in contract. The Company corrected the measurement of the plan assets and the estimated fair value of the buy in contract.
Note 15, “Pension Plan” has also been corrected. Refer to reference “g” below.
Other
errors identified – Through the restatement process, the Company has reclassified certain costs for salaries of service employees
and recorded an adjustment related to foreign currency impacts on an intangible. In addition to the reclassification
and intangible adjustment, the Company has corrected other adjustments that are
quantitatively immaterial, individually and in aggregate, because we are correcting for these material errors, we have decided to correct
these other adjustments. Refer to reference “f” below.
Income
tax – The Company updated the income tax effects for the Restatement Items. Note 11, “Income Taxes” has also been
updated.
Summary
impact of Restatement Items to Prior Period Financial Statements
The
following tables present the effect of the Restatement Items on the Company’s consolidated balance sheets for the periods indicated
(in millions, except per share):
Schedule
of Restatement Items to Prior Period Financial Statements
| | |
| | |
| | |
| | |
| | |
|
| | |
As of March 31, 2023 (unaudited) |
| | |
As Previously | | |
Previous | | |
Restatement | | |
| | |
Restatement |
| | |
Reported | | |
Revision | | |
Adjustments | | |
As Restated | | |
References |
| Assets | |
| | |
| | |
| | |
| | |
|
| Cash | |
$ | 27.8 | | |
$ | - | | |
$ | - | | |
$ | 27.8 | | |
|
| Accounts receivable, net | |
| 33.0 | | |
| - | | |
| (0.1 | ) | |
| 32.9 | | |
f |
| Inventory, net | |
| 36.5 | | |
| - | | |
| (1.9 | ) | |
| 34.6 | | |
c |
| Prepaid expenses and other current assets | |
| 31.1 | | |
| - | | |
| (0.4 | ) | |
| 30.7 | | |
f |
| Total current assets | |
| 128.4 | | |
| - | | |
| (2.4 | ) | |
| 126.0 | | |
|
| | |
| | | |
| | | |
| | | |
| | | |
|
| Property and equipment, net | |
| 47.7 | | |
| - | | |
| (0.3 | ) | |
| 47.4 | | |
b |
| Software development costs, net | |
| 38.1 | | |
| (1.0 | ) | |
| (17.6 | ) | |
| 19.5 | | |
a |
| Other acquired intangible assets subject to amortization, net | |
| 14.6 | | |
| - | | |
| (0.3 | ) | |
| 14.3 | | |
d, f |
| Goodwill | |
| 75.8 | | |
| - | | |
| (18.8 | ) | |
| 57.0 | | |
d |
| Operating lease right of use asset | |
| 8.1 | | |
| - | | |
| 7.6 | | |
| 15.7 | | |
e |
| Cost of obtaining and fulfilling customer contracts, net | |
| - | | |
| - | | |
| 7.7 | | |
| 7.7 | | |
a, b |
| Other assets | |
| 3.8 | | |
| - | | |
| 0.3 | | |
| 4.1 | | |
f |
| Total assets | |
$ | 316.5 | | |
$ | (1.0 | ) | |
$ | (23.8 | ) | |
$ | 291.7 | | |
|
| | |
| | | |
| | | |
| | | |
| | | |
|
| Liabilities and Stockholders’ Deficit | |
| | | |
| | | |
| | | |
| | | |
|
| Current liabilities | |
| | | |
| | | |
| | | |
| | | |
|
| Accounts payable | |
| 22.2 | | |
| - | | |
| - | | |
| 22.2 | | |
|
| Accrued expenses | |
| 34.9 | | |
| - | | |
| 0.7 | | |
| 35.6 | | |
f |
| Corporate tax and other current taxes payable | |
| 5.0 | | |
| - | | |
| (1.6 | ) | |
| 3.4 | | |
|
| Deferred revenue, current | |
| 5.1 | | |
| - | | |
| (0.2 | ) | |
| 4.9 | | |
b |
| Operating lease liabilities | |
| 2.8 | | |
| - | | |
| 1.2 | | |
| 4.0 | | |
e |
| Other current liabilities | |
| 3.2 | | |
| - | | |
| - | | |
| 3.2 | | |
|
| Total current liabilities | |
| 73.2 | | |
| - | | |
| 0.1 | | |
| 73.3 | | |
|
| | |
| | | |
| | | |
| | | |
| | | |
|
| Long-term debt | |
| 285.5 | | |
| - | | |
| - | | |
| 285.5 | | |
|
| Finance lease liabilities, net of current portion | |
| 1.2 | | |
| - | | |
| - | | |
| 1.2 | | |
|
| Deferred revenue, net of current portion | |
| 3.2 | | |
| - | | |
| (0.9 | ) | |
| 2.3 | | |
b |
| Operating lease liabilities | |
| 5.6 | | |
| - | | |
| 6.3 | | |
| 11.9 | | |
e |
| Other long-term liabilities | |
| 2.2 | | |
| - | | |
| 1.8 | | |
| 4.0 | | |
g |
| Total liabilities | |
$ | 370.9 | | |
$ | - | | |
$ | 7.3 | | |
$ | 378.2 | | |
|
| | |
| | | |
| | | |
| | | |
| | | |
|
| Commitments and contingencies | |
| | | |
| | | |
| | | |
| | | |
|
| | |
| | | |
| | | |
| | | |
| | | |
|
| Stockholders’ deficit | |
| | | |
| | | |
| | | |
| | | |
|
| Preferred stock; $0.0001 par value; 1,000,000 shares authorized | |
| - | | |
| - | | |
| - | | |
| - | | |
|
| Common stock; $0.0001 par value; 49,000,000 shares authorized; 25,909,516 shares and 26,433,562 shares issued and outstanding at December 31, 2022 and December 31, 2021, respectively | |
| - | | |
| - | | |
| - | | |
| - | | |
|
| Additional paid in capital | |
| 381.2 | | |
| - | | |
| - | | |
| 381.2 | | |
|
| Accumulated other comprehensive income | |
| 46.8 | | |
| - | | |
| 1.5 | | |
| 48.3 | | |
|
| Accumulated deficit | |
| (482.4 | ) | |
| (1.0 | ) | |
| (32.6 | ) | |
| (516.0 | ) | |
|
| Total stockholders’ deficit | |
| (54.4 | ) | |
| (1.0 | ) | |
| (31.1 | ) | |
| (86.5 | ) | |
|
| Total liabilities and stockholders’ deficit | |
$ | 316.5 | | |
$ | (1.0 | ) | |
$ | (23.8 | ) | |
$ | 291.7 | | |
|
The
following tables present the effect of the Restatement Items on the Company’s consolidated statement of operations for the periods
indicated (in millions, except share and per share amounts):
| | |
| | |
| | |
| | |
|
| | |
For Three Months Ended March 31, 2023 (unaudited) |
| | |
As Previously | | |
Restatement | | |
| | |
Restatement |
| | |
Reported | | |
Adjustments | | |
As Restated | | |
References |
| Revenue: | |
| | |
| | |
| | |
|
| Service | |
$ | 58.3 | | |
$ | (0.8 | ) | |
$ | 57.5 | | |
b, f |
| Product sales | |
| 7.7 | | |
| (0.3 | ) | |
| 7.4 | | |
b |
| Total Revenue | |
| 66.0 | | |
| (1.1 | ) | |
| 64.9 | | |
|
| | |
| | | |
| | | |
| | | |
|
| Cost of Sales | |
| | | |
| | | |
| | | |
|
| Cost of service(1) | |
| (10.9 | ) | |
| (4.1 | ) | |
| (15.0 | ) | |
b, f |
| Cost of product sales | |
| (5.8 | ) | |
| (0.9 | ) | |
| (6.7 | ) | |
b, c |
| Selling, general and administrative expenses | |
| (34.3 | ) | |
| 5.1 | | |
| (29.2 | ) | |
a, f |
| Acquisition and integration related transaction expenses | |
| - | | |
| - | | |
| - | | |
|
| Depreciation and amortization | |
| (8.9 | ) | |
| (0.5 | ) | |
| (9.4 | ) | |
a, b |
| Net operating income (loss) | |
| 6.1 | | |
| (1.5 | ) | |
| 4.6 | | |
|
| | |
| | | |
| - | | |
| | | |
|
| Other expense | |
| | | |
| | | |
| | | |
|
| Interest expense, net | |
| (6.3 | ) | |
| - | | |
| (6.3 | ) | |
|
| Gain on disposal of business | |
| - | | |
| - | | |
| - | | |
|
| Other finance income (expense) | |
| 0.1 | | |
| - | | |
| 0.1 | | |
|
| | |
| | | |
| | | |
| | | |
|
| Total other expense, net | |
| (6.2 | ) | |
| - | | |
| (6.2 | ) | |
|
| | |
| | | |
| - | | |
| | | |
|
| Income tax (expense) benefit | |
| (0.1 | ) | |
| 0.3 | | |
| 0.2 | | |
|
| Net loss | |
| (0.2 | ) | |
| (1.2 | ) | |
| (1.4 | ) | |
|
| | |
| | | |
| | | |
| | | |
|
| Other comprehensive income (loss) | |
| | | |
| | | |
| | | |
|
| Foreign currency translation gain (loss) | |
| (1.7 | ) | |
| (1.2 | ) | |
| (2.9 | ) | |
|
| Reclassification of loss on hedging instrument to comprehensive income | |
| 0.2 | | |
| - | | |
| 0.2 | | |
|
| Actuarial gains (losses) on pension plan | |
| 2.0 | | |
| (1.8 | ) | |
| 0.2 | | |
g |
| Other comprehensive income (loss) | |
| 0.5 | | |
| (3.0 | ) | |
| (2.5 | ) | |
|
| | |
| | | |
| | | |
| | | |
|
| Comprehensive income (loss) | |
$ | 0.3 | | |
$ | (4.2 | ) | |
$ | (3.9 | ) | |
|
| | |
| | | |
| | | |
| | | |
|
| Net income (loss) per common share - basic | |
$ | (0.01 | ) | |
$ | (0.04 | ) | |
$ | (0.05 | ) | |
|
| Net income (loss) per common share - diluted | |
$ | (0.01 | ) | |
$ | (0.04 | ) | |
$ | (0.05 | ) | |
|
| | |
| | | |
| | | |
| | | |
|
| Weighted average number of shares outstanding during the year - basic | |
| 26,155,346 | | |
| 1,818,836 | | |
| 27,974,182 | | |
h |
| Weighted average number of shares outstanding during the year - diluted | |
| 26,155,346 | | |
| 1,818,836 | | |
| 27,974,182 | | |
|
| Stock-based compensation included in: | |
| | | |
| | | |
| | | |
|
| Selling, general, and administrative expenses | |
$ | (2.9 | ) | |
| | | |
$ | (2.9 | ) | |
|
| | |
| | | |
| | | |
| | | |
|
| | |
For Three Months Ended March 31, 2022 (unaudited) |
| | |
As Previously | | |
Restatement | | |
| | |
Restatement |
| | |
Reported | | |
Adjustments | | |
As Restated | | |
References |
| Revenue: | |
| | | |
| | | |
| | | |
|
| Service | |
$ | 57.0 | | |
$ | (1.0 | ) | |
$ | 56.0 | | |
b |
| Product Sales | |
| 3.6 | | |
| 0.7 | | |
| 4.3 | | |
b |
| Total Revenue | |
| 60.6 | | |
| (0.3 | ) | |
| 60.3 | | |
|
| | |
| | | |
| | | |
| | | |
|
| Cost of Sales | |
| | | |
| | | |
| | | |
|
| Cost of Service | |
| (11.8 | ) | |
| (5.0 | ) | |
| (16.8 | ) | |
b, f |
| Cost of Product sales | |
| (2.1 | ) | |
| (0.4 | ) | |
| (2.5 | ) | |
b, c |
| Selling, general and administrative expenses | |
| (29.6 | ) | |
| 6.4 | | |
| (23.2 | ) | |
a, f |
| Acquisition and integration related transaction expenses | |
| (0.1 | ) | |
| (0.1 | ) | |
| (0.2 | ) | |
|
| Depreciation and amortization | |
| (10.1 | ) | |
| (0.6 | ) | |
| (10.7 | ) | |
a, b, d |
| Net operating income (loss) | |
| 6.9 | | |
| - | | |
| 6.9 | | |
|
| | |
| | | |
| | | |
| | | |
|
| Other expense | |
| | | |
| | | |
| | | |
|
| Interest expense, net | |
| (6.5 | ) | |
| - | | |
| (6.5 | ) | |
|
| Gain on disposal of business | |
| 0.9 | | |
| - | | |
| 0.9 | | |
|
| Other finance income (expense) | |
| 0.3 | | |
| - | | |
| 0.3 | | |
|
| | |
| | | |
| | | |
| | | |
|
| Total other expense, net | |
| (5.3 | ) | |
| - | | |
| (5.3 | ) | |
|
| | |
| | | |
| | | |
| | | |
|
| Income tax expense | |
| (0.1 | ) | |
| - | | |
| (0.1 | ) | |
|
| Net income | |
| 1.5 | | |
| - | | |
| 1.5 | | |
|
| | |
| | | |
| | | |
| | | |
|
| Other comprehensive income: | |
| | | |
| | | |
| | | |
|
| Foreign currency translation (loss) gain | |
| 2.4 | | |
| 1.1 | | |
| 3.5 | | |
|
| Reclassification of loss on hedging instrument to comprehensive income | |
| 0.2 | | |
| - | | |
| 0.2 | | |
|
| Actuarial gains (losses) on pension plan | |
| 0.7 | | |
| (0.6 | ) | |
| 0.1 | | |
g |
| Other comprehensive income | |
| 3.3 | | |
| 0.5 | | |
| 3.8 | | |
|
| | |
| | | |
| | | |
| | | |
|
| Comprehensive income | |
$ | 4.8 | | |
$ | 0.5 | | |
$ | 5.3 | | |
|
| | |
| | | |
| | | |
| | | |
|
| Net income (loss) per common share - basic | |
$ | 0.06 | | |
$ | (0.01 | ) | |
$ | 0.05 | | |
|
| Net income (loss) per common share - diluted | |
$ | 0.05 | | |
$ | - | | |
$ | 0.05 | | |
|
| | |
| | | |
| | | |
| | | |
|
| Weighted average number of shares outstanding during the year - basic | |
| 26,850,326 | | |
| 1,586,726 | | |
| 28,437,052 | | |
h |
| Weighted average number of shares outstanding during the year - diluted | |
| 29,294,973 | | |
| 67,409 | | |
| 29,362,382 | | |
|
The
following tables present the effect of the Restatement Items on the Company’s consolidated statements of stockholders’ equity
(deficit) for the periods indicated (in millions, except per share amounts):
| | |
| | |
| | |
| | |
| | |
| | |
| | |
|
| | |
| | |
| | |
| | |
Accumulated | | |
| | |
| | |
|
| | |
| | |
| | |
Additional | | |
other | | |
| | |
Total | | |
|
| | |
Common Stock | | |
paid in | | |
comprehensive | | |
Accumulated | | |
stockholders’ | | |
Restatement |
| | |
Shares | | |
Amount | | |
capital | | |
income | | |
deficit | | |
deficit | | |
References |
| | |
| | | |
| | | |
| | | |
| | | |
| | | |
| | | |
|
| Balance as of March 31, 2023 (As Previously Reported) | |
| 26,263,070 | | |
| - | | |
| 381.2 | | |
| 46.8 | | |
| (482.4 | ) | |
| (54.4 | ) | |
|
| Previous Revision | |
| - | | |
| - | | |
| - | | |
| - | | |
| (1.0 | ) | |
| (1.0 | ) | |
|
| Restatement Items | |
| - | | |
| - | | |
| - | | |
| 1.5 | | |
| (32.6 | ) | |
| (31.1 | ) | |
|
| Balance as of March 31, 2023 (As Restated) (Unaudited) | |
| 26,263,070 | | |
$ | - | | |
$ | 381.2 | | |
$ | 48.3 | | |
$ | (516.0 | ) | |
$ | (86.5 | ) | |
|
| | |
| | |
| | |
| | |
| | |
| | |
| | |
|
| | |
| | |
| | |
| | |
Accumulated | | |
| | |
| | |
|
| | |
| | |
| | |
Additional | | |
other | | |
| | |
Total | | |
|
| | |
Common Stock | | |
paid in | | |
comprehensive | | |
Accumulated | | |
stockholders’ | | |
Restatement |
| | |
Shares | | |
Amount | | |
capital | | |
income | | |
deficit | | |
deficit | | |
References |
| | |
| | | |
| | | |
| | | |
| | | |
| | | |
| | | |
|
| Balance as of March 31, 2022 (As Previously Reported) | |
| 26,880,622 | | |
| - | | |
| 375.0 | | |
| 47.1 | | |
| (492.6 | ) | |
| (70.5 | ) | |
|
| Balance | |
| 26,880,622 | | |
| - | | |
| 375.0 | | |
| 47.1 | | |
| (492.6 | ) | |
| (70.5 | ) | |
|
| Restatement Items | |
| - | | |
| - | | |
| - | | |
| 0.5 | | |
| (30.7 | ) | |
| (30.2 | ) | |
|
| Balance as of March 31, 2022 (As Restated) (Unaudited) | |
| 26,880,622 | | |
$ | - | | |
$ | 375.0 | | |
$ | 47.6 | | |
$ | (523.3 | ) | |
$ | (100.7 | ) | |
|
| Balance | |
| 26,880,622 | | |
$ | - | | |
$ | 375.0 | | |
$ | 47.6 | | |
$ | (523.3 | ) | |
$ | (100.7 | ) | |
|
The
following tables present the effect of the Restatement Items on the Company’s consolidated statements of cashflows for the periods
indicated (in millions):
| | |
| | | |
| | | |
| | | |
| | | |
|
| | |
Three Months Ended March 31, 2023 (unaudited) |
| | |
As Previously | | |
Previous | | |
Restatement | | |
| | |
Restatement |
| | |
Reported | | |
Revision | | |
Adjustments | | |
As Restated | | |
References |
| Cash flows from operating activities: | |
| | | |
| | | |
| | | |
| | | |
|
| Net income (loss) | |
$ | (0.2 | ) | |
$ | - | | |
$ | (1.2 | ) | |
$ | (1.4 | ) | |
a, b, c, f |
| Adjustments to reconcile net income (loss) to net cash provided by operating activities: | |
| | | |
| - | | |
| | | |
| | | |
|
| Depreciation and amortization | |
| 8.9 | | |
| - | | |
| 0.5 | | |
| 9.4 | | |
a, b, d |
| Amortization of right of use asset | |
| 0.5 | | |
| - | | |
| 0.3 | | |
| 0.8 | | |
e |
| Profit on sale of trade and asset | |
| | | |
| | | |
| | | |
| | | |
|
| Stock-based compensation expense | |
| 2.9 | | |
| - | | |
| - | | |
| 2.9 | | |
|
| Contract cost expense | |
| - | | |
| - | | |
| (2.6 | ) | |
| (2.6 | ) | |
a, b |
| Reclassification of loss on hedging instrument to comprehensive income | |
| 0.2 | | |
| - | | |
| - | | |
| 0.2 | | |
|
| Non-cash interest expense relating to senior debt | |
| 0.3 | | |
| - | | |
| - | | |
| 0.3 | | |
|
| Changes in assets and liabilities: | |
| | | |
| - | | |
| | | |
| | | |
|
| Accounts receivable | |
| 8.5 | | |
| - | | |
| (0.2 | ) | |
| 8.3 | | |
g |
| Inventory | |
| (4.6 | ) | |
| - | | |
| 1.1 | | |
| (3.5 | ) | |
c, g |
| Prepaid expenses and other assets | |
| 1.6 | | |
| - | | |
| (0.6 | ) | |
| 1.0 | | |
f, g |
| Corporate tax and other current taxes payable | |
| (3.8 | ) | |
| - | | |
| (2.4 | ) | |
| (6.2 | ) | |
g |
| Accounts payable | |
| (4.1 | ) | |
| - | | |
| 2.0 | | |
| (2.1 | ) | |
g |
| Deferred revenues and customer prepayment | |
| (0.3 | ) | |
| - | | |
| 0.1 | | |
| (0.2 | ) | |
g |
| Accrued expenses | |
| 5.5 | | |
| - | | |
| 0.1 | | |
| 5.6 | | |
f, g |
| Other lease liabilities | |
| (0.6 | ) | |
| - | | |
| (0.3 | ) | |
| (0.9 | ) | |
g |
| Other long-term liabilities | |
| - | | |
| - | | |
| - | | |
| - | | |
|
| Net cash provided by operating activities | |
| 14.8 | | |
| - | | |
| (3.2 | ) | |
| 11.6 | | |
|
| | |
| | | |
| | | |
| | | |
| | | |
|
| Cash flows from investing activities: | |
| | | |
| | | |
| | | |
| | | |
|
| Purchases of property and equipment | |
| (6.1 | ) | |
| - | | |
| 0.6 | | |
| (5.5 | ) | |
g |
| Acquisition of subsidiary company assets | |
| - | | |
| - | | |
| | | |
| - | | |
|
| Acquisition of third-party company trade and assets | |
| (0.6 | ) | |
| - | | |
| - | | |
| (0.6 | ) | |
|
| Disposal of trade and assets | |
| | | |
| | | |
| | | |
| | | |
|
| Purchases of capital software | |
| (4.8 | ) | |
| - | | |
| 2.0 | | |
| (2.8 | ) | |
a, g |
| Net cash used in investing activities | |
| (11.5 | ) | |
| - | | |
| 2.6 | | |
| (8.9 | ) | |
|
| | |
| | | |
| | | |
| | | |
| | | |
|
| Cash flows from financing activities: | |
| | | |
| | | |
| | | |
| | | |
|
| Repayments of finance leases | |
| (0.5 | ) | |
| - | | |
| - | | |
| (0.5 | ) | |
|
| Net cash used in financing activities | |
| (0.5 | ) | |
| - | | |
| - | | |
| (0.5 | ) | |
|
| | |
| | | |
| | | |
| | | |
| | | |
|
| Effect of exchange rate changes on cash | |
| - | | |
| - | | |
| 0.6 | | |
| 0.6 | | |
g |
| Net increase (decrease) in cash | |
| 2.8 | | |
| - | | |
| - | | |
| 2.8 | | |
|
| Cash, beginning of period | |
| 25.0 | | |
| - | | |
| 0 | | |
| 25.0 | | |
|
| Cash, end of period | |
$ | 27.8 | | |
| - | | |
| 0 | | |
| 27.8 | | |
|
| | |
| | | |
| | | |
| | | |
| | | |
|
| Supplemental cash flow disclosures | |
| | | |
| | | |
| | | |
| | | |
|
| Cash paid during the period for interest | |
$ | 0.1 | | |
$ | - | | |
$ | - | | |
$ | 0.1 | | |
|
| Cash paid during the period for income taxes | |
$ | 0.1 | | |
$ | - | | |
$ | - | | |
$ | 0.1 | | |
|
| Cash paid during the period for operating leases | |
$ | 1.2 | | |
$ | - | | |
$ | 0.9 | | |
$ | 2.1 | | |
|
| | |
| | | |
| | | |
| | | |
| | | |
|
| Supplemental disclosure of noncash investing and financing activities | |
| | | |
| | | |
| | | |
| | | |
|
| Lease liabilities arising from obtaining right of use assets | |
$ | (0.1 | ) | |
$ | | | |
$ | | | |
$ | (0.1 | ) | |
|
| Property and equipment acquired through finance lease | |
| | | |
| | | |
| | | |
| | | |
|
| Property and equipment transferred to inventory | |
| | | |
| | | |
| | | |
| | | |
|
| | |
Reported | | |
Adjustments | | |
As Restated | | |
References |
| | |
Three Months Ended March 31, 2022 (unaudited) |
| | |
As Previously | | |
Restatement | | |
| | |
Restatement |
| | |
Reported | | |
Adjustments | | |
As Restated | | |
References |
| Cash flows from operating activities: | |
| | | |
| | | |
| | | |
|
| Net income (loss) | |
$ | 1.5 | | |
$ | - | | |
$ | 1.5 | | |
a, b, c, d, f |
| Adjustments to reconcile net income (loss) to net cash provided by operating activities: | |
| | | |
| | | |
| | | |
|
| Depreciation and amortization | |
| 10.1 | | |
| 0.6 | | |
| 10.7 | | |
a, b, d |
| Amortization of right of use asset | |
| 0.7 | | |
| 0.3 | | |
| 1.0 | | |
e |
| Profit on sale of trade and asset | |
| - | | |
| (0.9 | ) | |
| (0.9 | ) | |
f |
| Stock-based compensation expense | |
| 2.8 | | |
| - | | |
| 2.8 | | |
|
| Contract Cost expense | |
| - | | |
| (1.6 | ) | |
| (1.6 | ) | |
a, b |
| Reclassification of loss on hedging instrument to comprehensive income | |
| 0.2 | | |
| - | | |
| 0.2 | | |
|
| Non-cash interest expense relating to senior debt | |
| 0.4 | | |
| - | | |
| 0.4 | | |
|
| Changes in assets and liabilities: | |
| | | |
| | | |
| | | |
|
| Accounts receivable | |
| (2.1 | ) | |
| (0.1 | ) | |
| (2.2 | ) | |
g |
| Inventory | |
| (11.9 | ) | |
| 0.3 | | |
| (11.6 | ) | |
c, g |
| Prepaid expenses and other assets | |
| 0.9 | | |
| (0.9 | ) | |
| - | | |
g |
| Corporate tax and other current taxes payable | |
| (7.2 | ) | |
| - | | |
| (7.2 | ) | |
|
| Accounts payable | |
| 4.3 | | |
| (0.1 | ) | |
| 4.2 | | |
g |
| Deferred revenues and customer prepayment | |
| (0.3 | ) | |
| 0.3 | | |
| - | | |
a, b, g |
| Accrued expenses | |
| 7.1 | | |
| - | | |
| 7.1 | | |
|
| Operating lease liabilities | |
| (0.7 | ) | |
| (0.3 | ) | |
| (1.0 | ) | |
e |
| Other long-term liabilities | |
| (0.7 | ) | |
| - | | |
| (0.7 | ) | |
|
| Net cash provided by operating activities | |
| 5.1 | | |
| (2.4 | ) | |
| 2.7 | | |
|
| | |
| | | |
| | | |
| | | |
|
| Cash flows from investing activities: | |
| | | |
| | | |
| | | |
|
| Purchases of property and equipment | |
| (5.2 | ) | |
| (0.4 | ) | |
| (5.6 | ) | |
|
| Acquisition of subsidiary company assets | |
| (0.6 | ) | |
| - | | |
| (0.6 | ) | |
|
| Disposal of trade and assets | |
| - | | |
| 1.3 | | |
| 1.3 | | |
|
| Purchases of capital software | |
| (5.1 | ) | |
| 1.2 | | |
| (3.9 | ) | |
|
| Net cash used in investing activities | |
| (10.9 | ) | |
| 2.1 | | |
| (8.8 | ) | |
|
| | |
| | | |
| | | |
| | | |
|
| Cash flows from financing activities: | |
| | | |
| | | |
| | | |
|
| Repayments of finance leases | |
| (0.1 | ) | |
| - | | |
| (0.1 | ) | |
|
| Net cash (used in) provided by financing activities | |
| (0.1 | ) | |
| - | | |
| (0.1 | ) | |
|
| | |
| | | |
| | | |
| | | |
|
| Effect of exchange rate changes on cash | |
| (1.1 | ) | |
| 0.3 | | |
| (0.8 | ) | |
g |
| Net increase in cash | |
| (7.0 | ) | |
| - | | |
| (7.0 | ) | |
|
| Cash, beginning of period | |
| 47.8 | | |
| - | | |
| 47.8 | | |
|
| Cash, end of period | |
$ | 40.8 | | |
$ | - | | |
$ | 40.8 | | |
|
| | |
| | | |
| | | |
| | | |
|
| Supplemental cash flow disclosures | |
| | | |
| | | |
| | | |
|
| Cash paid during the period for interest | |
$ | 0.2 | | |
$ | - | | |
$ | 0.2 | | |
|
| Cash paid during the period for income taxes | |
$ | - | | |
$ | - | | |
$ | - | | |
|
| Cash paid during the period for operating leases | |
$ | 0.9 | | |
$ | 0.8 | | |
$ | 1.7 | | |
|
| | |
| | | |
| | | |
| | | |
|
| Supplemental disclosure of noncash investing and financing activities | |
| | | |
| | | |
| | | |
|
| Property and equipment acquired through finance lease | |
$ | - | | |
$ | - | | |
$ | - | | |
|
| Property and equipment transferred to inventory | |
$ | 0.6 | | |
$ | - | | |
$ | 0.6 | | |
|
3.
Acquisitions and Disposals
In
January 2022, the Company sold its Italian VLT business, including all terminal and other assets, staff costs and facilities and contracts
to a non-connected party for total proceeds of €1.1 million ($1.3 million), recognizing a profit on disposal of €0.8 million
($0.9 million). The Company continues to serve these Italian markets in the form of the provision of platform and games.
4.
Allowance for Credit Losses, as restated
Changes
in the allowance for doubtful accounts are as follows:
Schedule
of Changes in Allowance for Doubtful accounts
| | |
March
31, 2023 | | |
December
31, 2022 | |
| | |
(in millions) | |
| Beginning balance | |
$ | (1.4 | ) | |
$ | (1.8 | ) |
| Additional provision for doubtful accounts | |
| (0.1 | ) | |
| (0.2 | ) |
| Recoveries | |
| 0.1 | | |
| — | |
| Write offs | |
| — | | |
| 0.4 | |
| Foreign currency translation adjustments | |
| — | | |
| 0.2 | |
| Ending balance | |
$ | (1.4 | ) | |
$ | (1.4 | ) |
5.
Inventory, as restated
Schedule
of Inventory
| | |
March
31, 2023 | | |
December
31, 2022 | |
| | |
(in millions) | |
| Component parts | |
$ | 21.4 | | |
$ | 20.7 | |
| Work in progress | |
| 2.9 | | |
| 3.6 | |
| Finished goods | |
| 10.3 | | |
| 6.0 | |
| Total inventories | |
$ | 34.6 | | |
$ | 30.3 | |
Component
parts include parts for gaming terminals. Our finished goods inventory primarily consists of gaming terminals which are ready for sale.
6.
Contract Liabilities and Other Disclosures, as restated
The
following table summarizes contract related balances:
Schedule
of Contract Related Balances
| | |
Accounts Receivable | | |
Unbilled Accounts Receivable | | |
Deferred Income | | |
Customer Prepayments and Deposits | |
| | |
(in millions) | |
| At March 31, 2023 | |
$ | 36.7 | | |
$ | 15.4 | | |
$ | (7.2 | ) | |
$ | (2.6 | ) |
| At December 31, 2022 | |
$ | 44.6 | | |
$ | 18.0 | | |
$ | (7.4 | ) | |
$ | (2.4 | ) |
Revenue
recognized that was included in the deferred income balance at the beginning of the period amounted to $1.2 million and $2.5 million
for the three months ended March 31, 2023 and 2022, respectively.
For
the periods ended March 31, 2023 and 2022 respectively, there was
no significant amounts of revenue recognized as a result of changes in contract transaction
price related to performance obligations that were satisfied in the respective prior periods.
7.
Stock-Based Compensation
A
summary of the Company’s RSU activity during the three months ended March 31, 2023 is as follows:
Schedule of Restricted Stock Unit Activity
| | |
Number of Shares | |
| | |
| |
| Unvested Outstanding at January 1, 2023 | |
| 1,647,544 | |
| Granted (1) | |
| 495,225 | |
| Forfeited | |
| (6,266 | ) |
| Vested | |
| (219,272 | ) |
| Unvested Outstanding at March 31, 2023 | |
| 1,917,231 | |
The
Company issued a total of 353,554 shares during the three months ended March 31, 2023 which included an aggregate of 332,227 shares issued
in connection with the net settlement of RSUs that vested during the prior year (on December 30, 2022).
8.
Accumulated Other Comprehensive Loss (Income), as restated
The
accumulated balances for each classification of comprehensive loss (income) are presented below:
Schedule of Accumulated Other Comprehensive Loss (Income)
| | |
Foreign Currency Translation Adjustments | | |
Change in Fair Value of Hedging Instrument | | |
Unrecognized Pension Benefit Costs | | |
Accumulated Other Comprehensive (Income) | |
| | |
(in millions) | |
| Balance at January 1, 2023 | |
| (84.2 | ) | |
| 0.3 | | |
| 33.1 | | |
| (50.8 | ) |
| Change during the period | |
| 2.9 | | |
| (0.2 | ) | |
| (0.2 | ) | |
| 2.5 | |
| Balance at March 31, 2023 | |
$ | (81.3 | ) | |
$ | 0.1 | | |
$ | 32.9 | | |
$ | (48.3 | ) |
| | |
Foreign Currency Translation Adjustments | | |
Change in Fair Value of Hedging Instrument | | |
Unrecognized Pension Benefit Costs | | |
Accumulated Other Comprehensive (Income) | |
| | |
(in millions) | |
| Balance at January 1, 2022 | |
| (71.5 | ) | |
| 1.0 | | |
| 26.7 | | |
| (43.8 | ) |
| Change during the period | |
| (3.5 | ) | |
| (0.2 | ) | |
| (0.1 | ) | |
| (3.8 | ) |
| Balance at March 31, 2022 | |
$ | (75.0 | ) | |
$ | 0.8 | | |
$ | 26.6 | | |
$ | (47.6 | ) |
In
connection with the issuance of Senior Secured Notes and the entry into an RCF Agreement, on May 19, 2021, the Company terminated all
of its interest rate swaps. Accordingly, hedge accounting is no longer applicable. The amounts previously recorded in Accumulated Other
Comprehensive Income are amortized into Interest expense over the terms of the hedged forecasted interest payments. Losses reclassified
from Accumulated Other Comprehensive Income into Interest expense in the Consolidated Statements of Operations and Income for the three
months ended March 31, 2023 and March 31, 2022 amounted to $0.2 million and $0.2 million, respectively.
9.
Net Earnings (Loss) per Share, as restated
Basic
income/(loss) per share (“EPS”) is computed by dividing net income/(loss) attributable to common stockholders by the weighted
average number of common shares outstanding during the period, excluding the effects of any potentially dilutive securities. Diluted
EPS gives effect to all dilutive potential shares of common stock outstanding during the period, including RSUs, using the treasury stock
method, and convertible debt or convertible preferred stock, using the if-converted method, unless the inclusion would be anti-dilutive.
The
computation of diluted EPS excludes the common stock equivalents of the following potentially dilutive securities because they were either
contingently issuable shares or because their inclusion would be anti-dilutive:
Schedule of Anti-dilutive Securities Excluded from Computation of Earnings per Share
| | |
2023 | | |
2022 | |
| | |
Three Months Ended March 31, | |
| | |
2023 | | |
2022 | |
| RSUs | |
$ | 1,917,231 | | |
$ | 695,372 | |
The
following table reconciles the numerators and denominators of the basic and diluted EPS computations for the three months ended March
31, 2022. There were no reconciling items for the three months ended March 31, 2023.
Schedule
of Numerators and Denominators of the Basic and Diluted EPS Computations
| | |
Income
(Numerator) | | |
Shares
(Denominator) | | |
Per-Share Amount,
Three Months
Ended
March 31, 2022 | |
| | |
(in
millions) | | |
| | |
| |
| Basic EPS | |
| | | |
| | | |
| | |
| Income available to common stockholders | |
$ | 1.5 | | |
| 28,437,052 | | |
$ | 0.05 | |
| Effect of Dilutive Securities | |
| | | |
| | | |
| | |
| RSUs | |
| — | | |
| 925,330 | | |
| — | |
| Diluted EPS | |
| | | |
| | | |
| | |
| Income available to common stockholders | |
$ | 1.5 | | |
$ | 29,362,382 | | |
$ | 0.05 | |
The calculation of Basic EPS includes the effects
of 1,893,136 and 1,591,632 shares for the three months ended March 31 2023 and 2022, respectively, with respect to RSU awards that have
vested but have not yet been issued.
10.
Other Finance Income (Expense)
Other
finance income (expense) consisted of the following:
Schedule of Other Finance Income (expense)
| | |
2023 | | |
2022 | |
| | |
Three Months Ended March 31, | |
| | |
2023 | | |
2022 | |
| | |
(in millions) | |
| Pension interest cost | |
$ | (0.8 | ) | |
$ | (0.6 | ) |
| Expected return on pension plan assets | |
| 0.9 | | |
| 0.9 | |
| Other finance income
(expense) | |
$ | 0.1 | | |
$ | 0.3 | |
11.
Income Taxes, as restated
The
effective income tax rate for the three months ended March 31, 2023 and 2022 was 13.2% and 5.3%, as restated, respectively, resulting in a $0.2 million
income tax benefit and $0.1 million income tax expense, respectively.
The
effective tax rate reported in any given year will continue to be influenced by a variety of factors including the level of pre-tax income
or loss, the income mix between jurisdictions, and any discrete items that may occur.
The
Company recorded a valuation allowance against all of our deferred tax assets as of both March 31, 2023 and 2022. We intend to continue
maintaining a full valuation allowance on our deferred tax assets until there is sufficient evidence to support the reversal of all or
some portion of these allowances. However, given our current earnings and anticipated future earnings, we believe that there is a reasonable
possibility that within the next 12 months, sufficient positive evidence may become available to allow us to reach a conclusion that
a significant portion of the valuation allowance will no longer be needed. Release of the valuation allowance would result in the recognition
of certain deferred tax assets and a decrease to income tax expense for the period the release is recorded. However, the exact timing
and amount of the valuation allowance release are subject to change on the basis of the level of profitability that we are able to actually
achieve.
12.
Related Parties
Macquarie
Corporate Holdings Pty Limited (UK Branch) (“Macquarie UK”), (an arranger and lending party under our RCF Agreement) is an
affiliate of MIHI LLC, which beneficially owned approximately 11.51% of our common stock as of March 31, 2023. Macquarie UK did not hold
any of the Company’s aggregate senior debt at March 31, 2023 or December 31, 2022. Interest expense payable to Macquarie UK for
the three months ended March 31, 2023 and 2022 amounted to $0.0 million and $0.0 million, respectively. MIHI LLC is also a party to a
stockholders agreement with the Company and other stockholders, dated December 23, 2016, pursuant to which, subject to certain conditions,
MIHI LLC, jointly with Hydra Industries Sponsor LLC, are permitted to designate two directors to be nominated for election as directors
of the Company at any annual or special meeting of stockholders at which directors are to be elected, until such time as MIHI LLC and
Hydra Industries Sponsor LLC in the aggregate hold less than 5% of the outstanding shares of the Company.
On
December 31, 2021, the Company entered into a consultancy agreement with Richard Weil, the brother of A. Lorne Weil, our Executive Chairman,
under which he received a success fee in the amount of $0.1 million for services he provided in connection with our acquisition of Sportech
Lotteries, LLC. The success fee was paid during the year ended December 31, 2022. Under the agreement, as extended in November 2022,
he will provide consulting services relating to the lottery in the Dominican Republic through to June 30, 2023 at a rate of $10,000 per
month and, with respect to such services, the aggregate amount incurred by the Company in consulting fees for each of the three months
ended March 31, 2023 and March 31, 2022 was $30,000.
13.
Leases, as restated
Certain
of our arrangements include leases for equipment installed at customer locations. As the lessor, we combine lease and non-lease components
for all classes of underlying assets in arrangements that involve operating leases. The single combined component is accounted for under
ASC 606, Revenue from Contracts with Customers based on the consideration that the non-lease components are the predominant items
in the arrangements. If a component cannot be combined, the consideration is allocated between the lease component and the non-lease
component based on relative standalone selling price. The lease component is accounted for under ASC 842, Leases and the non-lease
component is accounted for under ASC 606.
Lease
income from operating leases and from sales type leases is not material for any of the periods presented.
14.
Commitments and Contingencies
Employment
Agreements
We
are party to employment agreements with our executive officers and other employees of the Company and our subsidiaries which contain,
among other terms, provisions relating to severance and notice requirements.
Arrangements
with Daniel B. Silvers, former Executive Vice President and Chief Strategy Officer
Effective
January 10, 2023, Mr. Silvers stepped down from his position as Executive Vice President and Chief Strategy Officer of the Company. Pursuant
to Mr. Silvers’ employment agreement dated December 14, 2016, as amended, Mr. Silvers was entitled to receive a base salary at
a rate of $385,000 per year, a target annual bonus of not less than 100% of his base salary and a maximum annual bonus of 200% of his
base salary. He was also entitled to reimbursement for private medical insurance and to certain severance benefits.
Legal
Matters
From
time to time, the Company may become involved in lawsuits and legal matters arising in the ordinary course of business. While the Company
believes that, currently, it has no such matters that are material, there can be no assurance that existing or new matters arising in
the ordinary course of business will not have a material adverse effect on the Company’s business, financial condition or results
of operations.
15.
Pension Plan, as restated
We
operate a defined contribution plan in the US, and both defined benefit and defined contribution pension schemes in the UK. The defined
contribution scheme assets are held separately from those of the Company in independently administered funds.
Defined
Benefit Pension Scheme
The
defined benefit scheme has been closed to new entrants since April 1, 1999 and closed to future accruals for services rendered to the
Company for the entire financial statement periods presented. The Actuarial Valuation of the scheme as at March 31, 2021, determined
that the statutory funding objective was not met, i.e., there were insufficient assets to cover the scheme’s technical provisions
and there was a funding shortfall.
In
June 2022, a recovery plan was put in place to eliminate the funding shortfall. The plan expects the shortfall to be eliminated by October
31, 2026. Deficit reduction contributions of 1.1 million and expense contributions of $0.3 million will be payable during the year ending
December 31, 2023.
The
total amount of employer contributions paid during the three months ended March 31, 2023 amounted to $0.3 million.
The
following table presents the components of our net periodic pension benefit:
Schedule of Defined Benefit Plans
| | |
2023 | | |
2022 | |
| | |
Three Months Ended March 31, | |
| | |
2023 | | |
2022 | |
| | |
(in millions) | |
| Components of net periodic pension benefit: | |
| | |
| |
| Interest cost | |
$ | 0.8 | | |
$ | 0.6 | |
| Expected return on plan assets | |
| (0.9 | ) | |
| (0.9 | ) |
| Amortization of net loss | |
| 0.2 | | |
| 0.1 | |
| Net periodic benefit | |
$ | 0.1 | | |
$ | (0.2 | ) |
The
following table sets forth the estimate of the combined funded status of the pension plans and their reconciliation to the related amounts
recognized in our consolidated financial statements at the respective measurement dates:
Schedule of Pension Plans and their Reconciliation
| | |
March
31, 2023 | | |
December
31, 2022 | |
| | |
(in millions) | |
| Change in benefit obligation: | |
| | | |
| | |
| Benefit obligation at beginning of period | |
$ | 71.2 | | |
$ | 122.7 | |
| Interest cost | |
| 0.8 | | |
| 2.2 | |
| Actuarial loss (gain) | |
| — | | |
| (39.0 | ) |
| Benefits paid | |
| (0.7 | ) | |
| (3.5 | ) |
| Foreign currency translation adjustments | |
| 1.9 | | |
| (11.2 | ) |
| Benefit obligation at end of period | |
$ | 73.2 | | |
$ | 71.2 | |
| Change in plan assets: | |
| | | |
| | |
| Fair value of plan assets at beginning of period | |
$ | 69.1 | | |
$ | 125.7 | |
| Actual gain (loss) on plan assets | |
| 0.9 | | |
| (42.4 | ) |
| Employer contributions | |
| 0.3 | | |
| 1.4 | |
| Benefits paid | |
| (0.7 | ) | |
| (3.5 | ) |
| Foreign currency translation adjustments | |
| 1.8 | | |
| (12.1 | ) |
| Fair value of assets at end of period | |
$ | 71.4 | | |
$ | 69.1 | |
| Amount recognized in the consolidated balance sheets: | |
| | | |
| | |
| Unfunded status (non-current) | |
$ | (1.8 | ) | |
$ | (2.1 | ) |
| Net amount recognized | |
$ | (1.8 | ) | |
$ | (2.1 | ) |
16.
Segment Reporting and Geographic Information, as restated
The
Company operates its business along four operating segments, which are segregated on the basis of revenue stream: Gaming, Virtual Sports,
Interactive and Leisure. The Company believes this method of segment reporting reflects both the way its business segments are managed
and the way the performance of each segment is evaluated.
The
following tables present revenue, cost of sales, excluding depreciation and amortization, selling, general and administrative expenses,
depreciation and amortization, stock-based compensation expense and acquisition related transaction expenses, operating profit/(loss),
and total capital expenditures for the periods ended March 31, 2023 and March 31, 2022, respectively, by business segment. Certain unallocated
corporate function costs have not been allocated to the Company’s reportable operating segments because these costs are not allocable
and to do so would not be practical. Corporate function costs consist primarily of selling, general and administrative expenses, depreciation
and amortization, capital expenditures, right of use assets, cash, prepaid expenses and property and equipment and software development
costs relating to corporate/shared functions.
Segment
Information
Schedule of Segment Reporting Information by Segment
Three
Months Ended March 31, 2023
| | |
Gaming | | |
Virtual Sports | | |
Interactive | | |
Leisure | | |
Corporate Functions | | |
Total | |
| | |
(in millions) | |
| Revenue: | |
| | |
| | |
| | |
| | |
| | |
| |
| Service | |
$ | 20.2 | | |
$ | 14.8 | | |
$ | 5.9 | | |
$ | 16.6 | | |
$ | — | | |
$ | 57.5 | |
| Product sales | |
| 6.9 | | |
| — | | |
| — | | |
| 0.5 | | |
| — | | |
| 7.4 | |
| Total revenue | |
| 27.1 | | |
| 14.8 | | |
| 5.9 | | |
| 17.1 | | |
| — | | |
| 64.9 | |
| Cost of sales, excluding depreciation and amortization: | |
| | | |
| | | |
| | | |
| | | |
| | | |
| | |
| Cost of service | |
| (5.9 | ) | |
| (0.4 | ) | |
| (0.3 | ) | |
| (8.4 | ) | |
| — | | |
| (15.0 | ) |
| Cost of product sales | |
| (5.8 | ) | |
| — | | |
| — | | |
| (0.9 | ) | |
| — | | |
| (6.7 | ) |
| Selling, general and administrative expenses | |
| (5.7 | ) | |
| (1.7 | ) | |
| (2.5 | ) | |
| (6.9 | ) | |
| (9.5 | ) | |
| (26.3 | ) |
| Stock-based compensation expense | |
| (0.3 | ) | |
| (0.2 | ) | |
| (0.2 | ) | |
| (0.1 | ) | |
| (2.1 | ) | |
| (2.9 | ) |
| Acquisition and integration related transaction expenses | |
| — | | |
| — | | |
| — | | |
| — | | |
| — | | |
| — | |
| Depreciation and amortization | |
| (4.5 | ) | |
| (0.8 | ) | |
| (0.6 | ) | |
| (3.1 | ) | |
| (0.4 | ) | |
| (9.4 | ) |
| Segment operating income (loss) | |
| 4.9 | | |
| 11.7 | | |
| 2.3 | | |
| (2.3 | ) | |
| (12.0 | ) | |
| 4.6 | |
| | |
| | | |
| | | |
| | | |
| | | |
| | | |
| | |
| Net operating income | |
| | | |
| | | |
| | | |
| | | |
| | | |
$ | 4.6 | |
| | |
| | | |
| | | |
| | | |
| | | |
| | | |
| | |
| Total capital expenditures for the three months ended March 31, 2023 | |
$ | 2.4 | | |
$ | 0.4 | | |
$ | 1.1 | | |
$ | 5.2 | | |
$ | 0.5 | | |
$ | 9.6 | |
Three
Months Ended March 31, 2022
| | |
Gaming | | |
Virtual Sports | | |
Interactive | | |
Leisure | | |
Corporate Functions | | |
Total | |
| | |
(in millions) | |
| Revenue: | |
| | |
| | |
| | |
| | |
| | |
| |
| Service | |
$ | 21.1 | | |
$ | 11.3 | | |
$ | 4.6 | | |
$ | 19.0 | | |
$ | — | | |
$ | 56.0 | |
| Product sales | |
| 3.7 | | |
| — | | |
| — | | |
| 0.6 | | |
| — | | |
| 4.3 | |
| Total revenue | |
| 24.8 | | |
| 11.3 | | |
| 4.6 | | |
| 19.6 | | |
| — | | |
| 60.3 | |
| Cost of sales, excluding depreciation and amortization: | |
| | | |
| | | |
| | | |
| | | |
| | | |
| | |
| Cost of service | |
| (6.0 | ) | |
| (0.4 | ) | |
| (0.3 | ) | |
| (10.1 | ) | |
| — | | |
| (16.8 | ) |
| Cost of product sales | |
| (2.3 | ) | |
| — | | |
| — | | |
| (0.2 | ) | |
| — | | |
| (2.5 | ) |
| Selling, general and administrative expenses | |
| (5.0 | ) | |
| (1.7 | ) | |
| (1.4 | ) | |
| (6.6 | ) | |
| (5.7 | ) | |
| (20.4 | ) |
| Stock-based compensation expense | |
| (0.3 | ) | |
| (0.1 | ) | |
| (0.1 | ) | |
| (0.2 | ) | |
| (2.1 | ) | |
| (2.8 | ) |
| Acquisition and integration related transaction expenses | |
| (0.1 | ) | |
| — | | |
| — | | |
| — | | |
| (0.1 | ) | |
| (0.2 | ) |
| Depreciation and amortization | |
| (5.2 | ) | |
| (0.8 | ) | |
| (0.6 | ) | |
| (3.6 | ) | |
| (0.5 | ) | |
| (10.7 | ) |
| Segment operating income (loss) | |
| 5.9 | | |
| 8.3 | | |
| 2.2 | | |
| (1.1 | ) | |
| (8.4 | ) | |
| 6.9 | |
| | |
| | | |
| | | |
| | | |
| | | |
| | | |
| | |
| Net operating income | |
| | | |
| | | |
| | | |
| | | |
| | | |
$ | 6.9 | |
| | |
| | | |
| | | |
| | | |
| | | |
| | | |
| | |
| Total capital expenditures for the three months ended March 31, 2022 | |
$ | 2.9 | | |
$ | 0.5 | | |
$ | 0.9 | | |
$ | 4.0 | | |
$ | 1.2 | | |
$ | 9.5 | |
Geographic
Information
Geographic
information for revenue is set forth below:
Schedule of Geographic Information
| | |
2023 | | |
2022 | |
| | |
Three Months Ended March 31, | |
| | |
2023 | | |
2022 | |
| | |
(in millions) | |
| Total revenue | |
| | | |
| | |
| UK | |
$ | 49.0 | | |
$ | 45.9 | |
| Greece | |
| 5.6 | | |
| 5.6 | |
| Rest of world | |
| 10.3 | | |
| 8.8 | |
| Total | |
$ | 64.9 | | |
$ | 60.3 | |
| Total
revenue | |
$ | 64.9 | | |
$ | 60.3 | |
UK
revenue includes revenue from customers headquartered in the UK, but whose revenue is generated globally.
Geographic
information of our non-current assets excluding goodwill is set forth below:
| | |
March
31, 2023 | | |
December
31, 2022 | |
| | |
(in millions) | |
| UK | |
$ | 87.5 | | |
$ | 82.7 | |
| Greece | |
| 5.1 | | |
| 5.8 | |
| Rest of world | |
| 16.1 | | |
| 16.3 | |
| Total | |
$ | 108.7 | | |
$ | 104.8 | |
| Total non-current assets excluding goodwill | |
$ | 108.7 | | |
$ | 104.8 | |
Software
development costs are included as attributable to the market in which they are utilized.
17.
Customer Concentration
During
the three months ended March 31, 2023, there was one customer that represented at least 10% of the Company’s revenues, accounting
for 15% of the Company’s revenues. This customer was served by the Virtual Sports and Interactive segments. During the three months
ended March 31, 2022, there was one customer that represented at least 10% of the Company’s revenues, accounting for 12% of the
Company’s revenues. This customer was served by the Virtual Sports and Interactive segments.
At
March 31, 2023 no customers represented at least 10% of the Company’s accounts receivable. At December 31, 2022, there was one
customer that represented at least 10% of the Company’s accounts receivable, accounting for 24% of the Company’s accounts
receivable.
18.
Subsequent Events
The
Company evaluates subsequent events and transactions that occur after the balance sheet date up to the date that the financial
statements were issued. Other than as described below, and except for the effects of the restatement as discussed in Note 2 to the
consolidated financial statements, the Company did not identify subsequent events that would have required adjustment or disclosure
in the consolidated financial statements.
On
April 10, 2023, the Company’s Board of Directors adopted the 2023 Omnibus Incentive Plan (the “2023 Plan”), subject
to the approval of our stockholders, which was obtained at the Company’s annual meeting of stockholders held on May 9, 2023. The
2023 Plan authorizes a total of 2,700,000 shares to be issued pursuant to awards and will also replace the Company’s predecessor
plan (the 2021 Plan) such that shares available for grant under the 2021 Plan would instead be available for grant under the 2023 Plan.
Upon approval of the 2023 Plan, the sign-on RSUs previously disclosed for Messrs. Weil and Pierce as part of amendments to their employment
contracts in January 2023 were effective (comprising an aggregate of 250,000 performance-based RSUs and 125,000 stock price-based RSUs).
ITEM
2. MANAGEMENT’S DISCUSSION AND ANALYSIS OF FINANCIAL CONDITION AND RESULTS OF OPERATIONS
The
following discussion and analysis of our financial condition and results of operations should be read in conjunction with the financial
statements and related notes thereto included elsewhere in this report. This discussion contains forward-looking statements that involve
risks and uncertainties. Our actual future results could differ materially from the historical results discussed below. Factors that
could cause or contribute to such differences include, but are not limited to, those identified below and those referenced in the section
titled “Risk Factors” included elsewhere in this report.
Forward-Looking
Statements
We
make forward-looking statements in this Management’s Discussion and Analysis of Financial Condition and Results of Operations.
For definitions of the term Forward-Looking Statements, see the definitions provided in the Cautionary Note Regarding Forward-Looking
Statements at the start of this Quarterly Report on Form 10-Q for the period ended March 31, 2023.
Seasonality
Our
results of operations can fluctuate due to seasonal trends and other factors. Sales of our gaming machines can vary quarter on quarter
due to both supply and demand factors. Player activity for our holiday parks is generally higher in the second and third quarters of
the year, particularly during the summer months and slower during the first and fourth quarters of the year. Historical seasonality has
been impacted by COVID-19 business disruptions and could continue to be impacted in future periods.
Revenue
We
generate revenue in four principal ways: i) on a participation basis, ii) on a fixed rental fee basis, iii) through product sales, (iv)
services provided and v) through software license fees. Participation revenue generally includes a right to receive a share of our customers’
gaming revenue, typically as a share of net win but sometimes as a share of the handle or “coin in” which represents the
total amount wagered.
Geographic
Range
Geographically,
the majority of our revenue is derived from, and the majority of our non-current assets are attributable to, our UK operations. The remainder
of our revenue is derived from, and non-current assets attributable to, Greece and the rest of the world (including North America).
For
the three months ended March 31, 2023, and the three-months ended March 31, 2022 we derived approximately 76% of our revenue from
the UK (including customers headquartered in the UK but whose revenue is generated globally), 9% from Greece, and the remaining 15%
across the rest of the world.
As
of March 31, 2023, our non-current assets (excluding goodwill) were attributable as follows: 80% to the UK, 5% to Greece and 15% across
the rest of the world.
Foreign
Exchange
Our
results are affected by changes in foreign currency exchange rates as a result of the translation of foreign functional currencies into
our reporting currency and the re-measurement of foreign currency transactions and balances. The impact of foreign currency exchange
rate fluctuations represents the difference between current rates and prior-period rates applied to current activity. The geographic
region in which the largest portion of our business is operated is the UK and the British pound (“GBP”) is considered to
be our functional currency. Our reporting currency is the U.S. dollar (“USD”). Our results are translated from our functional
currency of GBP into the reporting currency of USD using average rates for profit and loss transactions and applicable spot rates for
period-end balances. The effect of translating our functional currency into our reporting currency, as well as translating the results
of foreign subsidiaries that have a different functional currency into our functional currency, is reported separately in Accumulated
Other Comprehensive Income.
During
the three months ended March 31, 2023 and March 31, 2022, we derived approximately 25% of our revenue from sales to customers outside
the UK.
In
the section “Results of Operations” below, currency impacts shown have been calculated as the current-period average GBP:USD
rate less the equivalent average rate in the prior period, multiplied by the current period amount in our functional currency (GBP).
The remaining difference, referred to as functional currency at constant rate, is calculated as the difference in our functional currency,
multiplied by the prior-period average GBP:USD rate. This is not a U.S. GAAP measure, but is one which management believes gives a clearer
indication of results. In the tables below, variances in particular line items from period to period exclude currency translation movements,
and currency translation impacts are shown independently.
Non-GAAP
Financial Measures
We
use certain financial measures that are not compliant with U.S. GAAP (“Non-GAAP financial measures”), including EBITDA and
Adjusted EBITDA, to analyze our operating performance. In this discussion and analysis, we present certain non-GAAP financial measures,
define and explain these measures and provide reconciliations to the most comparable U.S. GAAP measures. See “Non-GAAP Financial
Measures” below.
Results
of Operations
Our
results are affected by changes in foreign currency exchange rates, primarily between our functional currency (GBP) and our reporting
currency (USD). During the periods ended March 31, 2023 and March 31, 2022, the average GBP:USD rates were for the three-month period
1.21 and 1.34, respectively.
The
following discussion and analysis of our results of operations has been organized in the following manner:
| |
● |
a
discussion and analysis of the Company’s results of operations for the three-month period ended March 31, 2023, compared to
the same period in 2022; and |
| |
|
|
| |
● |
a
discussion and analysis of the results of operations for each of the Company’s segments (Gaming, Virtual Sports, Interactive
and Leisure) for the three-month periods ended March 31, 2023, compared to the same period in 2022, including KPI analysis. |
In
the discussion and analysis below, certain data may vary from the amounts presented in our consolidated financial statements due to rounding.
For
all reported variances, refer to the overall company and segment tables shown below. All variances discussed in the overall company and
segment results are on a functional currency (at constant rate) basis, which excludes the impact of any changes in foreign currency exchange
rates.
Restatement
of Previously Issued Financial Statements
Restatement
Background
On
November 2, 2023, the Company in concurrence with the Company’s audit committee, concluded that our 2023 and 2022 consolidated
financial statements and our unaudited consolidated financial statements as of and for each of the first two quarterly periods in 2023
and all quarterly periods in 2022, included in our Quarterly Reports on Form 10-Q for the respective periods(collectively the “Prior
Period Financial Statements”), should no longer be relied upon due to misstatements that are described below, and that we would
restate such financial statements to make the necessary accounting corrections. Details of the restated consolidated financial statements
as of March 31, 2023 and for the three months ended March 31, 2023 and 2022 are provided below (“Restatement Items”).
The
Restatements Items reflect adjustments to correct errors in certain financial statement areas including capitalized software and costs
to fulfill a contract, revenue and costs to obtain a contract, inventory, goodwill and intangibles, leasing, pension, and other reclassifications
and immaterial errors identified. The nature and impact of these adjustments are described in footnote 2 of the financial statements.
..
The Company issued a revision
for capitalized software and related amortization expense in the quarterly report on Form 10-Q filed on August 11, 2023 for the period
ended June 30, 2023 (the “Revision”). This revision related to certain completed software development projects that were,
but should not have been, delayed in the shift from work in progress to completed projects. Consequently, the commencement of amortization
for certain projects was delayed and the reported amortization was lower than the actual amortization. The Revision covers the period
ended June 30, 2023 and the year ended December 31, 2022 and is distinct from the capitalized software restatements below. The tables
below have been updated to separate the impact of the Restatement Items from the Revision.
Overall
Company Results
Three
Months ended March 31, 2023, compared to Three Months ended March 31, 2022
| | |
| | |
Variance | |
| (In millions) | |
For the Three-Month Period ended | | |
2023 vs 2022 | |
| | |
March
31, 2023
As Restated | | |
March
31, 2022
As Restated | | |
Variance Attributable to Currency Movement | | |
Variance
on a Functional currency basis | | |
Total Functional Currency
Variance % | | |
Total Reported
Variance % | |
| Revenue: | |
| | |
| | |
| | |
| | |
| | |
| |
| Service | |
$ | 57.5 | | |
$ | 56.0 | | |
$ | (6.0 | ) | |
$ | 7.5 | | |
| 13.4 | % | |
| 2.7 | % |
| Product | |
| 7.4 | | |
| 4.3 | | |
| (0.7 | ) | |
| 3.8 | | |
| 88.4 | % | |
| 72.1 | % |
| Total revenue | |
| 64.9 | | |
| 60.3 | | |
| (6.7 | ) | |
| 11.3 | | |
| 18.7 | % | |
| 7.6 | % |
| Cost of Sales, excluding depreciation and amortization: | |
| | | |
| | | |
| | | |
| | | |
| | | |
| | |
| Cost of Service | |
| (15.0 | ) | |
| (16.8 | ) | |
| 1.5 | | |
| 0.3 | | |
| 1.8 | % | |
| (10.7 | )% |
| Cost of Product | |
| (6.7 | ) | |
| (2.5 | ) | |
| 0.7 | | |
| (4.9 | ) | |
| 196.0 | % | |
| 168.0 | % |
| Selling, general and administrative expenses | |
| (26.3 | ) | |
| (20.4 | ) | |
| 2.8 | | |
| (8.7 | ) | |
| 42.6 | % | |
| 28.9 | % |
| Stock-based compensation | |
| (2.9 | ) | |
| (2.8 | ) | |
| 0.3 | | |
| (0.4 | ) | |
| 14.3 | % | |
| 3.6 | % |
| Acquisition and integration related transaction expenses | |
| - | | |
| (0.2 | ) | |
| - | | |
| 0.2 | | |
| N/A | | |
| N/A | |
| Depreciation and amortization | |
| (9.4 | ) | |
| (10.7 | ) | |
| 0.7 | | |
| 0.6 | | |
| (5.6% | ) | |
| (12.1 | %) |
| Net operating Income (Loss) | |
| 4.6 | | |
| 6.9 | | |
| (0.7 | ) | |
| (1.6 | ) | |
| (23.2 | %) | |
| (33.3 | %) |
| Other income (expense) | |
| | | |
| | | |
| | | |
| | | |
| | | |
| | |
| Interest expense, net | |
| (6.3 | ) | |
| (6.5 | ) | |
| 0.7 | | |
| (0.5 | ) | |
| 7.7 | % | |
| (3.1 | )% |
| Profit on disposal of trade & assets | |
| - | | |
| 0.9 | | |
| (0.0 | ) | |
| (0.9 | ) | |
| N/A | | |
| N/A | |
| Other finance income (expense) | |
| 0.1 | | |
| 0.3 | | |
| (0.0 | ) | |
| (0.2 | ) | |
| (66.7 | %) | |
| (66.7 | %) |
| Total other income (expense), net | |
| (6.2 | ) | |
| (5.3 | ) | |
| 0.7 | | |
| (1.6 | ) | |
| 30.2 | % | |
| 17.0 | % |
| Net Income (loss) from continuing operations before income taxes | |
| (1.6 | ) | |
| 1.6 | | |
| (0.0 | ) | |
| (3.2 | ) | |
| (200 | %) | |
| (200 | %) |
| Income tax expense | |
| 0.2 | | |
| (0.1 | ) | |
| (0.0 | ) | |
| 0.3 | | |
| (300.0 | %) | |
| (300.0 | %) |
| | |
| | | |
| | | |
| | | |
| | | |
| | | |
| | |
| Net Income (Loss) | |
$ | (1.4 | ) | |
$ | 1.5 | | |
$ | (0.0 | ) | |
$ | (2.9 | ) | |
| (193.3 | %) | |
| (193.3 | %) |
| | |
| | | |
| | | |
| | | |
| | | |
| | | |
| | |
| Exchange Rate - $ to £ | |
| 1.21 | | |
| 1.34 | | |
| | | |
| | | |
| | | |
| | |
See
“Segments Results” below for a more detailed explanation of the significant changes in our components of revenue within the
individual segment results of operations.
Revenue
Consolidated
Reported Revenue by Segment (As Restated)
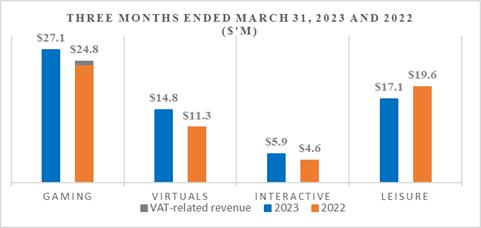
| ● |
There
was no VAT-related revenue for the three-months ended March 31, 2023. For the three-months ended March 31, 2022 VAT-related revenue
was $0.9 million. |
“VAT-related
revenue” are payments from UK customers related to our contractual revenue share of their value-added tax rebate.
For
the three months ended March 31, 2023, revenue on a functional currency (at constant rate) basis increased by $11.3 million, or 19%.
For
the three-month period, Gaming service revenue grew by $1.2 million predominantly due to an increase in UK markets of $1.4 million. Gaming
Product revenue increased by $3.9 million predominately due to UK product sales. Virtual Sports and Interactive grew by $5.1 million
and $2.0 million, respectively, with $4.6 million of the Virtuals Sports increase from Online and $0.5 million from Retail. Interactive
growth was driven by revenue growth in the UK, US and Canada. These increases were offset by Leisure service revenue reduction of $0.8
million predominately driven by the reduction in the number of machines operated in the Pubs sector primarily due to the structured
withdrawal of non-core low-margin amusement and prize vend machines as recognized in the third quarter of 2022 as well as the reduction
in the number of gaming machines.
Cost
of Sales, excluding depreciation and amortization
Cost
of sales, excluding depreciation and amortization, for the three months ended March 31, 2023, increased by $4.6 million, or 24%. The
increase was driven a $4.9 million increase in cost of product, predominately driven by the increase in Product sales.
Selling,
general and administrative expenses
Selling,
general and administrative (“SG&A”) expenses for the three months ended March 31, 2023 increased by $8.7 million, or
43%.
The
increase was driven primarily by the costs of group restructure of $2.9 million (removed from Adjusted EBITDA), an increase in non-staff
costs of $3.0 million, of which the largest proportion was driven by exhibition costs of $0.8 million that were not incurred in the prior
period, and an increase in staff cost of $2.4 million, driven by an increase in heads predominantly from an investment in the technology
and commercial areas of our business.
Stock-based
compensation
During
the three months ended March 31, 2023, the Company recorded expenses of $2.9 million compared to expenses of $2.8 million for the three
months ended March 31, 2022. All expenses were related to outstanding awards. The three months ended March 31, 2023 included an expense
of $0.7 million relating to the group restructure.
Depreciation
and amortization
Depreciation
and amortization decreased for the three-month period by $0.6 million. This was driven by Leisure with a reduction of $0.2 million
due to assets being fully written down, partly offset by $0.1 and $0.3 million increases in both Virtual Sports and Interactive
respectively for depreciation and amortization expenses.
Net
operating income/(loss)
During
the three-month period, net operating income was $4.6 million, a decrease of $1.6 million compared to the prior year period. The decrease
was attributable primarily to the increase in Selling, general and administrative expenses and in Stock-based compensation (including
the cost of group restructure). This was partially offset by the increase in gross margin as well as the decrease in depreciation and
amortization expenses.
Net
Income/ (loss)
For
the three-months ended March 31, 2023 net loss was $1.4 million, compared to a net income of $1.5 million in the prior period. The $2.9
million decline year-over-year, was primarily due to the cost of group restructure driving the decline in net operating income, an increase
in interest expense, net of $0.5 million, due to $0.4 million increase in charges relating to a discounted unwind on provisions for dilapidations
linked to various properties, as well as decreases in other finance income of $0.2 million and gain on disposal of trade and assets of
$0.9 million compared to the prior year period.
Deferred
Tax
We
recorded a valuation allowance against all of our deferred tax assets as of both March 31, 2023, and March 31, 2022. We intend to continue
maintaining a full valuation allowance on our deferred tax assets until there is sufficient evidence to support the reversal of all or
some portion of these allowances. However, given our current earnings and anticipated future earnings, we believe that there is a reasonable
possibility that within the next 12 months, sufficient positive evidence may become available to allow us to reach a conclusion that
a significant portion of the valuation allowance will no longer be needed. Release of the valuation allowance would result in the recognition
of certain deferred tax assets and a decrease to income tax expense for the period the release is recorded. However, the exact timing
and amount of the valuation allowance release are subject to change on the basis of the level of profitability that we are able to actually
achieve.
Segment
Results (for the three months ended March 31, 2023, compared to the three months ended March 31, 2022)
Gaming
We
generate revenue from our Gaming segment through the delivery of our gaming terminals preloaded with proprietary gaming software, server
based content, as well as services such as terminal repairs, maintenance, software upgrades and upgrades on a when and if available
basis and content development.. We receive rental fees for machines, typically in conjunction with long-term contracts, on both a participation
and fixed fee basis. Our participation contracts are typically structured to pay us a percentage of net win (defined as net revenue to
our operator customers, after deducting player winnings, free bets or plays and any relevant regulatory levies) from gaming terminals
placed in our customers’ facilities. Typically, we recognize revenue from these arrangements on a daily basis over the term of
the contract.
Revenue
growth for our Gaming business is principally driven by changes in (i) the number of operator customers we have, (ii) the number of Gaming
machines in operation, (iii) the net win performance of the machines and (iv) the net win percentage that we receive pursuant to our
contracts with our customers.
Gaming,
Key Performance Indicators
| | |
For the Three-Month Period ended | | |
Variance | |
| | |
March 31, 2023 | | |
March 31, 2022 | | |
2023 vs 2022 | |
| Gaming | |
As Restated | | |
As restated | | |
| | |
% | |
| | |
| | |
| | |
| | |
| |
| End of period installed base (# of terminals) (2) | |
| 34,711 | | |
| 34,401 | | |
| 310 | | |
| 0.9 | % |
| Total Gaming - Average installed base (# of terminals) (2) | |
| 34,778 | | |
| 34,593 | | |
| 185 | | |
| 0.5 | % |
| Participation - Average installed base (# of terminals) (2) | |
| 30,793 | | |
| 31,420 | | |
| (627 | ) | |
| (2.0 | %) |
| Fixed Rental - Average installed base (# of terminals) | |
| 3,985 | | |
| 3,173 | | |
| 812 | | |
| 25.6 | % |
| Service Only - Average installed base (# of terminals) | |
| 14,160 | | |
| 17,915 | | |
| (3,755 | ) | |
| (21.0 | %) |
| Customer Gross Win per unit per day (1) (2) | |
£ | 98.3 | | |
£ | 86.7 | | |
£ | 11.6 | | |
| 13.4 | % |
| Customer Net Win per unit per day (1) (2) | |
£ | 71.5 | | |
£ | 63.5 | | |
£ | 8.0 | | |
| 12.6 | % |
| Inspired Blended Participation Rate | |
| 5.8 | % | |
| 5.6 | % | |
| 0.2 | % | |
| | |
| Inspired Fixed Rental Revenue per Gaming Machine per week | |
£ | 49.6 | | |
£ | 42.7 | | |
£ | 6.9 | | |
| 16.2 | % |
| Inspired Service Rental Revenue per Gaming Machine per week | |
£ | 5.1 | | |
£ | 4.6 | | |
£ | 0.5 | | |
| 10.9 | % |
| Gaming Long term license amortization (£’m) | |
£ | 0.8 | | |
£ | 1.2 | | |
£ | (0.4 | ) | |
| (33.3 | %) |
| Number of Machine sales | |
| 688 | | |
| 419 | | |
| 269 | | |
| 64.2 | % |
| Average selling price per terminal | |
£ | 7,880 | | |
£ | 6,467 | | |
£ | 1,413 | | |
| 21.8 | % |
| (1) |
Includes
all SBG terminals in which the Company takes a participation revenue share across all territories. |
| |
|
| (2)
|
Includes
circa 2,500 of lottery terminals where the share is on handle instead of net win. |
In
the table above:
“End
of Period Installed Base” is equal to the number of deployed Gaming terminals at the end of each period that have been placed on
a participation or fixed rental basis. Gaming participation revenue, which comprises the majority of Gaming Service revenue, is directly
related to the participation terminal installed base. This is the medium by which our customers generate revenue and distribute a revenue
share to the Company. To the extent all other KPIs and certain other factors remain constant, the larger the installed base, the higher
the Company’s revenue would be for a given period. Management gives careful consideration to this KPI in terms of driving growth
across the segment. This does not include Service Only terminals.
Revenue
is derived from the performance of the installed base as described by the Gross and Net Win KPIs.
If
the End of Period Installed Base is materially different from the Average Installed Base (described below), we believe this gives an
indication as to potential future performance. We believe the End of Period Installed Base is particularly useful for assessing new customers
or markets, to indicate the progress being made with respect to entering new territories or jurisdictions.
“Total
Gaming - Average Installed Base” is the average number of deployed Gaming terminals during the period split by Participation terminals
and Fixed Rental terminals. Therefore, it is more closely aligned to revenue in the period. We believe this measure is particularly useful
for assessing existing customers or markets to provide comparisons of historical size and performance. This does not include Service
Only terminals.
“Participation
- Average Installed Base” is the average number of deployed Gaming terminals that generated revenue on a participation basis.
“Fixed
Rental - Average Installed Base” is the average number of deployed Gaming terminals that generated revenue on a fixed rental basis.
“Service
Only - Average Installed Base” is the average number of terminals that generated revenue on a Service only basis.
“Customer
Gross Win per unit per day” is a KPI used by our management to (i) assess impact on the Company’s revenue, (ii) determine
changes in the performance of the overall market and (iii) evaluate the impacts of regulatory change and our new content releases on
our customers. Customer Gross Win per unit per day is the average per unit cash generated across all Gaming terminals in which the Company
takes a participation revenue share across all territories in the period, defined as the difference between the amounts staked less winnings
to players divided by the Average Installed Base in the period, then divided by the number of days in the period.
Gaming
revenue accrued in the period is derived from Customer Gross Win accrued in the period after deducting gaming taxes (defined as a regulatory
levy paid by the Customer to government bodies) and applying the Company’s contractual revenue share percentage.
Our
management believes Customer Gross Win measures are meaningful because they represent a view of customer operating performance that is
unaffected by our revenue share percentage and allow management to (1) readily view operating trends, (2) perform analytical comparisons
and benchmarking between customers and (3) identify strategies to improve operating performance in the different markets in which we
operate.
“Customer
Net Win per unit per day” is Customer Gross Win per unit per day after giving effect to the deduction of gaming taxes.
“Inspired
Blended Participation Rate” is the Company’s average revenue share percentage across all participation terminals where revenue
is earned on a participation basis, weighted by Customer Net Win per unit per day.
“Inspired
Fixed Rental Revenue per Gaming Machine per week” is the Company’s average fixed rental amount across all fixed rental terminals
where revenue is generated on a fixed fee basis, per unit per week.
“Inspired
Service Rental Revenue per Gaming Machine per week” is the Company’s average service rental amount across all service only
rental terminals where revenue is generated on a service only fixed fee basis, per unit per week.
“Gaming
Long term license amortization” is the upfront license fee per terminal which is typically spread over the life of the terminal.
Our
overall Gaming revenue from terminals placed on a participation basis can therefore be calculated as the product of the Participation
- Average Installed Base, the Customer Net Win per unit per day, the number of days in the period, and the Inspired Blended Participation
Rate, which is equal to “Participation Revenue”.
“Number
of Machine sales” is the number of terminals sold during the period.
“Average
selling price per terminal” is the total revenue in GBP of the Gaming terminals sold divided by the “number of Machine sales”.
Gaming,
Recurring Revenue
| | |
For the Three-Month Period ended | | |
Variance | |
| | |
March 31, | | |
March 31, | | |
2023 vs 2022 | |
| (In £ millions) | |
2023 As Restated | | |
2022 As Restated | | |
| | |
% | |
| Gaming Recurring Revenue | |
| | | |
| | | |
| | | |
| | |
| Total Gaming Revenue | |
£ | 22.3 | | |
£ | 18.5 | | |
£ | 3.8 | | |
| 20.5 | % |
| | |
| | | |
| | | |
| | | |
| | |
| Gaming Participation Revenue | |
£ | 11.5 | | |
£ | 10.3 | | |
£ | 1.2 | | |
| 11.7 | % |
| Gaming Other Fixed Fee Recurring Revenue | |
£ | 3.6 | | |
£ | 3.0 | | |
£ | 0.6 | | |
| 20.0 | % |
| Gaming Project Recurring Revenue | |
£ | 0.2 | | |
£ | 0.2 | | |
£ | 0.0 | | |
| 0.0 | % |
| Gaming Long-term license amortization | |
£ | 0.8 | | |
£ | 1.2 | | |
£ | (0.4 | ) | |
| (33.3 | )% |
| Total Gaming Recurring Revenue * | |
£ | 16.1 | | |
£ | 14.7 | | |
£ | 1.4 | | |
| 9.5 | % |
| Gaming Recurring Revenue as a % of Total Gaming Revenue † | |
| 72.2 | % | |
| 79.5 | % | |
| (7.3 | ) | |
| | |
| | |
| | | |
| | | |
| | | |
| | |
| Total Gaming excluding VAT-related revenue | |
£ | 22.3 | | |
£ | 17.8 | | |
| | | |
| | |
| Gaming Recurring Revenue as a % of Total Gaming Revenue (excluding VAT-related revenue) | |
| 72.2 | % | |
| 82.6 | % | |
| | | |
| | |
Set
forth below is a breakdown of our Gaming recurring revenue. Gaming recurring revenue principally consists of Gaming participation revenue
and fixed rental revenue.
| * |
Does not reflect VAT-related
revenue. |
| |
|
| † |
Total Gaming Revenue for
the three-month period ended March 31, 2023 has no VAT-related revenue, for the three-month period ended March 31, 2022, includes
£0.7 million of VAT-related revenue, which is not reflected in Gaming Recurring Revenue for that period. Excluding VAT-related
revenue, Gaming Recurring Revenue was 72% and 83%, respectively of Total Gaming Revenue for such period. |
| |
|
| |
Note – For the three-months
ending March 31, 2022, there has been some recharacterization between Gaming Participation Revenue and Other Fixed fee revenue to
ensure consistency with similar items across the Group. |
In
the table above:
“Gaming
Participation Revenue” includes our share of revenue generated from (i) our Gaming terminals placed in gaming and lottery venues;
and (ii) licensing of our game content and intellectual property to third parties.
“Gaming
Other Fixed Fee Recurring Revenue” includes service revenue in which the Company earns a periodic fixed fee on a contracted basis.
“Gaming
Long term license amortization” – see the definition provided above.
“Total
Gaming Recurring Revenue” is equal to Gaming Participation Revenue plus Gaming Other Fixed Fee Recurring Revenue.
Gaming,
Service Revenue by Region
Set
forth below is a breakdown of our Gaming service revenue by geographic region. Gaming Service revenue consists principally of Gaming
participation revenue, Gaming other fixed fee revenue, Gaming long-term license amortization and Gaming other non-recurring revenue.
See “Gaming Segment Revenue” below for a discussion of gaming service revenue between the periods under review.
| | |
For the Three-Month Period ended | | |
Variance | |
| (In millions) | |
March 31, 2023 | | |
March 31, 2022 | | |
2023 vs 2022 | | |
Total Functional Currency % | |
| | |
| | |
| | |
| | |
| | |
| |
| Service Revenue: | |
| | | |
| | | |
| | | |
| | | |
| | |
| UK LBO | |
$ | 9.7 | | |
$ | 10.2 | | |
$ | (0.5 | ) | |
| (4.9 | )% | |
| 5.7 | % |
| UK VAT - Related Income | |
| - | | |
| 0.9 | | |
$ | (0.9 | ) | |
| (100.0 | )% | |
| (100.0 | )% |
| UK Other | |
| 3.4 | | |
| 3.0 | | |
| 0.4 | | |
| 13.3 | % | |
| 25.6 | % |
| Italy | |
| 0.8 | | |
| 0.7 | | |
| 0.1 | | |
| 14.3 | % | |
| 36.0 | % |
| Greece | |
| 4.3 | | |
| 4.8 | | |
| (0.5 | ) | |
| (10.4 | %) | |
| (2.2 | )% |
| Rest of the World | |
| 0.6 | | |
| 0.2 | | |
| 0.4 | | |
| 200.0 | % | |
| 228.1 | % |
| Lotteries | |
| 1.4 | | |
| 1.3 | | |
| 0.1 | | |
| 7.7 | % | |
| 20.2 | % |
| | |
| | | |
| | | |
| | | |
| | | |
| | |
| Total Service revenue | |
$ | 20.2 | | |
$ | 21.1 | | |
$ | (0.9 | ) | |
| (4.3 | %) | |
| 6.0 | % |
| Exchange Rate - $ to £ | |
| 1.21 | | |
| 1.34 | | |
| | | |
| | | |
| | |
Note:
Exchange rate in the table is calculated by dividing the USD total service revenue by the GBP total service revenue, therefore this could
be slightly different from the average rate during the period depending on timing of transactions.
Gaming,
key events
Total
Gaming Customer Gross Win per unit per day (in our functional currency, GBP) for the three-months ended March 31, 2023, increased by
£11.6, or 13%, to £98.3. The increase was driven by a combination of new content in the UK LBO and Greek markets, removal
of all remaining COVID-19 restrictions in Greece, and some shop redistribution of revenue from low performing venue closures in the UK
LBO market.
The
new “Vantage” terminal, 200 of which have now been on trial for 45 weeks across two major customers, showed 13% growth compared
to the current estate terminals. The full rollout of 6,500 “Vantage” terminals into these two major customers is expected
to be complete by the end of 2023.
The
overall participation rate for our installed base increased to 5.8% for the three months ended March 31, 2023 from 5.6% for the three
months ended March 31, 2022. The increase was driven by a shift in customer mix.
In
the Non-LBO UK gaming estate, Inspired recorded outright sales of 200 “Flex” terminals to a major customer during the three-month
period, delivering revenue of $2.0 million. The new terminals were a combination of replacement and new venue installs. In addition to
the product sale component, these new terminals generate additional recurring rental fees. Inspired also delivered the first significant
sales volume of the “Community Cops & Robbers” triple player product.
During
the first quarter of 2023, Inspired agreed to refresh the Greek estate with 2,000 new “Valor” and 500 new “Vantage”
terminals. These terminals are expected to be delivered by the end of 2023 which are expected to be installed into venues during the
early part of 2024.
In
the North American market, Inspired recorded service revenue in Illinois from 475 game pack sales, the first of this type. Each game
pack includes seven new titles, two of which were delivered in the first quarter of 2023 and the remainder by the end of 2023.
Gaming,
Results of Operations
| | |
| | |
Variance | |
| (In millions) | |
For the Three-Month Period ended | | |
2023 vs 2022 | |
| | |
March 31, 2023 As Restated | | |
March 31, 2022 As Restated | | |
Variance Attributable to Currency Movement | | |
Variance on a Functional currency basis | | |
Total Functional Currency Variance % | | |
Total Reported Variance % | |
| Revenue: | |
| | |
| | |
| | |
| | |
| | |
| |
| Service | |
$ | 20.2 | | |
$ | 21.1 | | |
$ | (2.1 | ) | |
$ | 1.2 | | |
| 5.7 | % | |
| (4.3 | %) |
| Product | |
| 6.9 | | |
| 3.7 | | |
$ | (0.7 | ) | |
$ | 3.9 | | |
| 105.4 | % | |
| 86.5 | % |
| Total revenue | |
| 27.1 | | |
| 24.8 | | |
| (2.8 | ) | |
| 5.1 | | |
| 20.6 | % | |
| 9.3 | % |
| | |
| | | |
| | | |
| | | |
| | | |
| | | |
| | |
| Cost of Sales, excluding depreciation and amortization: | |
| | | |
| | | |
| | | |
| | | |
| | | |
| | |
| Cost of Service | |
| (5.9 | ) | |
| (6.0 | ) | |
$ | 0.6 | | |
| (0.5 | ) | |
| 8.3 | % | |
| (1.7 | %) |
| Cost of Product | |
| (5.8 | ) | |
| (2.3 | ) | |
$ | 0.6 | | |
| (4.1 | ) | |
| 178.3 | % | |
| 152.2 | % |
| Total cost of sales | |
| (11.7 | ) | |
| (8.3 | ) | |
| 1.2 | | |
| (4.6 | ) | |
| 55.4 | % | |
| 41.0 | % |
| | |
| | | |
| | | |
| | | |
| | | |
| | | |
| | |
| Selling, general and administrative expenses | |
| (5.7 | ) | |
| (5.0 | ) | |
$ | 0.6 | | |
| (1.3 | ) | |
| 26.0 | % | |
| 14.0 | % |
| | |
| | | |
| | | |
| | | |
| | | |
| | | |
| | |
| Stock-based compensation | |
| (0.3 | ) | |
| (0.3 | ) | |
$ | 0.0 | | |
| (0.0 | ) | |
| 0.0 | % | |
| 0.0 | % |
| | |
| | | |
| | | |
| | | |
| | | |
| | | |
| | |
| Acquisition and integration related transaction expenses | |
| - | | |
| (0.1 | ) | |
| - | | |
| 0.1 | | |
| N/A | | |
| N/A | |
| | |
| | | |
| | | |
| | | |
| | | |
| | | |
| | |
| Depreciation and amortization | |
| (4.5 | ) | |
| (5.2 | ) | |
$ | 0.7 | | |
| - | | |
| 0.0 | % | |
| (13.5 | %) |
| | |
| | | |
| | | |
| | | |
| | | |
| | | |
| | |
| Net operating Income (Loss) | |
$ | 4.9 | | |
$ | 5.9 | | |
$ | (0.3 | ) | |
$ | (0.7 | ) | |
| (11.9 | %) | |
| (16.9 | %) |
| | |
| | | |
| | | |
| | | |
| | | |
| | | |
| | |
| Profit on disposal of trade & assets | |
| - | | |
| 0.9 | | |
| - | | |
| (0.9 | ) | |
| N/A | | |
| N/A | |
| | |
| | | |
| | | |
| | | |
| | | |
| | | |
| | |
| Net Income (Loss) | |
$ | 4.9 | | |
$ | 6.8 | | |
$ | (0.3 | ) | |
$ | (1.6 | ) | |
| (23.5 | %) | |
| (27.9 | %) |
| | |
| | | |
| | | |
| | | |
| | | |
| | | |
| | |
| Exchange Rate - $ to £ | |
| 1.21 | | |
| 1.34 | | |
| | | |
| | | |
| | | |
| | |
Note:
Exchange rate in the table is calculated by dividing the USD total revenue by the GBP total revenue, therefore this could be slightly
different from the average rate during the period depending on timing of transactions.
All
variances discussed in the Gaming results below are on a functional currency (at constant rate) basis, which excludes the impact of any
changes in foreign currency exchange rates.
Gaming
Revenue
During
the three-month period, Gaming revenue increased by $5.1 million, or 21%. This was driven by a $1.2 million increase in Service revenue
and a $3.9 million increase in Product revenue.
The
increase in Gaming Service revenue was driven by $1.4 million from the UK market, $0.7 million from the rest of the world and $0.3 million
from Lotteries. This was partially offset by lower VAT-related revenue of $0.9 million.
Product
revenue increase was primarily driven by higher Product sales of $3.5 million of UK sales and $0.5 million of mainland Europe sales.
Gaming
Operating Income
Operating
income decreased for the three-month period by $0.7 million. This decrease was primarily due to the increase in revenues of $5.1 million. This was offset by an increase in cost of sales of $4.6 million and increase of $1.3 million
in SG&A, driven by exhibition costs that were not incurred in the prior year.
Gaming
Net Income
For
the three-month period, Net income decreased by $1.6 million. This was due to the increase in Operating income, offset by the $0.9 million
profit from the disposal of trade and assets from the sale of part of the Italian VLT operations in prior year.
Virtual
Sports
We
generate revenue from our Virtual Sports segment through the on-premise solution and hosting of our products. We primarily receive fees
on a participation basis. Our participation contracts are typically structured to pay us a percentage of net win (defined as net revenue
to our operator customers, after deducting player winnings, free bets or plays and other promotional costs and any relevant regulatory
levies) from Virtual Sports content placed on our customers’ websites or in our customers’ facilities. Typically, we recognize
revenue from these arrangements on a daily basis over the term of the contract.
Revenue
growth for our Virtual Sports segment is principally driven by the number of customers we have, the net win performance of the games
and the net win percentage that we receive pursuant to our contracts with our customers.
Virtual
Sports, Key Performance Indicators
| | |
For the Three-Month Period ended | | |
Variance | |
| | |
March 31, | | |
March 31, | | |
2023 vs 2022 | |
| Virtuals | |
2023 As Restated | | |
2022 As Restated | | |
| | |
% | |
| | |
| | |
| | |
| | |
| |
| No. of Live Customers at the end of the period | |
| 58 | | |
| 62 | | |
| (4 | ) | |
| (6.5 | )% |
| Average No. of Live Customers | |
| 58 | | |
| 62 | | |
| (4 | ) | |
| (6.5 | %) |
| Total Revenue (£’m) | |
£ | 12.2 | | |
£ | 8.4 | | |
£ | 3.8 | | |
| 45.2 | % |
| Total Revenue £’m - Retail | |
£ | 2.5 | | |
£ | 2.2 | | |
£ | 0.3 | | |
| 13.6 | % |
| Total Revenue £’m - Online Virtuals | |
£ | 9.7 | | |
£ | 6.2 | | |
£ | 3.5 | | |
| 56.5 | % |
In
the table above:
“No.
of Live Customers at the end of the period” and “Average No. of Live Customers” represent the number of customers from
which there is Virtual Sports revenue at the end of the period and the average number of customers from which there is Virtual Sports
revenue during the period, respectively.
“Total
Revenue (£m)” represents total revenue for the Virtual Sports segment, including recurring and upfront service revenue. Total
revenue is also divided between “Total Revenue (£m) – Retail,” which consists of revenue earned through players
wagering at Virtual Sports venues, “Total Revenue (£m) – Online Virtuals,” which consists of revenue earned through
players wagering on Virtual Sports online.
Virtual
Sports, Recurring Revenue
Set
forth below is a breakdown of our Virtual Sports recurring revenue, which consists of Retail Virtuals and Online Virtuals recurring revenue
as well as long-term license amortization. See “Virtual Sports Segment Revenue” below for a discussion of Virtual Sports
Service revenue between the periods under review.
| | |
For the Three-Month Period ended | | |
Variance | |
| | |
March 31, | | |
March 31, | | |
2023 vs 2022 | |
| (In £ millions) | |
2023 As Restated | | |
2022 As Restated | | |
| | |
% | |
| Virtual Sports Recurring Revenue | |
| | | |
| | | |
| | | |
| | |
| Total Virtual Sports Revenue | |
£ | 12.2 | | |
£ | 8.4 | | |
£ | 3.8 | | |
| 45.2 | % |
| | |
| | | |
| | | |
| | | |
| | |
| Recurring Revenue - Retail Virtuals | |
£ | 2.5 | | |
£ | 2.2 | | |
£ | 0.3 | | |
| 13.6
| % |
| Recurring Revenue - Online Virtuals | |
£ | 9.6 | | |
£ | 6.1 | | |
£ | 3.5 | | |
| 57.4 | % |
| Total Virtual Sports Long-term license amortization | |
£ | - | | |
£ | - | | |
£ | - | | |
| - | |
| Total Virtual Sports Recurring Revenue | |
£ | 12.1 | | |
£ | 8.3 | | |
£ | 3.8 | | |
| 45.8 | % |
| Virtual Sports Recurring Revenue as a Percentage of Total Virtual Sports Revenue | |
| 99.1 | % | |
| 98.8 | % | |
| 0.3 | | |
| | |
“Recurring
Revenue” includes our share of revenue generated from (i) our Virtual Sports products placed with operators; (ii) licensing our
game content and intellectual property to third parties; and (iii) our games on third-party online gaming platforms that are interoperable
with our game servers.
“Virtual
Sports Long term license amortization” is the upfront license fee which is typically spread over the life of the contract.
Virtual
Sports, key events
During
the period, we launched a full suite of games including V-Play Soccer™ and V-Play Basketball™ in Ontario with multiple operators
and V-Play Tie-Break Tennis™ with bet365. We launched Online Virtuals via the VPP platform in Turkey with Milli Piyango, in partnership
with leading operator SisalSans.
We
signed a new contract and went live with Mozzarbet for V-Play Plug & Play™ in three new African territories.
We
launched two new products, Virtual Motor Racing and U.S Horses into Entain’s U.K. retail estate. We also launched V-Play Horses™
with Eurobet in Italy.
We
have also announced a new partnership with Aristocrat Gaming™ to bring a new virtual sports experience to football fans worldwide
through their global licensing agreement with the National Football League (NFL).
Virtual
Sports, Results of Operations
| | |
| | |
Variance | |
| (In millions) | |
For the Three-Month Period ended | | |
2023 vs 2022 | |
| | |
March 31, 2023 As Restated | | |
March 31, 2022 As Restated | | |
Variance Attributable to Currency Movement | | |
Variance on a Functional currency basis | | |
Total Functional Currency Variance % | | |
Total Reported Variance % | |
| | |
| | |
| | |
| | |
| | |
| | |
| |
| Service Revenue | |
$ | 14.8 | | |
$ | 11.3 | | |
$ | (1.6 | ) | |
$ | 5.1 | | |
| 45.1 | % | |
| 31.0 | % |
| | |
| | | |
| | | |
| | | |
| | | |
| | | |
| | |
| Cost of Service | |
| (0.4 | ) | |
| (0.4 | ) | |
| 0.1 | | |
| (0.1 | ) | |
| 25.0 | % | |
| 0.0 | % |
| | |
| | | |
| | | |
| | | |
| | | |
| | | |
| | |
| Selling, general and administrative expenses | |
| (1.7 | ) | |
| (1.7 | ) | |
| 0.2 | | |
| (0.2 | ) | |
| (11.8 | )% | |
| 0.0 | % |
| | |
| | | |
| | | |
| | | |
| | | |
| | | |
| | |
| Stock-based compensation | |
| (0.2 | ) | |
| (0.1 | ) | |
| 0.0 | | |
| (0.1 | ) | |
| 100.0 | % | |
| 100.0 | % |
| | |
| | | |
| | | |
| | | |
| | | |
| | | |
| | |
| Depreciation and amortization | |
| (0.8 | ) | |
| (0.8 | ) | |
| 0.1 | | |
| (0.1 | ) | |
| 12.5 | % | |
| - | |
| | |
| | | |
| | | |
| | | |
| | | |
| | | |
| | |
| Net operating Income (Loss) | |
$ | 11.7 | | |
$ | 8.3 | | |
$ | (1.2 | ) | |
$ | 4.6 | | |
| 55.4 | % | |
| 41.0 | % |
| | |
| | | |
| | | |
| | | |
| | | |
| | | |
| | |
| Exchange Rate - $ to £ | |
| 1.21 | | |
| 1.34 | | |
| | | |
| | | |
| | | |
| | |
Note:
Exchange rate in the table is calculated by dividing the USD service revenue by the GBP service revenue, therefore this could be slightly
different from the average rate during the period depending on timing of transactions.
All
variances discussed in the Virtual Sports results below are on a functional currency (at constant rate) basis, which excludes the impact
of any changes in foreign currency exchange rates.
Virtual
Sports revenue
During
the three-month period, revenue increased by $5.1 million, or 45%. This increase was driven by a $4.6 million increase in Online Virtuals,
primarily driven by the growth from our existing online customers along with expanding jurisdictions, as well as increases in Retail
Virtuals of $0.5 million.
Virtual
Sports operating income
Operating
income increased by $4.6 million in the three-month period. This increase was primarily due to the increase in revenue of $5.1 million,
partly offset by an increase of $0.2 million in SG&A costs and an increase in depreciation and amortization of $0.1 million.
Interactive
We
generate revenue from our Interactive segment through the various games content made available
via third party aggregation platforms with Inspired’s remote gaming server or directly on the Company’s remote gaming server
platform, and services such as customer support, platform maintenance, updates and upgrades. Typically, we receive fees on a participation
basis. Our participation contracts are usually structured to pay us a percentage of net win (defined as net revenue to our operator customers,
after deducting player winnings, free bets or plays and other promotional costs and any relevant regulatory levies) from Interactive
content placed on our customers’ websites. Typically, we recognize revenue from these arrangements on a daily basis over the term
of the contract.
Revenue
growth for our Interactive segment is principally driven by the number of customers we have, the number of live games, the net win performance
of the games and the net win percentage that we receive pursuant to our contracts with our customers.
Interactive,
Key Performance Indicators
| | |
For the Three-Month Period ended | | |
Variance | |
| | |
March 31, | | |
March 31, | | |
2023 vs 2022 | |
| Interactive | |
2023 | | |
2022 | | |
| | |
% | |
| | |
| | |
| | |
| | |
| |
| No. of Live Customers at the end of the period | |
| 138 | | |
| 112 | | |
| 26 | | |
| 23.2 | % |
| Average No. of Live Customers | |
| 135 | | |
| 111 | | |
| 24 | | |
| 21.6 | % |
| No. of Games available at the end of the period | |
| 271 | | |
| 242 | | |
| 29 | | |
| 12.0 | % |
| Average No. of Games available | |
| 270 | | |
| 239 | | |
| 31 | | |
| 13.0 | % |
| No. of Live Games at the end of the period | |
| 247 | | |
| 242 | | |
| 5 | | |
| 2.1 | % |
| Average No. of Live Games | |
| 246 | | |
| 239 | | |
| 7 | | |
| 2.9 | % |
| Total Revenue (£’m) | |
£ | 4.9 | | |
£ | 3.4 | | |
£ | 1.5 | | |
| 44.2 | % |
In
the table above:
“No.
of Live Customers at the end of the period” and “Average No. of Live Customers” represent the number of customers from
which there is Interactive revenue at the end of the period and the average number of customers from which there is Interactive revenue
during the period, respectively.
“No.
of Games available at the end of the period” and “Average No. of Games available” represents the number of games that
are available for operators to deploy at the end of the period (including inactive legacy games still available and inactive new games
that are available but have not yet gone live with any operators) and the average number of games that are available for operators to
deploy during the period, respectively. This incorporates both live games and inactive games.
“No.
of Live Games at the end of the period” and “Average No. of Live Games” represents the number of games from which there
is Interactive revenue at the end of the period and the average number of games from which there is Interactive revenue during the period,
respectively.
“Total
Revenue (£m)” represents total revenue for the Interactive segment, including recurring and upfront service revenue.
Interactive,
key events
During
the period ended March 2023, we went live with seven new operators, including 32Red, AGLC and theScore. In addition, we entered new markets
with five operators, including The Stars Group in Italy and bet365 in Spain.
During
the period we deployed five new games, including a new online game with the Terminator™ licensed brand. Our B2B Game software permit
was approved in Sweden, permitting us to continue to deploy iGaming and Virtual Sports software in the country. We also signed a contract
with Alchemybet to build a new Slingo Gold Cash Free Spins.
Subsequent
to the period end, we launched iGaming content with Fanduel in Michigan.
Interactive,
Results of Operations
| | |
| | |
Variance | |
| (In millions) | |
For the Three-Month Period ended | | |
2023 vs 2022 | |
| | |
March 31, 2023 As Restated | | |
March 31, 2022 As Restated | | |
Variance Attributable to Currency Movement | | |
Variance on a Functional currency basis | | |
Total Functional Currency Variance % | | |
Total Reported Variance % | |
| | |
| | |
| | |
| | |
| | |
| | |
| |
| Service Revenue | |
$ | 5.9 | | |
$ | 4.6 | | |
$ | (0.7 | ) | |
$ | 2.0 | | |
| 43.5 | % | |
| 28.3 | % |
| | |
| | | |
| | | |
| | | |
| | | |
| | | |
| | |
| Cost of Service | |
| (0.3 | ) | |
| (0.3 | ) | |
| 0.0 | | |
| 0.0 | | |
| 0.0 | % | |
| 0.0 | % |
| | |
| | | |
| | | |
| | | |
| | | |
| | | |
| | |
| Selling, general and administrative expenses | |
| (2.5 | ) | |
| (1.4 | ) | |
| 0.3 | | |
| (1.4 | ) | |
| 100.0 | % | |
| 78.6 | % |
| | |
| | | |
| | | |
| | | |
| | | |
| | | |
| | |
| Stock-based compensation | |
| (0.2 | ) | |
| (0.1 | ) | |
| 0.0 | | |
| (0.1 | ) | |
| 100.0 | % | |
| 100.0 | % |
| | |
| | | |
| | | |
| | | |
| | | |
| | | |
| | |
| Depreciation and amortization | |
| (0.6 | ) | |
| (0.6 | ) | |
| 0.3 | | |
| (0.3 | ) | |
| 50.0 | % | |
| - | |
| | |
| | | |
| | | |
| | | |
| | | |
| | | |
| | |
| Net operating Income (Loss) | |
$ | 2.3 | | |
$ | 2.2 | | |
$ | (0.1 | ) | |
$ | 0.2 | | |
| 9.1 | % | |
| 4.5 | % |
| | |
| | | |
| | | |
| | | |
| | | |
| | | |
| | |
| Exchange Rate - $ to £ | |
| 1.21 | | |
| 1.35 | | |
| | | |
| | | |
| | | |
| | |
Note:
Exchange rate in the table is calculated by dividing the USD service revenue by the GBP service revenue, therefore this could be slightly
different from the average rate during the period depending on timing of transactions.
All
variances discussed in the Interactive results below are on a functional currency (at constant rate) basis, which excludes the impact
of any changes in foreign currency exchange rates.
Interactive
revenue
During
three-month period, revenue increased by $2.0 million, or 44%, primarily driven by revenue growth in the UK, US and Canada due to the
consistent launch of new content across the estate and increased promotional activity through exclusive deals with tier-one customers.
Interactive
operating income
Operating
income for the three-month period increased by $0.2 million. This increase was driven by the increase in revenue, partially offset by
a $1.4 million increase in SG&A expenses driven by exhibition costs that were not incurred during the prior year period as well and
increase in staff costs due to an investment in new technology and commercial heads.
Leisure
We
typically generate revenue from our Leisure segment through the supply of our gaming and amusement machines. We receive rental fees for
machines, typically on a long-term contract basis, on both a participation and fixed fee basis. Our participation contracts are usually
structured to pay us a percentage of net win (defined as net revenue to our operator customers, after deducting player winnings, free
bets or plays, any relevant regulatory levies and minimum fixed incomes where applicable) from machines placed in our customers’
facilities. We generally recognize revenue from these arrangements on a daily basis over the term of the contract.
Revenue
growth for our Leisure segment is principally driven by the number of customers we have, the number of machines in operation, the net
win performance of the machines and the net win percentage that we receive pursuant to our contracts with our customers.
Leisure,
Key Performance Indicators
| | |
For the Three-Month Period ended | | |
Variance | |
| | |
March 31, | | |
March 31, | | |
2023 vs 2022 | |
| Leisure | |
2023 | | |
2022 | | |
| | |
% | |
| | |
| | |
| | |
| | |
| |
| End of period installed base Gaming machines (# of terminals) | |
| 10,811 | | |
| 11,060 | | |
| (249 | ) | |
| (2.3 | )% |
| Average installed base Gaming machines (# of terminals) | |
| 10,821 | | |
| 11,248 | | |
| (427 | ) | |
| (3.8 | )% |
| End of period installed base Other (# of terminals) | |
| 4,546 | | |
| 6,356 | | |
| (1,810 | ) | |
| (28.5 | )% |
| Average installed base Other (# of terminals) | |
| 4,519 | | |
| 6,524 | | |
| (2,005 | ) | |
| (30.7 | )% |
| Pub Digital Gaming Machines - Average installed base (# of terminals) | |
| 6,028 | | |
| 6,326 | | |
| (298 | ) | |
| (4.7 | )% |
| Pub Analogue Gaming Machines - Average installed base (# of terminals) | |
| 499 | | |
| 1,720 | | |
| (1,221 | ) | |
| (71.0 | )% |
| MSA and Bingo Gaming Machines - Average installed base (# of terminals)(1) | |
| 3,089 | | |
| 3,189 | | |
| (100 | ) | |
| (3.1 | )% |
| Inspired Leisure Revenue per Gaming Machine per week | |
£ | 66.4 | | |
£ | 64.2 | | |
£ | 2.2 | | |
| 3.4 | % |
| Inspired Pub Digital Revenue per Gaming Machine per week | |
£ | 70.3 | | |
£ | 66.1 | | |
£ | 4.2 | | |
| 6.4 | % |
| Inspired Pub Analogue Revenue per Gaming Machine per week | |
£ | 36.8 | | |
£ | 39.2 | | |
£ | (2.4 | ) | |
| (6.1 | )% |
| Inspired MSA and Bingo Revenue per Gaming Machine per week | |
£ | 89.4 | | |
£ | 87.3 | | |
£ | 2.1 | | |
| 2.4 | % |
| Inspired Other Revenue per Machine per week | |
£ | 20.1 | | |
£ | 20.2 | | |
£ | (0.1 | ) | |
| (0.4 | )% |
| | |
| | | |
| | | |
| | | |
| | |
| Total Holiday Parks Revenue (Gaming and Non Gaming) (£’m) | |
£ | 2.9 | | |
£ | 2.5 | | |
£ | 0.4 | | |
| 16.0 | % |
| (1) |
Motorway Service Area machines |
In
the table above:
“End
of period installed base Gaming” and “Average installed base Gaming” represent the number of gaming machines installed
(excluding Holiday Park machines) that are Category B and Category C only, from which there is participation or rental revenue at the
end of the period or as an average over the period.
“End
of period installed base Other” and “Average installed base Other” represent the number of all other category machines
installed (excluding Holiday Park machines) from which there is participation or rental revenue at the end of the period or as an average
over the period.
“Revenue
per machine unit per week” represents the average weekly participation or rental revenue recognized during the period.
Leisure,
key events
During
the three months ended March 31, 2023 we successfully installed 370 machines (a mixture of Amusement and Gaming) and commenced operations
at holiday park operator Butlins in Bognor Regis with initial performance being strong. Holiday Parks performance across all other sites
has been strong in the quarter.
In
the Pubs business we signed a new 4-year agreement with Stonegate Group, one of the largest UK operators of Pubs in the managed, leased
and tenanted sectors.
Our
Prismatic Cat C estate saw the release of Bonus Fruits, Burning Hot Deluxe and Bullion Bars Pub edition. Our Prismatic performance is
the number one cabinet and product across UK Pubs.
In
the Bingo sector we deployed sixty new Prismatic Fortune community machines to 15 Mecca Bingo sites nationwide in the UK as well as released
new content Clockwork Orange Fortune Community.
Performance
was strong in the quarter across our MSA estate, with successful launches of Anubis Gold and Super Bonus Joker Free Spins. One of our
largest customers, Moto completed major AGC refurbishments and new layouts at two of its highest revenue earning sites (Medway and Thurrock)
which included investment in Flex and Prismatic machines.
Leisure,
Results of Operations
| | |
| | |
Variance | |
| (In millions) | |
For the Three-Month Period ended | | |
2023 vs 2022 | |
| | |
March 31, 2023 As Restated | | |
March 31, 2022 As Restated | | |
Variance Attributable to Currency Movement | | |
Variance on a Functional currency basis | | |
Total Functional Currency Variance % | | |
Total Reported Variance % | |
| Revenue: | |
| | |
| | |
| | |
| | |
| | |
| |
| Service | |
$ | 16.6 | | |
$ | 19.0 | | |
$ | (1.6 | ) | |
$ | (0.8 | ) | |
| (4.2 | )% | |
| (12.6 | )% |
| Product | |
| 0.5 | | |
| 0.6 | | |
| (0.1 | ) | |
| (0.0 | ) | |
| (0.0 | )% | |
| (16.7 | )% |
| Total revenue | |
| 17.1 | | |
| 19.6 | | |
| (1.7 | ) | |
| (0.8 | ) | |
| (4.1 | )% | |
| (12.8 | )% |
| | |
| | | |
| | | |
| | | |
| | | |
| | | |
| | |
| Cost of Sales, excluding depreciation and amortization: | |
| | | |
| | | |
| | | |
| | | |
| | | |
| | |
| Cost of Service | |
| (8.4 | ) | |
| (10.1 | ) | |
| 0.8 | | |
| 0.9 | | |
| (8.9 | )% | |
| (16.8 | )% |
| Cost of Product | |
| (0.9 | ) | |
| (0.2 | ) | |
| 0.1 | | |
| (0.8 | ) | |
| 400.0 | % | |
| 350.0 | % |
| Total cost of sales | |
| (9.3 | ) | |
| (10.3 | ) | |
| 0.9 | | |
| 0.1 | | |
| (1.0 | )% | |
| (9.7 | )% |
| | |
| | | |
| | | |
| | | |
| | | |
| | | |
| | |
| Selling, general and administrative expenses | |
| (6.9 | ) | |
| (6.6 | ) | |
| 0.8 | | |
| (1.1 | ) | |
| 16.7 | % | |
| (4.5 | %) |
| | |
| | | |
| | | |
| | | |
| | | |
| | | |
| | |
| Stock-based compensation | |
| (0.1 | ) | |
| (0.2 | ) | |
| 0.0 | | |
| 0.1 | | |
| (50.0 | )% | |
| (50.0 | )% |
| | |
| | | |
| | | |
| | | |
| | | |
| | | |
| | |
| Depreciation and amortization | |
| (3.1 | ) | |
| (3.6 | ) | |
| 0.3 | | |
| 0.2 | | |
| (5.6 | )% | |
| (13.9 | )% |
| | |
| | | |
| | | |
| | | |
| | | |
| | | |
| | |
| Net operating Income (Loss) | |
| (2.3 | ) | |
| (1.1 | ) | |
$ | 0.3 | | |
$ | (1.5 | ) | |
| 136.4 | % | |
| 109.1 | % |
| | |
| | | |
| | | |
| | | |
| | | |
| | | |
| | |
| Exchange Rate - $ to £ | |
| 1.21 | | |
| 1.34 | | |
| | | |
| | | |
| | | |
| | |
Note:
Exchange rate in the table is calculated by dividing the USD total revenue by the GBP total revenue, therefore this could be slightly
different from the average rate during the period depending on timing of transactions.
All
variances discussed in the Leisure results below are on a functional currency (at constant rate) basis, which excludes the impact of
any changes in foreign currency exchange rates.
Leisure
Revenue
For
the three-month period, revenue decreased by $0.8 million, primarily due to the structured withdrawal of non-core low-margin amusement
and prize vend machines as recognized in the third quarter of 2022 as well as the reduction in the number of gaming machines.
Service
revenue decreased by $0.8 million, driven by the decline in Pubs of $1.0 million and Bingo Halls of $0.3 million, partly offset by the
increase in Holiday parks of $0.5 million.
Leisure
Operating Income/ (Loss)
Operating
loss for the three-month period was a loss of $2.3 million compared to a loss of $1.1 million during the prior year period. This was
primarily due to the decrease in revenue driven by the decline in the Pubs business and the increase in SG&A expenses driven by the
increase in headcount from the investment in technology and service areas of the business as well as exhibitions costs that were not
incurred in the prior year period. This was partially offset by a decrease in cost of sales of 0.1 million and a decrease in depreciation
and amortization of $0.2 million.
Non-GAAP
Financial Measures
We
use certain non-GAAP financial measures, including EBITDA and Adjusted EBITDA, to analyze our operating performance. We use these financial
measures to manage our business on a day-to-day basis. We believe that these measures are also commonly used in our industry to measure
performance. For these reasons, we believe that these non-GAAP financial measures provide expanded insight into our business, in addition
to standard U.S. GAAP financial measures. There are no specific rules or regulations for defining and using non-GAAP financial measures,
and as a result the measures we use may not be comparable to measures used by other companies, even if they have similar labels. The
presentation of non-GAAP financial information should not be considered in isolation from, or as a substitute for, or superior to, financial
information prepared and presented in accordance with U.S. GAAP. You should consider our non-GAAP financial measures in conjunction with
our U.S. GAAP financial measures.
We
define our non-GAAP financial measures as follows:
EBITDA
is defined as net income (loss) excluding depreciation and amortization, interest expense, interest income and income tax expense.
Adjusted
EBITDA is defined as net income (loss) excluding depreciation and amortization, interest expense, interest income and income
tax expense, and other additional exclusions and adjustments (see Adjusted EBITDA reconciliation table). Such additional excluded amounts include stock-based
compensation U.S. GAAP charges where the associated liability is expected to be settled in stock, and changes in the value of
earnout liabilities and income and expenditure in relation to legacy portions of the business (being those portions where trading no
longer occurs) including closed defined benefit pension schemes. Additional adjustments are made for items considered outside the
normal course of business, including, but not limited to (1) restructuring costs, which include charges attributable to employee
severance, management changes, restructuring, dual running costs, costs related to facility closures and integration costs, (2)
merger and acquisition costs and (3) gains or losses not in the ordinary course of business. This does not include any adjustments
related to COVID-19.
We
believe Adjusted EBITDA, when considered along with other performance measures, is a particularly useful performance measure, because
it focuses on certain operating drivers of the business, including sales growth, operating costs, selling and administrative expense
and other operating income and expense. We believe Adjusted EBITDA can provide a more complete understanding of our operating results
and the trends to which we are subject, and an enhanced overall understanding of our financial performance and prospects for the future.
Adjusted EBITDA is not intended to be a measure of liquidity or cash flows from operations or a measure comparable to net income or loss,
because it does not take into account certain aspects of our operating performance (for example, it excludes non-recurring gains and
losses which are not deemed to be a normal part of underlying business activities). Our use of Adjusted EBITDA may not be comparable
to the use by other companies of similarly termed measures. Management compensates for these limitations by using Adjusted EBITDA as
only one of several measures for evaluating our operating performance. In addition, capital expenditures, which affect depreciation and
amortization, interest expense, and income tax benefit (expense), are evaluated separately by management.
Functional
Currency at Constant rate. Currency impacts discussed have been calculated as the current-period average GBP: USD rate less the
equivalent average rate in the prior period, multiplied by the current period amount in our functional currency (GBP). The remaining
difference, referred to as functional currency at constant rate, is calculated as the difference in our functional currency, multiplied
by the prior-period average GBP: USD rate, as a proxy for functional currency at constant rate movement.
Currency
Movement represents the difference between the results in our reporting currency (USD) and the results on a functional currency
(at constant rate) basis.
Reconciliations
from net loss, as shown in our Consolidated Statements of Operations and Comprehensive Income (Loss), to Adjusted EBITDA are shown below.
Reconciliation
to Adjusted EBITDA by segment for the Three Months ended March 31, 2023
| | |
For the Three-Month Period ended | |
| | |
March 31, | |
| (In millions) | |
2023 As Restated | |
| | |
Total | | |
Gaming | | |
Virtual Sports | | |
Interactive | | |
Leisure | | |
Corporate | |
| Net Income/ (loss) | |
$ | (1.4 | ) | |
$ | 4.9 | | |
$ | 11.7 | | |
$ | 2.3 | | |
$ | (2.3 | ) | |
$ | (18.0 | ) |
| | |
| | | |
| | | |
| | | |
| | | |
| | | |
| | |
| Items Relating to Legacy Activities: | |
| | | |
| | | |
| | | |
| | | |
| | | |
| | |
| Pension charges (1) | |
| 0.2 | | |
| | | |
| | | |
| | | |
| | | |
| 0.2 | |
| | |
| | | |
| | | |
| | | |
| | | |
| | | |
| | |
| Items outside the normal course of business: | |
| | | |
| | | |
| | | |
| | | |
| | | |
| | |
| Costs of group restructure (3) | |
| 3.0 | | |
| | | |
| | | |
| | | |
| | | |
| 3.0 | |
| | |
| | | |
| | | |
| | | |
| | | |
| | | |
| | |
| Stock-based compensation expense (4) | |
| 2.9 | | |
| 0.3 | | |
| 0.2 | | |
| 0.2 | | |
| 0.1 | | |
| 2.1 | |
| | |
| | | |
| | | |
| | | |
| | | |
| | | |
| | |
| Depreciation and amortization (4) | |
| 9.4 | | |
| 4.5 | | |
| 0.8 | | |
| 0.6 | | |
| 3.1 | | |
| 0.4 | |
| Interest expense net (4) | |
| 6.3 | | |
| | | |
| | | |
| | | |
| | | |
| 6.3 | |
| Other finance expenses / (income) (4) | |
| (0.1 | ) | |
| | | |
| | | |
| | | |
| | | |
| (0.1 | ) |
| Income tax (4) | |
| (0.2 | ) | |
| | | |
| | | |
| | | |
| | | |
| (0.2 | ) |
| Adjusted EBITDA | |
$ | 20.1 | | |
$ | 9.7 | | |
$ | 12.7 | | |
$ | 3.1 | | |
$ | 0.9 | | |
$ | (6.3 | ) |
| | |
| | | |
| | | |
| | | |
| | | |
| | | |
| | |
| Adjusted EBITDA | |
£ | 16.5 | | |
£ | 8.0 | | |
£ | 10.4 | | |
£ | 2.5 | | |
£ | 0.8 | | |
£ | (5.2 | ) |
| | |
| | | |
| | | |
| | | |
| | | |
| | | |
| | |
| Exchange Rate - $ to £ (5) | |
| 1.21 | | |
| | | |
| | | |
| | | |
| | | |
| | |
Note:
Certain unallocated corporate function costs have not been allocated to the Company’s reportable operating segments because these
costs are not allocable and to do so would not be practical; these are shown in the Corporate category.
Reconciliation
to Adjusted EBITDA by segment for the Three Months ended March 31, 2022
| | |
For the Three-Month Period ended | |
| | |
March 31, | |
| (In millions) | |
2022 As Restated | |
| | |
Total | | |
Gaming | | |
Virtual Sports | | |
Interactive | | |
Leisure | | |
Corporate | |
| Net Income/ (loss) | |
$ | 1.5 | | |
$ | 6.8 | | |
$ | 8.3 | | |
$ | 2.2 | | |
$ | (1.1 | ) | |
$ | (14.7 | ) |
| | |
| | | |
| | | |
| | | |
| | | |
| | | |
| | |
| Items Relating to Legacy Activities: | |
| | | |
| | | |
| | | |
| | | |
| | | |
| | |
| Pension charges (1) | |
| 0.1 | | |
| | | |
| | | |
| | | |
| | | |
| 0.1 | |
| | |
| | | |
| | | |
| | | |
| | | |
| | | |
| | |
| Items outside the normal course of business: | |
| | | |
| | | |
| | | |
| | | |
| | | |
| | |
| Acquisition and integration related transaction expenses (2) | |
| 0.2 | | |
| 0.1 | | |
| | | |
| | | |
| | | |
| 0.1 | |
| | |
| | | |
| | | |
| | | |
| | | |
| | | |
| | |
| Stock-based compensation expense (4) | |
| 2.8 | | |
| 0.3 | | |
| 0.1 | | |
| 0.1 | | |
| 0.2 | | |
| 2.1 | |
| | |
| | | |
| | | |
| | | |
| | | |
| | | |
| | |
| Depreciation and amortization (4) | |
| 10.7 | | |
| 5.2 | | |
| 0.8 | | |
| 0.6 | | |
| 3.6 | | |
| 0.5 | |
| Interest expense net (4) | |
| 6.5 | | |
| | | |
| | | |
| | | |
| | | |
| 6.5 | |
| Profit on disposal of business (6) | |
| (0.9 | ) | |
| (0.9 | ) | |
| | | |
| | | |
| | | |
| - | |
| Other finance expenses / (income) (4) | |
| (0.3 | ) | |
| | | |
| | | |
| | | |
| | | |
| (0.3 | ) |
| Income tax (4) | |
| 0.1 | | |
| | | |
| | | |
| | | |
| | | |
| 0.1 | |
| Adjusted EBITDA | |
$ | 20.7 | | |
$ | 11.5 | | |
$ | 9.2 | | |
$ | 2.9 | | |
$ | 2.7 | | |
$ | (5.6 | ) |
| | |
| | | |
| | | |
| | | |
| | | |
| | | |
| | |
| Adjusted EBITDA | |
£ | 15.5 | | |
£ | 8.6 | | |
£ | 6.9 | | |
£ | 2.1 | | |
£ | 2.0 | | |
£ | (4.1 | ) |
| | |
| | | |
| | | |
| | | |
| | | |
| | | |
| | |
| Exchange Rate - $ to £ (5) | |
| 1.34 | | |
| | | |
| | | |
| | | |
| | | |
| | |
Note:
Certain unallocated corporate function costs have not been allocated to the Company’s reportable operating segments because these
costs are not allocable and to do so would not be practical; these are shown in the Corporate category.
Notes
to Adjusted EBITDA reconciliation tables above:
| (1) |
“Pension charges”
are profit and loss charges included within selling, general and administrative expenses, relating to a defined benefit scheme which
was closed to new entrants in 1999 and to future accrual in 2010. As well as the amortization of net loss, the figure also includes
charges relating to the Pension Protection Fund (which were historically borne by the pension scheme) and a small amount of associated
professional services expenses. These costs are included within Corporate Functions. |
| |
|
| (2) |
Acquisition and integration
related transaction expenses, are as described above in the Results of Operations line item discussions. |
| |
|
| (3) |
“Costs of group restructure”
include redundancy costs, Payments In Lieu of Notice costs and any associated employer taxes. To qualify as being an adjusting item,
costs must be part of a large restructuring project, which will net save ongoing future costs. |
| |
|
| (4) |
Stock-based compensation
expense, Depreciation and amortization, Total other expense, net and Income tax are as described above in the Results of Operations
line item discussions. Total expense, net includes interest income, interest expense, change in fair value of earnout liability,
change in fair value of derivative liability and other finance income. |
| |
|
| (5) |
Exchange rate in the table
is calculated by dividing the USD Adjusted EBITDA by the GBP Adjusted EBITDA, therefore this could be slightly different from the
average rate during the period depending on timing of transactions. |
| (6) |
“Profit on disposal
of trade & assets” — In January 2022, the Company sold its Italian VLT business, including all terminals and other
assets, staff costs and facilities and contracts to a non-connected party, recognizing a profit on this disposal. |
Liquidity
and Capital Resources
Three
Months ended March 31, 2023, compared to Three Months ended March 31, 2022
| | |
Three Months ended | | |
Variance | |
| (in millions) | |
Mar 31, | | |
Mar 31, | | |
| |
| | |
2023 | | |
2022 | | |
2023 to 2022 | |
| Net (loss)/profit | |
$ | (1.4 | ) | |
$ | 1.5 | | |
$ | (2.9 | ) |
| Amortization of debt fees | |
| 0.3 | | |
| 0.4 | | |
| (0.1 | ) |
| Change in fair value of derivative liabilities and stock-based compensation expense | |
| 3.1 | | |
| 3.0 | | |
| 0.1 | |
| Depreciation and amortization (incl RoU assets) | |
| 10.2 | | |
| 11.7 | | |
| (1.5 | ) |
| Profit on sale of Italian VLT business | |
| 0.0 | | |
| (0.9 | ) | |
| 0.9 | |
| Contract cost additions | |
| (2.6 | ) | |
| (1.6 | ) | |
| (1.0 | ) |
| Other net cash generated/(utilized) by operating activities | |
| 2.0 | | |
| (11.4 | ) | |
| 13.4 | |
| Net cash provided by operating activities | |
| 11.6 | | |
| 2.7 | | |
| 8.9 | |
| | |
| | | |
| | | |
| | |
| Net cash used in investing activities | |
| (8.9 | ) | |
| (8.8 | ) | |
| (0.1 | ) |
| Net cash used by financing activities | |
| (0.5 | ) | |
| (0.1 | ) | |
| (0.4 | ) |
| Effect of exchange rates on cash | |
| 0.6 | | |
| (0.8 | ) | |
| 1.4 | |
| Net increase/(decrease) in cash and cash equivalents | |
$ | 2.8 | | |
($ | 7.0 | ) | |
$ | 9.8 | |
Net
cash provided by operating activities
For
the three months ended March 31, 2023, net cash inflow provided by operating activities was $11.6 million, compared to a $2.7 million
inflow for the three months ended March 31, 2022, representing a $8.9 million increase in cash generation from operating activities.
This increase was driven primarily through improved working capital levels with the three months ended March 31, 2023 benefitting from
favorable receipts due to the timing of sales and the three months ended March 31, 2022 showing significant inventory increases after
the Company made the strategic decision to secure components and protect sales in a challenging global supply chain market.
Depreciation
and amortization decreased by $1.5 million, to $10.2 million, with reductions of $1.0 million in machine depreciation and $0.2 million
for both amortization of intangible assets and amortization of right of use assets.
Contract
cost additions increased by $1.0 million to $2.6 million for the three months ended March 31,2023 compared to the three months ended
March 31, 2022.
Other
net cash generated/(utilized) by operating activities increased by $13.4 million, to a $2.0 million inflow. The relative movements between
the three months ended March 31, 2023 and the three months ended March 31, 2022 resulted in a $10.5 million increase from receivables
due to timing of sales, a $8.0 million inventory increase due to a smaller rise in inventory in the three months ended March 31, 2023
compared to the prior year when the Company made the strategic decision to secure components and protect sales in a challenging global
supply chain market and a $1.0 million favorable movement in payroll and trading taxes. This was partly offset by a $6.3 million adverse
movement in accounts payable due to timing and the prior year movement being impacted by the increase in inventory levels and a $0.3
million adverse movement in deferred revenue creditors.
Net
cash used in investing activities
Net
cash utilized in investing activities increased by $0.1 million, to $8.9 million during the three months ended March 31, 2023. This was
due to the prior year including $1.3 million relating to the sale of the gaming business in Italy, which has been offset by lower spend
on plant, property and equipment (a $0.1 million decrease compared to 2022) and a $1.2 million reduction of spend on capitalized software.
Net
cash (used)/generated by financing activities
During
the three months ended March 31, 2023, net cash utilized by financing activities was $0.5 million relating to finance lease spend compared
to $0.1 million during the three months ended March 31, 2022.
Funding
Needs and Sources
To
fund our obligations, we have historically relied on a combination of cash flows provided by operations and the incurrence of additional
debt or the refinancing of existing debt. As of March 31, 2023, we had liquidity consisting of $27.8 million in cash and cash equivalents
and a further $24.7 million of undrawn revolver facility. This compares to $40.8 million of cash and cash equivalents as of March 31,
2022, with a further $26.3 million of revolver facilities undrawn. We had a working capital inflow of $2.0 million for the three months
ended March 31, 2023, compared to a $11.4 million outflow for the three months ended March 31, 2022.
The
level of our working capital surplus or deficit varies with the level of machine production we are undertaking and our capitalization
as well as the seasonality evident in some of the businesses. In periods with minimal machine volumes and capital spend, our working
capital is typically more stable. In periods where significant numbers of machines are being produced, the levels of inventory and creditors
are typically higher and there is a natural timing difference between converting the stock into sellable or capitalized plant and settling
payments to suppliers. These factors, along with movements in trading activity levels can result in significant working capital volatility.
In periods of low activity, our working capital volatility is reduced. Working capital is reviewed and managed with the aim of ensuring
that current liabilities are covered by the level of cash held and the expected level of short-term receipts.
Some
of our business operations require cash to be held within the machines. As of March 31, 2023, $5.5 million of our $27.8 million of cash
and cash equivalents were held as operational floats within the machines. At March 31, 2022, $4.9 million of our $40.8 million of cash
and cash equivalents were held as operational floats within the machines
Management
currently believes that the Company’s cash balances on hand, cash flows expected to be generated from operations, and the ability
to control and defer capital projects will be sufficient to fund the Company’s net cash requirements through May 2024.
Long
Term and Other Debt
| (In millions) | |
March 31, 2023 | | |
March 31, 2022 | |
| Cash held | |
£ | 22.5 | | |
$ | 27.8 | | |
£ | 31.0 | | |
$ | 40.8 | |
| Original principal senior debt | |
| (235.0 | ) | |
| (290.6 | ) | |
| (235.0 | ) | |
| (309.3 | ) |
| Cash interest accrued | |
| (6.1 | ) | |
| (7.6 | ) | |
| (6.1 | ) | |
| (8.1 | ) |
| Finance lease creditors | |
| (1.4 | ) | |
| (1.7 | ) | |
| (2.0 | ) | |
| (2.7 | ) |
| Total | |
£ | (220.0 | ) | |
$ | (272.1 | ) | |
£ | (212.2 | ) | |
$ | (279.3 | ) |
Debt
Covenants
Under
our debt facilities in place as of March 31, 2023, we are not subject to covenant testing on the Senior Secured Notes. We are, however,
subject to covenant testing at the level of Inspired Entertainment Inc., the ultimate holding company, on our Super Senior Revolving
Credit Facility which requires the Company to maintain a maximum consolidated senior secured net leverage ratio of 6.0x on March 31,
2022, stepping down to 5.75x on March 31, 2023 and 5.50x from March 31, 2024 and thereafter (the “RCF Financial Covenant”).
The RCF Financial Covenant is calculated as the ratio of consolidated senior secured net debt to consolidated pro forma EBITDA (defined
as net loss excluding depreciation and amortization, interest expense, interest income and income tax expense) for the 12-month period
preceding the relevant quarterly testing date and is tested quarterly on a rolling basis, subject to the Initial Facility (as defined
in the RCF Agreement) being drawn on the relevant test date. The RCF Financial Covenant does not include a minimum interest coverage
ratio or other financial covenants. Covenant testing at March 31, 2023 showed covenant compliance with a net leverage of 2.6x.
There
were no breaches of the debt covenants in the periods ended March 31, 2023 or March 31, 2022.
Liens
and Encumbrances
As
of March 31, 2023, our senior bank debt was secured by the imposition of a fixed and floating charge in favor of the lender over all
the assets of the Company and certain of the Company’s subsidiaries.
Share
Repurchases
The
Board of Directors has authorized that the Company may use up to $25.0 million to repurchase Inspired shares of common stock, subject
to repurchases being effected on or before May 10, 2025. Management has discretion as to whether to repurchase shares of the Company.
There were no repurchases in the three months ended March 31, 2023 but at this point an aggregate of $10.5 million of our shares of common
stock had been repurchased.
Contractual
Obligations
As
of March 31, 2023, our contractual obligations were as follows:
| | |
| | |
Less than | | |
| | |
| | |
More than | |
| Contractual Obligations (in millions) | |
Total | | |
1 year | | |
1-3 years | | |
3-5 years | | |
5 years | |
| Operating activities | |
| | | |
| | | |
| | | |
| | | |
| | |
| Interest on long term debt | |
$ | 80.1 | | |
$ | 22.9 | | |
$ | 45.7 | | |
$ | 11.5 | | |
$ | - | |
| | |
| | | |
| | | |
| | | |
| | | |
| | |
| Financing activities | |
| | | |
| | | |
| | | |
| | | |
| | |
| Senior bank debt - principal repayment | |
| 290.6 | | |
| - | | |
| - | | |
| 290.6 | | |
| - | |
| Finance lease payments | |
| 1.7 | | |
| 0.5 | | |
| 1.2 | | |
| - | | |
| - | |
| Operating lease payments | |
| 15.9 | | |
| 4.0 | | |
| 6.0 | | |
| 2.6 | | |
| 3.3 | |
| Interest on non-utilization fees | |
| 0.9 | | |
| 0.3 | | |
| 0.6 | | |
| - | | |
| - | |
| Total | |
$ | 389.2 | | |
$ | 27.7 | | |
$ | 53.5 | | |
$ | 304.7 | | |
$ | 3.3 | |
Off-Balance
Sheet Arrangements
As
of March 31, 2023, there were no off-balance sheet arrangements, as defined in Item 303(a)(4)(ii) of Regulation S-K, promulgated by the
U.S. Securities and Exchange Commission.
Critical
Accounting Policies and Accounting Estimates
The
preparation of our audited consolidated financial statements in conformity with accounting principles generally accepted in the United
States (“U.S. GAAP”) requires management to make estimates and assumptions. We exercise considerable judgment with respect
to establishing sound accounting policies and in making estimates and assumptions that affect the reported amounts of our assets and
liabilities, our recognition of revenue and expenses, and our disclosure of commitments and contingencies at the date of the consolidated
financial statements. On an on-going basis, we evaluate our estimates and judgments. We base our estimates and judgments on a variety
of factors, including our historical experience, knowledge of our business and industry and current and expected economic conditions,
that are believed to be reasonable under the circumstances, the results of which form the basis for making judgments about the carrying
values of assets and liabilities that are not readily apparent from other sources. We periodically re-evaluate our estimates and assumptions
with respect to these judgments and modify our approach when circumstances indicate that modifications are necessary. While we believe
that the factors we evaluate provide us with a meaningful basis for establishing and applying sound accounting policies, we cannot guarantee
that the results will always be accurate. Since the determination of these estimates requires the exercise of judgment, actual results
could differ from such estimates.
A description of our critical accounting
estimates was provided in the MD&A section of the 2022 Form 10-K. There were no changes in the determination of these estimates during
the first three months of 2023.
QUANTITATIVE
AND QUALITATIVE DISCLOSURES ABOUT MARKET RISK
Our
principal market risks are our exposure to changes in foreign currency exchange rates.
Interest
Rate Risk
Following
the Company’s refinancing of its debt in May 2021, the external borrowings of £235.0 million ($290.6 million) are provided
at a fixed rate. Therefore, movements in rates such as LIBOR do not impact on the current borrowings and the only fluctuation that is
expected to be reported will be that solely caused by movements in the exchange rates between the Company’s functional currency
and its reporting currency.
Foreign
Currency Exchange Rate Risk
Our
operations are conducted in various countries around the world, and we receive revenue and pay expenses from these operations in a number
of different currencies. As such, our earnings are subject to movements in foreign currency exchange rates when transactions are denominated
in (i) currencies other than GBP, which is our functional currency, or (ii) the functional currencies of our subsidiaries, which is not
necessarily GBP. To estimate our foreign currency exchange rate risk, we identify material Euro and US Dollar trading and balance sheet
amounts and recalculate the result using a 10% movement in the GBP:US Dollar exchange rate. For the trading figures the 10% movement
is based on the average exchange rate throughout the reported period and for the balance sheet figures the 10% movement is based on the
exchange rate used at March 31, 2023.
Excluding
intercompany balances, our Euro functional currency net assets total approximately $8.6 million, and our US Dollar functional currency
net assets total approximately $4.1 million. We use a sensitivity analysis model to measure the impact of a 10% adverse movement of foreign
currency exchange rates against the US Dollar. A hypothetical 10% adverse change in the value of the Euro and the US Dollar relative
to GBP as of March 31, 2023, would result in favorable translation adjustments of approximately $0.8 million and $0.4 million, respectively,
recorded in other comprehensive loss.
Included
within our trading results are earnings outside of our functional currency. Retained gains from Euro based entities earned in Euros and
retained losses from USD based entities earned in US Dollars in the three months ended March 31, 2023, were €3.1 million and $5.6
million, respectively. A hypothetical 10% adverse change in the value of the Euro and the US Dollar relative to GBP as of March 31, 2023,
would result in translation adjustments of approximately $0.3 million favorable and $0.5 million unfavorable, respectively, recorded
in trading operations.
The
majority of the Company’s trading is in GBP, the functional currency, although the reporting currency of the Company is the US
Dollar. As such, changes in the GBP:USD exchange rate have an effect on the Company’s results. A 10% weakening of GBP against the
US Dollar would change the trading operational results unfavorably by approximately $0.2 million and would result in unfavorable translation
adjustments of approximately $6.4 million, recorded in other comprehensive loss.
ITEM
4. CONTROLS AND PROCEDURES
Evaluation
of Disclosure Controls and Procedures
Disclosure
controls and procedures are controls and other procedures designed to ensure that information required to be disclosed in our reports
filed or submitted under the Exchange Act is recorded, processed, summarized and reported within the time periods specified in the SEC’s
rules and forms. Disclosure controls and procedures include, without limitation, controls and procedures designed to ensure that information
required to be disclosed in our reports filed or submitted under the Exchange Act is accumulated and communicated to management, including
our Certifying Officers, or persons performing similar functions, as appropriate, to allow timely decisions regarding required disclosure.
Under the supervision and with the participation of our management, including our principal executive officer and our principal financial
officer (together, the “Certifying Officers”), we carried out an evaluation of the effectiveness of the design and operation
of our disclosure controls and procedures as defined in Rules 13a-15(e) and 15d-15(e) under the Exchange Act. Based on the foregoing,
our Certifying Officers concluded that our disclosure controls and procedures were not effective at the reasonable assurance level as
of March 31, 2023, due to the material weaknesses described in Item 9A of the Company’s restated Annual Report on Form 10-K/A for
the year ended December 31, 2022, filed with the SEC on February 27, 2024. Management is redesigning and implementing existing and additional
controls to remediate these material weaknesses Notwithstanding the identified material weaknesses and management’s assessment
that our disclosure controls and procedures were not effective at the reasonable assurance level as of March 31, 2023, management believes
that the interim consolidated financial statements and footnote disclosures included in this Quarterly Report on Form 10-Q/A fairly present,
in all material respects, our financial condition, results of operations, cash flows and disclosures as of and for the periods presented
in accordance with generally accepted accounting principles.
Changes
in Internal Control over Financial Reporting
Other
than the control changes to remediate the identified material weaknesses, there were no changes in our internal control over financial
reporting (as such term is defined in Rules 13a-15(f) and 15d-15(f) of the Exchange Act) during the most recent fiscal quarter that have
materially affected, or are reasonably likely to materially affect, our internal control over financial reporting.
PART
II - OTHER INFORMATION
ITEM
1. LEGAL PROCEEDINGS
From
time to time, we may become involved in lawsuits and legal proceedings arising in the ordinary course of business. While we believe that,
currently, we have no such matters that are material, there can be no assurance that existing or new matters arising in the ordinary
course of business will not have a material adverse effect on our business, financial condition or results of operations.
ITEM
1A. RISK FACTORS
Our
business is subject to a high degree of risk. You should carefully consider the risk factors discussed in our Annual Report on Form 10-K/A
for our fiscal year ended December 31, 2022. You should carefully read and assess all of these risk factors. Any of these risks could
materially and adversely affect our business, operating results, financial condition and prospects, and cause the value of our common
stock to decline, which could cause investors in our common stock to lose all or part of their investments.
ITEM
2. UNREGISTERED SALES OF EQUITY SECURITIES AND USE OF PROCEEDS
None.
ITEM
3. DEFAULTS UPON SENIOR SECURITIES
None.
ITEM
4. MINE SAFETY DISCLOSURES
Not
applicable.
ITEM
5. OTHER INFORMATION
None.
ITEM
6. EXHIBITS
The
following exhibits are filed as part of, or incorporated by reference into, this Quarterly Report on Form 10-Q/A:
| Exhibit
Number |
|
Description |
| |
|
|
| 10.1#*** |
|
Forms of Award Terms for fiscal year 2023 under the Inspired Entertainment, Inc. 2021 Omnibus Incentive Plan (Time-Based Award Terms and Performance-Based Award Terms). |
| 10.2# |
|
Second Addendum, dated January 12, 2023, to the Employment Agreement dated October 9, 2020, as amended, by and between the Company and A. Lorne Weil (incorporated herein by reference to Exhibit 10.2 to the Current Report on Form 8-K of the Company, filed with the SEC on January 17, 2023). |
| 10.3# |
|
Second Addendum, dated January 13, 2023, to the Employment Agreement dated February 17, 2020, as amended, by and between the Company and Brooks H. Pierce (incorporated herein by reference to Exhibit 10.1 to the Current Report on Form 8-K of the Company, filed with the SEC on January 17, 2023). |
| 10.4# |
|
Separation and Release Agreement, dated January 10, 2023, between the Company and Daniel B. Silvers (incorporated herein by reference to Exhibit 10.20 to the Annual Report on Form 10-K of the Company, filed with the SEC on March 16, 2023). |
| 10.5#*** |
|
Grant Agreements (Time-Based Agreement and Performance-Based Agreement), dated February 14, 2023, between the Company and Daniel B. Silvers. |
| 31.1* |
|
Certification of Principal Executive Officer required by Rule 13a-14(a) or Rule 15d-14(a). |
| 31.2* |
|
Certification of Principal Financial Officer required by Rule 13a-14(a) or Rule 15d-14(a). |
| 32.1** |
|
Certification of Principal Executive Officer required by Rule 13a-14(b) or Rule 15d-14(b) and 18 U.S.C. 1350. |
| 32.2** |
|
Certification of Principal Financial Officer required by Rule 13a-14(b) or Rule 15d-14(b) and 18 U.S.C. 1350. |
| 101.INS* |
|
Inline XBRL Instance Document |
| 101.SCH* |
|
Inline XBRL Taxonomy Extension
Schema |
| 101.CAL* |
|
Inline XBRL Taxonomy Extension
Calculation Linkbase |
| 101.DEF* |
|
Inline XBRL Taxonomy Extension
Definition Linkbase |
| 101.LAB* |
|
Inline XBRL Taxonomy Extension
Label Linkbase |
| 101.PRE* |
|
Inline XBRL Taxonomy Extension
Presentation Linkbase |
| 104 |
|
Cover Page Interactive
Data File (embedded within the Inline XBRL document) |
| # |
Indicates management contract or compensatory plan. |
| |
|
| * |
Filed herewith. |
| |
|
| ** |
Furnished herewith. |
| |
|
| *** |
Previously filed with the original Form 10-Q. |
SIGNATURES
Pursuant
to the requirements of the Securities Exchange Act of 1934, the registrant has duly caused this report to be signed on its behalf by
the undersigned, thereunto duly authorized.
| |
INSPIRED ENTERTAINMENT, INC. |
| |
|
|
| Date: February 27, 2024 |
|
/s/ A.
Lorne Weil |
| |
Name: |
A. Lorne Weil |
| |
Title: |
Executive Chairman |
| |
|
(Principal Executive Officer) |
| |
|
|
| Date: February 27, 2024 |
|
/s/ Marilyn Jentzen |
| |
Name: |
Marilyn Jentzen |
| |
Title: |
Interim Chief Financial Officer |
| |
|
(Principal Financial and Accounting Officer) |
EXHIBIT
31.1
CERTIFICATION
OF THE
PRINCIPAL
EXECUTIVE OFFICER
PURSUANT
TO
RULE
13a-14(a) AND RULE 15d-14(a)
UNDER
THE
SECURITIES
EXCHANGE ACT OF 1934,
AS
ADOPTED PURSUANT TO
SECTION
302 OF THE SARBANES-OXLEY ACT OF 2002
I,
A. Lorne Weil, certify that:
1.
I have reviewed this Quarterly Report on Form 10-Q/A of Inspired Entertainment, Inc.;
2.
Based on my knowledge, this report does not contain any untrue statement of a material fact or omit to state a material fact necessary
to make the statements made, in light of the circumstances under which such statements were made, not misleading with respect to the
period covered by this report;
3.
Based on my knowledge, the financial statements, and other financial information included in this report, fairly present in all material
respects the financial condition, results of operations and cash flows of the registrant as of, and for, the periods presented in this
report;
4.
The registrant’s other certifying officer and I are responsible for establishing and maintaining disclosure controls and procedures
(as defined in Exchange Act Rules 13a-15(e) and 15d-15(e)) and internal control over financial reporting (as defined in Exchange Act
Rules 13a-15(f) and 15d-15(f)) for the registrant and have:
(a)
Designed such disclosure controls and procedures, or caused such disclosure controls and procedures to be designed under our supervision,
to ensure that material information relating to the registrant, including its consolidated subsidiaries, is made known to us by others
within those entities, particularly during the period in which this report is being prepared;
(b)
Designed such internal control over financial reporting, or caused such internal control over financial reporting to be designed under
our supervision, to provide reasonable assurance regarding the reliability of financial reporting and the preparation of financial statements
for external purposes in accordance with generally accepted accounting principles;
(c)
Evaluated the effectiveness of the registrant’s disclosure controls and procedures and presented in this report our conclusions
about the effectiveness of the disclosure controls and procedures, as of the end of the period covered by this report based on such evaluation;
and
(d)
Disclosed in this report any change in the registrant’s internal control over financial reporting that occurred during the registrant’s
most recent fiscal quarter (the registrant’s fourth fiscal quarter in the case of an annual report) that has materially affected,
or is reasonably likely to materially affect, the registrant’s internal control over financial reporting; and
5.
The registrant’s other certifying officer and I have disclosed, based on our most recent evaluation of internal control over financial
reporting, to the registrant’s auditors and the audit committee of registrant’s board of directors (or persons performing
the equivalent functions):
(a)
All significant deficiencies and material weaknesses in the design or operation of internal control over financial reporting which are
reasonably likely to adversely affect the registrant’s ability to record, process, summarize and report financial information;
and
(b)
Any fraud, whether or not material, that involves management or other employees who have a significant role in the registrant’s
internal controls over financial reporting.
| Date: February 27, 2024 |
/s/
A. Lorne Weil |
| |
A. Lorne Weil |
| |
Executive Chairman |
| |
(Principal Executive Officer) |
EXHIBIT
31.2
CERTIFICATION
OF THE
PRINCIPAL
FINANCIAL OFFICER
PURSUANT
TO
RULE
13a-14(a) AND RULE 15d-14(a)
UNDER
THE
SECURITIES
EXCHANGE ACT OF 1934,
AS
ADOPTED PURSUANT TO
SECTION
302 OF THE SARBANES-OXLEY ACT OF 2002
I,
Marilyn Jentzen, certify that:
1.
I have reviewed this Quarterly Report on Form 10-Q/A of Inspired Entertainment, Inc.;
2.
Based on my knowledge, this report does not contain any untrue statement of a material fact or omit to state a material fact necessary
to make the statements made, in light of the circumstances under which such statements were made, not misleading with respect to the
period covered by this report;
3.
Based on my knowledge, the financial statements, and other financial information included in this report, fairly present in all material
respects the financial condition, results of operations and cash flows of the registrant as of, and for, the periods presented in this
report;
4.
The registrant’s other certifying officer and I are responsible for establishing and maintaining disclosure controls and procedures
(as defined in Exchange Act Rules 13a-15(e) and 15d-15(e)) and internal control over financial reporting (as defined in Exchange Act
Rules 13a-15(f) and 15d-15(f)) for the registrant and have:
(a)
Designed such disclosure controls and procedures, or caused such disclosure controls and procedures to be designed under our supervision,
to ensure that material information relating to the registrant, including its consolidated subsidiaries, is made known to us by others
within those entities, particularly during the period in which this report is being prepared;
(b)
Designed such internal control over financial reporting, or caused such internal control over financial reporting to be designed under
our supervision, to provide reasonable assurance regarding the reliability of financial reporting and the preparation of financial statements
for external purposes in accordance with generally accepted accounting principles;
(c)
Evaluated the effectiveness of the registrant’s disclosure controls and procedures and presented in this report our conclusions
about the effectiveness of the disclosure controls and procedures, as of the end of the period covered by this report based on such evaluation;
and
(d)
Disclosed in this report any change in the registrant’s internal control over financial reporting that occurred during the registrant’s
most recent fiscal quarter (the registrant’s fourth fiscal quarter in the case of an annual report) that has materially affected,
or is reasonably likely to materially affect, the registrant’s internal control over financial reporting; and
5.
The registrant’s other certifying officer and I have disclosed, based on our most recent evaluation of internal control over financial
reporting, to the registrant’s auditors and the audit committee of registrant’s board of directors (or persons performing
the equivalent functions):
(a)
All significant deficiencies and material weaknesses in the design or operation of internal control over financial reporting which are
reasonably likely to adversely affect the registrant’s ability to record, process, summarize and report financial information;
and
(b)
Any fraud, whether or not material, that involves management or other employees who have a significant role in the registrant’s
internal controls over financial reporting.
| Date: February 27, 2024 |
/s/
Marilyn Jentzen |
| |
Marilyn Jentzen |
| |
Interim Chief
Financial Officer |
| |
(Principal Financial and Accounting Officer) |
EXHIBIT
32.1
CERTIFICATION
PURSUANT TO
18
U.S.C. SECTION 1350,
AS
ADOPTED PURSUANT TO
SECTION
906 OF THE SARBANES-OXLEY ACT OF 2002
In
connection with the Quarterly Report of Inspired Entertainment, Inc. (the “Company”) on Form 10-Q/A for the fiscal period
ended March 31, 2023, as filed with the Securities and Exchange Commission (the “Report”), I, A. Lorne Weil, Executive Chairman
of the Company, certify, pursuant to 18 U.S.C. §1350, as adopted pursuant to §906 of the Sarbanes-Oxley Act of 2002, that:
1.
The Report fully complies with the requirements of Section 13(a) or 15(d) of the Securities Exchange Act of 1934; and
2.
To my knowledge, the information contained in the Report fairly presents, in all material respects, the financial condition and results
of operations of the Company as of and for the period covered by the Report.
| Dated: February 27, 2024 |
By: |
/s/
A. Lorne Weil |
| |
|
A. Lorne Weil |
A
signed original of this written statement required by Section 906 of the Sarbanes-Oxley Act of 2002 has been provided to the Company
and will be retained by the Company and furnished to the Securities and Exchange Commission or its staff upon request.
EXHIBIT
32.2
CERTIFICATION
PURSUANT TO
18
U.S.C. SECTION 1350,
AS
ADOPTED PURSUANT TO
SECTION
906 OF THE SARBANES-OXLEY ACT OF 2002
In
connection with the Quarterly Report of Inspired Entertainment, Inc. (the “Company”) on Form 10-Q/A for the fiscal
period ended March 31, 2023, as filed with the Securities and Exchange Commission (the “Report”), I, Marilyn Jentzen,
Interim Chief Financial Officer of the Company, certify, pursuant to 18 U.S.C. §1350, as adopted pursuant to §906 of the
Sarbanes-Oxley Act of 2002, that:
1.
The Report fully complies with the requirements of Section 13(a) or 15(d) of the Securities Exchange Act of 1934; and
2.
To my knowledge, the information contained in the Report fairly presents, in all material respects, the financial condition and results
of operations of the Company.
| Dated: February 27, 2024 |
By: |
/s/
Marilyn Jentzen |
| |
|
Marilyn Jentzen |
A
signed original of this written statement required by Section 906 of the Sarbanes-Oxley Act of 2002 has been provided to the Company
and will be retained by the Company and furnished to the Securities and Exchange Commission or its staff upon request.
v3.24.0.1
Cover - shares
|
3 Months Ended |
|
Mar. 31, 2023 |
Feb. 22, 2024 |
| Cover [Abstract] |
|
|
| Document Type |
10-Q/A
|
|
| Amendment Flag |
true
|
|
| Amendment Description |
This
Amendment No. 1 to Form 10-Q (this “Amendment” or “Form 10-Q/A”) amends the Annual Report on Form 10-Q for the
quarter ended March 31, 2023 originally filed with the Securities and Exchange Commission (“SEC”) on May 10, 2023 (the
“Original Filing”) by Inspired Entertainment, Inc. (the “Company,” “we,” “our” or “us”).
|
|
| Document Quarterly Report |
true
|
|
| Document Transition Report |
false
|
|
| Document Period End Date |
Mar. 31, 2023
|
|
| Document Fiscal Period Focus |
Q1
|
|
| Document Fiscal Year Focus |
2023
|
|
| Current Fiscal Year End Date |
--12-31
|
|
| Entity File Number |
001-36689
|
|
| Entity Registrant Name |
INSPIRED
ENTERTAINMENT, INC.
|
|
| Entity Central Index Key |
0001615063
|
|
| Entity Tax Identification Number |
47-1025534
|
|
| Entity Incorporation, State or Country Code |
DE
|
|
| Entity Address, Address Line One |
250
West 57th Street
|
|
| Entity Address, Address Line Two |
Suite 415
|
|
| Entity Address, City or Town |
New
York
|
|
| Entity Address, State or Province |
NY
|
|
| Entity Address, Postal Zip Code |
10107
|
|
| City Area Code |
(646)
|
|
| Local Phone Number |
565-3861
|
|
| Title of 12(b) Security |
Common
stock, par value $0.0001 per share
|
|
| Trading Symbol |
INSE
|
|
| Security Exchange Name |
NASDAQ
|
|
| Entity Current Reporting Status |
Yes
|
|
| Entity Interactive Data Current |
Yes
|
|
| Entity Filer Category |
Accelerated Filer
|
|
| Entity Small Business |
true
|
|
| Entity Emerging Growth Company |
false
|
|
| Entity Shell Company |
false
|
|
| Entity Common Stock, Shares Outstanding |
|
26,219,021
|
| X |
- DefinitionDescription of changes contained within amended document.
| Name: |
dei_AmendmentDescription |
| Namespace Prefix: |
dei_ |
| Data Type: |
xbrli:stringItemType |
| Balance Type: |
na |
| Period Type: |
duration |
|
| X |
- DefinitionBoolean flag that is true when the XBRL content amends previously-filed or accepted submission.
| Name: |
dei_AmendmentFlag |
| Namespace Prefix: |
dei_ |
| Data Type: |
xbrli:booleanItemType |
| Balance Type: |
na |
| Period Type: |
duration |
|
| X |
- DefinitionEnd date of current fiscal year in the format --MM-DD.
| Name: |
dei_CurrentFiscalYearEndDate |
| Namespace Prefix: |
dei_ |
| Data Type: |
xbrli:gMonthDayItemType |
| Balance Type: |
na |
| Period Type: |
duration |
|
| X |
- DefinitionFiscal period values are FY, Q1, Q2, and Q3. 1st, 2nd and 3rd quarter 10-Q or 10-QT statements have value Q1, Q2, and Q3 respectively, with 10-K, 10-KT or other fiscal year statements having FY.
| Name: |
dei_DocumentFiscalPeriodFocus |
| Namespace Prefix: |
dei_ |
| Data Type: |
dei:fiscalPeriodItemType |
| Balance Type: |
na |
| Period Type: |
duration |
|
| X |
- DefinitionThis is focus fiscal year of the document report in YYYY format. For a 2006 annual report, which may also provide financial information from prior periods, fiscal 2006 should be given as the fiscal year focus. Example: 2006.
| Name: |
dei_DocumentFiscalYearFocus |
| Namespace Prefix: |
dei_ |
| Data Type: |
xbrli:gYearItemType |
| Balance Type: |
na |
| Period Type: |
duration |
|
| X |
- DefinitionFor the EDGAR submission types of Form 8-K: the date of the report, the date of the earliest event reported; for the EDGAR submission types of Form N-1A: the filing date; for all other submission types: the end of the reporting or transition period. The format of the date is YYYY-MM-DD.
| Name: |
dei_DocumentPeriodEndDate |
| Namespace Prefix: |
dei_ |
| Data Type: |
xbrli:dateItemType |
| Balance Type: |
na |
| Period Type: |
duration |
|
| X |
- DefinitionBoolean flag that is true only for a form used as an quarterly report. Reference 1: http://www.xbrl.org/2003/role/presentationRef
-Publisher SEC
-Name Form 10-Q
-Number 240
-Section 308
-Subsection a
| Name: |
dei_DocumentQuarterlyReport |
| Namespace Prefix: |
dei_ |
| Data Type: |
xbrli:booleanItemType |
| Balance Type: |
na |
| Period Type: |
duration |
|
| X |
- DefinitionBoolean flag that is true only for a form used as a transition report. Reference 1: http://www.xbrl.org/2003/role/presentationRef
-Publisher SEC
-Name Forms 10-K, 10-Q, 20-F
-Number 240
-Section 13
-Subsection a-1
| Name: |
dei_DocumentTransitionReport |
| Namespace Prefix: |
dei_ |
| Data Type: |
xbrli:booleanItemType |
| Balance Type: |
na |
| Period Type: |
duration |
|
| X |
- DefinitionThe type of document being provided (such as 10-K, 10-Q, 485BPOS, etc). The document type is limited to the same value as the supporting SEC submission type, or the word 'Other'.
| Name: |
dei_DocumentType |
| Namespace Prefix: |
dei_ |
| Data Type: |
dei:submissionTypeItemType |
| Balance Type: |
na |
| Period Type: |
duration |
|
| X |
- DefinitionAddress Line 1 such as Attn, Building Name, Street Name
| Name: |
dei_EntityAddressAddressLine1 |
| Namespace Prefix: |
dei_ |
| Data Type: |
xbrli:normalizedStringItemType |
| Balance Type: |
na |
| Period Type: |
duration |
|
| X |
- DefinitionAddress Line 2 such as Street or Suite number
| Name: |
dei_EntityAddressAddressLine2 |
| Namespace Prefix: |
dei_ |
| Data Type: |
xbrli:normalizedStringItemType |
| Balance Type: |
na |
| Period Type: |
duration |
|
| X |
- Definition
+ References
+ Details
| Name: |
dei_EntityAddressCityOrTown |
| Namespace Prefix: |
dei_ |
| Data Type: |
xbrli:normalizedStringItemType |
| Balance Type: |
na |
| Period Type: |
duration |
|
| X |
- DefinitionCode for the postal or zip code
| Name: |
dei_EntityAddressPostalZipCode |
| Namespace Prefix: |
dei_ |
| Data Type: |
xbrli:normalizedStringItemType |
| Balance Type: |
na |
| Period Type: |
duration |
|
| X |
- DefinitionName of the state or province.
| Name: |
dei_EntityAddressStateOrProvince |
| Namespace Prefix: |
dei_ |
| Data Type: |
dei:stateOrProvinceItemType |
| Balance Type: |
na |
| Period Type: |
duration |
|
| X |
- DefinitionA unique 10-digit SEC-issued value to identify entities that have filed disclosures with the SEC. It is commonly abbreviated as CIK. Reference 1: http://www.xbrl.org/2003/role/presentationRef
-Publisher SEC
-Name Exchange Act
-Number 240
-Section 12
-Subsection b-2
| Name: |
dei_EntityCentralIndexKey |
| Namespace Prefix: |
dei_ |
| Data Type: |
dei:centralIndexKeyItemType |
| Balance Type: |
na |
| Period Type: |
duration |
|
| X |
- DefinitionIndicate number of shares or other units outstanding of each of registrant's classes of capital or common stock or other ownership interests, if and as stated on cover of related periodic report. Where multiple classes or units exist define each class/interest by adding class of stock items such as Common Class A [Member], Common Class B [Member] or Partnership Interest [Member] onto the Instrument [Domain] of the Entity Listings, Instrument.
| Name: |
dei_EntityCommonStockSharesOutstanding |
| Namespace Prefix: |
dei_ |
| Data Type: |
xbrli:sharesItemType |
| Balance Type: |
na |
| Period Type: |
instant |
|
| X |
- DefinitionIndicate 'Yes' or 'No' whether registrants (1) have filed all reports required to be filed by Section 13 or 15(d) of the Securities Exchange Act of 1934 during the preceding 12 months (or for such shorter period that registrants were required to file such reports), and (2) have been subject to such filing requirements for the past 90 days. This information should be based on the registrant's current or most recent filing containing the related disclosure.
| Name: |
dei_EntityCurrentReportingStatus |
| Namespace Prefix: |
dei_ |
| Data Type: |
dei:yesNoItemType |
| Balance Type: |
na |
| Period Type: |
duration |
|
| X |
- DefinitionIndicate if registrant meets the emerging growth company criteria. Reference 1: http://www.xbrl.org/2003/role/presentationRef
-Publisher SEC
-Name Exchange Act
-Number 240
-Section 12
-Subsection b-2
| Name: |
dei_EntityEmergingGrowthCompany |
| Namespace Prefix: |
dei_ |
| Data Type: |
xbrli:booleanItemType |
| Balance Type: |
na |
| Period Type: |
duration |
|
| X |
- DefinitionCommission file number. The field allows up to 17 characters. The prefix may contain 1-3 digits, the sequence number may contain 1-8 digits, the optional suffix may contain 1-4 characters, and the fields are separated with a hyphen.
| Name: |
dei_EntityFileNumber |
| Namespace Prefix: |
dei_ |
| Data Type: |
dei:fileNumberItemType |
| Balance Type: |
na |
| Period Type: |
duration |
|
| X |
- DefinitionIndicate whether the registrant is one of the following: Large Accelerated Filer, Accelerated Filer, Non-accelerated Filer. Definitions of these categories are stated in Rule 12b-2 of the Exchange Act. This information should be based on the registrant's current or most recent filing containing the related disclosure. Reference 1: http://www.xbrl.org/2003/role/presentationRef
-Publisher SEC
-Name Exchange Act
-Number 240
-Section 12
-Subsection b-2
| Name: |
dei_EntityFilerCategory |
| Namespace Prefix: |
dei_ |
| Data Type: |
dei:filerCategoryItemType |
| Balance Type: |
na |
| Period Type: |
duration |
|
| X |
- DefinitionTwo-character EDGAR code representing the state or country of incorporation.
| Name: |
dei_EntityIncorporationStateCountryCode |
| Namespace Prefix: |
dei_ |
| Data Type: |
dei:edgarStateCountryItemType |
| Balance Type: |
na |
| Period Type: |
duration |
|
| X |
- DefinitionBoolean flag that is true when the registrant has submitted electronically every Interactive Data File required to be submitted pursuant to Rule 405 of Regulation S-T during the preceding 12 months (or for such shorter period that the registrant was required to submit such files). Reference 1: http://www.xbrl.org/2003/role/presentationRef
-Publisher SEC
-Name Regulation S-T
-Number 232
-Section 405
| Name: |
dei_EntityInteractiveDataCurrent |
| Namespace Prefix: |
dei_ |
| Data Type: |
dei:yesNoItemType |
| Balance Type: |
na |
| Period Type: |
duration |
|
| X |
- DefinitionThe exact name of the entity filing the report as specified in its charter, which is required by forms filed with the SEC. Reference 1: http://www.xbrl.org/2003/role/presentationRef
-Publisher SEC
-Name Exchange Act
-Number 240
-Section 12
-Subsection b-2
| Name: |
dei_EntityRegistrantName |
| Namespace Prefix: |
dei_ |
| Data Type: |
xbrli:normalizedStringItemType |
| Balance Type: |
na |
| Period Type: |
duration |
|
| X |
- DefinitionBoolean flag that is true when the registrant is a shell company as defined in Rule 12b-2 of the Exchange Act. Reference 1: http://www.xbrl.org/2003/role/presentationRef
-Publisher SEC
-Name Exchange Act
-Number 240
-Section 12
-Subsection b-2
| Name: |
dei_EntityShellCompany |
| Namespace Prefix: |
dei_ |
| Data Type: |
xbrli:booleanItemType |
| Balance Type: |
na |
| Period Type: |
duration |
|
| X |
- DefinitionIndicates that the company is a Smaller Reporting Company (SRC). Reference 1: http://www.xbrl.org/2003/role/presentationRef
-Publisher SEC
-Name Exchange Act
-Number 240
-Section 12
-Subsection b-2
| Name: |
dei_EntitySmallBusiness |
| Namespace Prefix: |
dei_ |
| Data Type: |
xbrli:booleanItemType |
| Balance Type: |
na |
| Period Type: |
duration |
|
| X |
- DefinitionThe Tax Identification Number (TIN), also known as an Employer Identification Number (EIN), is a unique 9-digit value assigned by the IRS. Reference 1: http://www.xbrl.org/2003/role/presentationRef
-Publisher SEC
-Name Exchange Act
-Number 240
-Section 12
-Subsection b-2
| Name: |
dei_EntityTaxIdentificationNumber |
| Namespace Prefix: |
dei_ |
| Data Type: |
dei:employerIdItemType |
| Balance Type: |
na |
| Period Type: |
duration |
|
| X |
- DefinitionLocal phone number for entity.
| Name: |
dei_LocalPhoneNumber |
| Namespace Prefix: |
dei_ |
| Data Type: |
xbrli:normalizedStringItemType |
| Balance Type: |
na |
| Period Type: |
duration |
|
| X |
- DefinitionTitle of a 12(b) registered security. Reference 1: http://www.xbrl.org/2003/role/presentationRef
-Publisher SEC
-Name Exchange Act
-Number 240
-Section 12
-Subsection b
| Name: |
dei_Security12bTitle |
| Namespace Prefix: |
dei_ |
| Data Type: |
dei:securityTitleItemType |
| Balance Type: |
na |
| Period Type: |
duration |
|
| X |
- DefinitionName of the Exchange on which a security is registered. Reference 1: http://www.xbrl.org/2003/role/presentationRef
-Publisher SEC
-Name Exchange Act
-Number 240
-Section 12
-Subsection d1-1
| Name: |
dei_SecurityExchangeName |
| Namespace Prefix: |
dei_ |
| Data Type: |
dei:edgarExchangeCodeItemType |
| Balance Type: |
na |
| Period Type: |
duration |
|
| X |
- DefinitionTrading symbol of an instrument as listed on an exchange.
| Name: |
dei_TradingSymbol |
| Namespace Prefix: |
dei_ |
| Data Type: |
dei:tradingSymbolItemType |
| Balance Type: |
na |
| Period Type: |
duration |
|
v3.24.0.1
Condensed Consolidated Balance Sheets - USD ($)
$ in Millions |
Mar. 31, 2023 |
Dec. 31, 2022 |
Mar. 31, 2022 |
Dec. 31, 2021 |
| Assets |
|
|
|
|
| Cash |
$ 27.8
|
$ 25.0
|
|
|
| Accounts receivable, net |
32.9
|
40.4
|
|
|
| Inventory |
34.6
|
30.3
|
|
|
| Prepaid expenses and other current assets |
30.7
|
31.2
|
|
|
| Total current assets |
126.0
|
126.9
|
|
|
| Property and equipment, net |
47.4
|
45.1
|
|
|
| Software development costs, net |
19.5
|
18.3
|
|
|
| Other acquired intangible assets subject to amortization, net |
14.3
|
14.6
|
|
|
| Goodwill |
57.0
|
55.5
|
|
|
| Operating lease right of use asset |
15.7
|
16.0
|
|
|
| Costs of obtaining and fulfilling customer contracts, net |
7.7
|
7.0
|
|
|
| Other assets |
4.1
|
3.8
|
|
|
| Total assets |
291.7
|
287.2
|
|
|
| Current liabilities |
|
|
|
|
| Accounts payable |
22.2
|
23.7
|
|
|
| Accrued expenses |
35.6
|
29.0
|
|
|
| Corporate tax and other current taxes payable |
3.4
|
10.1
|
|
|
| Deferred revenue, current |
4.9
|
4.6
|
|
|
| Operating lease liabilities |
4.0
|
3.9
|
|
|
| Other current liabilities |
3.2
|
3.6
|
|
|
| Total current liabilities |
73.3
|
74.9
|
|
|
| Long-term debt |
285.5
|
277.6
|
|
|
| Finance lease liabilities, net of current portion |
1.2
|
1.2
|
|
|
| Deferred revenue, net of current portion |
2.3
|
2.8
|
|
|
| Operating lease liabilities |
11.9
|
12.3
|
|
|
| Other long-term liabilities |
4.0
|
4.0
|
|
|
| Total liabilities |
378.2
|
372.8
|
|
|
| Commitments and contingencies |
|
|
|
|
| Stockholders’ deficit |
|
|
|
|
| Preferred stock; $0.0001 par value; 1,000,000 shares authorized |
|
|
|
|
| Common stock; $0.0001 par value; 49,000,000 shares authorized; 26,263,070 shares and 25,909,516 shares issued and outstanding at March 31, 2023 and December 31, 2022, respectively |
|
|
|
|
| Additional paid in capital |
381.2
|
378.2
|
|
|
| Accumulated other comprehensive income |
48.3
|
50.8
|
$ 47.6
|
$ 43.8
|
| Accumulated deficit |
(516.0)
|
(514.6)
|
|
|
| Total stockholders’ deficit |
(86.5)
|
(85.6)
|
$ (100.7)
|
$ (108.7)
|
| Total liabilities and stockholders’ deficit |
$ 291.7
|
$ 287.2
|
|
|
| X |
- DefinitionCarrying value as of the balance sheet date of liabilities incurred (and for which invoices have typically been received) and payable to vendors for goods and services received that are used in an entity's business. Used to reflect the current portion of the liabilities (due within one year or within the normal operating cycle if longer). Reference 1: http://www.xbrl.org/2003/role/exampleRef
-Topic 852
-SubTopic 10
-Name Accounting Standards Codification
-Section 55
-Paragraph 10
-Publisher FASB
-URI https://asc.fasb.org//1943274/2147481372/852-10-55-10
Reference 2: http://fasb.org/us-gaap/role/ref/legacyRef
-Name Accounting Standards Codification
-Topic 210
-SubTopic 10
-Section S99
-Paragraph 1
-Subparagraph (SX 210.5-02.19(a))
-Publisher FASB
-URI https://asc.fasb.org//1943274/2147480566/210-10-S99-1
| Name: |
us-gaap_AccountsPayableCurrent |
| Namespace Prefix: |
us-gaap_ |
| Data Type: |
xbrli:monetaryItemType |
| Balance Type: |
credit |
| Period Type: |
instant |
|
| X |
- DefinitionAmount, after allowance for credit loss, of right to consideration from customer for product sold and service rendered in normal course of business. Reference 1: http://www.xbrl.org/2003/role/exampleRef
-Topic 946
-SubTopic 310
-Name Accounting Standards Codification
-Section 45
-Paragraph 1
-Subparagraph (d)
-Publisher FASB
-URI https://asc.fasb.org//1943274/2147480833/946-310-45-1
Reference 2: http://www.xbrl.org/2009/role/commonPracticeRef
-Topic 944
-SubTopic 210
-Name Accounting Standards Codification
-Section S99
-Paragraph 1
-Subparagraph (SX 210.7-03(a)(5))
-Publisher FASB
-URI https://asc.fasb.org//1943274/2147479440/944-210-S99-1
Reference 3: http://www.xbrl.org/2003/role/disclosureRef
-Topic 946
-SubTopic 210
-Name Accounting Standards Codification
-Section S99
-Paragraph 1
-Subparagraph (SX 210.6-04(5)(b))
-Publisher FASB
-URI https://asc.fasb.org//1943274/2147479617/946-210-S99-1
Reference 4: http://www.xbrl.org/2003/role/disclosureRef
-Topic 954
-SubTopic 310
-Name Accounting Standards Codification
-Section 45
-Paragraph 1
-Publisher FASB
-URI https://asc.fasb.org//1943274/2147481058/954-310-45-1
| Name: |
us-gaap_AccountsReceivableNet |
| Namespace Prefix: |
us-gaap_ |
| Data Type: |
xbrli:monetaryItemType |
| Balance Type: |
debit |
| Period Type: |
instant |
|
| X |
- DefinitionCarrying value as of the balance sheet date of obligations incurred and payable, pertaining to costs that are statutory in nature, are incurred on contractual obligations, or accumulate over time and for which invoices have not yet been received or will not be rendered. Examples include taxes, interest, rent and utilities. Used to reflect the current portion of the liabilities (due within one year or within the normal operating cycle if longer). Reference 1: http://fasb.org/us-gaap/role/ref/legacyRef
-Name Accounting Standards Codification
-Topic 210
-SubTopic 10
-Section S99
-Paragraph 1
-Subparagraph (SX 210.5-02.20)
-Publisher FASB
-URI https://asc.fasb.org//1943274/2147480566/210-10-S99-1
| Name: |
us-gaap_AccruedLiabilitiesCurrent |
| Namespace Prefix: |
us-gaap_ |
| Data Type: |
xbrli:monetaryItemType |
| Balance Type: |
credit |
| Period Type: |
instant |
|
| X |
- DefinitionAmount, after tax, of accumulated increase (decrease) in equity from transaction and other event and circumstance from nonowner source. Reference 1: http://fasb.org/us-gaap/role/ref/legacyRef
-Name Accounting Standards Codification
-Topic 220
-SubTopic 10
-Section 45
-Paragraph 14A
-Publisher FASB
-URI https://asc.fasb.org//1943274/2147482790/220-10-45-14A
Reference 2: http://fasb.org/us-gaap/role/ref/legacyRef
-Topic 220
-SubTopic 10
-Name Accounting Standards Codification
-Section 45
-Paragraph 11
-Publisher FASB
-URI https://asc.fasb.org//1943274/2147482790/220-10-45-11
Reference 3: http://www.xbrl.org/2003/role/disclosureRef
-Topic 944
-SubTopic 40
-Name Accounting Standards Codification
-Section 65
-Paragraph 2
-Subparagraph (g)(2)(ii)
-Publisher FASB
-URI https://asc.fasb.org//1943274/2147480016/944-40-65-2
Reference 4: http://www.xbrl.org/2003/role/disclosureRef
-Topic 944
-SubTopic 40
-Name Accounting Standards Codification
-Section 65
-Paragraph 2
-Subparagraph (h)(2)
-Publisher FASB
-URI https://asc.fasb.org//1943274/2147480016/944-40-65-2
Reference 5: http://www.xbrl.org/2003/role/disclosureRef
-Topic 210
-SubTopic 10
-Name Accounting Standards Codification
-Section S99
-Paragraph 1
-Subparagraph (SX 210.5-02(30)(a)(4))
-Publisher FASB
-URI https://asc.fasb.org//1943274/2147480566/210-10-S99-1
Reference 6: http://www.xbrl.org/2003/role/disclosureRef
-Topic 944
-SubTopic 210
-Name Accounting Standards Codification
-Section S99
-Paragraph 1
-Subparagraph (SX 210.7-03(a)(23)(a)(3))
-Publisher FASB
-URI https://asc.fasb.org//1943274/2147479440/944-210-S99-1
Reference 7: http://fasb.org/us-gaap/role/ref/legacyRef
-Name Accounting Standards Codification
-Topic 220
-SubTopic 10
-Section 45
-Paragraph 14
-Publisher FASB
-URI https://asc.fasb.org//1943274/2147482790/220-10-45-14
| Name: |
us-gaap_AccumulatedOtherComprehensiveIncomeLossNetOfTax |
| Namespace Prefix: |
us-gaap_ |
| Data Type: |
xbrli:monetaryItemType |
| Balance Type: |
credit |
| Period Type: |
instant |
|
| X |
- DefinitionAmount of excess of issue price over par or stated value of stock and from other transaction involving stock or stockholder. Includes, but is not limited to, additional paid-in capital (APIC) for common and preferred stock. Reference 1: http://www.xbrl.org/2003/role/exampleRef
-Topic 852
-SubTopic 10
-Name Accounting Standards Codification
-Section 55
-Paragraph 10
-Publisher FASB
-URI https://asc.fasb.org//1943274/2147481372/852-10-55-10
Reference 2: http://www.xbrl.org/2009/role/commonPracticeRef
-Topic 946
-SubTopic 210
-Name Accounting Standards Codification
-Section S99
-Paragraph 1
-Subparagraph (SX 210.6-04(18))
-Publisher FASB
-URI https://asc.fasb.org//1943274/2147479617/946-210-S99-1
Reference 3: http://fasb.org/us-gaap/role/ref/legacyRef
-Topic 210
-SubTopic 10
-Name Accounting Standards Codification
-Section S99
-Paragraph 1
-Subparagraph (SX 210.5-02(30)(a)(1))
-Publisher FASB
-URI https://asc.fasb.org//1943274/2147480566/210-10-S99-1
| Name: |
us-gaap_AdditionalPaidInCapital |
| Namespace Prefix: |
us-gaap_ |
| Data Type: |
xbrli:monetaryItemType |
| Balance Type: |
credit |
| Period Type: |
instant |
|
| X |
- DefinitionSum of the carrying amounts as of the balance sheet date of all assets that are recognized. Assets are probable future economic benefits obtained or controlled by an entity as a result of past transactions or events. Reference 1: http://www.xbrl.org/2003/role/disclosureRef
-Topic 810
-SubTopic 10
-Name Accounting Standards Codification
-Section 50
-Paragraph 3
-Subparagraph (bb)
-Publisher FASB
-URI https://asc.fasb.org//1943274/2147481203/810-10-50-3
Reference 2: http://www.xbrl.org/2003/role/disclosureRef
-Topic 810
-SubTopic 10
-Name Accounting Standards Codification
-Section 45
-Paragraph 25
-Subparagraph (a)
-Publisher FASB
-URI https://asc.fasb.org//1943274/2147481231/810-10-45-25
Reference 3: http://www.xbrl.org/2003/role/disclosureRef
-Topic 235
-SubTopic 10
-Name Accounting Standards Codification
-Section S99
-Paragraph 1
-Subparagraph (SX 210.4-08(g)(1)(ii))
-Publisher FASB
-URI https://asc.fasb.org//1943274/2147480678/235-10-S99-1
Reference 4: http://www.xbrl.org/2003/role/disclosureRef
-Topic 323
-SubTopic 10
-Name Accounting Standards Codification
-Section 50
-Paragraph 3
-Subparagraph (c)
-Publisher FASB
-URI https://asc.fasb.org//1943274/2147481687/323-10-50-3
Reference 5: http://www.xbrl.org/2003/role/disclosureRef
-Topic 825
-SubTopic 10
-Name Accounting Standards Codification
-Section 50
-Paragraph 28
-Subparagraph (f)
-Publisher FASB
-URI https://asc.fasb.org//1943274/2147482907/825-10-50-28
Reference 6: http://www.xbrl.org/2003/role/exampleRef
-Topic 852
-SubTopic 10
-Name Accounting Standards Codification
-Section 55
-Paragraph 10
-Publisher FASB
-URI https://asc.fasb.org//1943274/2147481372/852-10-55-10
Reference 7: http://www.xbrl.org/2003/role/exampleRef
-Topic 946
-SubTopic 830
-Name Accounting Standards Codification
-Section 55
-Paragraph 12
-Publisher FASB
-URI https://asc.fasb.org//1943274/2147480167/946-830-55-12
Reference 8: http://www.xbrl.org/2003/role/disclosureRef
-Topic 944
-SubTopic 210
-Name Accounting Standards Codification
-Section S99
-Paragraph 1
-Subparagraph (SX 210.7-03(a)(12))
-Publisher FASB
-URI https://asc.fasb.org//1943274/2147479440/944-210-S99-1
Reference 9: http://www.xbrl.org/2003/role/disclosureRef
-Topic 280
-SubTopic 10
-Name Accounting Standards Codification
-Section 50
-Paragraph 22
-Publisher FASB
-URI https://asc.fasb.org//1943274/2147482810/280-10-50-22
Reference 10: http://www.xbrl.org/2003/role/disclosureRef
-Topic 946
-SubTopic 210
-Name Accounting Standards Codification
-Section S99
-Paragraph 1
-Subparagraph (SX 210.6-04(8))
-Publisher FASB
-URI https://asc.fasb.org//1943274/2147479617/946-210-S99-1
Reference 11: http://www.xbrl.org/2003/role/disclosureRef
-Topic 210
-SubTopic 10
-Name Accounting Standards Codification
-Section S99
-Paragraph 1
-Subparagraph (SX 210.5-02(18))
-Publisher FASB
-URI https://asc.fasb.org//1943274/2147480566/210-10-S99-1
Reference 12: http://www.xbrl.org/2003/role/disclosureRef
-Topic 470
-SubTopic 10
-Name Accounting Standards Codification
-Section S99
-Paragraph 1A
-Subparagraph (SX 210.13-01(a)(4)(i))
-Publisher FASB
-URI https://asc.fasb.org//1943274/2147480097/470-10-S99-1A
Reference 13: http://www.xbrl.org/2009/role/commonPracticeRef
-Topic 470
-SubTopic 10
-Name Accounting Standards Codification
-Section S99
-Paragraph 1A
-Subparagraph (SX 210.13-01(a)(4)(ii))
-Publisher FASB
-URI https://asc.fasb.org//1943274/2147480097/470-10-S99-1A
Reference 14: http://www.xbrl.org/2009/role/commonPracticeRef
-Topic 470
-SubTopic 10
-Name Accounting Standards Codification
-Section S99
-Paragraph 1A
-Subparagraph (SX 210.13-01(a)(4)(iii))
-Publisher FASB
-URI https://asc.fasb.org//1943274/2147480097/470-10-S99-1A
Reference 15: http://www.xbrl.org/2003/role/disclosureRef
-Topic 470
-SubTopic 10
-Name Accounting Standards Codification
-Section S99
-Paragraph 1A
-Subparagraph (SX 210.13-01(a)(4)(iii)(A))
-Publisher FASB
-URI https://asc.fasb.org//1943274/2147480097/470-10-S99-1A
Reference 16: http://www.xbrl.org/2003/role/disclosureRef
-Topic 470
-SubTopic 10
-Name Accounting Standards Codification
-Section S99
-Paragraph 1A
-Subparagraph (SX 210.13-01(a)(4)(iv))
-Publisher FASB
-URI https://asc.fasb.org//1943274/2147480097/470-10-S99-1A
Reference 17: http://www.xbrl.org/2003/role/disclosureRef
-Topic 470
-SubTopic 10
-Name Accounting Standards Codification
-Section S99
-Paragraph 1A
-Subparagraph (SX 210.13-01(a)(5))
-Publisher FASB
-URI https://asc.fasb.org//1943274/2147480097/470-10-S99-1A
Reference 18: http://www.xbrl.org/2003/role/disclosureRef
-Topic 470
-SubTopic 10
-Name Accounting Standards Codification
-Section S99
-Paragraph 1B
-Subparagraph (SX 210.13-02(a)(4)(i))
-Publisher FASB
-URI https://asc.fasb.org//1943274/2147480097/470-10-S99-1B
Reference 19: http://www.xbrl.org/2003/role/disclosureRef
-Topic 470
-SubTopic 10
-Name Accounting Standards Codification
-Section S99
-Paragraph 1B
-Subparagraph (SX 210.13-02(a)(4)(iii)(A))
-Publisher FASB
-URI https://asc.fasb.org//1943274/2147480097/470-10-S99-1B
Reference 20: http://www.xbrl.org/2003/role/disclosureRef
-Topic 470
-SubTopic 10
-Name Accounting Standards Codification
-Section S99
-Paragraph 1B
-Subparagraph (SX 210.13-02(a)(4)(iii)(B))
-Publisher FASB
-URI https://asc.fasb.org//1943274/2147480097/470-10-S99-1B
Reference 21: http://www.xbrl.org/2003/role/disclosureRef
-Topic 470
-SubTopic 10
-Name Accounting Standards Codification
-Section S99
-Paragraph 1B
-Subparagraph (SX 210.13-02(a)(4)(iv))
-Publisher FASB
-URI https://asc.fasb.org//1943274/2147480097/470-10-S99-1B
Reference 22: http://www.xbrl.org/2003/role/disclosureRef
-Topic 470
-SubTopic 10
-Name Accounting Standards Codification
-Section S99
-Paragraph 1B
-Subparagraph (SX 210.13-02(a)(5))
-Publisher FASB
-URI https://asc.fasb.org//1943274/2147480097/470-10-S99-1B
Reference 23: http://www.xbrl.org/2009/role/commonPracticeRef
-Topic 852
-SubTopic 10
-Name Accounting Standards Codification
-Section 50
-Paragraph 7
-Subparagraph (a)
-Publisher FASB
-URI https://asc.fasb.org//1943274/2147481404/852-10-50-7
Reference 24: http://www.xbrl.org/2003/role/disclosureRef
-Topic 280
-SubTopic 10
-Name Accounting Standards Codification
-Section 50
-Paragraph 30
-Subparagraph (c)
-Publisher FASB
-URI https://asc.fasb.org//1943274/2147482810/280-10-50-30
Reference 25: http://www.xbrl.org/2003/role/disclosureRef
-Topic 280
-SubTopic 10
-Name Accounting Standards Codification
-Section 50
-Paragraph 32
-Subparagraph (d)
-Publisher FASB
-URI https://asc.fasb.org//1943274/2147482810/280-10-50-32
Reference 26: http://fasb.org/us-gaap/role/ref/legacyRef
-Topic 942
-SubTopic 210
-Name Accounting Standards Codification
-Section S99
-Paragraph 1
-Subparagraph (SX 210.9-03(11))
-Publisher FASB
-URI https://asc.fasb.org//1943274/2147479853/942-210-S99-1
| Name: |
us-gaap_Assets |
| Namespace Prefix: |
us-gaap_ |
| Data Type: |
xbrli:monetaryItemType |
| Balance Type: |
debit |
| Period Type: |
instant |
|
| X |
- References
+ Details
| Name: |
us-gaap_AssetsAbstract |
| Namespace Prefix: |
us-gaap_ |
| Data Type: |
xbrli:stringItemType |
| Balance Type: |
na |
| Period Type: |
duration |
|
| X |
- DefinitionSum of the carrying amounts as of the balance sheet date of all assets that are expected to be realized in cash, sold, or consumed within one year (or the normal operating cycle, if longer). Assets are probable future economic benefits obtained or controlled by an entity as a result of past transactions or events. Reference 1: http://www.xbrl.org/2003/role/disclosureRef
-Topic 810
-SubTopic 10
-Name Accounting Standards Codification
-Section 50
-Paragraph 3
-Subparagraph (bb)
-Publisher FASB
-URI https://asc.fasb.org//1943274/2147481203/810-10-50-3
Reference 2: http://www.xbrl.org/2003/role/disclosureRef
-Topic 810
-SubTopic 10
-Name Accounting Standards Codification
-Section 45
-Paragraph 25
-Subparagraph (a)
-Publisher FASB
-URI https://asc.fasb.org//1943274/2147481231/810-10-45-25
Reference 3: http://www.xbrl.org/2003/role/disclosureRef
-Topic 235
-SubTopic 10
-Name Accounting Standards Codification
-Section S99
-Paragraph 1
-Subparagraph (SX 210.4-08(g)(1)(ii))
-Publisher FASB
-URI https://asc.fasb.org//1943274/2147480678/235-10-S99-1
Reference 4: http://www.xbrl.org/2003/role/disclosureRef
-Topic 323
-SubTopic 10
-Name Accounting Standards Codification
-Section 50
-Paragraph 3
-Subparagraph (c)
-Publisher FASB
-URI https://asc.fasb.org//1943274/2147481687/323-10-50-3
Reference 5: http://www.xbrl.org/2003/role/disclosureRef
-Topic 825
-SubTopic 10
-Name Accounting Standards Codification
-Section 50
-Paragraph 28
-Subparagraph (f)
-Publisher FASB
-URI https://asc.fasb.org//1943274/2147482907/825-10-50-28
Reference 6: http://www.xbrl.org/2003/role/exampleRef
-Topic 852
-SubTopic 10
-Name Accounting Standards Codification
-Section 55
-Paragraph 10
-Publisher FASB
-URI https://asc.fasb.org//1943274/2147481372/852-10-55-10
Reference 7: http://www.xbrl.org/2003/role/disclosureRef
-Topic 210
-SubTopic 10
-Name Accounting Standards Codification
-Section 45
-Paragraph 1
-Publisher FASB
-URI https://asc.fasb.org//1943274/2147483467/210-10-45-1
Reference 8: http://www.xbrl.org/2003/role/disclosureRef
-Topic 210
-SubTopic 10
-Name Accounting Standards Codification
-Section S99
-Paragraph 1
-Subparagraph (SX 210.5-02(9))
-Publisher FASB
-URI https://asc.fasb.org//1943274/2147480566/210-10-S99-1
Reference 9: http://www.xbrl.org/2003/role/disclosureRef
-Topic 470
-SubTopic 10
-Name Accounting Standards Codification
-Section S99
-Paragraph 1A
-Subparagraph (SX 210.13-01(a)(4)(i))
-Publisher FASB
-URI https://asc.fasb.org//1943274/2147480097/470-10-S99-1A
Reference 10: http://www.xbrl.org/2009/role/commonPracticeRef
-Topic 470
-SubTopic 10
-Name Accounting Standards Codification
-Section S99
-Paragraph 1A
-Subparagraph (SX 210.13-01(a)(4)(ii))
-Publisher FASB
-URI https://asc.fasb.org//1943274/2147480097/470-10-S99-1A
Reference 11: http://www.xbrl.org/2009/role/commonPracticeRef
-Topic 470
-SubTopic 10
-Name Accounting Standards Codification
-Section S99
-Paragraph 1A
-Subparagraph (SX 210.13-01(a)(4)(iii))
-Publisher FASB
-URI https://asc.fasb.org//1943274/2147480097/470-10-S99-1A
Reference 12: http://www.xbrl.org/2003/role/disclosureRef
-Topic 470
-SubTopic 10
-Name Accounting Standards Codification
-Section S99
-Paragraph 1A
-Subparagraph (SX 210.13-01(a)(4)(iii)(A))
-Publisher FASB
-URI https://asc.fasb.org//1943274/2147480097/470-10-S99-1A
Reference 13: http://www.xbrl.org/2003/role/disclosureRef
-Topic 470
-SubTopic 10
-Name Accounting Standards Codification
-Section S99
-Paragraph 1A
-Subparagraph (SX 210.13-01(a)(4)(iv))
-Publisher FASB
-URI https://asc.fasb.org//1943274/2147480097/470-10-S99-1A
Reference 14: http://www.xbrl.org/2003/role/disclosureRef
-Topic 470
-SubTopic 10
-Name Accounting Standards Codification
-Section S99
-Paragraph 1A
-Subparagraph (SX 210.13-01(a)(5))
-Publisher FASB
-URI https://asc.fasb.org//1943274/2147480097/470-10-S99-1A
Reference 15: http://www.xbrl.org/2003/role/disclosureRef
-Topic 470
-SubTopic 10
-Name Accounting Standards Codification
-Section S99
-Paragraph 1B
-Subparagraph (SX 210.13-02(a)(4)(i))
-Publisher FASB
-URI https://asc.fasb.org//1943274/2147480097/470-10-S99-1B
Reference 16: http://www.xbrl.org/2003/role/disclosureRef
-Topic 470
-SubTopic 10
-Name Accounting Standards Codification
-Section S99
-Paragraph 1B
-Subparagraph (SX 210.13-02(a)(4)(iii)(A))
-Publisher FASB
-URI https://asc.fasb.org//1943274/2147480097/470-10-S99-1B
Reference 17: http://www.xbrl.org/2003/role/disclosureRef
-Topic 470
-SubTopic 10
-Name Accounting Standards Codification
-Section S99
-Paragraph 1B
-Subparagraph (SX 210.13-02(a)(4)(iii)(B))
-Publisher FASB
-URI https://asc.fasb.org//1943274/2147480097/470-10-S99-1B
Reference 18: http://www.xbrl.org/2003/role/disclosureRef
-Topic 470
-SubTopic 10
-Name Accounting Standards Codification
-Section S99
-Paragraph 1B
-Subparagraph (SX 210.13-02(a)(4)(iv))
-Publisher FASB
-URI https://asc.fasb.org//1943274/2147480097/470-10-S99-1B
Reference 19: http://www.xbrl.org/2003/role/disclosureRef
-Topic 470
-SubTopic 10
-Name Accounting Standards Codification
-Section S99
-Paragraph 1B
-Subparagraph (SX 210.13-02(a)(5))
-Publisher FASB
-URI https://asc.fasb.org//1943274/2147480097/470-10-S99-1B
Reference 20: http://www.xbrl.org/2009/role/commonPracticeRef
-Topic 852
-SubTopic 10
-Name Accounting Standards Codification
-Section 50
-Paragraph 7
-Subparagraph (a)
-Publisher FASB
-URI https://asc.fasb.org//1943274/2147481404/852-10-50-7
| Name: |
us-gaap_AssetsCurrent |
| Namespace Prefix: |
us-gaap_ |
| Data Type: |
xbrli:monetaryItemType |
| Balance Type: |
debit |
| Period Type: |
instant |
|
| X |
- DefinitionThe carrying amount of capitalized computer software costs net of accumulated amortization as of the balance sheet date. Reference 1: http://www.xbrl.org/2003/role/disclosureRef
-Topic 985
-SubTopic 20
-Name Accounting Standards Codification
-Section 50
-Paragraph 1
-Subparagraph (a)
-Publisher FASB
-URI https://asc.fasb.org//1943274/2147481283/985-20-50-1
| Name: |
us-gaap_CapitalizedComputerSoftwareNet |
| Namespace Prefix: |
us-gaap_ |
| Data Type: |
xbrli:monetaryItemType |
| Balance Type: |
debit |
| Period Type: |
instant |
|
| X |
- DefinitionAmount, after accumulated amortization and accumulated impairment loss, of asset recognized from cost incurred to obtain or fulfill contract with customer. Reference 1: http://www.xbrl.org/2003/role/disclosureRef
-Topic 340
-SubTopic 40
-Name Accounting Standards Codification
-Section 50
-Paragraph 3
-Subparagraph (a)
-Publisher FASB
-URI https://asc.fasb.org//1943274/2147479483/340-40-50-3
| Name: |
us-gaap_CapitalizedContractCostNet |
| Namespace Prefix: |
us-gaap_ |
| Data Type: |
xbrli:monetaryItemType |
| Balance Type: |
debit |
| Period Type: |
instant |
|
| X |
- DefinitionAmount of currency on hand as well as demand deposits with banks or financial institutions. Includes other kinds of accounts that have the general characteristics of demand deposits. Excludes cash and cash equivalents within disposal group and discontinued operation. Reference 1: http://www.xbrl.org/2003/role/exampleRef
-Topic 852
-SubTopic 10
-Name Accounting Standards Codification
-Section 55
-Paragraph 10
-Publisher FASB
-URI https://asc.fasb.org//1943274/2147481372/852-10-55-10
Reference 2: http://www.xbrl.org/2003/role/exampleRef
-Topic 946
-SubTopic 830
-Name Accounting Standards Codification
-Section 55
-Paragraph 12
-Publisher FASB
-URI https://asc.fasb.org//1943274/2147480167/946-830-55-12
Reference 3: http://www.xbrl.org/2003/role/disclosureRef
-Topic 944
-SubTopic 210
-Name Accounting Standards Codification
-Section S99
-Paragraph 1
-Subparagraph (SX 210.7-03(a)(2))
-Publisher FASB
-URI https://asc.fasb.org//1943274/2147479440/944-210-S99-1
Reference 4: http://www.xbrl.org/2003/role/disclosureRef
-Topic 946
-SubTopic 210
-Name Accounting Standards Codification
-Section S99
-Paragraph 1
-Subparagraph (SX 210.6-04(4))
-Publisher FASB
-URI https://asc.fasb.org//1943274/2147479617/946-210-S99-1
Reference 5: http://www.xbrl.org/2003/role/disclosureRef
-Topic 946
-SubTopic 210
-Name Accounting Standards Codification
-Section 45
-Paragraph 21
-Publisher FASB
-URI https://asc.fasb.org//1943274/2147480555/946-210-45-21
Reference 6: http://www.xbrl.org/2009/role/commonPracticeRef
-Topic 210
-SubTopic 10
-Name Accounting Standards Codification
-Section S99
-Paragraph 1
-Subparagraph (SX 210.5-02(1))
-Publisher FASB
-URI https://asc.fasb.org//1943274/2147480566/210-10-S99-1
Reference 7: http://www.xbrl.org/2003/role/disclosureRef
-Name Accounting Standards Codification
-Section 45
-Paragraph 20
-SubTopic 210
-Topic 946
-Publisher FASB
-URI https://asc.fasb.org//1943274/2147480555/946-210-45-20
| Name: |
us-gaap_Cash |
| Namespace Prefix: |
us-gaap_ |
| Data Type: |
xbrli:monetaryItemType |
| Balance Type: |
debit |
| Period Type: |
instant |
|
| X |
- DefinitionRepresents the caption on the face of the balance sheet to indicate that the entity has entered into (1) purchase or supply arrangements that will require expending a portion of its resources to meet the terms thereof, and (2) is exposed to potential losses or, less frequently, gains, arising from (a) possible claims against a company's resources due to future performance under contract terms, and (b) possible losses or likely gains from uncertainties that will ultimately be resolved when one or more future events that are deemed likely to occur do occur or fail to occur. Reference 1: http://www.xbrl.org/2003/role/disclosureRef
-Topic 944
-SubTopic 210
-Name Accounting Standards Codification
-Section S99
-Paragraph 1
-Subparagraph (SX 210.7-03(a)(19))
-Publisher FASB
-URI https://asc.fasb.org//1943274/2147479440/944-210-S99-1
Reference 2: http://www.xbrl.org/2003/role/disclosureRef
-Topic 946
-SubTopic 210
-Name Accounting Standards Codification
-Section S99
-Paragraph 1
-Subparagraph (SX 210.6-04(15))
-Publisher FASB
-URI https://asc.fasb.org//1943274/2147479617/946-210-S99-1
Reference 3: http://fasb.org/us-gaap/role/ref/legacyRef
-Name Accounting Standards Codification
-Topic 942
-SubTopic 210
-Section S99
-Paragraph 1
-Subparagraph (SX 210.9-03.17)
-Publisher FASB
-URI https://asc.fasb.org//1943274/2147479853/942-210-S99-1
Reference 4: http://fasb.org/us-gaap/role/ref/legacyRef
-Name Accounting Standards Codification
-Topic 210
-SubTopic 10
-Section S99
-Paragraph 1
-Subparagraph (SX 210.5-02.25)
-Publisher FASB
-URI https://asc.fasb.org//1943274/2147480566/210-10-S99-1
| Name: |
us-gaap_CommitmentsAndContingencies |
| Namespace Prefix: |
us-gaap_ |
| Data Type: |
xbrli:monetaryItemType |
| Balance Type: |
credit |
| Period Type: |
instant |
|
| X |
- DefinitionAggregate par or stated value of issued nonredeemable common stock (or common stock redeemable solely at the option of the issuer). This item includes treasury stock repurchased by the entity. Note: elements for number of nonredeemable common shares, par value and other disclosure concepts are in another section within stockholders' equity. Reference 1: http://www.xbrl.org/2003/role/exampleRef
-Topic 852
-SubTopic 10
-Name Accounting Standards Codification
-Section 55
-Paragraph 10
-Publisher FASB
-URI https://asc.fasb.org//1943274/2147481372/852-10-55-10
Reference 2: http://www.xbrl.org/2003/role/disclosureRef
-Topic 944
-SubTopic 210
-Name Accounting Standards Codification
-Section S99
-Paragraph 1
-Subparagraph (SX 210.7-03(a)(22))
-Publisher FASB
-URI https://asc.fasb.org//1943274/2147479440/944-210-S99-1
Reference 3: http://fasb.org/us-gaap/role/ref/legacyRef
-Topic 210
-SubTopic 10
-Name Accounting Standards Codification
-Section S99
-Paragraph 1
-Subparagraph (SX 210.5-02(29))
-Publisher FASB
-URI https://asc.fasb.org//1943274/2147480566/210-10-S99-1
| Name: |
us-gaap_CommonStockValue |
| Namespace Prefix: |
us-gaap_ |
| Data Type: |
xbrli:monetaryItemType |
| Balance Type: |
credit |
| Period Type: |
instant |
|
| X |
- DefinitionAmount of obligation to transfer good or service to customer for which consideration has been received or is receivable, classified as current. Reference 1: http://www.xbrl.org/2003/role/disclosureRef
-Topic 606
-SubTopic 10
-Name Accounting Standards Codification
-Section 45
-Paragraph 1
-Publisher FASB
-URI https://asc.fasb.org//1943274/2147479837/606-10-45-1
Reference 2: http://www.xbrl.org/2003/role/disclosureRef
-Topic 606
-SubTopic 10
-Name Accounting Standards Codification
-Section 50
-Paragraph 8
-Subparagraph (a)
-Publisher FASB
-URI https://asc.fasb.org//1943274/2147479806/606-10-50-8
Reference 3: http://www.xbrl.org/2003/role/disclosureRef
-Topic 606
-SubTopic 10
-Name Accounting Standards Codification
-Section 45
-Paragraph 2
-Publisher FASB
-URI https://asc.fasb.org//1943274/2147479837/606-10-45-2
| Name: |
us-gaap_ContractWithCustomerLiabilityCurrent |
| Namespace Prefix: |
us-gaap_ |
| Data Type: |
xbrli:monetaryItemType |
| Balance Type: |
credit |
| Period Type: |
instant |
|
| X |
- DefinitionAmount of obligation to transfer good or service to customer for which consideration has been received or is receivable, classified as noncurrent. Reference 1: http://www.xbrl.org/2003/role/disclosureRef
-Topic 606
-SubTopic 10
-Name Accounting Standards Codification
-Section 45
-Paragraph 1
-Publisher FASB
-URI https://asc.fasb.org//1943274/2147479837/606-10-45-1
Reference 2: http://www.xbrl.org/2003/role/disclosureRef
-Topic 606
-SubTopic 10
-Name Accounting Standards Codification
-Section 50
-Paragraph 8
-Subparagraph (a)
-Publisher FASB
-URI https://asc.fasb.org//1943274/2147479806/606-10-50-8
Reference 3: http://www.xbrl.org/2003/role/disclosureRef
-Topic 606
-SubTopic 10
-Name Accounting Standards Codification
-Section 45
-Paragraph 2
-Publisher FASB
-URI https://asc.fasb.org//1943274/2147479837/606-10-45-2
| Name: |
us-gaap_ContractWithCustomerLiabilityNoncurrent |
| Namespace Prefix: |
us-gaap_ |
| Data Type: |
xbrli:monetaryItemType |
| Balance Type: |
credit |
| Period Type: |
instant |
|
| X |
- DefinitionPresent value of lessee's discounted obligation for lease payments from finance lease, classified as noncurrent. Reference 1: http://www.xbrl.org/2003/role/disclosureRef
-Topic 842
-SubTopic 20
-Name Accounting Standards Codification
-Section 45
-Paragraph 1
-Subparagraph (b)
-Publisher FASB
-URI https://asc.fasb.org//1943274/2147479041/842-20-45-1
| Name: |
us-gaap_FinanceLeaseLiabilityNoncurrent |
| Namespace Prefix: |
us-gaap_ |
| Data Type: |
xbrli:monetaryItemType |
| Balance Type: |
credit |
| Period Type: |
instant |
|
| X |
- DefinitionAmount after accumulated impairment loss of an asset representing future economic benefits arising from other assets acquired in a business combination that are not individually identified and separately recognized. Reference 1: http://www.xbrl.org/2003/role/exampleRef
-Topic 852
-SubTopic 10
-Name Accounting Standards Codification
-Section 55
-Paragraph 10
-Publisher FASB
-URI https://asc.fasb.org//1943274/2147481372/852-10-55-10
Reference 2: http://www.xbrl.org/2003/role/exampleRef
-Topic 350
-SubTopic 20
-Name Accounting Standards Codification
-Section 55
-Paragraph 24
-Publisher FASB
-URI https://asc.fasb.org//1943274/2147482548/350-20-55-24
Reference 3: http://www.xbrl.org/2003/role/disclosureRef
-Topic 210
-SubTopic 10
-Name Accounting Standards Codification
-Section S99
-Paragraph 1
-Subparagraph (SX 210.5-02(15))
-Publisher FASB
-URI https://asc.fasb.org//1943274/2147480566/210-10-S99-1
Reference 4: http://www.xbrl.org/2003/role/disclosureRef
-Topic 350
-SubTopic 20
-Name Accounting Standards Codification
-Section 45
-Paragraph 1
-Publisher FASB
-URI https://asc.fasb.org//1943274/2147482598/350-20-45-1
Reference 5: http://www.xbrl.org/2009/role/commonPracticeRef
-Topic 350
-SubTopic 20
-Name Accounting Standards Codification
-Section 50
-Paragraph 1
-Subparagraph (a)
-Publisher FASB
-URI https://asc.fasb.org//1943274/2147482573/350-20-50-1
Reference 6: http://www.xbrl.org/2009/role/commonPracticeRef
-Topic 350
-SubTopic 20
-Name Accounting Standards Codification
-Section 50
-Paragraph 1
-Subparagraph (h)
-Publisher FASB
-URI https://asc.fasb.org//1943274/2147482573/350-20-50-1
Reference 7: http://www.xbrl.org/2003/role/disclosureRef
-Topic 942
-SubTopic 210
-Name Accounting Standards Codification
-Section S99
-Paragraph 1
-Subparagraph (SX 210.9-03(10)(1))
-Publisher FASB
-URI https://asc.fasb.org//1943274/2147479853/942-210-S99-1
| Name: |
us-gaap_Goodwill |
| Namespace Prefix: |
us-gaap_ |
| Data Type: |
xbrli:monetaryItemType |
| Balance Type: |
debit |
| Period Type: |
instant |
|
| X |
- DefinitionAmount after valuation and LIFO reserves of inventory expected to be sold, or consumed within one year or operating cycle, if longer. Reference 1: http://www.xbrl.org/2003/role/exampleRef
-Topic 852
-SubTopic 10
-Name Accounting Standards Codification
-Section 55
-Paragraph 10
-Publisher FASB
-URI https://asc.fasb.org//1943274/2147481372/852-10-55-10
Reference 2: http://www.xbrl.org/2003/role/exampleRef
-Topic 210
-SubTopic 10
-Name Accounting Standards Codification
-Section 45
-Paragraph 1
-Subparagraph (b)
-Publisher FASB
-URI https://asc.fasb.org//1943274/2147483467/210-10-45-1
Reference 3: http://www.xbrl.org/2003/role/disclosureRef
-Topic 210
-SubTopic 10
-Name Accounting Standards Codification
-Section S99
-Paragraph 1
-Subparagraph (SX 210.5-02(6))
-Publisher FASB
-URI https://asc.fasb.org//1943274/2147480566/210-10-S99-1
| Name: |
us-gaap_InventoryNet |
| Namespace Prefix: |
us-gaap_ |
| Data Type: |
xbrli:monetaryItemType |
| Balance Type: |
debit |
| Period Type: |
instant |
|
| X |
- DefinitionSum of the carrying amounts as of the balance sheet date of all liabilities that are recognized. Liabilities are probable future sacrifices of economic benefits arising from present obligations of an entity to transfer assets or provide services to other entities in the future. Reference 1: http://www.xbrl.org/2003/role/disclosureRef
-Topic 810
-SubTopic 10
-Name Accounting Standards Codification
-Section 50
-Paragraph 3
-Subparagraph (c)
-Publisher FASB
-URI https://asc.fasb.org//1943274/2147481203/810-10-50-3
Reference 2: http://www.xbrl.org/2003/role/disclosureRef
-Topic 810
-SubTopic 10
-Name Accounting Standards Codification
-Section 45
-Paragraph 25
-Subparagraph (b)
-Publisher FASB
-URI https://asc.fasb.org//1943274/2147481231/810-10-45-25
Reference 3: http://www.xbrl.org/2003/role/disclosureRef
-Topic 810
-SubTopic 10
-Name Accounting Standards Codification
-Section 50
-Paragraph 3
-Subparagraph (bb)
-Publisher FASB
-URI https://asc.fasb.org//1943274/2147481203/810-10-50-3
Reference 4: http://www.xbrl.org/2003/role/disclosureRef
-Topic 235
-SubTopic 10
-Name Accounting Standards Codification
-Section S99
-Paragraph 1
-Subparagraph (SX 210.4-08(g)(1)(ii))
-Publisher FASB
-URI https://asc.fasb.org//1943274/2147480678/235-10-S99-1
Reference 5: http://www.xbrl.org/2003/role/disclosureRef
-Topic 323
-SubTopic 10
-Name Accounting Standards Codification
-Section 50
-Paragraph 3
-Subparagraph (c)
-Publisher FASB
-URI https://asc.fasb.org//1943274/2147481687/323-10-50-3
Reference 6: http://www.xbrl.org/2003/role/disclosureRef
-Topic 825
-SubTopic 10
-Name Accounting Standards Codification
-Section 50
-Paragraph 28
-Subparagraph (f)
-Publisher FASB
-URI https://asc.fasb.org//1943274/2147482907/825-10-50-28
Reference 7: http://www.xbrl.org/2003/role/exampleRef
-Topic 946
-SubTopic 830
-Name Accounting Standards Codification
-Section 55
-Paragraph 12
-Publisher FASB
-URI https://asc.fasb.org//1943274/2147480167/946-830-55-12
Reference 8: http://www.xbrl.org/2003/role/disclosureRef
-Topic 946
-SubTopic 210
-Name Accounting Standards Codification
-Section S99
-Paragraph 1
-Subparagraph (SX 210.6-04(14))
-Publisher FASB
-URI https://asc.fasb.org//1943274/2147479617/946-210-S99-1
Reference 9: http://www.xbrl.org/2003/role/disclosureRef
-Topic 470
-SubTopic 10
-Name Accounting Standards Codification
-Section S99
-Paragraph 1A
-Subparagraph (SX 210.13-01(a)(4)(i))
-Publisher FASB
-URI https://asc.fasb.org//1943274/2147480097/470-10-S99-1A
Reference 10: http://www.xbrl.org/2009/role/commonPracticeRef
-Topic 470
-SubTopic 10
-Name Accounting Standards Codification
-Section S99
-Paragraph 1A
-Subparagraph (SX 210.13-01(a)(4)(ii))
-Publisher FASB
-URI https://asc.fasb.org//1943274/2147480097/470-10-S99-1A
Reference 11: http://www.xbrl.org/2003/role/disclosureRef
-Topic 470
-SubTopic 10
-Name Accounting Standards Codification
-Section S99
-Paragraph 1A
-Subparagraph (SX 210.13-01(a)(4)(iii)(A))
-Publisher FASB
-URI https://asc.fasb.org//1943274/2147480097/470-10-S99-1A
Reference 12: http://www.xbrl.org/2003/role/disclosureRef
-Topic 470
-SubTopic 10
-Name Accounting Standards Codification
-Section S99
-Paragraph 1A
-Subparagraph (SX 210.13-01(a)(4)(iv))
-Publisher FASB
-URI https://asc.fasb.org//1943274/2147480097/470-10-S99-1A
Reference 13: http://www.xbrl.org/2003/role/disclosureRef
-Topic 470
-SubTopic 10
-Name Accounting Standards Codification
-Section S99
-Paragraph 1A
-Subparagraph (SX 210.13-01(a)(5))
-Publisher FASB
-URI https://asc.fasb.org//1943274/2147480097/470-10-S99-1A
Reference 14: http://www.xbrl.org/2003/role/disclosureRef
-Topic 470
-SubTopic 10
-Name Accounting Standards Codification
-Section S99
-Paragraph 1B
-Subparagraph (SX 210.13-02(a)(4)(i))
-Publisher FASB
-URI https://asc.fasb.org//1943274/2147480097/470-10-S99-1B
Reference 15: http://www.xbrl.org/2003/role/disclosureRef
-Topic 470
-SubTopic 10
-Name Accounting Standards Codification
-Section S99
-Paragraph 1B
-Subparagraph (SX 210.13-02(a)(4)(iii)(A))
-Publisher FASB
-URI https://asc.fasb.org//1943274/2147480097/470-10-S99-1B
Reference 16: http://www.xbrl.org/2003/role/disclosureRef
-Topic 470
-SubTopic 10
-Name Accounting Standards Codification
-Section S99
-Paragraph 1B
-Subparagraph (SX 210.13-02(a)(4)(iii)(B))
-Publisher FASB
-URI https://asc.fasb.org//1943274/2147480097/470-10-S99-1B
Reference 17: http://www.xbrl.org/2003/role/disclosureRef
-Topic 470
-SubTopic 10
-Name Accounting Standards Codification
-Section S99
-Paragraph 1B
-Subparagraph (SX 210.13-02(a)(4)(iv))
-Publisher FASB
-URI https://asc.fasb.org//1943274/2147480097/470-10-S99-1B
Reference 18: http://www.xbrl.org/2003/role/disclosureRef
-Topic 470
-SubTopic 10
-Name Accounting Standards Codification
-Section S99
-Paragraph 1B
-Subparagraph (SX 210.13-02(a)(5))
-Publisher FASB
-URI https://asc.fasb.org//1943274/2147480097/470-10-S99-1B
Reference 19: http://www.xbrl.org/2009/role/commonPracticeRef
-Topic 852
-SubTopic 10
-Name Accounting Standards Codification
-Section 50
-Paragraph 7
-Subparagraph (a)
-Publisher FASB
-URI https://asc.fasb.org//1943274/2147481404/852-10-50-7
Reference 20: http://www.xbrl.org/2009/role/commonPracticeRef
-Topic 852
-SubTopic 10
-Name Accounting Standards Codification
-Section 50
-Paragraph 7
-Subparagraph (b)
-Publisher FASB
-URI https://asc.fasb.org//1943274/2147481404/852-10-50-7
Reference 21: http://www.xbrl.org/2003/role/exampleRef
-Topic 280
-SubTopic 10
-Name Accounting Standards Codification
-Section 50
-Paragraph 30
-Subparagraph (d)
-Publisher FASB
-URI https://asc.fasb.org//1943274/2147482810/280-10-50-30
Reference 22: http://fasb.org/us-gaap/role/ref/legacyRef
-Name Accounting Standards Codification
-Topic 210
-SubTopic 10
-Section S99
-Paragraph 1
-Subparagraph (SX 210.5-02.19-26)
-Publisher FASB
-URI https://asc.fasb.org//1943274/2147480566/210-10-S99-1
| Name: |
us-gaap_Liabilities |
| Namespace Prefix: |
us-gaap_ |
| Data Type: |
xbrli:monetaryItemType |
| Balance Type: |
credit |
| Period Type: |
instant |
|
| X |
- DefinitionAmount of liabilities and equity items, including the portion of equity attributable to noncontrolling interests, if any. Reference 1: http://www.xbrl.org/2003/role/exampleRef
-Topic 852
-SubTopic 10
-Name Accounting Standards Codification
-Section 55
-Paragraph 10
-Publisher FASB
-URI https://asc.fasb.org//1943274/2147481372/852-10-55-10
Reference 2: http://www.xbrl.org/2003/role/disclosureRef
-Topic 944
-SubTopic 210
-Name Accounting Standards Codification
-Section S99
-Paragraph 1
-Subparagraph (SX 210.7-03(a)(25))
-Publisher FASB
-URI https://asc.fasb.org//1943274/2147479440/944-210-S99-1
Reference 3: http://www.xbrl.org/2009/role/commonPracticeRef
-Topic 235
-SubTopic 10
-Name Accounting Standards Codification
-Section S99
-Paragraph 1
-Subparagraph (SX 210.4-08(g)(1)(ii))
-Publisher FASB
-URI https://asc.fasb.org//1943274/2147480678/235-10-S99-1
Reference 4: http://www.xbrl.org/2009/role/commonPracticeRef
-Topic 323
-SubTopic 10
-Name Accounting Standards Codification
-Section 50
-Paragraph 3
-Subparagraph (c)
-Publisher FASB
-URI https://asc.fasb.org//1943274/2147481687/323-10-50-3
Reference 5: http://www.xbrl.org/2009/role/commonPracticeRef
-Topic 825
-SubTopic 10
-Name Accounting Standards Codification
-Section 50
-Paragraph 28
-Subparagraph (f)
-Publisher FASB
-URI https://asc.fasb.org//1943274/2147482907/825-10-50-28
Reference 6: http://fasb.org/us-gaap/role/ref/legacyRef
-Topic 942
-SubTopic 210
-Name Accounting Standards Codification
-Section S99
-Paragraph 1
-Subparagraph (SX 210.9-03(23))
-Publisher FASB
-URI https://asc.fasb.org//1943274/2147479853/942-210-S99-1
Reference 7: http://fasb.org/us-gaap/role/ref/legacyRef
-Topic 210
-SubTopic 10
-Name Accounting Standards Codification
-Section S99
-Paragraph 1
-Subparagraph (SX 210.5-02(32))
-Publisher FASB
-URI https://asc.fasb.org//1943274/2147480566/210-10-S99-1
| Name: |
us-gaap_LiabilitiesAndStockholdersEquity |
| Namespace Prefix: |
us-gaap_ |
| Data Type: |
xbrli:monetaryItemType |
| Balance Type: |
credit |
| Period Type: |
instant |
|
| X |
- DefinitionTotal obligations incurred as part of normal operations that are expected to be paid during the following twelve months or within one business cycle, if longer. Reference 1: http://www.xbrl.org/2003/role/disclosureRef
-Topic 810
-SubTopic 10
-Name Accounting Standards Codification
-Section 50
-Paragraph 3
-Subparagraph (c)
-Publisher FASB
-URI https://asc.fasb.org//1943274/2147481203/810-10-50-3
Reference 2: http://www.xbrl.org/2003/role/disclosureRef
-Topic 810
-SubTopic 10
-Name Accounting Standards Codification
-Section 45
-Paragraph 25
-Subparagraph (b)
-Publisher FASB
-URI https://asc.fasb.org//1943274/2147481231/810-10-45-25
Reference 3: http://www.xbrl.org/2003/role/disclosureRef
-Topic 810
-SubTopic 10
-Name Accounting Standards Codification
-Section 50
-Paragraph 3
-Subparagraph (bb)
-Publisher FASB
-URI https://asc.fasb.org//1943274/2147481203/810-10-50-3
Reference 4: http://www.xbrl.org/2003/role/disclosureRef
-Topic 235
-SubTopic 10
-Name Accounting Standards Codification
-Section S99
-Paragraph 1
-Subparagraph (SX 210.4-08(g)(1)(ii))
-Publisher FASB
-URI https://asc.fasb.org//1943274/2147480678/235-10-S99-1
Reference 5: http://www.xbrl.org/2003/role/disclosureRef
-Topic 323
-SubTopic 10
-Name Accounting Standards Codification
-Section 50
-Paragraph 3
-Subparagraph (c)
-Publisher FASB
-URI https://asc.fasb.org//1943274/2147481687/323-10-50-3
Reference 6: http://www.xbrl.org/2003/role/disclosureRef
-Topic 825
-SubTopic 10
-Name Accounting Standards Codification
-Section 50
-Paragraph 28
-Subparagraph (f)
-Publisher FASB
-URI https://asc.fasb.org//1943274/2147482907/825-10-50-28
Reference 7: http://www.xbrl.org/2003/role/exampleRef
-Topic 852
-SubTopic 10
-Name Accounting Standards Codification
-Section 55
-Paragraph 10
-Publisher FASB
-URI https://asc.fasb.org//1943274/2147481372/852-10-55-10
Reference 8: http://www.xbrl.org/2003/role/disclosureRef
-Topic 210
-SubTopic 10
-Name Accounting Standards Codification
-Section 45
-Paragraph 5
-Publisher FASB
-URI https://asc.fasb.org//1943274/2147483467/210-10-45-5
Reference 9: http://www.xbrl.org/2003/role/disclosureRef
-Topic 470
-SubTopic 10
-Name Accounting Standards Codification
-Section S99
-Paragraph 1A
-Subparagraph (SX 210.13-01(a)(4)(i))
-Publisher FASB
-URI https://asc.fasb.org//1943274/2147480097/470-10-S99-1A
Reference 10: http://www.xbrl.org/2009/role/commonPracticeRef
-Topic 470
-SubTopic 10
-Name Accounting Standards Codification
-Section S99
-Paragraph 1A
-Subparagraph (SX 210.13-01(a)(4)(ii))
-Publisher FASB
-URI https://asc.fasb.org//1943274/2147480097/470-10-S99-1A
Reference 11: http://www.xbrl.org/2003/role/disclosureRef
-Topic 470
-SubTopic 10
-Name Accounting Standards Codification
-Section S99
-Paragraph 1A
-Subparagraph (SX 210.13-01(a)(4)(iii)(A))
-Publisher FASB
-URI https://asc.fasb.org//1943274/2147480097/470-10-S99-1A
Reference 12: http://www.xbrl.org/2003/role/disclosureRef
-Topic 470
-SubTopic 10
-Name Accounting Standards Codification
-Section S99
-Paragraph 1A
-Subparagraph (SX 210.13-01(a)(4)(iv))
-Publisher FASB
-URI https://asc.fasb.org//1943274/2147480097/470-10-S99-1A
Reference 13: http://www.xbrl.org/2003/role/disclosureRef
-Topic 470
-SubTopic 10
-Name Accounting Standards Codification
-Section S99
-Paragraph 1A
-Subparagraph (SX 210.13-01(a)(5))
-Publisher FASB
-URI https://asc.fasb.org//1943274/2147480097/470-10-S99-1A
Reference 14: http://www.xbrl.org/2003/role/disclosureRef
-Topic 470
-SubTopic 10
-Name Accounting Standards Codification
-Section S99
-Paragraph 1B
-Subparagraph (SX 210.13-02(a)(4)(i))
-Publisher FASB
-URI https://asc.fasb.org//1943274/2147480097/470-10-S99-1B
Reference 15: http://www.xbrl.org/2003/role/disclosureRef
-Topic 470
-SubTopic 10
-Name Accounting Standards Codification
-Section S99
-Paragraph 1B
-Subparagraph (SX 210.13-02(a)(4)(iii)(A))
-Publisher FASB
-URI https://asc.fasb.org//1943274/2147480097/470-10-S99-1B
Reference 16: http://www.xbrl.org/2003/role/disclosureRef
-Topic 470
-SubTopic 10
-Name Accounting Standards Codification
-Section S99
-Paragraph 1B
-Subparagraph (SX 210.13-02(a)(4)(iii)(B))
-Publisher FASB
-URI https://asc.fasb.org//1943274/2147480097/470-10-S99-1B
Reference 17: http://www.xbrl.org/2003/role/disclosureRef
-Topic 470
-SubTopic 10
-Name Accounting Standards Codification
-Section S99
-Paragraph 1B
-Subparagraph (SX 210.13-02(a)(4)(iv))
-Publisher FASB
-URI https://asc.fasb.org//1943274/2147480097/470-10-S99-1B
Reference 18: http://www.xbrl.org/2003/role/disclosureRef
-Topic 470
-SubTopic 10
-Name Accounting Standards Codification
-Section S99
-Paragraph 1B
-Subparagraph (SX 210.13-02(a)(5))
-Publisher FASB
-URI https://asc.fasb.org//1943274/2147480097/470-10-S99-1B
Reference 19: http://www.xbrl.org/2009/role/commonPracticeRef
-Topic 852
-SubTopic 10
-Name Accounting Standards Codification
-Section 50
-Paragraph 7
-Subparagraph (a)
-Publisher FASB
-URI https://asc.fasb.org//1943274/2147481404/852-10-50-7
Reference 20: http://www.xbrl.org/2009/role/commonPracticeRef
-Topic 852
-SubTopic 10
-Name Accounting Standards Codification
-Section 50
-Paragraph 7
-Subparagraph (b)
-Publisher FASB
-URI https://asc.fasb.org//1943274/2147481404/852-10-50-7
Reference 21: http://fasb.org/us-gaap/role/ref/legacyRef
-Name Accounting Standards Codification
-Topic 210
-SubTopic 10
-Section S99
-Paragraph 1
-Subparagraph (SX 210.5-02.21)
-Publisher FASB
-URI https://asc.fasb.org//1943274/2147480566/210-10-S99-1
| Name: |
us-gaap_LiabilitiesCurrent |
| Namespace Prefix: |
us-gaap_ |
| Data Type: |
xbrli:monetaryItemType |
| Balance Type: |
credit |
| Period Type: |
instant |
|
| X |
- References
+ Details
| Name: |
us-gaap_LiabilitiesCurrentAbstract |
| Namespace Prefix: |
us-gaap_ |
| Data Type: |
xbrli:stringItemType |
| Balance Type: |
na |
| Period Type: |
duration |
|
| X |
- DefinitionAmount, after deduction of unamortized premium (discount) and debt issuance cost, of long-term debt classified as noncurrent. Excludes lease obligation. Reference 1: http://www.xbrl.org/2003/role/disclosureRef
-Topic 210
-SubTopic 10
-Name Accounting Standards Codification
-Section S99
-Paragraph 1
-Subparagraph (SX 210.5-02(22))
-Publisher FASB
-URI https://asc.fasb.org//1943274/2147480566/210-10-S99-1
| Name: |
us-gaap_LongTermDebtNoncurrent |
| Namespace Prefix: |
us-gaap_ |
| Data Type: |
xbrli:monetaryItemType |
| Balance Type: |
credit |
| Period Type: |
instant |
|
| X |
- DefinitionPresent value of lessee's discounted obligation for lease payments from operating lease, classified as current. Reference 1: http://www.xbrl.org/2003/role/disclosureRef
-Topic 842
-SubTopic 20
-Name Accounting Standards Codification
-Section 45
-Paragraph 1
-Subparagraph (b)
-Publisher FASB
-URI https://asc.fasb.org//1943274/2147479041/842-20-45-1
| Name: |
us-gaap_OperatingLeaseLiabilityCurrent |
| Namespace Prefix: |
us-gaap_ |
| Data Type: |
xbrli:monetaryItemType |
| Balance Type: |
credit |
| Period Type: |
instant |
|
| X |
- DefinitionPresent value of lessee's discounted obligation for lease payments from operating lease, classified as noncurrent. Reference 1: http://www.xbrl.org/2003/role/disclosureRef
-Topic 842
-SubTopic 20
-Name Accounting Standards Codification
-Section 45
-Paragraph 1
-Subparagraph (b)
-Publisher FASB
-URI https://asc.fasb.org//1943274/2147479041/842-20-45-1
| Name: |
us-gaap_OperatingLeaseLiabilityNoncurrent |
| Namespace Prefix: |
us-gaap_ |
| Data Type: |
xbrli:monetaryItemType |
| Balance Type: |
credit |
| Period Type: |
instant |
|
| X |
- DefinitionAmount of lessee's right to use underlying asset under operating lease. Reference 1: http://www.xbrl.org/2003/role/disclosureRef
-Topic 842
-SubTopic 20
-Name Accounting Standards Codification
-Section 45
-Paragraph 1
-Subparagraph (a)
-Publisher FASB
-URI https://asc.fasb.org//1943274/2147479041/842-20-45-1
| Name: |
us-gaap_OperatingLeaseRightOfUseAsset |
| Namespace Prefix: |
us-gaap_ |
| Data Type: |
xbrli:monetaryItemType |
| Balance Type: |
debit |
| Period Type: |
instant |
|
| X |
- DefinitionAmount of assets classified as other. Reference 1: http://www.xbrl.org/2003/role/exampleRef
-Topic 946
-SubTopic 830
-Name Accounting Standards Codification
-Section 55
-Paragraph 12
-Publisher FASB
-URI https://asc.fasb.org//1943274/2147480167/946-830-55-12
Reference 2: http://www.xbrl.org/2003/role/disclosureRef
-Topic 944
-SubTopic 210
-Name Accounting Standards Codification
-Section S99
-Paragraph 1
-Subparagraph (SX 210.7-03(a)(10))
-Publisher FASB
-URI https://asc.fasb.org//1943274/2147479440/944-210-S99-1
Reference 3: http://www.xbrl.org/2003/role/disclosureRef
-Topic 210
-SubTopic 10
-Name Accounting Standards Codification
-Section S99
-Paragraph 1
-Subparagraph (SX 210.5-02(17))
-Publisher FASB
-URI https://asc.fasb.org//1943274/2147480566/210-10-S99-1
Reference 4: http://fasb.org/us-gaap/role/ref/legacyRef
-Topic 942
-SubTopic 210
-Name Accounting Standards Codification
-Section S99
-Paragraph 1
-Subparagraph (SX 210.9-03(10))
-Publisher FASB
-URI https://asc.fasb.org//1943274/2147479853/942-210-S99-1
| Name: |
us-gaap_OtherAssets |
| Namespace Prefix: |
us-gaap_ |
| Data Type: |
xbrli:monetaryItemType |
| Balance Type: |
debit |
| Period Type: |
instant |
|
| X |
- DefinitionAmount after accumulated amortization of finite-lived and indefinite-lived intangible assets classified as other.
| Name: |
us-gaap_OtherIntangibleAssetsNet |
| Namespace Prefix: |
us-gaap_ |
| Data Type: |
xbrli:monetaryItemType |
| Balance Type: |
debit |
| Period Type: |
instant |
|
| X |
- DefinitionAmount of liabilities classified as other, due within one year or the normal operating cycle, if longer. Reference 1: http://www.xbrl.org/2003/role/exampleRef
-Topic 852
-SubTopic 10
-Name Accounting Standards Codification
-Section 55
-Paragraph 10
-Publisher FASB
-URI https://asc.fasb.org//1943274/2147481372/852-10-55-10
Reference 2: http://fasb.org/us-gaap/role/ref/legacyRef
-Name Accounting Standards Codification
-Topic 210
-SubTopic 10
-Section S99
-Paragraph 1
-Subparagraph (SX 210.5-02.20)
-Publisher FASB
-URI https://asc.fasb.org//1943274/2147480566/210-10-S99-1
| Name: |
us-gaap_OtherLiabilitiesCurrent |
| Namespace Prefix: |
us-gaap_ |
| Data Type: |
xbrli:monetaryItemType |
| Balance Type: |
credit |
| Period Type: |
instant |
|
| X |
- DefinitionAmount of liabilities classified as other, due after one year or the normal operating cycle, if longer. Reference 1: http://fasb.org/us-gaap/role/ref/legacyRef
-Name Accounting Standards Codification
-Topic 210
-SubTopic 10
-Section S99
-Paragraph 1
-Subparagraph (SX 210.5-02.24)
-Publisher FASB
-URI https://asc.fasb.org//1943274/2147480566/210-10-S99-1
| Name: |
us-gaap_OtherLiabilitiesNoncurrent |
| Namespace Prefix: |
us-gaap_ |
| Data Type: |
xbrli:monetaryItemType |
| Balance Type: |
credit |
| Period Type: |
instant |
|
| X |
- DefinitionAggregate par or stated value of issued nonredeemable preferred stock (or preferred stock redeemable solely at the option of the issuer). This item includes treasury stock repurchased by the entity. Note: elements for number of nonredeemable preferred shares, par value and other disclosure concepts are in another section within stockholders' equity. Reference 1: http://www.xbrl.org/2003/role/exampleRef
-Topic 852
-SubTopic 10
-Name Accounting Standards Codification
-Section 55
-Paragraph 10
-Publisher FASB
-URI https://asc.fasb.org//1943274/2147481372/852-10-55-10
Reference 2: http://www.xbrl.org/2003/role/disclosureRef
-Topic 944
-SubTopic 210
-Name Accounting Standards Codification
-Section S99
-Paragraph 1
-Subparagraph (SX 210.7-03(a)(21))
-Publisher FASB
-URI https://asc.fasb.org//1943274/2147479440/944-210-S99-1
Reference 3: http://fasb.org/us-gaap/role/ref/legacyRef
-Topic 210
-SubTopic 10
-Name Accounting Standards Codification
-Section S99
-Paragraph 1
-Subparagraph (SX 210.5-02(28))
-Publisher FASB
-URI https://asc.fasb.org//1943274/2147480566/210-10-S99-1
| Name: |
us-gaap_PreferredStockValue |
| Namespace Prefix: |
us-gaap_ |
| Data Type: |
xbrli:monetaryItemType |
| Balance Type: |
credit |
| Period Type: |
instant |
|
| X |
- DefinitionAmount of asset related to consideration paid in advance for costs that provide economic benefits in future periods, and amount of other assets that are expected to be realized or consumed within one year or the normal operating cycle, if longer. Reference 1: http://www.xbrl.org/2009/role/commonPracticeRef
-Topic 210
-SubTopic 10
-Name Accounting Standards Codification
-Section S99
-Paragraph 1
-Subparagraph (SX 210.5-02(9))
-Publisher FASB
-URI https://asc.fasb.org//1943274/2147480566/210-10-S99-1
| Name: |
us-gaap_PrepaidExpenseAndOtherAssetsCurrent |
| Namespace Prefix: |
us-gaap_ |
| Data Type: |
xbrli:monetaryItemType |
| Balance Type: |
debit |
| Period Type: |
instant |
|
| X |
- DefinitionAmount after accumulated depreciation, depletion and amortization of physical assets used in the normal conduct of business to produce goods and services and not intended for resale. Examples include, but are not limited to, land, buildings, machinery and equipment, office equipment, and furniture and fixtures. Reference 1: http://fasb.org/us-gaap/role/ref/legacyRef
-Name Accounting Standards Codification
-Section 50
-Paragraph 1
-SubTopic 10
-Topic 360
-Publisher FASB
-URI https://asc.fasb.org//1943274/2147482099/360-10-50-1
Reference 2: http://www.xbrl.org/2003/role/exampleRef
-Topic 852
-SubTopic 10
-Name Accounting Standards Codification
-Section 55
-Paragraph 10
-Publisher FASB
-URI https://asc.fasb.org//1943274/2147481372/852-10-55-10
Reference 3: http://www.xbrl.org/2003/role/disclosureRef
-Topic 944
-SubTopic 210
-Name Accounting Standards Codification
-Section S99
-Paragraph 1
-Subparagraph (SX 210.7-03(a)(8))
-Publisher FASB
-URI https://asc.fasb.org//1943274/2147479440/944-210-S99-1
Reference 4: http://www.xbrl.org/2003/role/disclosureRef
-Topic 942
-SubTopic 360
-Name Accounting Standards Codification
-Section 50
-Paragraph 1
-Publisher FASB
-URI https://asc.fasb.org//1943274/2147480842/942-360-50-1
| Name: |
us-gaap_PropertyPlantAndEquipmentNet |
| Namespace Prefix: |
us-gaap_ |
| Data Type: |
xbrli:monetaryItemType |
| Balance Type: |
debit |
| Period Type: |
instant |
|
| X |
- DefinitionAmount of accumulated undistributed earnings (deficit). Reference 1: http://www.xbrl.org/2003/role/exampleRef
-Topic 852
-SubTopic 10
-Name Accounting Standards Codification
-Section 55
-Paragraph 10
-Publisher FASB
-URI https://asc.fasb.org//1943274/2147481372/852-10-55-10
Reference 2: http://www.xbrl.org/2003/role/disclosureRef
-Topic 944
-SubTopic 40
-Name Accounting Standards Codification
-Section 65
-Paragraph 2
-Subparagraph (g)(2)(i)
-Publisher FASB
-URI https://asc.fasb.org//1943274/2147480016/944-40-65-2
Reference 3: http://www.xbrl.org/2003/role/disclosureRef
-Topic 944
-SubTopic 40
-Name Accounting Standards Codification
-Section 65
-Paragraph 2
-Subparagraph (h)(2)
-Publisher FASB
-URI https://asc.fasb.org//1943274/2147480016/944-40-65-2
Reference 4: http://www.xbrl.org/2003/role/disclosureRef
-Topic 946
-SubTopic 20
-Name Accounting Standards Codification
-Section 50
-Paragraph 11
-Publisher FASB
-URI https://asc.fasb.org//1943274/2147480990/946-20-50-11
Reference 5: http://www.xbrl.org/2003/role/disclosureRef
-Topic 944
-SubTopic 210
-Name Accounting Standards Codification
-Section S99
-Paragraph 1
-Subparagraph (SX 210.7-03(a)(23)(a)(4))
-Publisher FASB
-URI https://asc.fasb.org//1943274/2147479440/944-210-S99-1
Reference 6: http://www.xbrl.org/2003/role/disclosureRef
-Topic 946
-SubTopic 210
-Name Accounting Standards Codification
-Section S99
-Paragraph 1
-Subparagraph (SX 210.6-04(17))
-Publisher FASB
-URI https://asc.fasb.org//1943274/2147479617/946-210-S99-1
Reference 7: http://fasb.org/us-gaap/role/ref/legacyRef
-Topic 505
-SubTopic 10
-Name Accounting Standards Codification
-Section S99
-Paragraph 1
-Subparagraph (SX 210.3-04)
-Publisher FASB
-URI https://asc.fasb.org//1943274/2147480008/505-10-S99-1
Reference 8: http://fasb.org/us-gaap/role/ref/legacyRef
-Topic 210
-SubTopic 10
-Name Accounting Standards Codification
-Section S99
-Paragraph 1
-Subparagraph (SX 210.5-02(30)(a)(3))
-Publisher FASB
-URI https://asc.fasb.org//1943274/2147480566/210-10-S99-1
| Name: |
us-gaap_RetainedEarningsAccumulatedDeficit |
| Namespace Prefix: |
us-gaap_ |
| Data Type: |
xbrli:monetaryItemType |
| Balance Type: |
credit |
| Period Type: |
instant |
|
| X |
- DefinitionAmount of equity (deficit) attributable to parent. Excludes temporary equity and equity attributable to noncontrolling interest. Reference 1: http://www.xbrl.org/2003/role/exampleRef
-Topic 852
-SubTopic 10
-Name Accounting Standards Codification
-Section 55
-Paragraph 10
-Publisher FASB
-URI https://asc.fasb.org//1943274/2147481372/852-10-55-10
Reference 2: http://www.xbrl.org/2003/role/exampleRef
-Topic 946
-SubTopic 830
-Name Accounting Standards Codification
-Section 55
-Paragraph 12
-Publisher FASB
-URI https://asc.fasb.org//1943274/2147480167/946-830-55-12
Reference 3: http://www.xbrl.org/2003/role/disclosureRef
-Topic 946
-SubTopic 210
-Name Accounting Standards Codification
-Section S99
-Paragraph 1
-Subparagraph (SX 210.6-04(19))
-Publisher FASB
-URI https://asc.fasb.org//1943274/2147479617/946-210-S99-1
Reference 4: http://www.xbrl.org/2003/role/disclosureRef
-Topic 946
-SubTopic 210
-Name Accounting Standards Codification
-Section S99
-Paragraph 2
-Subparagraph (SX 210.6-05(4))
-Publisher FASB
-URI https://asc.fasb.org//1943274/2147479617/946-210-S99-2
Reference 5: http://www.xbrl.org/2009/role/commonPracticeRef
-Topic 946
-SubTopic 220
-Name Accounting Standards Codification
-Section S99
-Paragraph 3
-Subparagraph (SX 210.6-09(4)(b))
-Publisher FASB
-URI https://asc.fasb.org//1943274/2147483575/946-220-S99-3
Reference 6: http://www.xbrl.org/2003/role/disclosureRef
-Topic 946
-SubTopic 220
-Name Accounting Standards Codification
-Section S99
-Paragraph 3
-Subparagraph (SX 210.6-09(6))
-Publisher FASB
-URI https://asc.fasb.org//1943274/2147483575/946-220-S99-3
Reference 7: http://www.xbrl.org/2003/role/disclosureRef
-Topic 946
-SubTopic 220
-Name Accounting Standards Codification
-Section S99
-Paragraph 3
-Subparagraph (SX 210.6-09(7))
-Publisher FASB
-URI https://asc.fasb.org//1943274/2147483575/946-220-S99-3
Reference 8: http://www.xbrl.org/2009/role/commonPracticeRef
-Topic 235
-SubTopic 10
-Name Accounting Standards Codification
-Section S99
-Paragraph 1
-Subparagraph (SX 210.4-08(g)(1)(ii))
-Publisher FASB
-URI https://asc.fasb.org//1943274/2147480678/235-10-S99-1
Reference 9: http://www.xbrl.org/2009/role/commonPracticeRef
-Topic 323
-SubTopic 10
-Name Accounting Standards Codification
-Section 50
-Paragraph 3
-Subparagraph (c)
-Publisher FASB
-URI https://asc.fasb.org//1943274/2147481687/323-10-50-3
Reference 10: http://www.xbrl.org/2009/role/commonPracticeRef
-Topic 825
-SubTopic 10
-Name Accounting Standards Codification
-Section 50
-Paragraph 28
-Subparagraph (f)
-Publisher FASB
-URI https://asc.fasb.org//1943274/2147482907/825-10-50-28
Reference 11: http://fasb.org/us-gaap/role/ref/legacyRef
-Topic 210
-SubTopic 10
-Name Accounting Standards Codification
-Section S99
-Paragraph 1
-Subparagraph (SX 210.5-02(29))
-Publisher FASB
-URI https://asc.fasb.org//1943274/2147480566/210-10-S99-1
Reference 12: http://fasb.org/us-gaap/role/ref/legacyRef
-Topic 210
-SubTopic 10
-Name Accounting Standards Codification
-Section S99
-Paragraph 1
-Subparagraph (SX 210.5-02(31))
-Publisher FASB
-URI https://asc.fasb.org//1943274/2147480566/210-10-S99-1
Reference 13: http://fasb.org/us-gaap/role/ref/legacyRef
-Topic 210
-SubTopic 10
-Name Accounting Standards Codification
-Section S99
-Paragraph 1
-Subparagraph (SX 210.5-02(30))
-Publisher FASB
-URI https://asc.fasb.org//1943274/2147480566/210-10-S99-1
Reference 14: http://fasb.org/us-gaap/role/ref/legacyRef
-Topic 310
-SubTopic 10
-Name Accounting Standards Codification
-Section S99
-Paragraph 2
-Subparagraph (SAB Topic 4.E)
-Publisher FASB
-URI https://asc.fasb.org//1943274/2147480418/310-10-S99-2
| Name: |
us-gaap_StockholdersEquity |
| Namespace Prefix: |
us-gaap_ |
| Data Type: |
xbrli:monetaryItemType |
| Balance Type: |
credit |
| Period Type: |
instant |
|
| X |
- References
+ Details
| Name: |
us-gaap_StockholdersEquityAbstract |
| Namespace Prefix: |
us-gaap_ |
| Data Type: |
xbrli:stringItemType |
| Balance Type: |
na |
| Period Type: |
duration |
|
| X |
- DefinitionCarrying value as of the balance sheet date of obligations incurred and payable for statutory income, sales, use, payroll, excise, real, property and other taxes. Used to reflect the current portion of the liabilities (due within one year or within the normal operating cycle if longer). Reference 1: http://fasb.org/us-gaap/role/ref/legacyRef
-Name Accounting Standards Codification
-Topic 210
-SubTopic 10
-Section S99
-Paragraph 1
-Subparagraph (SX 210.5-02.19,20)
-Publisher FASB
-URI https://asc.fasb.org//1943274/2147480566/210-10-S99-1
| Name: |
us-gaap_TaxesPayableCurrent |
| Namespace Prefix: |
us-gaap_ |
| Data Type: |
xbrli:monetaryItemType |
| Balance Type: |
credit |
| Period Type: |
instant |
|
v3.24.0.1
Condensed Consolidated Balance Sheets (Parenthetical) - $ / shares
|
Mar. 31, 2023 |
Dec. 31, 2022 |
Dec. 31, 2021 |
| Statement of Financial Position [Abstract] |
|
|
|
| Preferred stock, par value |
$ 0.0001
|
$ 0.0001
|
|
| Preferred stock, shares authorized |
1,000,000
|
1,000,000
|
|
| Common stock, par value |
$ 0.0001
|
$ 0.0001
|
$ 0.0001
|
| Common stock, shares authorized |
49,000,000
|
49,000,000
|
49,000,000
|
| Common stock, shares issued |
26,263,070
|
25,909,516
|
26,433,562
|
| Common stock, shares outstanding |
26,263,070
|
25,909,516
|
26,433,562
|
| X |
- DefinitionFace amount or stated value per share of common stock. Reference 1: http://fasb.org/us-gaap/role/ref/legacyRef
-Topic 210
-SubTopic 10
-Name Accounting Standards Codification
-Section S99
-Paragraph 1
-Subparagraph (SX 210.5-02(29))
-Publisher FASB
-URI https://asc.fasb.org//1943274/2147480566/210-10-S99-1
| Name: |
us-gaap_CommonStockParOrStatedValuePerShare |
| Namespace Prefix: |
us-gaap_ |
| Data Type: |
dtr-types:perShareItemType |
| Balance Type: |
na |
| Period Type: |
instant |
|
| X |
- DefinitionThe maximum number of common shares permitted to be issued by an entity's charter and bylaws. Reference 1: http://www.xbrl.org/2003/role/disclosureRef
-Topic 946
-SubTopic 210
-Name Accounting Standards Codification
-Section S99
-Paragraph 1
-Subparagraph (SX 210.6-04(16)(a))
-Publisher FASB
-URI https://asc.fasb.org//1943274/2147479617/946-210-S99-1
Reference 2: http://fasb.org/us-gaap/role/ref/legacyRef
-Topic 210
-SubTopic 10
-Name Accounting Standards Codification
-Section S99
-Paragraph 1
-Subparagraph (SX 210.5-02(29))
-Publisher FASB
-URI https://asc.fasb.org//1943274/2147480566/210-10-S99-1
| Name: |
us-gaap_CommonStockSharesAuthorized |
| Namespace Prefix: |
us-gaap_ |
| Data Type: |
xbrli:sharesItemType |
| Balance Type: |
na |
| Period Type: |
instant |
|
| X |
- DefinitionTotal number of common shares of an entity that have been sold or granted to shareholders (includes common shares that were issued, repurchased and remain in the treasury). These shares represent capital invested by the firm's shareholders and owners, and may be all or only a portion of the number of shares authorized. Shares issued include shares outstanding and shares held in the treasury. Reference 1: http://fasb.org/us-gaap/role/ref/legacyRef
-Topic 210
-SubTopic 10
-Name Accounting Standards Codification
-Section S99
-Paragraph 1
-Subparagraph (SX 210.5-02(29))
-Publisher FASB
-URI https://asc.fasb.org//1943274/2147480566/210-10-S99-1
| Name: |
us-gaap_CommonStockSharesIssued |
| Namespace Prefix: |
us-gaap_ |
| Data Type: |
xbrli:sharesItemType |
| Balance Type: |
na |
| Period Type: |
instant |
|
| X |
- DefinitionNumber of shares of common stock outstanding. Common stock represent the ownership interest in a corporation. Reference 1: http://fasb.org/us-gaap/role/ref/legacyRef
-Name Accounting Standards Codification
-Section 50
-Paragraph 2
-SubTopic 10
-Topic 505
-Publisher FASB
-URI https://asc.fasb.org//1943274/2147481112/505-10-50-2
Reference 2: http://www.xbrl.org/2003/role/disclosureRef
-Topic 946
-SubTopic 210
-Name Accounting Standards Codification
-Section S99
-Paragraph 2
-Subparagraph (SX 210.6-05(4))
-Publisher FASB
-URI https://asc.fasb.org//1943274/2147479617/946-210-S99-2
Reference 3: http://www.xbrl.org/2009/role/commonPracticeRef
-Topic 946
-SubTopic 220
-Name Accounting Standards Codification
-Section S99
-Paragraph 3
-Subparagraph (SX 210.6-09(4)(b))
-Publisher FASB
-URI https://asc.fasb.org//1943274/2147483575/946-220-S99-3
Reference 4: http://www.xbrl.org/2003/role/disclosureRef
-Topic 946
-SubTopic 210
-Name Accounting Standards Codification
-Section S99
-Paragraph 1
-Subparagraph (SX 210.6-04(16)(a))
-Publisher FASB
-URI https://asc.fasb.org//1943274/2147479617/946-210-S99-1
Reference 5: http://www.xbrl.org/2009/role/commonPracticeRef
-Topic 946
-SubTopic 220
-Name Accounting Standards Codification
-Section S99
-Paragraph 3
-Subparagraph (SX 210.6-09(7))
-Publisher FASB
-URI https://asc.fasb.org//1943274/2147483575/946-220-S99-3
Reference 6: http://fasb.org/us-gaap/role/ref/legacyRef
-Topic 210
-SubTopic 10
-Name Accounting Standards Codification
-Section S99
-Paragraph 1
-Subparagraph (SX 210.5-02(29))
-Publisher FASB
-URI https://asc.fasb.org//1943274/2147480566/210-10-S99-1
| Name: |
us-gaap_CommonStockSharesOutstanding |
| Namespace Prefix: |
us-gaap_ |
| Data Type: |
xbrli:sharesItemType |
| Balance Type: |
na |
| Period Type: |
instant |
|
| X |
- DefinitionFace amount or stated value per share of preferred stock nonredeemable or redeemable solely at the option of the issuer. Reference 1: http://www.xbrl.org/2003/role/disclosureRef
-Topic 505
-SubTopic 10
-Name Accounting Standards Codification
-Section 50
-Paragraph 13
-Subparagraph (a)
-Publisher FASB
-URI https://asc.fasb.org//1943274/2147481112/505-10-50-13
Reference 2: http://fasb.org/us-gaap/role/ref/legacyRef
-Topic 210
-SubTopic 10
-Name Accounting Standards Codification
-Section S99
-Paragraph 1
-Subparagraph (SX 210.5-02(28))
-Publisher FASB
-URI https://asc.fasb.org//1943274/2147480566/210-10-S99-1
| Name: |
us-gaap_PreferredStockParOrStatedValuePerShare |
| Namespace Prefix: |
us-gaap_ |
| Data Type: |
dtr-types:perShareItemType |
| Balance Type: |
na |
| Period Type: |
instant |
|
| X |
- DefinitionThe maximum number of nonredeemable preferred shares (or preferred stock redeemable solely at the option of the issuer) permitted to be issued by an entity's charter and bylaws. Reference 1: http://www.xbrl.org/2003/role/disclosureRef
-Topic 946
-SubTopic 210
-Name Accounting Standards Codification
-Section S99
-Paragraph 1
-Subparagraph (SX 210.6-04(16)(a))
-Publisher FASB
-URI https://asc.fasb.org//1943274/2147479617/946-210-S99-1
Reference 2: http://fasb.org/us-gaap/role/ref/legacyRef
-Topic 210
-SubTopic 10
-Name Accounting Standards Codification
-Section S99
-Paragraph 1
-Subparagraph (SX 210.5-02(28))
-Publisher FASB
-URI https://asc.fasb.org//1943274/2147480566/210-10-S99-1
| Name: |
us-gaap_PreferredStockSharesAuthorized |
| Namespace Prefix: |
us-gaap_ |
| Data Type: |
xbrli:sharesItemType |
| Balance Type: |
na |
| Period Type: |
instant |
|
| X |
- References
+ Details
| Name: |
us-gaap_StatementOfFinancialPositionAbstract |
| Namespace Prefix: |
us-gaap_ |
| Data Type: |
xbrli:stringItemType |
| Balance Type: |
na |
| Period Type: |
duration |
|
v3.24.0.1
Condensed Consolidated Statements of Operations and Comprehensive Income (Loss) (Unaudited) - USD ($)
$ in Millions |
3 Months Ended |
Mar. 31, 2023 |
Mar. 31, 2022 |
| Revenue: |
|
|
|
| Total revenue |
|
$ 64.9
|
$ 60.3
|
| Cost of sales: |
|
|
|
| Cost of service |
[1] |
(15.0)
|
(16.8)
|
| Cost of product sales |
|
(6.7)
|
(2.5)
|
| Selling, general and administrative expenses |
|
(29.2)
|
(23.2)
|
| Acquisition and integration related transaction expenses |
|
|
(0.2)
|
| Depreciation and amortization |
|
(9.4)
|
(10.7)
|
| Net operating income |
|
4.6
|
6.9
|
| Other expense |
|
|
|
| Interest expense, net |
|
(6.3)
|
(6.5)
|
| Gain on disposal of business |
|
|
0.9
|
| Other finance income |
|
0.1
|
0.3
|
| Total other expense, net |
|
(6.2)
|
(5.3)
|
| Net (loss) income before income taxes |
|
(1.6)
|
1.6
|
| Income tax benefit (expense) |
|
0.2
|
(0.1)
|
| Net (loss) income |
|
(1.4)
|
1.5
|
| Other comprehensive income: |
|
|
|
| Foreign currency translation (loss) gain |
|
(2.9)
|
3.5
|
| Reclassification of loss on hedging instrument to comprehensive income |
|
0.2
|
0.2
|
| Actuarial gains on pension plan |
|
0.2
|
0.1
|
| Other comprehensive income |
|
(2.5)
|
3.8
|
| Comprehensive (loss) income |
|
$ (3.9)
|
$ 5.3
|
| Net income (loss) per common share – basic |
|
$ (0.05)
|
$ 0.05
|
| Net income (loss) per common share - diluted |
|
$ (0.05)
|
$ 0.05
|
| Weighted average number of shares outstanding during the period – basic |
|
27,974,182
|
28,437,052
|
| Weighted average number of shares outstanding during the period – diluted |
|
27,974,182
|
29,362,382
|
| Stock-based compensation included in: |
|
|
|
| Selling, general and administrative expenses |
|
$ (2.9)
|
$ (2.8)
|
| Service [Member] |
|
|
|
| Revenue: |
|
|
|
| Total revenue |
|
57.5
|
56.0
|
| Product Sales [Member] |
|
|
|
| Revenue: |
|
|
|
| Total revenue |
|
$ 7.4
|
$ 4.3
|
|
|
| X |
- DefinitionSelling general and administrative expenses.
| Name: |
INSE_SellingGeneralAndAdministrativeExpenses |
| Namespace Prefix: |
INSE_ |
| Data Type: |
xbrli:monetaryItemType |
| Balance Type: |
debit |
| Period Type: |
duration |
|
| X |
- DefinitionStock based compensation included in abstract.
| Name: |
INSE_StockbasedCompensationIncludedInAbstract |
| Namespace Prefix: |
INSE_ |
| Data Type: |
xbrli:stringItemType |
| Balance Type: |
na |
| Period Type: |
duration |
|
| X |
- DefinitionAmount after tax of increase (decrease) in equity from transactions and other events and circumstances from net income and other comprehensive income, attributable to parent entity. Excludes changes in equity resulting from investments by owners and distributions to owners. Reference 1: http://www.xbrl.org/2003/role/disclosureRef
-Topic 220
-SubTopic 10
-Name Accounting Standards Codification
-Section S99
-Paragraph 2
-Subparagraph (SX 210.5-03(24))
-Publisher FASB
-URI https://asc.fasb.org//1943274/2147483621/220-10-S99-2
Reference 2: http://www.xbrl.org/2003/role/disclosureRef
-Topic 942
-SubTopic 220
-Name Accounting Standards Codification
-Section S99
-Paragraph 1
-Subparagraph (SX 210.9-04(26))
-Publisher FASB
-URI https://asc.fasb.org//1943274/2147483589/942-220-S99-1
Reference 3: http://www.xbrl.org/2003/role/disclosureRef
-Topic 944
-SubTopic 220
-Name Accounting Standards Codification
-Section S99
-Paragraph 1
-Subparagraph (SX 210.7-04(22))
-Publisher FASB
-URI https://asc.fasb.org//1943274/2147483586/944-220-S99-1
Reference 4: http://www.xbrl.org/2003/role/disclosureRef
-Topic 220
-SubTopic 10
-Name Accounting Standards Codification
-Section 45
-Paragraph 1A
-Subparagraph (c)
-Publisher FASB
-URI https://asc.fasb.org//1943274/2147482790/220-10-45-1A
Reference 5: http://www.xbrl.org/2003/role/disclosureRef
-Topic 220
-SubTopic 10
-Name Accounting Standards Codification
-Section 45
-Paragraph 1B
-Subparagraph (b)
-Publisher FASB
-URI https://asc.fasb.org//1943274/2147482790/220-10-45-1B
Reference 6: http://fasb.org/us-gaap/role/ref/legacyRef
-Name Accounting Standards Codification
-Topic 220
-SubTopic 10
-Section 45
-Paragraph 5
-Publisher FASB
-URI https://asc.fasb.org//1943274/2147482790/220-10-45-5
| Name: |
us-gaap_ComprehensiveIncomeNetOfTax |
| Namespace Prefix: |
us-gaap_ |
| Data Type: |
xbrli:monetaryItemType |
| Balance Type: |
credit |
| Period Type: |
duration |
|
| X |
- DefinitionThe aggregate costs related to goods produced and sold and services rendered by an entity during the reporting period. This excludes costs incurred during the reporting period related to financial services rendered and other revenue generating activities. Reference 1: http://www.xbrl.org/2003/role/disclosureRef
-Topic 924
-SubTopic 10
-Name Accounting Standards Codification
-Section S99
-Paragraph 1
-Subparagraph (SAB Topic 11.L)
-Publisher FASB
-URI https://asc.fasb.org//1943274/2147479941/924-10-S99-1
Reference 2: http://fasb.org/us-gaap/role/ref/legacyRef
-Topic 220
-SubTopic 10
-Name Accounting Standards Codification
-Section S99
-Paragraph 2
-Subparagraph (SX 210.5-03.2(a),(d))
-Publisher FASB
-URI https://asc.fasb.org//1943274/2147483621/220-10-S99-2
| Name: |
us-gaap_CostOfGoodsAndServicesSold |
| Namespace Prefix: |
us-gaap_ |
| Data Type: |
xbrli:monetaryItemType |
| Balance Type: |
debit |
| Period Type: |
duration |
|
| X |
- References
+ Details
| Name: |
us-gaap_CostOfRevenueAbstract |
| Namespace Prefix: |
us-gaap_ |
| Data Type: |
xbrli:stringItemType |
| Balance Type: |
na |
| Period Type: |
duration |
|
| X |
- DefinitionThe current period expense charged against earnings on long-lived, physical assets not used in production, and which are not intended for resale, to allocate or recognize the cost of such assets over their useful lives; or to record the reduction in book value of an intangible asset over the benefit period of such asset; or to reflect consumption during the period of an asset that is not used in production. Reference 1: http://fasb.org/us-gaap/role/ref/legacyRef
-Name Accounting Standards Codification
-Section 45
-Paragraph 28
-Subparagraph (b)
-SubTopic 10
-Topic 230
-Publisher FASB
-URI https://asc.fasb.org//1943274/2147482740/230-10-45-28
Reference 2: http://fasb.org/us-gaap/role/ref/legacyRef
-Name Accounting Standards Codification
-Topic 360
-SubTopic 10
-Section 50
-Paragraph 1
-Subparagraph (a)
-Publisher FASB
-URI https://asc.fasb.org//1943274/2147482099/360-10-50-1
| Name: |
us-gaap_DepreciationAndAmortization |
| Namespace Prefix: |
us-gaap_ |
| Data Type: |
xbrli:monetaryItemType |
| Balance Type: |
debit |
| Period Type: |
duration |
|
| X |
- DefinitionThe amount of net income (loss) for the period per each share of common stock or unit outstanding during the reporting period. Reference 1: http://www.xbrl.org/2003/role/disclosureRef
-Topic 250
-SubTopic 10
-Name Accounting Standards Codification
-Section 50
-Paragraph 3
-Publisher FASB
-URI https://asc.fasb.org//1943274/2147483443/250-10-50-3
Reference 2: http://www.xbrl.org/2003/role/disclosureRef
-Topic 260
-SubTopic 10
-Name Accounting Standards Codification
-Section 55
-Paragraph 15
-Publisher FASB
-URI https://asc.fasb.org//1943274/2147482635/260-10-55-15
Reference 3: http://www.xbrl.org/2003/role/disclosureRef
-Topic 815
-SubTopic 40
-Name Accounting Standards Codification
-Section 65
-Paragraph 1
-Subparagraph (e)(4)
-Publisher FASB
-URI https://asc.fasb.org//1943274/2147480175/815-40-65-1
Reference 4: http://www.xbrl.org/2003/role/disclosureRef
-Topic 815
-SubTopic 40
-Name Accounting Standards Codification
-Section 65
-Paragraph 1
-Subparagraph (f)
-Publisher FASB
-URI https://asc.fasb.org//1943274/2147480175/815-40-65-1
Reference 5: http://www.xbrl.org/2003/role/disclosureRef
-Topic 250
-SubTopic 10
-Name Accounting Standards Codification
-Section 50
-Paragraph 11
-Subparagraph (a)
-Publisher FASB
-URI https://asc.fasb.org//1943274/2147483443/250-10-50-11
Reference 6: http://www.xbrl.org/2003/role/disclosureRef
-Topic 250
-SubTopic 10
-Name Accounting Standards Codification
-Section 50
-Paragraph 11
-Subparagraph (b)
-Publisher FASB
-URI https://asc.fasb.org//1943274/2147483443/250-10-50-11
Reference 7: http://www.xbrl.org/2003/role/disclosureRef
-Topic 250
-SubTopic 10
-Name Accounting Standards Codification
-Section 50
-Paragraph 7
-Subparagraph (a)
-Publisher FASB
-URI https://asc.fasb.org//1943274/2147483443/250-10-50-7
Reference 8: http://www.xbrl.org/2003/role/disclosureRef
-Topic 260
-SubTopic 10
-Name Accounting Standards Codification
-Section 45
-Paragraph 2
-Publisher FASB
-URI https://asc.fasb.org//1943274/2147482689/260-10-45-2
Reference 9: http://www.xbrl.org/2003/role/disclosureRef
-Topic 260
-SubTopic 10
-Name Accounting Standards Codification
-Section 45
-Paragraph 60B
-Subparagraph (d)
-Publisher FASB
-URI https://asc.fasb.org//1943274/2147482689/260-10-45-60B
Reference 10: http://www.xbrl.org/2003/role/disclosureRef
-Topic 250
-SubTopic 10
-Name Accounting Standards Codification
-Section 50
-Paragraph 4
-Publisher FASB
-URI https://asc.fasb.org//1943274/2147483443/250-10-50-4
Reference 11: http://www.xbrl.org/2003/role/disclosureRef
-Topic 260
-SubTopic 10
-Name Accounting Standards Codification
-Section 50
-Paragraph 1
-Subparagraph (a)
-Publisher FASB
-URI https://asc.fasb.org//1943274/2147482662/260-10-50-1
Reference 12: http://www.xbrl.org/2003/role/disclosureRef
-Topic 260
-SubTopic 10
-Name Accounting Standards Codification
-Section 45
-Paragraph 10
-Publisher FASB
-URI https://asc.fasb.org//1943274/2147482689/260-10-45-10
Reference 13: http://www.xbrl.org/2003/role/disclosureRef
-Topic 220
-SubTopic 10
-Name Accounting Standards Codification
-Section S99
-Paragraph 2
-Subparagraph (SX 210.5-03(25))
-Publisher FASB
-URI https://asc.fasb.org//1943274/2147483621/220-10-S99-2
Reference 14: http://www.xbrl.org/2003/role/disclosureRef
-Topic 942
-SubTopic 220
-Name Accounting Standards Codification
-Section S99
-Paragraph 1
-Subparagraph (SX 210.9-04(27))
-Publisher FASB
-URI https://asc.fasb.org//1943274/2147483589/942-220-S99-1
Reference 15: http://www.xbrl.org/2003/role/disclosureRef
-Topic 944
-SubTopic 220
-Name Accounting Standards Codification
-Section S99
-Paragraph 1
-Subparagraph (SX 210.7-04(23))
-Publisher FASB
-URI https://asc.fasb.org//1943274/2147483586/944-220-S99-1
Reference 16: http://www.xbrl.org/2003/role/exampleRef
-Topic 260
-SubTopic 10
-Name Accounting Standards Codification
-Section 55
-Paragraph 52
-Publisher FASB
-URI https://asc.fasb.org//1943274/2147482635/260-10-55-52
Reference 17: http://www.xbrl.org/2003/role/disclosureRef
-Topic 260
-SubTopic 10
-Name Accounting Standards Codification
-Section 45
-Paragraph 7
-Publisher FASB
-URI https://asc.fasb.org//1943274/2147482689/260-10-45-7
| Name: |
us-gaap_EarningsPerShareBasic |
| Namespace Prefix: |
us-gaap_ |
| Data Type: |
dtr-types:perShareItemType |
| Balance Type: |
na |
| Period Type: |
duration |
|
| X |
- DefinitionThe amount of net income (loss) for the period available to each share of common stock or common unit outstanding during the reporting period and to each share or unit that would have been outstanding assuming the issuance of common shares or units for all dilutive potential common shares or units outstanding during the reporting period. Reference 1: http://www.xbrl.org/2003/role/disclosureRef
-Topic 250
-SubTopic 10
-Name Accounting Standards Codification
-Section 50
-Paragraph 3
-Publisher FASB
-URI https://asc.fasb.org//1943274/2147483443/250-10-50-3
Reference 2: http://www.xbrl.org/2003/role/disclosureRef
-Topic 260
-SubTopic 10
-Name Accounting Standards Codification
-Section 55
-Paragraph 15
-Publisher FASB
-URI https://asc.fasb.org//1943274/2147482635/260-10-55-15
Reference 3: http://www.xbrl.org/2003/role/disclosureRef
-Topic 815
-SubTopic 40
-Name Accounting Standards Codification
-Section 65
-Paragraph 1
-Subparagraph (e)(4)
-Publisher FASB
-URI https://asc.fasb.org//1943274/2147480175/815-40-65-1
Reference 4: http://www.xbrl.org/2003/role/disclosureRef
-Topic 815
-SubTopic 40
-Name Accounting Standards Codification
-Section 65
-Paragraph 1
-Subparagraph (f)
-Publisher FASB
-URI https://asc.fasb.org//1943274/2147480175/815-40-65-1
Reference 5: http://www.xbrl.org/2003/role/disclosureRef
-Topic 250
-SubTopic 10
-Name Accounting Standards Codification
-Section 50
-Paragraph 11
-Subparagraph (a)
-Publisher FASB
-URI https://asc.fasb.org//1943274/2147483443/250-10-50-11
Reference 6: http://www.xbrl.org/2003/role/disclosureRef
-Topic 250
-SubTopic 10
-Name Accounting Standards Codification
-Section 50
-Paragraph 11
-Subparagraph (b)
-Publisher FASB
-URI https://asc.fasb.org//1943274/2147483443/250-10-50-11
Reference 7: http://www.xbrl.org/2003/role/disclosureRef
-Topic 250
-SubTopic 10
-Name Accounting Standards Codification
-Section 50
-Paragraph 7
-Subparagraph (a)
-Publisher FASB
-URI https://asc.fasb.org//1943274/2147483443/250-10-50-7
Reference 8: http://www.xbrl.org/2003/role/disclosureRef
-Topic 260
-SubTopic 10
-Name Accounting Standards Codification
-Section 45
-Paragraph 2
-Publisher FASB
-URI https://asc.fasb.org//1943274/2147482689/260-10-45-2
Reference 9: http://www.xbrl.org/2003/role/disclosureRef
-Topic 260
-SubTopic 10
-Name Accounting Standards Codification
-Section 45
-Paragraph 60B
-Subparagraph (d)
-Publisher FASB
-URI https://asc.fasb.org//1943274/2147482689/260-10-45-60B
Reference 10: http://www.xbrl.org/2003/role/disclosureRef
-Topic 250
-SubTopic 10
-Name Accounting Standards Codification
-Section 50
-Paragraph 4
-Publisher FASB
-URI https://asc.fasb.org//1943274/2147483443/250-10-50-4
Reference 11: http://www.xbrl.org/2003/role/disclosureRef
-Topic 260
-SubTopic 10
-Name Accounting Standards Codification
-Section 50
-Paragraph 1
-Subparagraph (a)
-Publisher FASB
-URI https://asc.fasb.org//1943274/2147482662/260-10-50-1
Reference 12: http://www.xbrl.org/2003/role/disclosureRef
-Topic 220
-SubTopic 10
-Name Accounting Standards Codification
-Section S99
-Paragraph 2
-Subparagraph (SX 210.5-03(25))
-Publisher FASB
-URI https://asc.fasb.org//1943274/2147483621/220-10-S99-2
Reference 13: http://www.xbrl.org/2003/role/disclosureRef
-Topic 942
-SubTopic 220
-Name Accounting Standards Codification
-Section S99
-Paragraph 1
-Subparagraph (SX 210.9-04(27))
-Publisher FASB
-URI https://asc.fasb.org//1943274/2147483589/942-220-S99-1
Reference 14: http://www.xbrl.org/2003/role/disclosureRef
-Topic 944
-SubTopic 220
-Name Accounting Standards Codification
-Section S99
-Paragraph 1
-Subparagraph (SX 210.7-04(23))
-Publisher FASB
-URI https://asc.fasb.org//1943274/2147483586/944-220-S99-1
Reference 15: http://www.xbrl.org/2003/role/exampleRef
-Topic 260
-SubTopic 10
-Name Accounting Standards Codification
-Section 55
-Paragraph 52
-Publisher FASB
-URI https://asc.fasb.org//1943274/2147482635/260-10-55-52
Reference 16: http://www.xbrl.org/2003/role/disclosureRef
-Topic 260
-SubTopic 10
-Name Accounting Standards Codification
-Section 45
-Paragraph 7
-Publisher FASB
-URI https://asc.fasb.org//1943274/2147482689/260-10-45-7
| Name: |
us-gaap_EarningsPerShareDiluted |
| Namespace Prefix: |
us-gaap_ |
| Data Type: |
dtr-types:perShareItemType |
| Balance Type: |
na |
| Period Type: |
duration |
|
| X |
- DefinitionAmount of gain (loss) from sale and disposal of integrated set of activities and assets capable of being conducted and managed for purpose of providing return in form of dividend, lower cost, or other economic benefit to investor, owner, member and participant. Reference 1: http://www.xbrl.org/2009/role/commonPracticeRef
-Topic 230
-SubTopic 10
-Name Accounting Standards Codification
-Section 45
-Paragraph 28
-Subparagraph (b)
-Publisher FASB
-URI https://asc.fasb.org//1943274/2147482740/230-10-45-28
Reference 2: http://www.xbrl.org/2003/role/disclosureRef
-Topic 810
-SubTopic 10
-Name Accounting Standards Codification
-Section 50
-Paragraph 1B
-Subparagraph (a)
-Publisher FASB
-URI https://asc.fasb.org//1943274/2147481203/810-10-50-1B
| Name: |
us-gaap_GainLossOnSaleOfBusiness |
| Namespace Prefix: |
us-gaap_ |
| Data Type: |
xbrli:monetaryItemType |
| Balance Type: |
credit |
| Period Type: |
duration |
|
| X |
- DefinitionThe aggregate total of expenses of managing and administering the affairs of an entity, including affiliates of the reporting entity, which are not directly or indirectly associated with the manufacture, sale or creation of a product or product line. Reference 1: http://www.xbrl.org/2003/role/disclosureRef
-Topic 946
-SubTopic 220
-Name Accounting Standards Codification
-Section S99
-Paragraph 1
-Subparagraph (SX 210.6-07(2)(a))
-Publisher FASB
-URI https://asc.fasb.org//1943274/2147483575/946-220-S99-1
Reference 2: http://fasb.org/us-gaap/role/ref/legacyRef
-Topic 220
-SubTopic 10
-Name Accounting Standards Codification
-Section S99
-Paragraph 2
-Subparagraph (SX 210.5-03.4)
-Publisher FASB
-URI https://asc.fasb.org//1943274/2147483621/220-10-S99-2
| Name: |
us-gaap_GeneralAndAdministrativeExpense |
| Namespace Prefix: |
us-gaap_ |
| Data Type: |
xbrli:monetaryItemType |
| Balance Type: |
debit |
| Period Type: |
duration |
|
| X |
- DefinitionAmount of the cost of borrowed funds accounted for as interest expense. Reference 1: http://www.xbrl.org/2003/role/exampleRef
-Topic 946
-SubTopic 830
-Name Accounting Standards Codification
-Section 55
-Paragraph 10
-Publisher FASB
-URI https://asc.fasb.org//1943274/2147480167/946-830-55-10
Reference 2: http://www.xbrl.org/2009/role/commonPracticeRef
-Topic 946
-SubTopic 220
-Name Accounting Standards Codification
-Section 45
-Paragraph 3
-Subparagraph (i)
-Publisher FASB
-URI https://asc.fasb.org//1943274/2147483581/946-220-45-3
Reference 3: http://www.xbrl.org/2003/role/disclosureRef
-Topic 946
-SubTopic 220
-Name Accounting Standards Codification
-Section S99
-Paragraph 1
-Subparagraph (SX 210.6-07(3))
-Publisher FASB
-URI https://asc.fasb.org//1943274/2147483575/946-220-S99-1
Reference 4: http://www.xbrl.org/2003/role/disclosureRef
-Topic 280
-SubTopic 10
-Name Accounting Standards Codification
-Section 50
-Paragraph 22
-Subparagraph (d)
-Publisher FASB
-URI https://asc.fasb.org//1943274/2147482810/280-10-50-22
Reference 5: http://fasb.org/us-gaap/role/ref/legacyRef
-Name Accounting Standards Codification
-Topic 835
-SubTopic 30
-Section 45
-Paragraph 3
-Publisher FASB
-URI https://asc.fasb.org//1943274/2147482925/835-30-45-3
Reference 6: http://fasb.org/us-gaap/role/ref/legacyRef
-Topic 942
-SubTopic 220
-Name Accounting Standards Codification
-Section S99
-Paragraph 1
-Subparagraph (SX 210.9-04.9)
-Publisher FASB
-URI https://asc.fasb.org//1943274/2147483589/942-220-S99-1
Reference 7: http://www.xbrl.org/2003/role/disclosureRef
-Topic 220
-SubTopic 10
-Name Accounting Standards Codification
-Section S99
-Paragraph 2
-Subparagraph (210.5-03(11))
-Publisher FASB
-URI https://asc.fasb.org//1943274/2147483621/220-10-S99-2
Reference 8: http://www.xbrl.org/2003/role/disclosureRef
-Topic 835
-SubTopic 20
-Name Accounting Standards Codification
-Section 50
-Paragraph 1
-Subparagraph (a)
-Publisher FASB
-URI https://asc.fasb.org//1943274/2147483013/835-20-50-1
| Name: |
us-gaap_InterestExpense |
| Namespace Prefix: |
us-gaap_ |
| Data Type: |
xbrli:monetaryItemType |
| Balance Type: |
debit |
| Period Type: |
duration |
|
| X |
- DefinitionThe portion of profit or loss for the period, net of income taxes, which is attributable to the parent. Reference 1: http://www.xbrl.org/2003/role/disclosureRef
-Topic 235
-SubTopic 10
-Name Accounting Standards Codification
-Section S99
-Paragraph 1
-Subparagraph (SX 210.4-08(g)(1)(ii))
-Publisher FASB
-URI https://asc.fasb.org//1943274/2147480678/235-10-S99-1
Reference 2: http://www.xbrl.org/2003/role/disclosureRef
-Topic 323
-SubTopic 10
-Name Accounting Standards Codification
-Section 50
-Paragraph 3
-Subparagraph (c)
-Publisher FASB
-URI https://asc.fasb.org//1943274/2147481687/323-10-50-3
Reference 3: http://www.xbrl.org/2003/role/disclosureRef
-Topic 825
-SubTopic 10
-Name Accounting Standards Codification
-Section 50
-Paragraph 28
-Subparagraph (f)
-Publisher FASB
-URI https://asc.fasb.org//1943274/2147482907/825-10-50-28
Reference 4: http://www.xbrl.org/2003/role/disclosureRef
-Topic 220
-SubTopic 10
-Name Accounting Standards Codification
-Section 50
-Paragraph 6
-Publisher FASB
-URI https://asc.fasb.org//1943274/2147482765/220-10-50-6
Reference 5: http://www.xbrl.org/2003/role/disclosureRef
-Topic 250
-SubTopic 10
-Name Accounting Standards Codification
-Section 50
-Paragraph 3
-Publisher FASB
-URI https://asc.fasb.org//1943274/2147483443/250-10-50-3
Reference 6: http://www.xbrl.org/2003/role/disclosureRef
-Topic 250
-SubTopic 10
-Name Accounting Standards Codification
-Section 50
-Paragraph 1
-Subparagraph (b)(2)
-Publisher FASB
-URI https://asc.fasb.org//1943274/2147483443/250-10-50-1
Reference 7: http://www.xbrl.org/2003/role/disclosureRef
-Topic 815
-SubTopic 40
-Name Accounting Standards Codification
-Section 65
-Paragraph 1
-Subparagraph (f)
-Publisher FASB
-URI https://asc.fasb.org//1943274/2147480175/815-40-65-1
Reference 8: http://www.xbrl.org/2003/role/disclosureRef
-Topic 250
-SubTopic 10
-Name Accounting Standards Codification
-Section 50
-Paragraph 8
-Publisher FASB
-URI https://asc.fasb.org//1943274/2147483443/250-10-50-8
Reference 9: http://www.xbrl.org/2003/role/disclosureRef
-Topic 250
-SubTopic 10
-Name Accounting Standards Codification
-Section 50
-Paragraph 9
-Publisher FASB
-URI https://asc.fasb.org//1943274/2147483443/250-10-50-9
Reference 10: http://www.xbrl.org/2003/role/disclosureRef
-Topic 250
-SubTopic 10
-Name Accounting Standards Codification
-Section 50
-Paragraph 11
-Subparagraph (a)
-Publisher FASB
-URI https://asc.fasb.org//1943274/2147483443/250-10-50-11
Reference 11: http://www.xbrl.org/2003/role/disclosureRef
-Topic 250
-SubTopic 10
-Name Accounting Standards Codification
-Section 50
-Paragraph 11
-Subparagraph (b)
-Publisher FASB
-URI https://asc.fasb.org//1943274/2147483443/250-10-50-11
Reference 12: http://www.xbrl.org/2003/role/disclosureRef
-Topic 250
-SubTopic 10
-Name Accounting Standards Codification
-Section 50
-Paragraph 4
-Publisher FASB
-URI https://asc.fasb.org//1943274/2147483443/250-10-50-4
Reference 13: http://www.xbrl.org/2003/role/exampleRef
-Topic 946
-SubTopic 830
-Name Accounting Standards Codification
-Section 55
-Paragraph 10
-Publisher FASB
-URI https://asc.fasb.org//1943274/2147480167/946-830-55-10
Reference 14: http://www.xbrl.org/2003/role/disclosureRef
-Topic 946
-SubTopic 220
-Name Accounting Standards Codification
-Section 45
-Paragraph 7
-Publisher FASB
-URI https://asc.fasb.org//1943274/2147483581/946-220-45-7
Reference 15: http://www.xbrl.org/2003/role/disclosureRef
-Topic 944
-SubTopic 220
-Name Accounting Standards Codification
-Section S99
-Paragraph 1
-Subparagraph (SX 210.7-04(18))
-Publisher FASB
-URI https://asc.fasb.org//1943274/2147483586/944-220-S99-1
Reference 16: http://www.xbrl.org/2003/role/disclosureRef
-Topic 280
-SubTopic 10
-Name Accounting Standards Codification
-Section 50
-Paragraph 22
-Publisher FASB
-URI https://asc.fasb.org//1943274/2147482810/280-10-50-22
Reference 17: http://www.xbrl.org/2003/role/disclosureRef
-Topic 946
-SubTopic 220
-Name Accounting Standards Codification
-Section S99
-Paragraph 1
-Subparagraph (SX 210.6-07(9))
-Publisher FASB
-URI https://asc.fasb.org//1943274/2147483575/946-220-S99-1
Reference 18: http://www.xbrl.org/2003/role/disclosureRef
-Topic 946
-SubTopic 220
-Name Accounting Standards Codification
-Section S99
-Paragraph 3
-Subparagraph (SX 210.6-09(1)(d))
-Publisher FASB
-URI https://asc.fasb.org//1943274/2147483575/946-220-S99-3
Reference 19: http://www.xbrl.org/2003/role/disclosureRef
-Topic 470
-SubTopic 10
-Name Accounting Standards Codification
-Section S99
-Paragraph 1A
-Subparagraph (SX 210.13-01(a)(4)(i))
-Publisher FASB
-URI https://asc.fasb.org//1943274/2147480097/470-10-S99-1A
Reference 20: http://www.xbrl.org/2009/role/commonPracticeRef
-Topic 470
-SubTopic 10
-Name Accounting Standards Codification
-Section S99
-Paragraph 1A
-Subparagraph (SX 210.13-01(a)(4)(ii))
-Publisher FASB
-URI https://asc.fasb.org//1943274/2147480097/470-10-S99-1A
Reference 21: http://www.xbrl.org/2003/role/disclosureRef
-Topic 470
-SubTopic 10
-Name Accounting Standards Codification
-Section S99
-Paragraph 1A
-Subparagraph (SX 210.13-01(a)(4)(iii)(A))
-Publisher FASB
-URI https://asc.fasb.org//1943274/2147480097/470-10-S99-1A
Reference 22: http://www.xbrl.org/2003/role/disclosureRef
-Topic 470
-SubTopic 10
-Name Accounting Standards Codification
-Section S99
-Paragraph 1A
-Subparagraph (SX 210.13-01(a)(4)(iv))
-Publisher FASB
-URI https://asc.fasb.org//1943274/2147480097/470-10-S99-1A
Reference 23: http://www.xbrl.org/2003/role/disclosureRef
-Topic 470
-SubTopic 10
-Name Accounting Standards Codification
-Section S99
-Paragraph 1A
-Subparagraph (SX 210.13-01(a)(5))
-Publisher FASB
-URI https://asc.fasb.org//1943274/2147480097/470-10-S99-1A
Reference 24: http://www.xbrl.org/2003/role/disclosureRef
-Topic 470
-SubTopic 10
-Name Accounting Standards Codification
-Section S99
-Paragraph 1B
-Subparagraph (SX 210.13-02(a)(4)(i))
-Publisher FASB
-URI https://asc.fasb.org//1943274/2147480097/470-10-S99-1B
Reference 25: http://www.xbrl.org/2003/role/disclosureRef
-Topic 470
-SubTopic 10
-Name Accounting Standards Codification
-Section S99
-Paragraph 1B
-Subparagraph (SX 210.13-02(a)(4)(iii)(A))
-Publisher FASB
-URI https://asc.fasb.org//1943274/2147480097/470-10-S99-1B
Reference 26: http://www.xbrl.org/2003/role/disclosureRef
-Topic 470
-SubTopic 10
-Name Accounting Standards Codification
-Section S99
-Paragraph 1B
-Subparagraph (SX 210.13-02(a)(4)(iii)(B))
-Publisher FASB
-URI https://asc.fasb.org//1943274/2147480097/470-10-S99-1B
Reference 27: http://www.xbrl.org/2003/role/disclosureRef
-Topic 470
-SubTopic 10
-Name Accounting Standards Codification
-Section S99
-Paragraph 1B
-Subparagraph (SX 210.13-02(a)(4)(iv))
-Publisher FASB
-URI https://asc.fasb.org//1943274/2147480097/470-10-S99-1B
Reference 28: http://www.xbrl.org/2003/role/disclosureRef
-Topic 470
-SubTopic 10
-Name Accounting Standards Codification
-Section S99
-Paragraph 1B
-Subparagraph (SX 210.13-02(a)(5))
-Publisher FASB
-URI https://asc.fasb.org//1943274/2147480097/470-10-S99-1B
Reference 29: http://www.xbrl.org/2003/role/disclosureRef
-Topic 280
-SubTopic 10
-Name Accounting Standards Codification
-Section 50
-Paragraph 30
-Subparagraph (b)
-Publisher FASB
-URI https://asc.fasb.org//1943274/2147482810/280-10-50-30
Reference 30: http://www.xbrl.org/2003/role/disclosureRef
-Topic 280
-SubTopic 10
-Name Accounting Standards Codification
-Section 50
-Paragraph 32
-Subparagraph (f)
-Publisher FASB
-URI https://asc.fasb.org//1943274/2147482810/280-10-50-32
Reference 31: http://www.xbrl.org/2003/role/disclosureRef
-Topic 260
-SubTopic 10
-Name Accounting Standards Codification
-Section 45
-Paragraph 60B
-Subparagraph (a)
-Publisher FASB
-URI https://asc.fasb.org//1943274/2147482689/260-10-45-60B
Reference 32: http://www.xbrl.org/2003/role/exampleRef
-Topic 280
-SubTopic 10
-Name Accounting Standards Codification
-Section 50
-Paragraph 31
-Publisher FASB
-URI https://asc.fasb.org//1943274/2147482810/280-10-50-31
Reference 33: http://www.xbrl.org/2003/role/disclosureRef
-Topic 280
-SubTopic 10
-Name Accounting Standards Codification
-Section 50
-Paragraph 32
-Subparagraph (c)
-Publisher FASB
-URI https://asc.fasb.org//1943274/2147482810/280-10-50-32
Reference 34: http://www.xbrl.org/2003/role/disclosureRef
-Topic 205
-SubTopic 20
-Name Accounting Standards Codification
-Section 50
-Paragraph 7
-Publisher FASB
-URI https://asc.fasb.org//1943274/2147483499/205-20-50-7
Reference 35: http://fasb.org/us-gaap/role/ref/legacyRef
-Topic 230
-SubTopic 10
-Name Accounting Standards Codification
-Section 45
-Paragraph 28
-Publisher FASB
-URI https://asc.fasb.org//1943274/2147482740/230-10-45-28
Reference 36: http://www.xbrl.org/2003/role/disclosureRef
-Topic 220
-SubTopic 10
-Name Accounting Standards Codification
-Section 45
-Paragraph 1A
-Subparagraph (a)
-Publisher FASB
-URI https://asc.fasb.org//1943274/2147482790/220-10-45-1A
Reference 37: http://www.xbrl.org/2003/role/disclosureRef
-Topic 220
-SubTopic 10
-Name Accounting Standards Codification
-Section 45
-Paragraph 1B
-Subparagraph (a)
-Publisher FASB
-URI https://asc.fasb.org//1943274/2147482790/220-10-45-1B
Reference 38: http://fasb.org/us-gaap/role/ref/legacyRef
-Topic 220
-SubTopic 10
-Name Accounting Standards Codification
-Section S99
-Paragraph 2
-Subparagraph (SX 210.5-03(20))
-Publisher FASB
-URI https://asc.fasb.org//1943274/2147483621/220-10-S99-2
Reference 39: http://fasb.org/us-gaap/role/ref/legacyRef
-Topic 942
-SubTopic 220
-Name Accounting Standards Codification
-Section S99
-Paragraph 1
-Subparagraph (SX 210.9-04(22))
-Publisher FASB
-URI https://asc.fasb.org//1943274/2147483589/942-220-S99-1
| Name: |
us-gaap_NetIncomeLoss |
| Namespace Prefix: |
us-gaap_ |
| Data Type: |
xbrli:monetaryItemType |
| Balance Type: |
credit |
| Period Type: |
duration |
|
| X |
- DefinitionThe aggregate amount of income or expense from ancillary business-related activities (that is to say, excluding major activities considered part of the normal operations of the business). Reference 1: http://fasb.org/us-gaap/role/ref/legacyRef
-Topic 220
-SubTopic 10
-Name Accounting Standards Codification
-Section S99
-Paragraph 2
-Subparagraph (SX 210.5-03.7)
-Publisher FASB
-URI https://asc.fasb.org//1943274/2147483621/220-10-S99-2
| Name: |
us-gaap_NonoperatingIncomeExpense |
| Namespace Prefix: |
us-gaap_ |
| Data Type: |
xbrli:monetaryItemType |
| Balance Type: |
credit |
| Period Type: |
duration |
|
| X |
- References
+ Details
| Name: |
us-gaap_NonoperatingIncomeExpenseAbstract |
| Namespace Prefix: |
us-gaap_ |
| Data Type: |
xbrli:stringItemType |
| Balance Type: |
na |
| Period Type: |
duration |
|
| X |
- DefinitionThe net result for the period of deducting operating expenses from operating revenues. Reference 1: http://www.xbrl.org/2003/role/disclosureRef
-Topic 280
-SubTopic 10
-Name Accounting Standards Codification
-Section 50
-Paragraph 22
-Publisher FASB
-URI https://asc.fasb.org//1943274/2147482810/280-10-50-22
Reference 2: http://www.xbrl.org/2003/role/disclosureRef
-Topic 280
-SubTopic 10
-Name Accounting Standards Codification
-Section 50
-Paragraph 30
-Subparagraph (b)
-Publisher FASB
-URI https://asc.fasb.org//1943274/2147482810/280-10-50-30
Reference 3: http://www.xbrl.org/2003/role/disclosureRef
-Topic 280
-SubTopic 10
-Name Accounting Standards Codification
-Section 50
-Paragraph 32
-Subparagraph (f)
-Publisher FASB
-URI https://asc.fasb.org//1943274/2147482810/280-10-50-32
Reference 4: http://www.xbrl.org/2003/role/exampleRef
-Topic 280
-SubTopic 10
-Name Accounting Standards Codification
-Section 50
-Paragraph 31
-Publisher FASB
-URI https://asc.fasb.org//1943274/2147482810/280-10-50-31
Reference 5: http://www.xbrl.org/2003/role/disclosureRef
-Topic 280
-SubTopic 10
-Name Accounting Standards Codification
-Section 50
-Paragraph 32
-Subparagraph (c)
-Publisher FASB
-URI https://asc.fasb.org//1943274/2147482810/280-10-50-32
| Name: |
us-gaap_OperatingIncomeLoss |
| Namespace Prefix: |
us-gaap_ |
| Data Type: |
xbrli:monetaryItemType |
| Balance Type: |
credit |
| Period Type: |
duration |
|
| X |
- DefinitionAmount after tax and reclassification adjustments of gain (loss) on foreign currency translation adjustments, foreign currency transactions designated and effective as economic hedges of a net investment in a foreign entity and intra-entity foreign currency transactions that are of a long-term-investment nature, attributable to parent entity. Reference 1: http://fasb.org/us-gaap/role/ref/legacyRef
-Topic 810
-SubTopic 10
-Name Accounting Standards Codification
-Section 45
-Paragraph 19
-Publisher FASB
-URI https://asc.fasb.org//1943274/2147481231/810-10-45-19
Reference 2: http://fasb.org/us-gaap/role/ref/legacyRef
-Name Accounting Standards Codification
-Section 45
-Paragraph 20
-SubTopic 10
-Topic 810
-Publisher FASB
-URI https://asc.fasb.org//1943274/2147481231/810-10-45-20
Reference 3: http://fasb.org/us-gaap/role/ref/legacyRef
-Name Accounting Standards Codification
-Section 50
-Paragraph 1A
-Subparagraph (c)(3)
-SubTopic 10
-Topic 810
-Publisher FASB
-URI https://asc.fasb.org//1943274/2147481203/810-10-50-1A
| Name: |
us-gaap_OtherComprehensiveIncomeForeignCurrencyTransactionAndTranslationAdjustmentNetOfTaxPortionAttributableToParent |
| Namespace Prefix: |
us-gaap_ |
| Data Type: |
xbrli:monetaryItemType |
| Balance Type: |
credit |
| Period Type: |
duration |
|
| X |
- DefinitionAmount of tax expense (benefit) for reclassification of gain (loss) from accumulated other comprehensive income (AOCI) for derivative instrument designated and qualifying as cash flow hedge included in assessment of hedge effectiveness. Reference 1: http://www.xbrl.org/2003/role/disclosureRef
-Topic 220
-SubTopic 10
-Name Accounting Standards Codification
-Section 45
-Paragraph 12
-Publisher FASB
-URI https://asc.fasb.org//1943274/2147482790/220-10-45-12
| Name: |
us-gaap_OtherComprehensiveIncomeLossCashFlowHedgeGainLossReclassificationTax |
| Namespace Prefix: |
us-gaap_ |
| Data Type: |
xbrli:monetaryItemType |
| Balance Type: |
credit |
| Period Type: |
duration |
|
| X |
- DefinitionAmount after tax and reclassification adjustments of other comprehensive income (loss). Reference 1: http://fasb.org/us-gaap/role/ref/legacyRef
-Name Accounting Standards Codification
-Section 50
-Paragraph 2
-SubTopic 10
-Topic 505
-Publisher FASB
-URI https://asc.fasb.org//1943274/2147481112/505-10-50-2
Reference 2: http://www.xbrl.org/2003/role/disclosureRef
-Topic 830
-SubTopic 30
-Name Accounting Standards Codification
-Section 50
-Paragraph 1
-Publisher FASB
-URI https://asc.fasb.org//1943274/2147481674/830-30-50-1
Reference 3: http://www.xbrl.org/2003/role/disclosureRef
-Topic 830
-SubTopic 30
-Name Accounting Standards Codification
-Section 45
-Paragraph 17
-Publisher FASB
-URI https://asc.fasb.org//1943274/2147481694/830-30-45-17
Reference 4: http://www.xbrl.org/2003/role/disclosureRef
-Topic 944
-SubTopic 220
-Name Accounting Standards Codification
-Section S99
-Paragraph 1
-Subparagraph (SX 210.7-04(19))
-Publisher FASB
-URI https://asc.fasb.org//1943274/2147483586/944-220-S99-1
Reference 5: http://www.xbrl.org/2009/role/commonPracticeRef
-Topic 220
-SubTopic 10
-Name Accounting Standards Codification
-Section 50
-Paragraph 4
-Publisher FASB
-URI https://asc.fasb.org//1943274/2147482765/220-10-50-4
Reference 6: http://www.xbrl.org/2009/role/commonPracticeRef
-Topic 220
-SubTopic 10
-Name Accounting Standards Codification
-Section 50
-Paragraph 5
-Publisher FASB
-URI https://asc.fasb.org//1943274/2147482765/220-10-50-5
Reference 7: http://www.xbrl.org/2003/role/disclosureRef
-Topic 830
-SubTopic 30
-Name Accounting Standards Codification
-Section 45
-Paragraph 20
-Publisher FASB
-URI https://asc.fasb.org//1943274/2147481694/830-30-45-20
Reference 8: http://www.xbrl.org/2003/role/disclosureRef
-Topic 220
-SubTopic 10
-Name Accounting Standards Codification
-Section S99
-Paragraph 2
-Subparagraph (SX 210.5-03(21))
-Publisher FASB
-URI https://asc.fasb.org//1943274/2147483621/220-10-S99-2
Reference 9: http://www.xbrl.org/2003/role/disclosureRef
-Topic 942
-SubTopic 220
-Name Accounting Standards Codification
-Section S99
-Paragraph 1
-Subparagraph (SX 210.9-04(23))
-Publisher FASB
-URI https://asc.fasb.org//1943274/2147483589/942-220-S99-1
Reference 10: http://www.xbrl.org/2003/role/disclosureRef
-Topic 220
-SubTopic 10
-Name Accounting Standards Codification
-Section 45
-Paragraph 1B
-Subparagraph (b)
-Publisher FASB
-URI https://asc.fasb.org//1943274/2147482790/220-10-45-1B
Reference 11: http://fasb.org/us-gaap/role/ref/legacyRef
-Name Accounting Standards Codification
-Section 55
-Paragraph 15
-SubTopic 10
-Topic 220
-Publisher FASB
-URI https://asc.fasb.org//1943274/2147482739/220-10-55-15
Reference 12: http://www.xbrl.org/2003/role/disclosureRef
-Topic 220
-SubTopic 10
-Name Accounting Standards Codification
-Section 45
-Paragraph 1A
-Subparagraph (b)
-Publisher FASB
-URI https://asc.fasb.org//1943274/2147482790/220-10-45-1A
| Name: |
us-gaap_OtherComprehensiveIncomeLossNetOfTax |
| Namespace Prefix: |
us-gaap_ |
| Data Type: |
xbrli:monetaryItemType |
| Balance Type: |
credit |
| Period Type: |
duration |
|
| X |
- References
+ Details
| Name: |
us-gaap_OtherComprehensiveIncomeLossNetOfTaxPortionAttributableToParentAbstract |
| Namespace Prefix: |
us-gaap_ |
| Data Type: |
xbrli:stringItemType |
| Balance Type: |
na |
| Period Type: |
duration |
|
| X |
- DefinitionAmount, after tax, of reclassification adjustment from accumulated other comprehensive (income) loss for net periodic benefit cost (credit) of defined benefit plan. Reference 1: http://fasb.org/us-gaap/role/ref/legacyRef
-Name Accounting Standards Codification
-Section 45
-Paragraph 15
-SubTopic 10
-Topic 220
-Publisher FASB
-URI https://asc.fasb.org//1943274/2147482790/220-10-45-15
Reference 2: http://fasb.org/us-gaap/role/ref/legacyRef
-Topic 220
-SubTopic 10
-Name Accounting Standards Codification
-Section 45
-Paragraph 11
-Publisher FASB
-URI https://asc.fasb.org//1943274/2147482790/220-10-45-11
Reference 3: http://fasb.org/us-gaap/role/ref/legacyRef
-Topic 715
-SubTopic 20
-Name Accounting Standards Codification
-Section 50
-Paragraph 1
-Subparagraph (i)
-Publisher FASB
-URI https://asc.fasb.org//1943274/2147480506/715-20-50-1
Reference 4: http://www.xbrl.org/2003/role/disclosureRef
-Topic 220
-SubTopic 10
-Name Accounting Standards Codification
-Section 45
-Paragraph 17A
-Publisher FASB
-URI https://asc.fasb.org//1943274/2147482790/220-10-45-17A
| Name: |
us-gaap_OtherComprehensiveIncomeLossReclassificationAdjustmentFromAOCIPensionAndOtherPostretirementBenefitPlansNetOfTax |
| Namespace Prefix: |
us-gaap_ |
| Data Type: |
xbrli:monetaryItemType |
| Balance Type: |
credit |
| Period Type: |
duration |
|
| X |
- DefinitionAmount of income (expense) related to nonoperating activities, classified as other. Reference 1: http://fasb.org/us-gaap/role/ref/legacyRef
-Topic 220
-SubTopic 10
-Name Accounting Standards Codification
-Section S99
-Paragraph 2
-Subparagraph (SX 210.5-03.9)
-Publisher FASB
-URI https://asc.fasb.org//1943274/2147483621/220-10-S99-2
| Name: |
us-gaap_OtherNonoperatingIncomeExpense |
| Namespace Prefix: |
us-gaap_ |
| Data Type: |
xbrli:monetaryItemType |
| Balance Type: |
credit |
| Period Type: |
duration |
|
| X |
- DefinitionAmount, excluding tax collected from customer, of revenue from satisfaction of performance obligation by transferring promised good or service to customer. Tax collected from customer is tax assessed by governmental authority that is both imposed on and concurrent with specific revenue-producing transaction, including, but not limited to, sales, use, value added and excise. Reference 1: http://www.xbrl.org/2003/role/disclosureRef
-Topic 924
-SubTopic 10
-Name Accounting Standards Codification
-Section S99
-Paragraph 1
-Subparagraph (SAB Topic 11.L)
-Publisher FASB
-URI https://asc.fasb.org//1943274/2147479941/924-10-S99-1
Reference 2: http://www.xbrl.org/2003/role/disclosureRef
-Topic 606
-SubTopic 10
-Name Accounting Standards Codification
-Section 50
-Paragraph 5
-Publisher FASB
-URI https://asc.fasb.org//1943274/2147479806/606-10-50-5
Reference 3: http://www.xbrl.org/2003/role/disclosureRef
-Topic 280
-SubTopic 10
-Name Accounting Standards Codification
-Section 50
-Paragraph 30
-Subparagraph (a)
-Publisher FASB
-URI https://asc.fasb.org//1943274/2147482810/280-10-50-30
Reference 4: http://www.xbrl.org/2003/role/disclosureRef
-Topic 280
-SubTopic 10
-Name Accounting Standards Codification
-Section 50
-Paragraph 42
-Publisher FASB
-URI https://asc.fasb.org//1943274/2147482810/280-10-50-42
Reference 5: http://www.xbrl.org/2003/role/disclosureRef
-Topic 280
-SubTopic 10
-Name Accounting Standards Codification
-Section 50
-Paragraph 22
-Subparagraph (b)
-Publisher FASB
-URI https://asc.fasb.org//1943274/2147482810/280-10-50-22
Reference 6: http://www.xbrl.org/2003/role/disclosureRef
-Topic 280
-SubTopic 10
-Name Accounting Standards Codification
-Section 50
-Paragraph 32
-Subparagraph (b)
-Publisher FASB
-URI https://asc.fasb.org//1943274/2147482810/280-10-50-32
Reference 7: http://www.xbrl.org/2003/role/disclosureRef
-Topic 280
-SubTopic 10
-Name Accounting Standards Codification
-Section 50
-Paragraph 40
-Publisher FASB
-URI https://asc.fasb.org//1943274/2147482810/280-10-50-40
Reference 8: http://www.xbrl.org/2003/role/disclosureRef
-Topic 280
-SubTopic 10
-Name Accounting Standards Codification
-Section 50
-Paragraph 22
-Subparagraph (a)
-Publisher FASB
-URI https://asc.fasb.org//1943274/2147482810/280-10-50-22
Reference 9: http://www.xbrl.org/2003/role/disclosureRef
-Topic 280
-SubTopic 10
-Name Accounting Standards Codification
-Section 50
-Paragraph 32
-Subparagraph (a)
-Publisher FASB
-URI https://asc.fasb.org//1943274/2147482810/280-10-50-32
Reference 10: http://www.xbrl.org/2003/role/disclosureRef
-Topic 280
-SubTopic 10
-Name Accounting Standards Codification
-Section 50
-Paragraph 41
-Subparagraph (a)
-Publisher FASB
-URI https://asc.fasb.org//1943274/2147482810/280-10-50-41
Reference 11: http://www.xbrl.org/2003/role/disclosureRef
-Topic 606
-SubTopic 10
-Name Accounting Standards Codification
-Section 50
-Paragraph 4
-Subparagraph (a)
-Publisher FASB
-URI https://asc.fasb.org//1943274/2147479806/606-10-50-4
| Name: |
us-gaap_RevenueFromContractWithCustomerExcludingAssessedTax |
| Namespace Prefix: |
us-gaap_ |
| Data Type: |
xbrli:monetaryItemType |
| Balance Type: |
credit |
| Period Type: |
duration |
|
| X |
- References
+ Details
| Name: |
us-gaap_RevenuesAbstract |
| Namespace Prefix: |
us-gaap_ |
| Data Type: |
xbrli:stringItemType |
| Balance Type: |
na |
| Period Type: |
duration |
|
| X |
- DefinitionThe average number of shares or units issued and outstanding that are used in calculating diluted EPS or earnings per unit (EPU), determined based on the timing of issuance of shares or units in the period. Reference 1: http://www.xbrl.org/2003/role/disclosureRef
-Topic 260
-SubTopic 10
-Name Accounting Standards Codification
-Section 50
-Paragraph 1
-Subparagraph (a)
-Publisher FASB
-URI https://asc.fasb.org//1943274/2147482662/260-10-50-1
Reference 2: http://www.xbrl.org/2003/role/disclosureRef
-Topic 260
-SubTopic 10
-Name Accounting Standards Codification
-Section 45
-Paragraph 16
-Publisher FASB
-URI https://asc.fasb.org//1943274/2147482689/260-10-45-16
| Name: |
us-gaap_WeightedAverageNumberOfDilutedSharesOutstanding |
| Namespace Prefix: |
us-gaap_ |
| Data Type: |
xbrli:sharesItemType |
| Balance Type: |
na |
| Period Type: |
duration |
|
| X |
- DefinitionNumber of [basic] shares or units, after adjustment for contingently issuable shares or units and other shares or units not deemed outstanding, determined by relating the portion of time within a reporting period that common shares or units have been outstanding to the total time in that period. Reference 1: http://www.xbrl.org/2003/role/disclosureRef
-Topic 260
-SubTopic 10
-Name Accounting Standards Codification
-Section 50
-Paragraph 1
-Subparagraph (a)
-Publisher FASB
-URI https://asc.fasb.org//1943274/2147482662/260-10-50-1
Reference 2: http://www.xbrl.org/2003/role/disclosureRef
-Topic 260
-SubTopic 10
-Name Accounting Standards Codification
-Section 45
-Paragraph 10
-Publisher FASB
-URI https://asc.fasb.org//1943274/2147482689/260-10-45-10
| Name: |
us-gaap_WeightedAverageNumberOfSharesOutstandingBasic |
| Namespace Prefix: |
us-gaap_ |
| Data Type: |
xbrli:sharesItemType |
| Balance Type: |
na |
| Period Type: |
duration |
|
| X |
- Details
| Name: |
srt_ProductOrServiceAxis=us-gaap_ServiceMember |
| Namespace Prefix: |
|
| Data Type: |
na |
| Balance Type: |
|
| Period Type: |
|
|
| X |
- Details
| Name: |
srt_ProductOrServiceAxis=INSE_ProductSalesMember |
| Namespace Prefix: |
|
| Data Type: |
na |
| Balance Type: |
|
| Period Type: |
|
|
v3.24.0.1
Condensed Consolidated Statements of Stockholders' Deficit (Unaudited) - USD ($)
|
Common Stock [Member] |
Additional Paid-in Capital [Member] |
AOCI Attributable to Parent [Member] |
Retained Earnings [Member] |
Total |
| Balance at Dec. 31, 2021 |
|
$ 372,300,000
|
$ 43,800,000
|
$ (524,800,000)
|
$ (108,700,000)
|
| Balance, shares at Dec. 31, 2021 |
26,433,562
|
|
|
|
|
| Foreign currency translation adjustments |
|
|
3,500,000
|
|
3,500,000
|
| Actuarial gains on pension plan |
|
|
100,000
|
|
100,000
|
| Reclassification of loss on hedging instrument to comprehensive income |
|
|
200,000
|
|
200,000
|
| Issuances under stock plans |
|
|
|
|
|
| Issuances under stock plans, shares |
447,060
|
|
|
|
|
| Stock-based compensation expense |
|
2,700,000
|
|
|
2,700,000
|
| Net income (loss) |
|
|
|
1,500,000
|
1,500,000
|
| Balance at Mar. 31, 2022 |
|
375,000,000.0
|
47,600,000
|
(523,300,000)
|
(100,700,000)
|
| Balance, shares at Mar. 31, 2022 |
26,880,622
|
|
|
|
|
| Balance at Dec. 31, 2022 |
|
378,200,000
|
50,800,000
|
(514,600,000)
|
(85,600,000)
|
| Balance, shares at Dec. 31, 2022 |
25,909,516
|
|
|
|
|
| Foreign currency translation adjustments |
|
|
(2,900,000)
|
|
(2,900,000)
|
| Actuarial gains on pension plan |
|
|
200,000
|
|
200,000
|
| Reclassification of loss on hedging instrument to comprehensive income |
|
|
200,000
|
|
200,000
|
| Issuances under stock plans |
|
|
|
|
|
| Issuances under stock plans, shares |
353,554
|
|
|
|
|
| Stock-based compensation expense |
|
3,000,000.0
|
|
|
3,000,000.0
|
| Net income (loss) |
|
|
|
(1,400,000)
|
(1,400,000)
|
| Balance at Mar. 31, 2023 |
|
$ 381,200,000
|
$ 48,300,000
|
$ (516,000,000.0)
|
$ (86,500,000)
|
| Balance, shares at Mar. 31, 2023 |
26,263,070
|
|
|
|
|
| X |
- DefinitionStock issued during period shares issuances under stock plans.
| Name: |
INSE_StockIssuedDuringPeriodSharesIssuancesUnderStockPlans |
| Namespace Prefix: |
INSE_ |
| Data Type: |
xbrli:monetaryItemType |
| Balance Type: |
credit |
| Period Type: |
duration |
|
| X |
- DefinitionStock issued during period value issuances under stock plans.
| Name: |
INSE_StockIssuedDuringPeriodValueIssuancesUnderStockPlans |
| Namespace Prefix: |
INSE_ |
| Data Type: |
xbrli:monetaryItemType |
| Balance Type: |
credit |
| Period Type: |
duration |
|
| X |
- DefinitionAmount of increase to additional paid-in capital (APIC) for recognition of cost for award under share-based payment arrangement. Reference 1: http://www.xbrl.org/2003/role/disclosureRef
-Topic 718
-SubTopic 10
-Name Accounting Standards Codification
-Section 35
-Paragraph 2
-Publisher FASB
-URI https://asc.fasb.org//1943274/2147480483/718-10-35-2
Reference 2: http://fasb.org/us-gaap/role/ref/legacyRef
-Name Accounting Standards Codification
-Topic 718
-SubTopic 20
-Section 55
-Paragraph 13
-Publisher FASB
-URI https://asc.fasb.org//1943274/2147481089/718-20-55-13
Reference 3: http://fasb.org/us-gaap/role/ref/legacyRef
-Name Accounting Standards Codification
-Topic 718
-SubTopic 20
-Section 55
-Paragraph 12
-Publisher FASB
-URI https://asc.fasb.org//1943274/2147481089/718-20-55-12
| Name: |
us-gaap_AdjustmentsToAdditionalPaidInCapitalSharebasedCompensationRequisiteServicePeriodRecognitionValue |
| Namespace Prefix: |
us-gaap_ |
| Data Type: |
xbrli:monetaryItemType |
| Balance Type: |
credit |
| Period Type: |
duration |
|
| X |
- DefinitionThe portion of profit or loss for the period, net of income taxes, which is attributable to the parent. Reference 1: http://www.xbrl.org/2003/role/disclosureRef
-Topic 235
-SubTopic 10
-Name Accounting Standards Codification
-Section S99
-Paragraph 1
-Subparagraph (SX 210.4-08(g)(1)(ii))
-Publisher FASB
-URI https://asc.fasb.org//1943274/2147480678/235-10-S99-1
Reference 2: http://www.xbrl.org/2003/role/disclosureRef
-Topic 323
-SubTopic 10
-Name Accounting Standards Codification
-Section 50
-Paragraph 3
-Subparagraph (c)
-Publisher FASB
-URI https://asc.fasb.org//1943274/2147481687/323-10-50-3
Reference 3: http://www.xbrl.org/2003/role/disclosureRef
-Topic 825
-SubTopic 10
-Name Accounting Standards Codification
-Section 50
-Paragraph 28
-Subparagraph (f)
-Publisher FASB
-URI https://asc.fasb.org//1943274/2147482907/825-10-50-28
Reference 4: http://www.xbrl.org/2003/role/disclosureRef
-Topic 220
-SubTopic 10
-Name Accounting Standards Codification
-Section 50
-Paragraph 6
-Publisher FASB
-URI https://asc.fasb.org//1943274/2147482765/220-10-50-6
Reference 5: http://www.xbrl.org/2003/role/disclosureRef
-Topic 250
-SubTopic 10
-Name Accounting Standards Codification
-Section 50
-Paragraph 3
-Publisher FASB
-URI https://asc.fasb.org//1943274/2147483443/250-10-50-3
Reference 6: http://www.xbrl.org/2003/role/disclosureRef
-Topic 250
-SubTopic 10
-Name Accounting Standards Codification
-Section 50
-Paragraph 1
-Subparagraph (b)(2)
-Publisher FASB
-URI https://asc.fasb.org//1943274/2147483443/250-10-50-1
Reference 7: http://www.xbrl.org/2003/role/disclosureRef
-Topic 815
-SubTopic 40
-Name Accounting Standards Codification
-Section 65
-Paragraph 1
-Subparagraph (f)
-Publisher FASB
-URI https://asc.fasb.org//1943274/2147480175/815-40-65-1
Reference 8: http://www.xbrl.org/2003/role/disclosureRef
-Topic 250
-SubTopic 10
-Name Accounting Standards Codification
-Section 50
-Paragraph 8
-Publisher FASB
-URI https://asc.fasb.org//1943274/2147483443/250-10-50-8
Reference 9: http://www.xbrl.org/2003/role/disclosureRef
-Topic 250
-SubTopic 10
-Name Accounting Standards Codification
-Section 50
-Paragraph 9
-Publisher FASB
-URI https://asc.fasb.org//1943274/2147483443/250-10-50-9
Reference 10: http://www.xbrl.org/2003/role/disclosureRef
-Topic 250
-SubTopic 10
-Name Accounting Standards Codification
-Section 50
-Paragraph 11
-Subparagraph (a)
-Publisher FASB
-URI https://asc.fasb.org//1943274/2147483443/250-10-50-11
Reference 11: http://www.xbrl.org/2003/role/disclosureRef
-Topic 250
-SubTopic 10
-Name Accounting Standards Codification
-Section 50
-Paragraph 11
-Subparagraph (b)
-Publisher FASB
-URI https://asc.fasb.org//1943274/2147483443/250-10-50-11
Reference 12: http://www.xbrl.org/2003/role/disclosureRef
-Topic 250
-SubTopic 10
-Name Accounting Standards Codification
-Section 50
-Paragraph 4
-Publisher FASB
-URI https://asc.fasb.org//1943274/2147483443/250-10-50-4
Reference 13: http://www.xbrl.org/2003/role/exampleRef
-Topic 946
-SubTopic 830
-Name Accounting Standards Codification
-Section 55
-Paragraph 10
-Publisher FASB
-URI https://asc.fasb.org//1943274/2147480167/946-830-55-10
Reference 14: http://www.xbrl.org/2003/role/disclosureRef
-Topic 946
-SubTopic 220
-Name Accounting Standards Codification
-Section 45
-Paragraph 7
-Publisher FASB
-URI https://asc.fasb.org//1943274/2147483581/946-220-45-7
Reference 15: http://www.xbrl.org/2003/role/disclosureRef
-Topic 944
-SubTopic 220
-Name Accounting Standards Codification
-Section S99
-Paragraph 1
-Subparagraph (SX 210.7-04(18))
-Publisher FASB
-URI https://asc.fasb.org//1943274/2147483586/944-220-S99-1
Reference 16: http://www.xbrl.org/2003/role/disclosureRef
-Topic 280
-SubTopic 10
-Name Accounting Standards Codification
-Section 50
-Paragraph 22
-Publisher FASB
-URI https://asc.fasb.org//1943274/2147482810/280-10-50-22
Reference 17: http://www.xbrl.org/2003/role/disclosureRef
-Topic 946
-SubTopic 220
-Name Accounting Standards Codification
-Section S99
-Paragraph 1
-Subparagraph (SX 210.6-07(9))
-Publisher FASB
-URI https://asc.fasb.org//1943274/2147483575/946-220-S99-1
Reference 18: http://www.xbrl.org/2003/role/disclosureRef
-Topic 946
-SubTopic 220
-Name Accounting Standards Codification
-Section S99
-Paragraph 3
-Subparagraph (SX 210.6-09(1)(d))
-Publisher FASB
-URI https://asc.fasb.org//1943274/2147483575/946-220-S99-3
Reference 19: http://www.xbrl.org/2003/role/disclosureRef
-Topic 470
-SubTopic 10
-Name Accounting Standards Codification
-Section S99
-Paragraph 1A
-Subparagraph (SX 210.13-01(a)(4)(i))
-Publisher FASB
-URI https://asc.fasb.org//1943274/2147480097/470-10-S99-1A
Reference 20: http://www.xbrl.org/2009/role/commonPracticeRef
-Topic 470
-SubTopic 10
-Name Accounting Standards Codification
-Section S99
-Paragraph 1A
-Subparagraph (SX 210.13-01(a)(4)(ii))
-Publisher FASB
-URI https://asc.fasb.org//1943274/2147480097/470-10-S99-1A
Reference 21: http://www.xbrl.org/2003/role/disclosureRef
-Topic 470
-SubTopic 10
-Name Accounting Standards Codification
-Section S99
-Paragraph 1A
-Subparagraph (SX 210.13-01(a)(4)(iii)(A))
-Publisher FASB
-URI https://asc.fasb.org//1943274/2147480097/470-10-S99-1A
Reference 22: http://www.xbrl.org/2003/role/disclosureRef
-Topic 470
-SubTopic 10
-Name Accounting Standards Codification
-Section S99
-Paragraph 1A
-Subparagraph (SX 210.13-01(a)(4)(iv))
-Publisher FASB
-URI https://asc.fasb.org//1943274/2147480097/470-10-S99-1A
Reference 23: http://www.xbrl.org/2003/role/disclosureRef
-Topic 470
-SubTopic 10
-Name Accounting Standards Codification
-Section S99
-Paragraph 1A
-Subparagraph (SX 210.13-01(a)(5))
-Publisher FASB
-URI https://asc.fasb.org//1943274/2147480097/470-10-S99-1A
Reference 24: http://www.xbrl.org/2003/role/disclosureRef
-Topic 470
-SubTopic 10
-Name Accounting Standards Codification
-Section S99
-Paragraph 1B
-Subparagraph (SX 210.13-02(a)(4)(i))
-Publisher FASB
-URI https://asc.fasb.org//1943274/2147480097/470-10-S99-1B
Reference 25: http://www.xbrl.org/2003/role/disclosureRef
-Topic 470
-SubTopic 10
-Name Accounting Standards Codification
-Section S99
-Paragraph 1B
-Subparagraph (SX 210.13-02(a)(4)(iii)(A))
-Publisher FASB
-URI https://asc.fasb.org//1943274/2147480097/470-10-S99-1B
Reference 26: http://www.xbrl.org/2003/role/disclosureRef
-Topic 470
-SubTopic 10
-Name Accounting Standards Codification
-Section S99
-Paragraph 1B
-Subparagraph (SX 210.13-02(a)(4)(iii)(B))
-Publisher FASB
-URI https://asc.fasb.org//1943274/2147480097/470-10-S99-1B
Reference 27: http://www.xbrl.org/2003/role/disclosureRef
-Topic 470
-SubTopic 10
-Name Accounting Standards Codification
-Section S99
-Paragraph 1B
-Subparagraph (SX 210.13-02(a)(4)(iv))
-Publisher FASB
-URI https://asc.fasb.org//1943274/2147480097/470-10-S99-1B
Reference 28: http://www.xbrl.org/2003/role/disclosureRef
-Topic 470
-SubTopic 10
-Name Accounting Standards Codification
-Section S99
-Paragraph 1B
-Subparagraph (SX 210.13-02(a)(5))
-Publisher FASB
-URI https://asc.fasb.org//1943274/2147480097/470-10-S99-1B
Reference 29: http://www.xbrl.org/2003/role/disclosureRef
-Topic 280
-SubTopic 10
-Name Accounting Standards Codification
-Section 50
-Paragraph 30
-Subparagraph (b)
-Publisher FASB
-URI https://asc.fasb.org//1943274/2147482810/280-10-50-30
Reference 30: http://www.xbrl.org/2003/role/disclosureRef
-Topic 280
-SubTopic 10
-Name Accounting Standards Codification
-Section 50
-Paragraph 32
-Subparagraph (f)
-Publisher FASB
-URI https://asc.fasb.org//1943274/2147482810/280-10-50-32
Reference 31: http://www.xbrl.org/2003/role/disclosureRef
-Topic 260
-SubTopic 10
-Name Accounting Standards Codification
-Section 45
-Paragraph 60B
-Subparagraph (a)
-Publisher FASB
-URI https://asc.fasb.org//1943274/2147482689/260-10-45-60B
Reference 32: http://www.xbrl.org/2003/role/exampleRef
-Topic 280
-SubTopic 10
-Name Accounting Standards Codification
-Section 50
-Paragraph 31
-Publisher FASB
-URI https://asc.fasb.org//1943274/2147482810/280-10-50-31
Reference 33: http://www.xbrl.org/2003/role/disclosureRef
-Topic 280
-SubTopic 10
-Name Accounting Standards Codification
-Section 50
-Paragraph 32
-Subparagraph (c)
-Publisher FASB
-URI https://asc.fasb.org//1943274/2147482810/280-10-50-32
Reference 34: http://www.xbrl.org/2003/role/disclosureRef
-Topic 205
-SubTopic 20
-Name Accounting Standards Codification
-Section 50
-Paragraph 7
-Publisher FASB
-URI https://asc.fasb.org//1943274/2147483499/205-20-50-7
Reference 35: http://fasb.org/us-gaap/role/ref/legacyRef
-Topic 230
-SubTopic 10
-Name Accounting Standards Codification
-Section 45
-Paragraph 28
-Publisher FASB
-URI https://asc.fasb.org//1943274/2147482740/230-10-45-28
Reference 36: http://www.xbrl.org/2003/role/disclosureRef
-Topic 220
-SubTopic 10
-Name Accounting Standards Codification
-Section 45
-Paragraph 1A
-Subparagraph (a)
-Publisher FASB
-URI https://asc.fasb.org//1943274/2147482790/220-10-45-1A
Reference 37: http://www.xbrl.org/2003/role/disclosureRef
-Topic 220
-SubTopic 10
-Name Accounting Standards Codification
-Section 45
-Paragraph 1B
-Subparagraph (a)
-Publisher FASB
-URI https://asc.fasb.org//1943274/2147482790/220-10-45-1B
Reference 38: http://fasb.org/us-gaap/role/ref/legacyRef
-Topic 220
-SubTopic 10
-Name Accounting Standards Codification
-Section S99
-Paragraph 2
-Subparagraph (SX 210.5-03(20))
-Publisher FASB
-URI https://asc.fasb.org//1943274/2147483621/220-10-S99-2
Reference 39: http://fasb.org/us-gaap/role/ref/legacyRef
-Topic 942
-SubTopic 220
-Name Accounting Standards Codification
-Section S99
-Paragraph 1
-Subparagraph (SX 210.9-04(22))
-Publisher FASB
-URI https://asc.fasb.org//1943274/2147483589/942-220-S99-1
| Name: |
us-gaap_NetIncomeLoss |
| Namespace Prefix: |
us-gaap_ |
| Data Type: |
xbrli:monetaryItemType |
| Balance Type: |
credit |
| Period Type: |
duration |
|
| X |
- DefinitionAmount, after tax, of gain (loss) for (increase) decrease in value of benefit obligation for change in actuarial assumptions and increase (decrease) in value of plan assets from experience different from that assumed of defined benefit plan, that has not been recognized in net periodic benefit (cost) credit. Reference 1: http://fasb.org/us-gaap/role/ref/legacyRef
-Topic 220
-SubTopic 10
-Name Accounting Standards Codification
-Section 45
-Paragraph 11
-Publisher FASB
-URI https://asc.fasb.org//1943274/2147482790/220-10-45-11
Reference 2: http://www.xbrl.org/2003/role/disclosureRef
-Topic 715
-SubTopic 20
-Name Accounting Standards Codification
-Section 50
-Paragraph 1
-Subparagraph (i)
-Publisher FASB
-URI https://asc.fasb.org//1943274/2147480506/715-20-50-1
Reference 3: http://fasb.org/us-gaap/role/ref/legacyRef
-Name Accounting Standards Codification
-Section 45
-Paragraph 10A
-Subparagraph (i)
-SubTopic 10
-Topic 220
-Publisher FASB
-URI https://asc.fasb.org//1943274/2147482790/220-10-45-10A
| Name: |
us-gaap_OtherComprehensiveIncomeDefinedBenefitPlansNetUnamortizedGainLossArisingDuringPeriodNetOfTax |
| Namespace Prefix: |
us-gaap_ |
| Data Type: |
xbrli:monetaryItemType |
| Balance Type: |
credit |
| Period Type: |
duration |
|
| X |
- DefinitionAmount after tax and reclassification adjustments of gain (loss) on foreign currency translation adjustments, foreign currency transactions designated and effective as economic hedges of a net investment in a foreign entity and intra-entity foreign currency transactions that are of a long-term-investment nature, attributable to parent entity. Reference 1: http://fasb.org/us-gaap/role/ref/legacyRef
-Topic 810
-SubTopic 10
-Name Accounting Standards Codification
-Section 45
-Paragraph 19
-Publisher FASB
-URI https://asc.fasb.org//1943274/2147481231/810-10-45-19
Reference 2: http://fasb.org/us-gaap/role/ref/legacyRef
-Name Accounting Standards Codification
-Section 45
-Paragraph 20
-SubTopic 10
-Topic 810
-Publisher FASB
-URI https://asc.fasb.org//1943274/2147481231/810-10-45-20
Reference 3: http://fasb.org/us-gaap/role/ref/legacyRef
-Name Accounting Standards Codification
-Section 50
-Paragraph 1A
-Subparagraph (c)(3)
-SubTopic 10
-Topic 810
-Publisher FASB
-URI https://asc.fasb.org//1943274/2147481203/810-10-50-1A
| Name: |
us-gaap_OtherComprehensiveIncomeForeignCurrencyTransactionAndTranslationAdjustmentNetOfTaxPortionAttributableToParent |
| Namespace Prefix: |
us-gaap_ |
| Data Type: |
xbrli:monetaryItemType |
| Balance Type: |
credit |
| Period Type: |
duration |
|
| X |
- DefinitionAmount, after tax and before adjustment, of unrealized holding gain (loss) on investment in debt security measured at fair value with change in fair value recognized in other comprehensive income (available-for-sale). Excludes unrealized gain (loss) on investment in debt security measured at amortized cost (held-to-maturity) from transfer to available-for-sale. Reference 1: http://www.xbrl.org/2003/role/disclosureRef
-Topic 320
-SubTopic 10
-Name Accounting Standards Codification
-Section 50
-Paragraph 9
-Subparagraph (d)
-Publisher FASB
-URI https://asc.fasb.org//1943274/2147481800/320-10-50-9
Reference 2: http://www.xbrl.org/2003/role/disclosureRef
-Topic 220
-SubTopic 10
-Name Accounting Standards Codification
-Section 45
-Paragraph 10A
-Subparagraph (e)
-Publisher FASB
-URI https://asc.fasb.org//1943274/2147482790/220-10-45-10A
Reference 3: http://www.xbrl.org/2003/role/disclosureRef
-Topic 220
-SubTopic 10
-Name Accounting Standards Codification
-Section 45
-Paragraph 11
-Publisher FASB
-URI https://asc.fasb.org//1943274/2147482790/220-10-45-11
| Name: |
us-gaap_OtherComprehensiveIncomeUnrealizedHoldingGainLossOnSecuritiesArisingDuringPeriodNetOfTax |
| Namespace Prefix: |
us-gaap_ |
| Data Type: |
xbrli:monetaryItemType |
| Balance Type: |
credit |
| Period Type: |
duration |
|
| X |
- DefinitionNumber of shares issued which are neither cancelled nor held in the treasury.
| Name: |
us-gaap_SharesOutstanding |
| Namespace Prefix: |
us-gaap_ |
| Data Type: |
xbrli:sharesItemType |
| Balance Type: |
na |
| Period Type: |
instant |
|
| X |
- DefinitionAmount of equity (deficit) attributable to parent. Excludes temporary equity and equity attributable to noncontrolling interest. Reference 1: http://www.xbrl.org/2003/role/exampleRef
-Topic 852
-SubTopic 10
-Name Accounting Standards Codification
-Section 55
-Paragraph 10
-Publisher FASB
-URI https://asc.fasb.org//1943274/2147481372/852-10-55-10
Reference 2: http://www.xbrl.org/2003/role/exampleRef
-Topic 946
-SubTopic 830
-Name Accounting Standards Codification
-Section 55
-Paragraph 12
-Publisher FASB
-URI https://asc.fasb.org//1943274/2147480167/946-830-55-12
Reference 3: http://www.xbrl.org/2003/role/disclosureRef
-Topic 946
-SubTopic 210
-Name Accounting Standards Codification
-Section S99
-Paragraph 1
-Subparagraph (SX 210.6-04(19))
-Publisher FASB
-URI https://asc.fasb.org//1943274/2147479617/946-210-S99-1
Reference 4: http://www.xbrl.org/2003/role/disclosureRef
-Topic 946
-SubTopic 210
-Name Accounting Standards Codification
-Section S99
-Paragraph 2
-Subparagraph (SX 210.6-05(4))
-Publisher FASB
-URI https://asc.fasb.org//1943274/2147479617/946-210-S99-2
Reference 5: http://www.xbrl.org/2009/role/commonPracticeRef
-Topic 946
-SubTopic 220
-Name Accounting Standards Codification
-Section S99
-Paragraph 3
-Subparagraph (SX 210.6-09(4)(b))
-Publisher FASB
-URI https://asc.fasb.org//1943274/2147483575/946-220-S99-3
Reference 6: http://www.xbrl.org/2003/role/disclosureRef
-Topic 946
-SubTopic 220
-Name Accounting Standards Codification
-Section S99
-Paragraph 3
-Subparagraph (SX 210.6-09(6))
-Publisher FASB
-URI https://asc.fasb.org//1943274/2147483575/946-220-S99-3
Reference 7: http://www.xbrl.org/2003/role/disclosureRef
-Topic 946
-SubTopic 220
-Name Accounting Standards Codification
-Section S99
-Paragraph 3
-Subparagraph (SX 210.6-09(7))
-Publisher FASB
-URI https://asc.fasb.org//1943274/2147483575/946-220-S99-3
Reference 8: http://www.xbrl.org/2009/role/commonPracticeRef
-Topic 235
-SubTopic 10
-Name Accounting Standards Codification
-Section S99
-Paragraph 1
-Subparagraph (SX 210.4-08(g)(1)(ii))
-Publisher FASB
-URI https://asc.fasb.org//1943274/2147480678/235-10-S99-1
Reference 9: http://www.xbrl.org/2009/role/commonPracticeRef
-Topic 323
-SubTopic 10
-Name Accounting Standards Codification
-Section 50
-Paragraph 3
-Subparagraph (c)
-Publisher FASB
-URI https://asc.fasb.org//1943274/2147481687/323-10-50-3
Reference 10: http://www.xbrl.org/2009/role/commonPracticeRef
-Topic 825
-SubTopic 10
-Name Accounting Standards Codification
-Section 50
-Paragraph 28
-Subparagraph (f)
-Publisher FASB
-URI https://asc.fasb.org//1943274/2147482907/825-10-50-28
Reference 11: http://fasb.org/us-gaap/role/ref/legacyRef
-Topic 210
-SubTopic 10
-Name Accounting Standards Codification
-Section S99
-Paragraph 1
-Subparagraph (SX 210.5-02(29))
-Publisher FASB
-URI https://asc.fasb.org//1943274/2147480566/210-10-S99-1
Reference 12: http://fasb.org/us-gaap/role/ref/legacyRef
-Topic 210
-SubTopic 10
-Name Accounting Standards Codification
-Section S99
-Paragraph 1
-Subparagraph (SX 210.5-02(31))
-Publisher FASB
-URI https://asc.fasb.org//1943274/2147480566/210-10-S99-1
Reference 13: http://fasb.org/us-gaap/role/ref/legacyRef
-Topic 210
-SubTopic 10
-Name Accounting Standards Codification
-Section S99
-Paragraph 1
-Subparagraph (SX 210.5-02(30))
-Publisher FASB
-URI https://asc.fasb.org//1943274/2147480566/210-10-S99-1
Reference 14: http://fasb.org/us-gaap/role/ref/legacyRef
-Topic 310
-SubTopic 10
-Name Accounting Standards Codification
-Section S99
-Paragraph 2
-Subparagraph (SAB Topic 4.E)
-Publisher FASB
-URI https://asc.fasb.org//1943274/2147480418/310-10-S99-2
| Name: |
us-gaap_StockholdersEquity |
| Namespace Prefix: |
us-gaap_ |
| Data Type: |
xbrli:monetaryItemType |
| Balance Type: |
credit |
| Period Type: |
instant |
|
v3.24.0.1
| X |
- DefinitionCash paid during the period for operating leases.
| Name: |
INSE_CashPaidDuringPeriodForOperatingLeases |
| Namespace Prefix: |
INSE_ |
| Data Type: |
xbrli:monetaryItemType |
| Balance Type: |
credit |
| Period Type: |
duration |
|
| X |
- DefinitionIncrease decrease in deferred revenues and customer prepayment.
| Name: |
INSE_IncreaseDecreaseInDeferredRevenuesAndCustomerPrepayment |
| Namespace Prefix: |
INSE_ |
| Data Type: |
xbrli:monetaryItemType |
| Balance Type: |
debit |
| Period Type: |
duration |
|
| X |
- DefinitionNon-cash interest expense relating to senior debt.
| Name: |
INSE_NonCashInterestExpenseRelatingToSeniorDebt |
| Namespace Prefix: |
INSE_ |
| Data Type: |
xbrli:monetaryItemType |
| Balance Type: |
debit |
| Period Type: |
duration |
|
| X |
- DefinitionProceeds from sale of other assets.
| Name: |
INSE_ProceedsFromSaleOfOtherAssets |
| Namespace Prefix: |
INSE_ |
| Data Type: |
xbrli:monetaryItemType |
| Balance Type: |
debit |
| Period Type: |
duration |
|
| X |
- DefinitionProperty and equipment transferred to inventory.
| Name: |
INSE_PropertyAndEquipmentTransferredToInventory |
| Namespace Prefix: |
INSE_ |
| Data Type: |
xbrli:monetaryItemType |
| Balance Type: |
debit |
| Period Type: |
duration |
|
| X |
- DefinitionReclassification of gain on hedging instrument to comprehensive income.
| Name: |
INSE_ReclassificationOfGainOnHedgingInstrumentToComprehensiveIncome |
| Namespace Prefix: |
INSE_ |
| Data Type: |
xbrli:monetaryItemType |
| Balance Type: |
debit |
| Period Type: |
duration |
|
| X |
- References
+ Details
| Name: |
us-gaap_AdjustmentsToReconcileNetIncomeLossToCashProvidedByUsedInOperatingActivitiesAbstract |
| Namespace Prefix: |
us-gaap_ |
| Data Type: |
xbrli:stringItemType |
| Balance Type: |
na |
| Period Type: |
duration |
|
| X |
- DefinitionAmount of cash and cash equivalents, and cash and cash equivalents restricted to withdrawal or usage; including, but not limited to, disposal group and discontinued operations. Cash includes, but is not limited to, currency on hand, demand deposits with banks or financial institutions, and other accounts with general characteristics of demand deposits. Cash equivalents include, but are not limited to, short-term, highly liquid investments that are both readily convertible to known amounts of cash and so near their maturity that they present insignificant risk of changes in value because of changes in interest rates. Reference 1: http://www.xbrl.org/2003/role/disclosureRef
-Topic 230
-SubTopic 10
-Name Accounting Standards Codification
-Section 50
-Paragraph 8
-Publisher FASB
-URI https://asc.fasb.org//1943274/2147482913/230-10-50-8
Reference 2: http://fasb.org/us-gaap/role/ref/legacyRef
-Topic 230
-SubTopic 10
-Name Accounting Standards Codification
-Section 45
-Paragraph 24
-Publisher FASB
-URI https://asc.fasb.org//1943274/2147482740/230-10-45-24
Reference 3: http://fasb.org/us-gaap/role/ref/legacyRef
-Name Accounting Standards Codification
-Topic 230
-SubTopic 10
-Section 45
-Paragraph 4
-Publisher FASB
-URI https://asc.fasb.org//1943274/2147482740/230-10-45-4
| Name: |
us-gaap_CashCashEquivalentsRestrictedCashAndRestrictedCashEquivalentsIncludingDisposalGroupAndDiscontinuedOperations |
| Namespace Prefix: |
us-gaap_ |
| Data Type: |
xbrli:monetaryItemType |
| Balance Type: |
debit |
| Period Type: |
instant |
|
| X |
- DefinitionAmount of increase (decrease) in cash, cash equivalents, and cash and cash equivalents restricted to withdrawal or usage; including effect from exchange rate change. Cash includes, but is not limited to, currency on hand, demand deposits with banks or financial institutions, and other accounts with general characteristics of demand deposits. Cash equivalents include, but are not limited to, short-term, highly liquid investments that are both readily convertible to known amounts of cash and so near their maturity that they present insignificant risk of changes in value because of changes in interest rates. Reference 1: http://fasb.org/us-gaap/role/ref/legacyRef
-Topic 230
-SubTopic 10
-Name Accounting Standards Codification
-Section 45
-Paragraph 24
-Publisher FASB
-URI https://asc.fasb.org//1943274/2147482740/230-10-45-24
Reference 2: http://fasb.org/us-gaap/role/ref/legacyRef
-Name Accounting Standards Codification
-Section 45
-Paragraph 1
-SubTopic 230
-Topic 830
-Publisher FASB
-URI https://asc.fasb.org//1943274/2147481877/830-230-45-1
| Name: |
us-gaap_CashCashEquivalentsRestrictedCashAndRestrictedCashEquivalentsPeriodIncreaseDecreaseIncludingExchangeRateEffect |
| Namespace Prefix: |
us-gaap_ |
| Data Type: |
xbrli:monetaryItemType |
| Balance Type: |
debit |
| Period Type: |
duration |
|
| X |
- DefinitionThe current period expense charged against earnings on long-lived, physical assets not used in production, and which are not intended for resale, to allocate or recognize the cost of such assets over their useful lives; or to record the reduction in book value of an intangible asset over the benefit period of such asset; or to reflect consumption during the period of an asset that is not used in production. Reference 1: http://fasb.org/us-gaap/role/ref/legacyRef
-Name Accounting Standards Codification
-Section 45
-Paragraph 28
-Subparagraph (b)
-SubTopic 10
-Topic 230
-Publisher FASB
-URI https://asc.fasb.org//1943274/2147482740/230-10-45-28
Reference 2: http://fasb.org/us-gaap/role/ref/legacyRef
-Name Accounting Standards Codification
-Topic 360
-SubTopic 10
-Section 50
-Paragraph 1
-Subparagraph (a)
-Publisher FASB
-URI https://asc.fasb.org//1943274/2147482099/360-10-50-1
| Name: |
us-gaap_DepreciationAndAmortization |
| Namespace Prefix: |
us-gaap_ |
| Data Type: |
xbrli:monetaryItemType |
| Balance Type: |
debit |
| Period Type: |
duration |
|
| X |
- DefinitionAmount of increase (decrease) from effect of exchange rate changes on cash and cash equivalents, and cash and cash equivalents restricted to withdrawal or usage; held in foreign currencies; including, but not limited to, disposal group and discontinued operations. Cash includes, but is not limited to, currency on hand, demand deposits with banks or financial institutions, and other accounts with general characteristics of demand deposits. Cash equivalents include, but are not limited to, short-term, highly liquid investments that are both readily convertible to known amounts of cash and so near their maturity that they present insignificant risk of changes in value because of changes in interest rates. Reference 1: http://www.xbrl.org/2009/role/commonPracticeRef
-Topic 830
-SubTopic 230
-Name Accounting Standards Codification
-Section 45
-Paragraph 1
-Publisher FASB
-URI https://asc.fasb.org//1943274/2147481877/830-230-45-1
| Name: |
us-gaap_EffectOfExchangeRateOnCashCashEquivalentsRestrictedCashAndRestrictedCashEquivalentsIncludingDisposalGroupAndDiscontinuedOperations |
| Namespace Prefix: |
us-gaap_ |
| Data Type: |
xbrli:monetaryItemType |
| Balance Type: |
debit |
| Period Type: |
duration |
|
| X |
- DefinitionAmount of cash outflow for principal payment on finance lease. Reference 1: http://www.xbrl.org/2003/role/disclosureRef
-Topic 842
-SubTopic 20
-Name Accounting Standards Codification
-Section 50
-Paragraph 4
-Subparagraph (g)(1)
-Publisher FASB
-URI https://asc.fasb.org//1943274/2147478964/842-20-50-4
Reference 2: http://www.xbrl.org/2003/role/disclosureRef
-Topic 842
-SubTopic 20
-Name Accounting Standards Codification
-Section 45
-Paragraph 5
-Subparagraph (a)
-Publisher FASB
-URI https://asc.fasb.org//1943274/2147479041/842-20-45-5
| Name: |
us-gaap_FinanceLeasePrincipalPayments |
| Namespace Prefix: |
us-gaap_ |
| Data Type: |
xbrli:monetaryItemType |
| Balance Type: |
credit |
| Period Type: |
duration |
|
| X |
- DefinitionAmount of gain (loss) on sale or disposal of assets, including but not limited to property plant and equipment, intangible assets and equity in securities of subsidiaries or equity method investee. Reference 1: http://www.xbrl.org/2009/role/commonPracticeRef
-Topic 230
-SubTopic 10
-Name Accounting Standards Codification
-Section 45
-Paragraph 28
-Subparagraph (b)
-Publisher FASB
-URI https://asc.fasb.org//1943274/2147482740/230-10-45-28
| Name: |
us-gaap_GainLossOnDispositionOfAssets1 |
| Namespace Prefix: |
us-gaap_ |
| Data Type: |
xbrli:monetaryItemType |
| Balance Type: |
credit |
| Period Type: |
duration |
|
| X |
- DefinitionThe increase (decrease) during the reporting period in the aggregate amount of liabilities incurred (and for which invoices have typically been received) and payable to vendors for goods and services received that are used in an entity's business. Reference 1: http://fasb.org/us-gaap/role/ref/legacyRef
-Name Accounting Standards Codification
-Section 45
-Paragraph 28
-Subparagraph (a)
-SubTopic 10
-Topic 230
-Publisher FASB
-URI https://asc.fasb.org//1943274/2147482740/230-10-45-28
| Name: |
us-gaap_IncreaseDecreaseInAccountsPayable |
| Namespace Prefix: |
us-gaap_ |
| Data Type: |
xbrli:monetaryItemType |
| Balance Type: |
debit |
| Period Type: |
duration |
|
| X |
- DefinitionThe increase (decrease) during the reporting period in amount due within one year (or one business cycle) from customers for the credit sale of goods and services. Reference 1: http://fasb.org/us-gaap/role/ref/legacyRef
-Name Accounting Standards Codification
-Section 45
-Paragraph 28
-Subparagraph (a)
-SubTopic 10
-Topic 230
-Publisher FASB
-URI https://asc.fasb.org//1943274/2147482740/230-10-45-28
| Name: |
us-gaap_IncreaseDecreaseInAccountsReceivable |
| Namespace Prefix: |
us-gaap_ |
| Data Type: |
xbrli:monetaryItemType |
| Balance Type: |
credit |
| Period Type: |
duration |
|
| X |
- DefinitionThe increase (decrease) during the reporting period in the aggregate amount of expenses incurred but not yet paid. Reference 1: http://fasb.org/us-gaap/role/ref/legacyRef
-Name Accounting Standards Codification
-Section 45
-Paragraph 28
-Subparagraph (a)
-SubTopic 10
-Topic 230
-Publisher FASB
-URI https://asc.fasb.org//1943274/2147482740/230-10-45-28
| Name: |
us-gaap_IncreaseDecreaseInAccruedLiabilities |
| Namespace Prefix: |
us-gaap_ |
| Data Type: |
xbrli:monetaryItemType |
| Balance Type: |
debit |
| Period Type: |
duration |
|
| X |
- DefinitionThe increase (decrease) during the reporting period of all taxes owed but not paid, including income, property and other taxes. Reference 1: http://www.xbrl.org/2009/role/commonPracticeRef
-Topic 230
-SubTopic 10
-Name Accounting Standards Codification
-Section 45
-Paragraph 28
-Subparagraph (a)
-Publisher FASB
-URI https://asc.fasb.org//1943274/2147482740/230-10-45-28
| Name: |
us-gaap_IncreaseDecreaseInAccruedTaxesPayable |
| Namespace Prefix: |
us-gaap_ |
| Data Type: |
xbrli:monetaryItemType |
| Balance Type: |
debit |
| Period Type: |
duration |
|
| X |
- DefinitionThe increase (decrease) during the reporting period in the aggregate value of all inventory held by the reporting entity, associated with underlying transactions that are classified as operating activities. Reference 1: http://fasb.org/us-gaap/role/ref/legacyRef
-Name Accounting Standards Codification
-Section 45
-Paragraph 28
-Subparagraph (a)
-SubTopic 10
-Topic 230
-Publisher FASB
-URI https://asc.fasb.org//1943274/2147482740/230-10-45-28
| Name: |
us-gaap_IncreaseDecreaseInInventories |
| Namespace Prefix: |
us-gaap_ |
| Data Type: |
xbrli:monetaryItemType |
| Balance Type: |
credit |
| Period Type: |
duration |
|
| X |
- References
+ Details
| Name: |
us-gaap_IncreaseDecreaseInOperatingCapitalAbstract |
| Namespace Prefix: |
us-gaap_ |
| Data Type: |
xbrli:stringItemType |
| Balance Type: |
na |
| Period Type: |
duration |
|
| X |
- DefinitionAmount of increase (decrease) in current liabilities classified as other. Reference 1: http://www.xbrl.org/2009/role/commonPracticeRef
-Topic 230
-SubTopic 10
-Name Accounting Standards Codification
-Section 45
-Paragraph 28
-Subparagraph (a)
-Publisher FASB
-URI https://asc.fasb.org//1943274/2147482740/230-10-45-28
| Name: |
us-gaap_IncreaseDecreaseInOtherCurrentLiabilities |
| Namespace Prefix: |
us-gaap_ |
| Data Type: |
xbrli:monetaryItemType |
| Balance Type: |
debit |
| Period Type: |
duration |
|
| X |
- DefinitionAmount of increase (decrease) in noncurrent operating liabilities classified as other.
| Name: |
us-gaap_IncreaseDecreaseInOtherNoncurrentLiabilities |
| Namespace Prefix: |
us-gaap_ |
| Data Type: |
xbrli:monetaryItemType |
| Balance Type: |
debit |
| Period Type: |
duration |
|
| X |
- DefinitionAmount of increase (decrease) in prepaid expenses, and assets classified as other. Reference 1: http://fasb.org/us-gaap/role/ref/legacyRef
-Name Accounting Standards Codification
-Section 45
-Paragraph 28
-Subparagraph (a)
-SubTopic 10
-Topic 230
-Publisher FASB
-URI https://asc.fasb.org//1943274/2147482740/230-10-45-28
| Name: |
us-gaap_IncreaseDecreaseInPrepaidDeferredExpenseAndOtherAssets |
| Namespace Prefix: |
us-gaap_ |
| Data Type: |
xbrli:monetaryItemType |
| Balance Type: |
credit |
| Period Type: |
duration |
|
| X |
- DefinitionAmount of cash paid for interest, excluding capitalized interest, classified as operating activity. Includes, but is not limited to, payment to settle zero-coupon bond for accreted interest of debt discount and debt instrument with insignificant coupon interest rate in relation to effective interest rate of borrowing attributable to accreted interest of debt discount. Reference 1: http://www.xbrl.org/2003/role/disclosureRef
-Topic 230
-SubTopic 10
-Name Accounting Standards Codification
-Section 45
-Paragraph 17
-Subparagraph (d)
-Publisher FASB
-URI https://asc.fasb.org//1943274/2147482740/230-10-45-17
Reference 2: http://www.xbrl.org/2003/role/disclosureRef
-Topic 230
-SubTopic 10
-Name Accounting Standards Codification
-Section 45
-Paragraph 25
-Subparagraph (e)
-Publisher FASB
-URI https://asc.fasb.org//1943274/2147482740/230-10-45-25
Reference 3: http://www.xbrl.org/2003/role/disclosureRef
-Topic 230
-SubTopic 10
-Name Accounting Standards Codification
-Section 50
-Paragraph 2
-Publisher FASB
-URI https://asc.fasb.org//1943274/2147482913/230-10-50-2
| Name: |
us-gaap_InterestPaidNet |
| Namespace Prefix: |
us-gaap_ |
| Data Type: |
xbrli:monetaryItemType |
| Balance Type: |
credit |
| Period Type: |
duration |
|
| X |
- DefinitionAmount of cash inflow (outflow) from financing activities, including discontinued operations. Financing activity cash flows include obtaining resources from owners and providing them with a return on, and a return of, their investment; borrowing money and repaying amounts borrowed, or settling the obligation; and obtaining and paying for other resources obtained from creditors on long-term credit. Reference 1: http://www.xbrl.org/2003/role/disclosureRef
-Topic 230
-SubTopic 10
-Name Accounting Standards Codification
-Section 45
-Paragraph 24
-Publisher FASB
-URI https://asc.fasb.org//1943274/2147482740/230-10-45-24
| Name: |
us-gaap_NetCashProvidedByUsedInFinancingActivities |
| Namespace Prefix: |
us-gaap_ |
| Data Type: |
xbrli:monetaryItemType |
| Balance Type: |
debit |
| Period Type: |
duration |
|
| X |
- References
+ Details
| Name: |
us-gaap_NetCashProvidedByUsedInFinancingActivitiesAbstract |
| Namespace Prefix: |
us-gaap_ |
| Data Type: |
xbrli:stringItemType |
| Balance Type: |
na |
| Period Type: |
duration |
|
| X |
- DefinitionAmount of cash inflow (outflow) from investing activities, including discontinued operations. Investing activity cash flows include making and collecting loans and acquiring and disposing of debt or equity instruments and property, plant, and equipment and other productive assets. Reference 1: http://www.xbrl.org/2003/role/disclosureRef
-Topic 230
-SubTopic 10
-Name Accounting Standards Codification
-Section 45
-Paragraph 24
-Publisher FASB
-URI https://asc.fasb.org//1943274/2147482740/230-10-45-24
| Name: |
us-gaap_NetCashProvidedByUsedInInvestingActivities |
| Namespace Prefix: |
us-gaap_ |
| Data Type: |
xbrli:monetaryItemType |
| Balance Type: |
debit |
| Period Type: |
duration |
|
| X |
- References
+ Details
| Name: |
us-gaap_NetCashProvidedByUsedInInvestingActivitiesAbstract |
| Namespace Prefix: |
us-gaap_ |
| Data Type: |
xbrli:stringItemType |
| Balance Type: |
na |
| Period Type: |
duration |
|
| X |
- DefinitionAmount of cash inflow (outflow) from operating activities, including discontinued operations. Operating activity cash flows include transactions, adjustments, and changes in value not defined as investing or financing activities. Reference 1: http://fasb.org/us-gaap/role/ref/legacyRef
-Topic 230
-SubTopic 10
-Name Accounting Standards Codification
-Section 45
-Paragraph 28
-Publisher FASB
-URI https://asc.fasb.org//1943274/2147482740/230-10-45-28
Reference 2: http://fasb.org/us-gaap/role/ref/legacyRef
-Topic 230
-SubTopic 10
-Name Accounting Standards Codification
-Section 45
-Paragraph 24
-Publisher FASB
-URI https://asc.fasb.org//1943274/2147482740/230-10-45-24
Reference 3: http://fasb.org/us-gaap/role/ref/legacyRef
-Topic 230
-SubTopic 10
-Name Accounting Standards Codification
-Section 45
-Paragraph 25
-Publisher FASB
-URI https://asc.fasb.org//1943274/2147482740/230-10-45-25
| Name: |
us-gaap_NetCashProvidedByUsedInOperatingActivities |
| Namespace Prefix: |
us-gaap_ |
| Data Type: |
xbrli:monetaryItemType |
| Balance Type: |
na |
| Period Type: |
duration |
|
| X |
- References
+ Details
| Name: |
us-gaap_NetCashProvidedByUsedInOperatingActivitiesAbstract |
| Namespace Prefix: |
us-gaap_ |
| Data Type: |
xbrli:stringItemType |
| Balance Type: |
na |
| Period Type: |
duration |
|
| X |
- DefinitionThe portion of profit or loss for the period, net of income taxes, which is attributable to the parent. Reference 1: http://www.xbrl.org/2003/role/disclosureRef
-Topic 235
-SubTopic 10
-Name Accounting Standards Codification
-Section S99
-Paragraph 1
-Subparagraph (SX 210.4-08(g)(1)(ii))
-Publisher FASB
-URI https://asc.fasb.org//1943274/2147480678/235-10-S99-1
Reference 2: http://www.xbrl.org/2003/role/disclosureRef
-Topic 323
-SubTopic 10
-Name Accounting Standards Codification
-Section 50
-Paragraph 3
-Subparagraph (c)
-Publisher FASB
-URI https://asc.fasb.org//1943274/2147481687/323-10-50-3
Reference 3: http://www.xbrl.org/2003/role/disclosureRef
-Topic 825
-SubTopic 10
-Name Accounting Standards Codification
-Section 50
-Paragraph 28
-Subparagraph (f)
-Publisher FASB
-URI https://asc.fasb.org//1943274/2147482907/825-10-50-28
Reference 4: http://www.xbrl.org/2003/role/disclosureRef
-Topic 220
-SubTopic 10
-Name Accounting Standards Codification
-Section 50
-Paragraph 6
-Publisher FASB
-URI https://asc.fasb.org//1943274/2147482765/220-10-50-6
Reference 5: http://www.xbrl.org/2003/role/disclosureRef
-Topic 250
-SubTopic 10
-Name Accounting Standards Codification
-Section 50
-Paragraph 3
-Publisher FASB
-URI https://asc.fasb.org//1943274/2147483443/250-10-50-3
Reference 6: http://www.xbrl.org/2003/role/disclosureRef
-Topic 250
-SubTopic 10
-Name Accounting Standards Codification
-Section 50
-Paragraph 1
-Subparagraph (b)(2)
-Publisher FASB
-URI https://asc.fasb.org//1943274/2147483443/250-10-50-1
Reference 7: http://www.xbrl.org/2003/role/disclosureRef
-Topic 815
-SubTopic 40
-Name Accounting Standards Codification
-Section 65
-Paragraph 1
-Subparagraph (f)
-Publisher FASB
-URI https://asc.fasb.org//1943274/2147480175/815-40-65-1
Reference 8: http://www.xbrl.org/2003/role/disclosureRef
-Topic 250
-SubTopic 10
-Name Accounting Standards Codification
-Section 50
-Paragraph 8
-Publisher FASB
-URI https://asc.fasb.org//1943274/2147483443/250-10-50-8
Reference 9: http://www.xbrl.org/2003/role/disclosureRef
-Topic 250
-SubTopic 10
-Name Accounting Standards Codification
-Section 50
-Paragraph 9
-Publisher FASB
-URI https://asc.fasb.org//1943274/2147483443/250-10-50-9
Reference 10: http://www.xbrl.org/2003/role/disclosureRef
-Topic 250
-SubTopic 10
-Name Accounting Standards Codification
-Section 50
-Paragraph 11
-Subparagraph (a)
-Publisher FASB
-URI https://asc.fasb.org//1943274/2147483443/250-10-50-11
Reference 11: http://www.xbrl.org/2003/role/disclosureRef
-Topic 250
-SubTopic 10
-Name Accounting Standards Codification
-Section 50
-Paragraph 11
-Subparagraph (b)
-Publisher FASB
-URI https://asc.fasb.org//1943274/2147483443/250-10-50-11
Reference 12: http://www.xbrl.org/2003/role/disclosureRef
-Topic 250
-SubTopic 10
-Name Accounting Standards Codification
-Section 50
-Paragraph 4
-Publisher FASB
-URI https://asc.fasb.org//1943274/2147483443/250-10-50-4
Reference 13: http://www.xbrl.org/2003/role/exampleRef
-Topic 946
-SubTopic 830
-Name Accounting Standards Codification
-Section 55
-Paragraph 10
-Publisher FASB
-URI https://asc.fasb.org//1943274/2147480167/946-830-55-10
Reference 14: http://www.xbrl.org/2003/role/disclosureRef
-Topic 946
-SubTopic 220
-Name Accounting Standards Codification
-Section 45
-Paragraph 7
-Publisher FASB
-URI https://asc.fasb.org//1943274/2147483581/946-220-45-7
Reference 15: http://www.xbrl.org/2003/role/disclosureRef
-Topic 944
-SubTopic 220
-Name Accounting Standards Codification
-Section S99
-Paragraph 1
-Subparagraph (SX 210.7-04(18))
-Publisher FASB
-URI https://asc.fasb.org//1943274/2147483586/944-220-S99-1
Reference 16: http://www.xbrl.org/2003/role/disclosureRef
-Topic 280
-SubTopic 10
-Name Accounting Standards Codification
-Section 50
-Paragraph 22
-Publisher FASB
-URI https://asc.fasb.org//1943274/2147482810/280-10-50-22
Reference 17: http://www.xbrl.org/2003/role/disclosureRef
-Topic 946
-SubTopic 220
-Name Accounting Standards Codification
-Section S99
-Paragraph 1
-Subparagraph (SX 210.6-07(9))
-Publisher FASB
-URI https://asc.fasb.org//1943274/2147483575/946-220-S99-1
Reference 18: http://www.xbrl.org/2003/role/disclosureRef
-Topic 946
-SubTopic 220
-Name Accounting Standards Codification
-Section S99
-Paragraph 3
-Subparagraph (SX 210.6-09(1)(d))
-Publisher FASB
-URI https://asc.fasb.org//1943274/2147483575/946-220-S99-3
Reference 19: http://www.xbrl.org/2003/role/disclosureRef
-Topic 470
-SubTopic 10
-Name Accounting Standards Codification
-Section S99
-Paragraph 1A
-Subparagraph (SX 210.13-01(a)(4)(i))
-Publisher FASB
-URI https://asc.fasb.org//1943274/2147480097/470-10-S99-1A
Reference 20: http://www.xbrl.org/2009/role/commonPracticeRef
-Topic 470
-SubTopic 10
-Name Accounting Standards Codification
-Section S99
-Paragraph 1A
-Subparagraph (SX 210.13-01(a)(4)(ii))
-Publisher FASB
-URI https://asc.fasb.org//1943274/2147480097/470-10-S99-1A
Reference 21: http://www.xbrl.org/2003/role/disclosureRef
-Topic 470
-SubTopic 10
-Name Accounting Standards Codification
-Section S99
-Paragraph 1A
-Subparagraph (SX 210.13-01(a)(4)(iii)(A))
-Publisher FASB
-URI https://asc.fasb.org//1943274/2147480097/470-10-S99-1A
Reference 22: http://www.xbrl.org/2003/role/disclosureRef
-Topic 470
-SubTopic 10
-Name Accounting Standards Codification
-Section S99
-Paragraph 1A
-Subparagraph (SX 210.13-01(a)(4)(iv))
-Publisher FASB
-URI https://asc.fasb.org//1943274/2147480097/470-10-S99-1A
Reference 23: http://www.xbrl.org/2003/role/disclosureRef
-Topic 470
-SubTopic 10
-Name Accounting Standards Codification
-Section S99
-Paragraph 1A
-Subparagraph (SX 210.13-01(a)(5))
-Publisher FASB
-URI https://asc.fasb.org//1943274/2147480097/470-10-S99-1A
Reference 24: http://www.xbrl.org/2003/role/disclosureRef
-Topic 470
-SubTopic 10
-Name Accounting Standards Codification
-Section S99
-Paragraph 1B
-Subparagraph (SX 210.13-02(a)(4)(i))
-Publisher FASB
-URI https://asc.fasb.org//1943274/2147480097/470-10-S99-1B
Reference 25: http://www.xbrl.org/2003/role/disclosureRef
-Topic 470
-SubTopic 10
-Name Accounting Standards Codification
-Section S99
-Paragraph 1B
-Subparagraph (SX 210.13-02(a)(4)(iii)(A))
-Publisher FASB
-URI https://asc.fasb.org//1943274/2147480097/470-10-S99-1B
Reference 26: http://www.xbrl.org/2003/role/disclosureRef
-Topic 470
-SubTopic 10
-Name Accounting Standards Codification
-Section S99
-Paragraph 1B
-Subparagraph (SX 210.13-02(a)(4)(iii)(B))
-Publisher FASB
-URI https://asc.fasb.org//1943274/2147480097/470-10-S99-1B
Reference 27: http://www.xbrl.org/2003/role/disclosureRef
-Topic 470
-SubTopic 10
-Name Accounting Standards Codification
-Section S99
-Paragraph 1B
-Subparagraph (SX 210.13-02(a)(4)(iv))
-Publisher FASB
-URI https://asc.fasb.org//1943274/2147480097/470-10-S99-1B
Reference 28: http://www.xbrl.org/2003/role/disclosureRef
-Topic 470
-SubTopic 10
-Name Accounting Standards Codification
-Section S99
-Paragraph 1B
-Subparagraph (SX 210.13-02(a)(5))
-Publisher FASB
-URI https://asc.fasb.org//1943274/2147480097/470-10-S99-1B
Reference 29: http://www.xbrl.org/2003/role/disclosureRef
-Topic 280
-SubTopic 10
-Name Accounting Standards Codification
-Section 50
-Paragraph 30
-Subparagraph (b)
-Publisher FASB
-URI https://asc.fasb.org//1943274/2147482810/280-10-50-30
Reference 30: http://www.xbrl.org/2003/role/disclosureRef
-Topic 280
-SubTopic 10
-Name Accounting Standards Codification
-Section 50
-Paragraph 32
-Subparagraph (f)
-Publisher FASB
-URI https://asc.fasb.org//1943274/2147482810/280-10-50-32
Reference 31: http://www.xbrl.org/2003/role/disclosureRef
-Topic 260
-SubTopic 10
-Name Accounting Standards Codification
-Section 45
-Paragraph 60B
-Subparagraph (a)
-Publisher FASB
-URI https://asc.fasb.org//1943274/2147482689/260-10-45-60B
Reference 32: http://www.xbrl.org/2003/role/exampleRef
-Topic 280
-SubTopic 10
-Name Accounting Standards Codification
-Section 50
-Paragraph 31
-Publisher FASB
-URI https://asc.fasb.org//1943274/2147482810/280-10-50-31
Reference 33: http://www.xbrl.org/2003/role/disclosureRef
-Topic 280
-SubTopic 10
-Name Accounting Standards Codification
-Section 50
-Paragraph 32
-Subparagraph (c)
-Publisher FASB
-URI https://asc.fasb.org//1943274/2147482810/280-10-50-32
Reference 34: http://www.xbrl.org/2003/role/disclosureRef
-Topic 205
-SubTopic 20
-Name Accounting Standards Codification
-Section 50
-Paragraph 7
-Publisher FASB
-URI https://asc.fasb.org//1943274/2147483499/205-20-50-7
Reference 35: http://fasb.org/us-gaap/role/ref/legacyRef
-Topic 230
-SubTopic 10
-Name Accounting Standards Codification
-Section 45
-Paragraph 28
-Publisher FASB
-URI https://asc.fasb.org//1943274/2147482740/230-10-45-28
Reference 36: http://www.xbrl.org/2003/role/disclosureRef
-Topic 220
-SubTopic 10
-Name Accounting Standards Codification
-Section 45
-Paragraph 1A
-Subparagraph (a)
-Publisher FASB
-URI https://asc.fasb.org//1943274/2147482790/220-10-45-1A
Reference 37: http://www.xbrl.org/2003/role/disclosureRef
-Topic 220
-SubTopic 10
-Name Accounting Standards Codification
-Section 45
-Paragraph 1B
-Subparagraph (a)
-Publisher FASB
-URI https://asc.fasb.org//1943274/2147482790/220-10-45-1B
Reference 38: http://fasb.org/us-gaap/role/ref/legacyRef
-Topic 220
-SubTopic 10
-Name Accounting Standards Codification
-Section S99
-Paragraph 2
-Subparagraph (SX 210.5-03(20))
-Publisher FASB
-URI https://asc.fasb.org//1943274/2147483621/220-10-S99-2
Reference 39: http://fasb.org/us-gaap/role/ref/legacyRef
-Topic 942
-SubTopic 220
-Name Accounting Standards Codification
-Section S99
-Paragraph 1
-Subparagraph (SX 210.9-04(22))
-Publisher FASB
-URI https://asc.fasb.org//1943274/2147483589/942-220-S99-1
| Name: |
us-gaap_NetIncomeLoss |
| Namespace Prefix: |
us-gaap_ |
| Data Type: |
xbrli:monetaryItemType |
| Balance Type: |
credit |
| Period Type: |
duration |
|
| X |
- References
+ Details
| Name: |
us-gaap_NoncashInvestingAndFinancingItemsAbstract |
| Namespace Prefix: |
us-gaap_ |
| Data Type: |
xbrli:stringItemType |
| Balance Type: |
na |
| Period Type: |
duration |
|
| X |
- DefinitionAmount of periodic reduction over lease term of carrying amount of right-of-use asset from operating lease. Reference 1: http://www.xbrl.org/2009/role/commonPracticeRef
-Topic 230
-SubTopic 10
-Name Accounting Standards Codification
-Section 45
-Paragraph 28
-Subparagraph (b)
-Publisher FASB
-URI https://asc.fasb.org//1943274/2147482740/230-10-45-28
| Name: |
us-gaap_OperatingLeaseRightOfUseAssetAmortizationExpense |
| Namespace Prefix: |
us-gaap_ |
| Data Type: |
xbrli:monetaryItemType |
| Balance Type: |
debit |
| Period Type: |
duration |
|
| X |
- DefinitionThe cash outflow associated with other payments to acquire businesses including deposit on pending acquisitions and preacquisition costs. Reference 1: http://fasb.org/us-gaap/role/ref/legacyRef
-Name Accounting Standards Codification
-Topic 230
-SubTopic 10
-Section 45
-Paragraph 13
-Subparagraph (b)
-Publisher FASB
-URI https://asc.fasb.org//1943274/2147482740/230-10-45-13
| Name: |
us-gaap_OtherPaymentsToAcquireBusinesses |
| Namespace Prefix: |
us-gaap_ |
| Data Type: |
xbrli:monetaryItemType |
| Balance Type: |
credit |
| Period Type: |
duration |
|
| X |
- DefinitionCash outflow representing an adjustment to the purchase price of a previous acquisition. Reference 1: http://www.xbrl.org/2009/role/commonPracticeRef
-Topic 230
-SubTopic 10
-Name Accounting Standards Codification
-Section 45
-Paragraph 13
-Publisher FASB
-URI https://asc.fasb.org//1943274/2147482740/230-10-45-13
| Name: |
us-gaap_PaymentsForPreviousAcquisition |
| Namespace Prefix: |
us-gaap_ |
| Data Type: |
xbrli:monetaryItemType |
| Balance Type: |
credit |
| Period Type: |
duration |
|
| X |
- DefinitionThe cash outflow associated with the acquisition of long-lived, physical assets that are used in the normal conduct of business to produce goods and services and not intended for resale; includes cash outflows to pay for construction of self-constructed assets. Reference 1: http://fasb.org/us-gaap/role/ref/legacyRef
-Topic 230
-SubTopic 10
-Name Accounting Standards Codification
-Section 45
-Paragraph 13
-Subparagraph (c)
-Publisher FASB
-URI https://asc.fasb.org//1943274/2147482740/230-10-45-13
| Name: |
us-gaap_PaymentsToAcquirePropertyPlantAndEquipment |
| Namespace Prefix: |
us-gaap_ |
| Data Type: |
xbrli:monetaryItemType |
| Balance Type: |
credit |
| Period Type: |
duration |
|
| X |
- DefinitionThe cash outflow associated with the acquisition from vendors of software programs or applications for internal use (that is, not to be sold, leased or otherwise marketed to others) that qualify for capitalization. Reference 1: http://fasb.org/us-gaap/role/ref/legacyRef
-Topic 230
-SubTopic 10
-Name Accounting Standards Codification
-Section 45
-Paragraph 13
-Subparagraph (c)
-Publisher FASB
-URI https://asc.fasb.org//1943274/2147482740/230-10-45-13
| Name: |
us-gaap_PaymentsToAcquireSoftware |
| Namespace Prefix: |
us-gaap_ |
| Data Type: |
xbrli:monetaryItemType |
| Balance Type: |
credit |
| Period Type: |
duration |
|
| X |
- DefinitionAmount of increase in right-of-use asset obtained in exchange for operating lease liability. Reference 1: http://www.xbrl.org/2003/role/exampleRef
-Topic 842
-SubTopic 20
-Name Accounting Standards Codification
-Section 55
-Paragraph 53
-Publisher FASB
-URI https://asc.fasb.org//1943274/2147479589/842-20-55-53
Reference 2: http://www.xbrl.org/2003/role/disclosureRef
-Topic 842
-SubTopic 20
-Name Accounting Standards Codification
-Section 50
-Paragraph 4
-Subparagraph (g)(2)
-Publisher FASB
-URI https://asc.fasb.org//1943274/2147478964/842-20-50-4
| Name: |
us-gaap_RightOfUseAssetObtainedInExchangeForOperatingLeaseLiability |
| Namespace Prefix: |
us-gaap_ |
| Data Type: |
xbrli:monetaryItemType |
| Balance Type: |
debit |
| Period Type: |
duration |
|
| X |
- DefinitionAmount of noncash expense for share-based payment arrangement. Reference 1: http://fasb.org/us-gaap/role/ref/legacyRef
-Name Accounting Standards Codification
-Section 45
-Paragraph 28
-Subparagraph (a)
-SubTopic 10
-Topic 230
-Publisher FASB
-URI https://asc.fasb.org//1943274/2147482740/230-10-45-28
| Name: |
us-gaap_ShareBasedCompensation |
| Namespace Prefix: |
us-gaap_ |
| Data Type: |
xbrli:monetaryItemType |
| Balance Type: |
debit |
| Period Type: |
duration |
|
v3.24.0.1
Nature of Operations, Management’s Plans and Summary of Significant Accounting Policies, as restated
|
3 Months Ended |
Mar. 31, 2023 |
|---|
| Accounting Policies [Abstract] |
|
| Nature of Operations, Management’s Plans and Summary of Significant Accounting Policies, as restated |
1.
Nature of Operations, Management’s Plans and Summary of Significant Accounting Policies, as restated
Company
Description and Nature of Operations
We
are a global gaming technology company, supplying content, platform, gaming terminals and other products and services to online and land-based
regulated lottery, betting and gaming operators worldwide through a broad range of distribution channels, predominantly on a business-to-business
basis. We provide end-to-end digital gaming solutions (i) on our own proprietary and secure network, which accommodates a wide range
of devices, including land-based gaming machine terminals, mobile devices and online computer applications and (ii) through third party
networks. Our content and other products can be found through the consumer-facing portals of our interactive customers and, through our
land-based customers, in licensed betting offices, adult gaming centers, pubs, bingo halls, airports, motorway service areas and leisure
parks.
Management
Liquidity Plans
As
of March 31, 2023, the Company’s cash on hand was $27.8 million, and the Company had working capital in addition to cash of $24.9
million. The Company recorded a net loss of $1.4 million and net income of $1.5 million for the three months ended March 31, 2023 and
2022, respectively. Net income/losses include non-cash stock-based compensation of $2.9 million and $2.8 million for the three months
ended March 31, 2023 and 2022, respectively. Historically, the Company has generally had positive cash flows from operating activities
and has relied on a combination of cash flows provided by operations and the incurrence of debt and/or the refinancing of existing debt
to fund its obligations. Cash flows provided by operations amounted to $11.6 million and $2.7 million for the three months ended March
31, 2023 and 2022, respectively. The change year on year was due primarily to improved working capital levels, with the three months
ended March 31, 2023 benefitting from favorable receipts due to the timing of sales, and the three months ended March 31, 2022 showing
significant inventory increases after the Company made the strategic decision to secure components and protect sales in a challenging
global supply chain market. Working capital of $52.7 million includes a non-cash settled item of $4.9 million of deferred income. Management
currently believes that, absent any long-term coronavirus (“COVID-19”) impact (see below), the Company’s cash balances
on hand, cash flows expected to be generated from operations, ability to control and defer capital projects and amounts available from
the Company’s external borrowings will be sufficient to fund the Company’s net cash requirements through May 2024.
There
have been no COVID-19 restrictions in the United Kingdom since July 2021 and social distancing measures throughout Greece and Italy are
no longer in force as of the second quarter of 2022. There have been no COVID-19 restrictions in the United States and social distancing
measures are no longer in force. While states have varying requirements based on occupation, no mandates related to, or would prohibit,
our normal business operations.
Basis
of Presentation
The
accompanying unaudited interim condensed consolidated financial statements have been prepared in accordance with accounting principles
generally accepted in the United States of America (“U.S. GAAP”) for interim financial information and pursuant to the instructions
to Form 10-Q and Article 8 of Regulation S-X of the United States Securities and Exchange Commission (“SEC”). Certain information
or footnote disclosures normally included in financial statements prepared in accordance with U.S. GAAP have been condensed or omitted,
pursuant to the rules and regulations of the SEC for interim financial reporting. Accordingly, they do not include all the information
and footnotes necessary for a comprehensive presentation of financial position, results of operations, or cash flows. It is management’s
opinion, however, that the accompanying unaudited interim condensed consolidated financial statements include all adjustments, consisting
of a normal recurring nature, which are necessary for a fair presentation of the financial position, operating results and cash flows
for the periods presented.
The
accompanying unaudited interim condensed consolidated financial statements should be read in conjunction with the Company’s consolidated
financial statements and notes thereto for the years ended December 31, 2022 and 2021. The financial information as of December 31, 2022
is derived from the audited consolidated financial statements presented in the Company’s Annual Report on Form 10-K/A filed with
the SEC on February 27, 2024. The interim results for the three months ended March 31, 2023 are not necessarily indicative of the results
to be expected for the year ending December 31, 2023 or for any future interim periods.
Newly
Adopted Accounting Standards
On
January 1, 2023, the Company adopted Topic 326 Financial Instruments – Credit Losses (“ASC 326”). ASC 326 affects loans,
debt securities, trade receivables, and any other financial assets that have the contractual right to receive cash. It requires an entity
to recognize expected credit losses rather than incurred losses for financial assets and requires a modified retrospective transition
approach through a cumulative-effect adjustment to retained earnings as of the beginning of the period of adoption.
The
adoption of ASC 326 did not have a material impact. Disclosures with respect to allowances for credit losses are given in footnote 4
to these financial statements.
|
| X |
- References
+ Details
| Name: |
us-gaap_AccountingPoliciesAbstract |
| Namespace Prefix: |
us-gaap_ |
| Data Type: |
xbrli:stringItemType |
| Balance Type: |
na |
| Period Type: |
duration |
|
| X |
- DefinitionThe entire disclosure for the general note to the financial statements for the reporting entity which may include, descriptions of the basis of presentation, business description, significant accounting policies, consolidations, reclassifications, new pronouncements not yet adopted and changes in accounting principles. Reference 1: http://fasb.org/us-gaap/role/ref/legacyRef
-Topic 235
-Name Accounting Standards Codification
-Publisher FASB
-URI https://asc.fasb.org//235/tableOfContent
Reference 2: http://fasb.org/us-gaap/role/ref/legacyRef
-Topic 275
-Name Accounting Standards Codification
-Publisher FASB
-URI https://asc.fasb.org//275/tableOfContent
Reference 3: http://fasb.org/us-gaap/role/ref/legacyRef
-Topic 810
-Name Accounting Standards Codification
-Publisher FASB
-URI https://asc.fasb.org//810/tableOfContent
Reference 4: http://fasb.org/us-gaap/role/ref/legacyRef
-Topic 250
-Name Accounting Standards Codification
-Publisher FASB
-URI https://asc.fasb.org//250/tableOfContent
| Name: |
us-gaap_OrganizationConsolidationBasisOfPresentationBusinessDescriptionAndAccountingPoliciesTextBlock |
| Namespace Prefix: |
us-gaap_ |
| Data Type: |
dtr-types:textBlockItemType |
| Balance Type: |
na |
| Period Type: |
duration |
|
v3.24.0.1
Restatement of Previously Issued Financial Statements
|
3 Months Ended |
Mar. 31, 2023 |
|---|
| Accounting Changes and Error Corrections [Abstract] |
|
| Restatement of Previously Issued Financial Statements |
2.
Restatement of Previously Issued Financial Statements
Restatement
Background
On
November 2, 2023, the Company in concurrence with the Company’s audit committee, concluded that our 2023 and 2022 consolidated
financial statements and our unaudited consolidated financial statements as of and for each of the first two quarterly periods in
2023 and all quarterly periods in 2022, included in our Quarterly Reports on Form 10-Q for the respective periods(collectively the
“Prior Period Financial Statements”), should no longer be relied upon due to misstatements that are described below, and
that we would restate such financial statements to make the necessary accounting corrections. Details of the restated consolidated
financial statements as of March 31, 2023 and for the three months ended March 31, 2023 and 2022 are provided below
(“Restatement Items”). Details of the restated consolidated financial statements as of December
31, 2022 are provided in the amendment to the Company’s Annual Report on Form 10-K/A for the year ended December 31, 2022, filed
with the SEC as of the date of this report.
The
Restatements Items reflect adjustments to correct errors in certain financial statement areas including capitalized software and costs
to fulfill a contract, revenue and costs to obtain a contract, inventory, goodwill and intangibles, leasing, pension, and other reclassifications
and immaterial errors identified. The nature and impact of these adjustments are described below and also detailed in the tables below.
The Company issued a revision for capitalized software and related amortization
expense in the quarterly report on Form 10-Q filed on August 11, 2023 for the period ended June 30, 2023 (the “Revision”).This
revision related to certain completed software development projects that were, but should not have been, delayed in the shift from work
in progress to completed projects. Consequently, the commencement of amortization for certain projects was delayed and the reported amortization
was lower than the actual amortization. The Revision covers the period ended March 31, 2023 and the year ended December 31, 2022 and is
distinct from the capitalized software restatements below. The tables below have been updated to separate the impact of the Restatement
Items from the Revision.
Restatement
Items
Capitalized
software and Costs to fulfill a contract – The Company historically assessed and applied incorrectly the accounting frameworks
for developing external use software under ASC 985-20, Costs of Software to Be Sold, Leased or Marketed, and internal-use software
under ASC 350-40, Intangibles – Goodwill and Other – Internal-Use Software and ASC 340-40, Other Assets and Deferred
Costs – Contracts with Customers. In addition,
the Company determined routine software updates and certain minor software enhancements were inappropriately
capitalized and capitalized labor rates inappropriately included certain indirect costs including overhead, and non-development
activities. Consequently, certain amortization was inappropriate.
The corrections resulted in a decrease in Software development costs, net of $17.6 million and an increase in Cost of obtaining and fulfilling
customer contracts, of $7.2 million as of March 31, 2023. The corrections resulted in an
increase to Selling, general and administrative expenses of $1.1 million and $0.5 million as well as a decrease in Depreciation and amortization
of $1.1 million and $0.7 million for the three months ended March 31, 2023 and 2022, respectively.
In addition, the Revision resulted in a decrease in Software development costs, net of $1.0 million for the three months ended
March 31, 2023. Refer to reference “a” below.
Revenue
and Costs to obtain a contract – The Company identified
corrections needed related to ASC 606, Revenue from Contracts with Customers.
The Company identified certain performance obligations were delivered and therefore should
have been recognized at a specific point in time (rather than over time). Additionally, we identified
that (i) for certain Interactive Aggregator contracts, revenue should have been reported on a net, rather than gross, basis and (ii)
certain parts the Company acquired and sold to its contract manufacturer should not have
been reported as revenue. These two items have no impact to profit. The Company also identified
an immaterial contract that should have been recognized as sales type lease rather than
an operating lease. Lastly, the Company had historically expensed certain commissions
in the period incurred instead of capitalizing and amortizing them under the accounting framework for costs to obtain contracts with
customers pursuant to ASC 606, Revenue from Contracts with Customers, and ASC 340-40, Other Assets and Deferred Costs – Contracts
with Customers. The corrections resulted in a decrease in Property and equipment, net of $0.3
million as of
March 31, 2023. The corrections also resulted in a decrease in Deferred revenue, current of $0.2
million, a decrease
in Deferred revenue, net of current position of $0.9
million as of March
31, 2023 and an increase in Costs of obtaining and fulfilling
customer contracts, net of $0.8
million as of March
31, 2023. The corrections also resulted in a decrease in Revenue - service of $0.7
million and $1.0
million for the three
months ended March 31, 2023 and 2022, respectively, a $0.3
million decrease in
Revenue – product sales for the three months ended March 31, 2023 and an $0.7
million increase in
Revenue – product sales for the three months ended March 31, 2022, a decrease in Cost of sales – service of $2.3
million and $1.9
million for the three
months ended March 31, 2023 and 2022, respectively, and a $0.2
million decrease and
$0.5
million increase in
Cost of sales – product sales for the three months ended March 31, 2023 and 2022, respectively. The corrections also resulted in
an increase in Depreciation and amortization increased by $1.6
million and $1.4
million for the three
months ended March 31, 2023 and 2022, respectively. Refer
to reference “b” below. Note 6, “Contract Liabilities and Other Disclosures”
and Note 16, “Segment Reporting and Geographic Information” have also been corrected.
Inventory – The
Company identified an error in the amount capitalized for field
inventory, repair and consumable items. The correction resulted in a decrease of inventory of $1.9 million for the three
months ended March 31, 2023. Refer to reference “c” below. Note 5,
“Inventory” has also been corrected.
Goodwill
and intangibles – Through review of the appropriate
reporting units and asset groups to assess impairments at under ASC 350, Intangibles –
Goodwill and Other and ASC 360, Property, Plant and Equipment,
the Company identified a triggering event in the first quarter of 2020, related to the beginning
of the COVID-19 pandemic, for which impairment assessment was required for (i) Server Based Gaming (“SBG”)
and Acquired Business
reporting units and (ii) all landbased asset groups. Based on the assessment, we determined that an impairment of acquired business
goodwill and long-lived assets occurred in the first quarter of 2020. Additionally, we determined
that a significant number of synergies existed from the acquisition in the fourth quarter of 2019 and therefore a portion of the acquisition
goodwill should have been reallocated to other reporting units upon acquisition. The corrections resulted in a decrease of Depreciation and amortization of $0.1 million for the three months ended March 31, 2022 and
a decrease in Other acquired intangible assets subject to amortization, net of $1.2 million as of March 31, 2023. Refer to reference “d” below.
Leasing –
The Company identified errors related to leasing, which primarily related to the Company not historically including in-substance
fixed payments related to certain leases according to the accounting framework in ASC 842, Leases. The corrections resulted
in an increase in Operating lease right of use asset of $7.6 million, an increase in current Operating lease liabilities of $1.2
million and an increase in long-term Operating lease liabilities of $6.3 million as of March 31, 2023. Refer
to reference “e” below. Note 13, “Leases” has also been
corrected.
Basic
and diluted net
income (loss) per share
– An error to shares outstanding primarily relates to the Company not including
deferred settlement equity awards that had vested in the number of outstanding shares used in the calculation of basic and diluted weighted
average number of shares outstanding pursuant to ASC 260, Earnings Per Share. Refer to reference “h” below. Note 9,
“Net earnings (loss) per share” has also been corrected.
Pension
– The Company had corrections to pension that primarily related to no longer updating the plan liability/ asset quarterly to
comply with US GAAP. The corrections resulted in a reclassification of $1.8 million from Accumulated other comprehensive income to Other
long-term liabilities as of March 31, 2023. In addition, the Company corrected the benefit obligation and fair value of plan assets for
the buy-in contract. The Company corrected the measurement of the plan assets and the estimated fair value of the buy in contract.
Note 15, “Pension Plan” has also been corrected. Refer to reference “g” below.
Other
errors identified – Through the restatement process, the Company has reclassified certain costs for salaries of service employees
and recorded an adjustment related to foreign currency impacts on an intangible. In addition to the reclassification
and intangible adjustment, the Company has corrected other adjustments that are
quantitatively immaterial, individually and in aggregate, because we are correcting for these material errors, we have decided to correct
these other adjustments. Refer to reference “f” below.
Income
tax – The Company updated the income tax effects for the Restatement Items. Note 11, “Income Taxes” has also been
updated.
Summary
impact of Restatement Items to Prior Period Financial Statements
The
following tables present the effect of the Restatement Items on the Company’s consolidated balance sheets for the periods indicated
(in millions, except per share):
Schedule
of Restatement Items to Prior Period Financial Statements
| | |
| | |
| | |
| | |
| | |
|
| | |
As of March 31, 2023 (unaudited) |
| | |
As Previously | | |
Previous | | |
Restatement | | |
| | |
Restatement |
| | |
Reported | | |
Revision | | |
Adjustments | | |
As Restated | | |
References |
| Assets | |
| | |
| | |
| | |
| | |
|
| Cash | |
$ | 27.8 | | |
$ | - | | |
$ | - | | |
$ | 27.8 | | |
|
| Accounts receivable, net | |
| 33.0 | | |
| - | | |
| (0.1 | ) | |
| 32.9 | | |
f |
| Inventory, net | |
| 36.5 | | |
| - | | |
| (1.9 | ) | |
| 34.6 | | |
c |
| Prepaid expenses and other current assets | |
| 31.1 | | |
| - | | |
| (0.4 | ) | |
| 30.7 | | |
f |
| Total current assets | |
| 128.4 | | |
| - | | |
| (2.4 | ) | |
| 126.0 | | |
|
| | |
| | | |
| | | |
| | | |
| | | |
|
| Property and equipment, net | |
| 47.7 | | |
| - | | |
| (0.3 | ) | |
| 47.4 | | |
b |
| Software development costs, net | |
| 38.1 | | |
| (1.0 | ) | |
| (17.6 | ) | |
| 19.5 | | |
a |
| Other acquired intangible assets subject to amortization, net | |
| 14.6 | | |
| - | | |
| (0.3 | ) | |
| 14.3 | | |
d, f |
| Goodwill | |
| 75.8 | | |
| - | | |
| (18.8 | ) | |
| 57.0 | | |
d |
| Operating lease right of use asset | |
| 8.1 | | |
| - | | |
| 7.6 | | |
| 15.7 | | |
e |
| Cost of obtaining and fulfilling customer contracts, net | |
| - | | |
| - | | |
| 7.7 | | |
| 7.7 | | |
a, b |
| Other assets | |
| 3.8 | | |
| - | | |
| 0.3 | | |
| 4.1 | | |
f |
| Total assets | |
$ | 316.5 | | |
$ | (1.0 | ) | |
$ | (23.8 | ) | |
$ | 291.7 | | |
|
| | |
| | | |
| | | |
| | | |
| | | |
|
| Liabilities and Stockholders’ Deficit | |
| | | |
| | | |
| | | |
| | | |
|
| Current liabilities | |
| | | |
| | | |
| | | |
| | | |
|
| Accounts payable | |
| 22.2 | | |
| - | | |
| - | | |
| 22.2 | | |
|
| Accrued expenses | |
| 34.9 | | |
| - | | |
| 0.7 | | |
| 35.6 | | |
f |
| Corporate tax and other current taxes payable | |
| 5.0 | | |
| - | | |
| (1.6 | ) | |
| 3.4 | | |
|
| Deferred revenue, current | |
| 5.1 | | |
| - | | |
| (0.2 | ) | |
| 4.9 | | |
b |
| Operating lease liabilities | |
| 2.8 | | |
| - | | |
| 1.2 | | |
| 4.0 | | |
e |
| Other current liabilities | |
| 3.2 | | |
| - | | |
| - | | |
| 3.2 | | |
|
| Total current liabilities | |
| 73.2 | | |
| - | | |
| 0.1 | | |
| 73.3 | | |
|
| | |
| | | |
| | | |
| | | |
| | | |
|
| Long-term debt | |
| 285.5 | | |
| - | | |
| - | | |
| 285.5 | | |
|
| Finance lease liabilities, net of current portion | |
| 1.2 | | |
| - | | |
| - | | |
| 1.2 | | |
|
| Deferred revenue, net of current portion | |
| 3.2 | | |
| - | | |
| (0.9 | ) | |
| 2.3 | | |
b |
| Operating lease liabilities | |
| 5.6 | | |
| - | | |
| 6.3 | | |
| 11.9 | | |
e |
| Other long-term liabilities | |
| 2.2 | | |
| - | | |
| 1.8 | | |
| 4.0 | | |
g |
| Total liabilities | |
$ | 370.9 | | |
$ | - | | |
$ | 7.3 | | |
$ | 378.2 | | |
|
| | |
| | | |
| | | |
| | | |
| | | |
|
| Commitments and contingencies | |
| | | |
| | | |
| | | |
| | | |
|
| | |
| | | |
| | | |
| | | |
| | | |
|
| Stockholders’ deficit | |
| | | |
| | | |
| | | |
| | | |
|
| Preferred stock; $0.0001 par value; 1,000,000 shares authorized | |
| - | | |
| - | | |
| - | | |
| - | | |
|
| Common stock; $0.0001 par value; 49,000,000 shares authorized; 25,909,516 shares and 26,433,562 shares issued and outstanding at December 31, 2022 and December 31, 2021, respectively | |
| - | | |
| - | | |
| - | | |
| - | | |
|
| Additional paid in capital | |
| 381.2 | | |
| - | | |
| - | | |
| 381.2 | | |
|
| Accumulated other comprehensive income | |
| 46.8 | | |
| - | | |
| 1.5 | | |
| 48.3 | | |
|
| Accumulated deficit | |
| (482.4 | ) | |
| (1.0 | ) | |
| (32.6 | ) | |
| (516.0 | ) | |
|
| Total stockholders’ deficit | |
| (54.4 | ) | |
| (1.0 | ) | |
| (31.1 | ) | |
| (86.5 | ) | |
|
| Total liabilities and stockholders’ deficit | |
$ | 316.5 | | |
$ | (1.0 | ) | |
$ | (23.8 | ) | |
$ | 291.7 | | |
|
The
following tables present the effect of the Restatement Items on the Company’s consolidated statement of operations for the periods
indicated (in millions, except share and per share amounts):
| | |
| | |
| | |
| | |
|
| | |
For Three Months Ended March 31, 2023 (unaudited) |
| | |
As Previously | | |
Restatement | | |
| | |
Restatement |
| | |
Reported | | |
Adjustments | | |
As Restated | | |
References |
| Revenue: | |
| | |
| | |
| | |
|
| Service | |
$ | 58.3 | | |
$ | (0.8 | ) | |
$ | 57.5 | | |
b, f |
| Product sales | |
| 7.7 | | |
| (0.3 | ) | |
| 7.4 | | |
b |
| Total Revenue | |
| 66.0 | | |
| (1.1 | ) | |
| 64.9 | | |
|
| | |
| | | |
| | | |
| | | |
|
| Cost of Sales | |
| | | |
| | | |
| | | |
|
| Cost of service(1) | |
| (10.9 | ) | |
| (4.1 | ) | |
| (15.0 | ) | |
b, f |
| Cost of product sales | |
| (5.8 | ) | |
| (0.9 | ) | |
| (6.7 | ) | |
b, c |
| Selling, general and administrative expenses | |
| (34.3 | ) | |
| 5.1 | | |
| (29.2 | ) | |
a, f |
| Acquisition and integration related transaction expenses | |
| - | | |
| - | | |
| - | | |
|
| Depreciation and amortization | |
| (8.9 | ) | |
| (0.5 | ) | |
| (9.4 | ) | |
a, b |
| Net operating income (loss) | |
| 6.1 | | |
| (1.5 | ) | |
| 4.6 | | |
|
| | |
| | | |
| - | | |
| | | |
|
| Other expense | |
| | | |
| | | |
| | | |
|
| Interest expense, net | |
| (6.3 | ) | |
| - | | |
| (6.3 | ) | |
|
| Gain on disposal of business | |
| - | | |
| - | | |
| - | | |
|
| Other finance income (expense) | |
| 0.1 | | |
| - | | |
| 0.1 | | |
|
| | |
| | | |
| | | |
| | | |
|
| Total other expense, net | |
| (6.2 | ) | |
| - | | |
| (6.2 | ) | |
|
| | |
| | | |
| - | | |
| | | |
|
| Income tax (expense) benefit | |
| (0.1 | ) | |
| 0.3 | | |
| 0.2 | | |
|
| Net loss | |
| (0.2 | ) | |
| (1.2 | ) | |
| (1.4 | ) | |
|
| | |
| | | |
| | | |
| | | |
|
| Other comprehensive income (loss) | |
| | | |
| | | |
| | | |
|
| Foreign currency translation gain (loss) | |
| (1.7 | ) | |
| (1.2 | ) | |
| (2.9 | ) | |
|
| Reclassification of loss on hedging instrument to comprehensive income | |
| 0.2 | | |
| - | | |
| 0.2 | | |
|
| Actuarial gains (losses) on pension plan | |
| 2.0 | | |
| (1.8 | ) | |
| 0.2 | | |
g |
| Other comprehensive income (loss) | |
| 0.5 | | |
| (3.0 | ) | |
| (2.5 | ) | |
|
| | |
| | | |
| | | |
| | | |
|
| Comprehensive income (loss) | |
$ | 0.3 | | |
$ | (4.2 | ) | |
$ | (3.9 | ) | |
|
| | |
| | | |
| | | |
| | | |
|
| Net income (loss) per common share - basic | |
$ | (0.01 | ) | |
$ | (0.04 | ) | |
$ | (0.05 | ) | |
|
| Net income (loss) per common share - diluted | |
$ | (0.01 | ) | |
$ | (0.04 | ) | |
$ | (0.05 | ) | |
|
| | |
| | | |
| | | |
| | | |
|
| Weighted average number of shares outstanding during the year - basic | |
| 26,155,346 | | |
| 1,818,836 | | |
| 27,974,182 | | |
h |
| Weighted average number of shares outstanding during the year - diluted | |
| 26,155,346 | | |
| 1,818,836 | | |
| 27,974,182 | | |
|
| Stock-based compensation included in: | |
| | | |
| | | |
| | | |
|
| Selling, general, and administrative expenses | |
$ | (2.9 | ) | |
| | | |
$ | (2.9 | ) | |
|
| (1) |
Excluding
depreciation and amortization |
| | |
| | | |
| | | |
| | | |
|
| | |
For Three Months Ended March 31, 2022 (unaudited) |
| | |
As Previously | | |
Restatement | | |
| | |
Restatement |
| | |
Reported | | |
Adjustments | | |
As Restated | | |
References |
| Revenue: | |
| | | |
| | | |
| | | |
|
| Service | |
$ | 57.0 | | |
$ | (1.0 | ) | |
$ | 56.0 | | |
b |
| Product Sales | |
| 3.6 | | |
| 0.7 | | |
| 4.3 | | |
b |
| Total Revenue | |
| 60.6 | | |
| (0.3 | ) | |
| 60.3 | | |
|
| | |
| | | |
| | | |
| | | |
|
| Cost of Sales | |
| | | |
| | | |
| | | |
|
| Cost of Service | |
| (11.8 | ) | |
| (5.0 | ) | |
| (16.8 | ) | |
b, f |
| Cost of Product sales | |
| (2.1 | ) | |
| (0.4 | ) | |
| (2.5 | ) | |
b, c |
| Selling, general and administrative expenses | |
| (29.6 | ) | |
| 6.4 | | |
| (23.2 | ) | |
a, f |
| Acquisition and integration related transaction expenses | |
| (0.1 | ) | |
| (0.1 | ) | |
| (0.2 | ) | |
|
| Depreciation and amortization | |
| (10.1 | ) | |
| (0.6 | ) | |
| (10.7 | ) | |
a, b, d |
| Net operating income (loss) | |
| 6.9 | | |
| - | | |
| 6.9 | | |
|
| | |
| | | |
| | | |
| | | |
|
| Other expense | |
| | | |
| | | |
| | | |
|
| Interest expense, net | |
| (6.5 | ) | |
| - | | |
| (6.5 | ) | |
|
| Gain on disposal of business | |
| 0.9 | | |
| - | | |
| 0.9 | | |
|
| Other finance income (expense) | |
| 0.3 | | |
| - | | |
| 0.3 | | |
|
| | |
| | | |
| | | |
| | | |
|
| Total other expense, net | |
| (5.3 | ) | |
| - | | |
| (5.3 | ) | |
|
| | |
| | | |
| | | |
| | | |
|
| Income tax expense | |
| (0.1 | ) | |
| - | | |
| (0.1 | ) | |
|
| Net income | |
| 1.5 | | |
| - | | |
| 1.5 | | |
|
| | |
| | | |
| | | |
| | | |
|
| Other comprehensive income: | |
| | | |
| | | |
| | | |
|
| Foreign currency translation (loss) gain | |
| 2.4 | | |
| 1.1 | | |
| 3.5 | | |
|
| Reclassification of loss on hedging instrument to comprehensive income | |
| 0.2 | | |
| - | | |
| 0.2 | | |
|
| Actuarial gains (losses) on pension plan | |
| 0.7 | | |
| (0.6 | ) | |
| 0.1 | | |
g |
| Other comprehensive income | |
| 3.3 | | |
| 0.5 | | |
| 3.8 | | |
|
| | |
| | | |
| | | |
| | | |
|
| Comprehensive income | |
$ | 4.8 | | |
$ | 0.5 | | |
$ | 5.3 | | |
|
| | |
| | | |
| | | |
| | | |
|
| Net income (loss) per common share - basic | |
$ | 0.06 | | |
$ | (0.01 | ) | |
$ | 0.05 | | |
|
| Net income (loss) per common share - diluted | |
$ | 0.05 | | |
$ | - | | |
$ | 0.05 | | |
|
| | |
| | | |
| | | |
| | | |
|
| Weighted average number of shares outstanding during the year - basic | |
| 26,850,326 | | |
| 1,586,726 | | |
| 28,437,052 | | |
h |
| Weighted average number of shares outstanding during the year - diluted | |
| 29,294,973 | | |
| 67,409 | | |
| 29,362,382 | | |
|
The
following tables present the effect of the Restatement Items on the Company’s consolidated statements of stockholders’ equity
(deficit) for the periods indicated (in millions, except per share amounts):
| | |
| | |
| | |
| | |
| | |
| | |
| | |
|
| | |
| | |
| | |
| | |
Accumulated | | |
| | |
| | |
|
| | |
| | |
| | |
Additional | | |
other | | |
| | |
Total | | |
|
| | |
Common Stock | | |
paid in | | |
comprehensive | | |
Accumulated | | |
stockholders’ | | |
Restatement |
| | |
Shares | | |
Amount | | |
capital | | |
income | | |
deficit | | |
deficit | | |
References |
| | |
| | | |
| | | |
| | | |
| | | |
| | | |
| | | |
|
| Balance as of March 31, 2023 (As Previously Reported) | |
| 26,263,070 | | |
| - | | |
| 381.2 | | |
| 46.8 | | |
| (482.4 | ) | |
| (54.4 | ) | |
|
| Previous Revision | |
| - | | |
| - | | |
| - | | |
| - | | |
| (1.0 | ) | |
| (1.0 | ) | |
|
| Restatement Items | |
| - | | |
| - | | |
| - | | |
| 1.5 | | |
| (32.6 | ) | |
| (31.1 | ) | |
|
| Balance as of March 31, 2023 (As Restated) (Unaudited) | |
| 26,263,070 | | |
$ | - | | |
$ | 381.2 | | |
$ | 48.3 | | |
$ | (516.0 | ) | |
$ | (86.5 | ) | |
|
| | |
| | |
| | |
| | |
| | |
| | |
| | |
|
| | |
| | |
| | |
| | |
Accumulated | | |
| | |
| | |
|
| | |
| | |
| | |
Additional | | |
other | | |
| | |
Total | | |
|
| | |
Common Stock | | |
paid in | | |
comprehensive | | |
Accumulated | | |
stockholders’ | | |
Restatement |
| | |
Shares | | |
Amount | | |
capital | | |
income | | |
deficit | | |
deficit | | |
References |
| | |
| | | |
| | | |
| | | |
| | | |
| | | |
| | | |
|
| Balance as of March 31, 2022 (As Previously Reported) | |
| 26,880,622 | | |
| - | | |
| 375.0 | | |
| 47.1 | | |
| (492.6 | ) | |
| (70.5 | ) | |
|
| Balance | |
| 26,880,622 | | |
| - | | |
| 375.0 | | |
| 47.1 | | |
| (492.6 | ) | |
| (70.5 | ) | |
|
| Restatement Items | |
| - | | |
| - | | |
| - | | |
| 0.5 | | |
| (30.7 | ) | |
| (30.2 | ) | |
|
| Balance as of March 31, 2022 (As Restated) (Unaudited) | |
| 26,880,622 | | |
$ | - | | |
$ | 375.0 | | |
$ | 47.6 | | |
$ | (523.3 | ) | |
$ | (100.7 | ) | |
|
| Balance | |
| 26,880,622 | | |
$ | - | | |
$ | 375.0 | | |
$ | 47.6 | | |
$ | (523.3 | ) | |
$ | (100.7 | ) | |
|
The
following tables present the effect of the Restatement Items on the Company’s consolidated statements of cashflows for the periods
indicated (in millions):
| | |
| | | |
| | | |
| | | |
| | | |
|
| | |
Three Months Ended March 31, 2023 (unaudited) |
| | |
As Previously | | |
Previous | | |
Restatement | | |
| | |
Restatement |
| | |
Reported | | |
Revision | | |
Adjustments | | |
As Restated | | |
References |
| Cash flows from operating activities: | |
| | | |
| | | |
| | | |
| | | |
|
| Net income (loss) | |
$ | (0.2 | ) | |
$ | - | | |
$ | (1.2 | ) | |
$ | (1.4 | ) | |
a, b, c, f |
| Adjustments to reconcile net income (loss) to net cash provided by operating activities: | |
| | | |
| - | | |
| | | |
| | | |
|
| Depreciation and amortization | |
| 8.9 | | |
| - | | |
| 0.5 | | |
| 9.4 | | |
a, b, d |
| Amortization of right of use asset | |
| 0.5 | | |
| - | | |
| 0.3 | | |
| 0.8 | | |
e |
| Profit on sale of trade and asset | |
| | | |
| | | |
| | | |
| | | |
|
| Stock-based compensation expense | |
| 2.9 | | |
| - | | |
| - | | |
| 2.9 | | |
|
| Contract cost expense | |
| - | | |
| - | | |
| (2.6 | ) | |
| (2.6 | ) | |
a, b |
| Reclassification of loss on hedging instrument to comprehensive income | |
| 0.2 | | |
| - | | |
| - | | |
| 0.2 | | |
|
| Non-cash interest expense relating to senior debt | |
| 0.3 | | |
| - | | |
| - | | |
| 0.3 | | |
|
| Changes in assets and liabilities: | |
| | | |
| - | | |
| | | |
| | | |
|
| Accounts receivable | |
| 8.5 | | |
| - | | |
| (0.2 | ) | |
| 8.3 | | |
g |
| Inventory | |
| (4.6 | ) | |
| - | | |
| 1.1 | | |
| (3.5 | ) | |
c, g |
| Prepaid expenses and other assets | |
| 1.6 | | |
| - | | |
| (0.6 | ) | |
| 1.0 | | |
f, g |
| Corporate tax and other current taxes payable | |
| (3.8 | ) | |
| - | | |
| (2.4 | ) | |
| (6.2 | ) | |
g |
| Accounts payable | |
| (4.1 | ) | |
| - | | |
| 2.0 | | |
| (2.1 | ) | |
g |
| Deferred revenues and customer prepayment | |
| (0.3 | ) | |
| - | | |
| 0.1 | | |
| (0.2 | ) | |
g |
| Accrued expenses | |
| 5.5 | | |
| - | | |
| 0.1 | | |
| 5.6 | | |
f, g |
| Other lease liabilities | |
| (0.6 | ) | |
| - | | |
| (0.3 | ) | |
| (0.9 | ) | |
g |
| Other long-term liabilities | |
| - | | |
| - | | |
| - | | |
| - | | |
|
| Net cash provided by operating activities | |
| 14.8 | | |
| - | | |
| (3.2 | ) | |
| 11.6 | | |
|
| | |
| | | |
| | | |
| | | |
| | | |
|
| Cash flows from investing activities: | |
| | | |
| | | |
| | | |
| | | |
|
| Purchases of property and equipment | |
| (6.1 | ) | |
| - | | |
| 0.6 | | |
| (5.5 | ) | |
g |
| Acquisition of subsidiary company assets | |
| - | | |
| - | | |
| | | |
| - | | |
|
| Acquisition of third-party company trade and assets | |
| (0.6 | ) | |
| - | | |
| - | | |
| (0.6 | ) | |
|
| Disposal of trade and assets | |
| | | |
| | | |
| | | |
| | | |
|
| Purchases of capital software | |
| (4.8 | ) | |
| - | | |
| 2.0 | | |
| (2.8 | ) | |
a, g |
| Net cash used in investing activities | |
| (11.5 | ) | |
| - | | |
| 2.6 | | |
| (8.9 | ) | |
|
| | |
| | | |
| | | |
| | | |
| | | |
|
| Cash flows from financing activities: | |
| | | |
| | | |
| | | |
| | | |
|
| Repayments of finance leases | |
| (0.5 | ) | |
| - | | |
| - | | |
| (0.5 | ) | |
|
| Net cash used in financing activities | |
| (0.5 | ) | |
| - | | |
| - | | |
| (0.5 | ) | |
|
| | |
| | | |
| | | |
| | | |
| | | |
|
| Effect of exchange rate changes on cash | |
| - | | |
| - | | |
| 0.6 | | |
| 0.6 | | |
g |
| Net increase (decrease) in cash | |
| 2.8 | | |
| - | | |
| - | | |
| 2.8 | | |
|
| Cash, beginning of period | |
| 25.0 | | |
| - | | |
| 0 | | |
| 25.0 | | |
|
| Cash, end of period | |
$ | 27.8 | | |
| - | | |
| 0 | | |
| 27.8 | | |
|
| | |
| | | |
| | | |
| | | |
| | | |
|
| Supplemental cash flow disclosures | |
| | | |
| | | |
| | | |
| | | |
|
| Cash paid during the period for interest | |
$ | 0.1 | | |
$ | - | | |
$ | - | | |
$ | 0.1 | | |
|
| Cash paid during the period for income taxes | |
$ | 0.1 | | |
$ | - | | |
$ | - | | |
$ | 0.1 | | |
|
| Cash paid during the period for operating leases | |
$ | 1.2 | | |
$ | - | | |
$ | 0.9 | | |
$ | 2.1 | | |
|
| | |
| | | |
| | | |
| | | |
| | | |
|
| Supplemental disclosure of noncash investing and financing activities | |
| | | |
| | | |
| | | |
| | | |
|
| Lease liabilities arising from obtaining right of use assets | |
$ | (0.1 | ) | |
$ | | | |
$ | | | |
$ | (0.1 | ) | |
|
| Property and equipment acquired through finance lease | |
| | | |
| | | |
| | | |
| | | |
|
| Property and equipment transferred to inventory | |
| | | |
| | | |
| | | |
| | | |
|
| | |
Reported | | |
Adjustments | | |
As Restated | | |
References |
| | |
Three Months Ended March 31, 2022 (unaudited) |
| | |
As Previously | | |
Restatement | | |
| | |
Restatement |
| | |
Reported | | |
Adjustments | | |
As Restated | | |
References |
| Cash flows from operating activities: | |
| | | |
| | | |
| | | |
|
| Net income (loss) | |
$ | 1.5 | | |
$ | - | | |
$ | 1.5 | | |
a, b, c, d, f |
| Adjustments to reconcile net income (loss) to net cash provided by operating activities: | |
| | | |
| | | |
| | | |
|
| Depreciation and amortization | |
| 10.1 | | |
| 0.6 | | |
| 10.7 | | |
a, b, d |
| Amortization of right of use asset | |
| 0.7 | | |
| 0.3 | | |
| 1.0 | | |
e |
| Profit on sale of trade and asset | |
| - | | |
| (0.9 | ) | |
| (0.9 | ) | |
f |
| Stock-based compensation expense | |
| 2.8 | | |
| - | | |
| 2.8 | | |
|
| Contract Cost expense | |
| - | | |
| (1.6 | ) | |
| (1.6 | ) | |
a, b |
| Reclassification of loss on hedging instrument to comprehensive income | |
| 0.2 | | |
| - | | |
| 0.2 | | |
|
| Non-cash interest expense relating to senior debt | |
| 0.4 | | |
| - | | |
| 0.4 | | |
|
| Changes in assets and liabilities: | |
| | | |
| | | |
| | | |
|
| Accounts receivable | |
| (2.1 | ) | |
| (0.1 | ) | |
| (2.2 | ) | |
g |
| Inventory | |
| (11.9 | ) | |
| 0.3 | | |
| (11.6 | ) | |
c, g |
| Prepaid expenses and other assets | |
| 0.9 | | |
| (0.9 | ) | |
| - | | |
g |
| Corporate tax and other current taxes payable | |
| (7.2 | ) | |
| - | | |
| (7.2 | ) | |
|
| Accounts payable | |
| 4.3 | | |
| (0.1 | ) | |
| 4.2 | | |
g |
| Deferred revenues and customer prepayment | |
| (0.3 | ) | |
| 0.3 | | |
| - | | |
a, b, g |
| Accrued expenses | |
| 7.1 | | |
| - | | |
| 7.1 | | |
|
| Operating lease liabilities | |
| (0.7 | ) | |
| (0.3 | ) | |
| (1.0 | ) | |
e |
| Other long-term liabilities | |
| (0.7 | ) | |
| - | | |
| (0.7 | ) | |
|
| Net cash provided by operating activities | |
| 5.1 | | |
| (2.4 | ) | |
| 2.7 | | |
|
| | |
| | | |
| | | |
| | | |
|
| Cash flows from investing activities: | |
| | | |
| | | |
| | | |
|
| Purchases of property and equipment | |
| (5.2 | ) | |
| (0.4 | ) | |
| (5.6 | ) | |
|
| Acquisition of subsidiary company assets | |
| (0.6 | ) | |
| - | | |
| (0.6 | ) | |
|
| Disposal of trade and assets | |
| - | | |
| 1.3 | | |
| 1.3 | | |
|
| Purchases of capital software | |
| (5.1 | ) | |
| 1.2 | | |
| (3.9 | ) | |
|
| Net cash used in investing activities | |
| (10.9 | ) | |
| 2.1 | | |
| (8.8 | ) | |
|
| | |
| | | |
| | | |
| | | |
|
| Cash flows from financing activities: | |
| | | |
| | | |
| | | |
|
| Repayments of finance leases | |
| (0.1 | ) | |
| - | | |
| (0.1 | ) | |
|
| Net cash (used in) provided by financing activities | |
| (0.1 | ) | |
| - | | |
| (0.1 | ) | |
|
| | |
| | | |
| | | |
| | | |
|
| Effect of exchange rate changes on cash | |
| (1.1 | ) | |
| 0.3 | | |
| (0.8 | ) | |
g |
| Net increase in cash | |
| (7.0 | ) | |
| - | | |
| (7.0 | ) | |
|
| Cash, beginning of period | |
| 47.8 | | |
| - | | |
| 47.8 | | |
|
| Cash, end of period | |
$ | 40.8 | | |
$ | - | | |
$ | 40.8 | | |
|
| | |
| | | |
| | | |
| | | |
|
| Supplemental cash flow disclosures | |
| | | |
| | | |
| | | |
|
| Cash paid during the period for interest | |
$ | 0.2 | | |
$ | - | | |
$ | 0.2 | | |
|
| Cash paid during the period for income taxes | |
$ | - | | |
$ | - | | |
$ | - | | |
|
| Cash paid during the period for operating leases | |
$ | 0.9 | | |
$ | 0.8 | | |
$ | 1.7 | | |
|
| | |
| | | |
| | | |
| | | |
|
| Supplemental disclosure of noncash investing and financing activities | |
| | | |
| | | |
| | | |
|
| Property and equipment acquired through finance lease | |
$ | - | | |
$ | - | | |
$ | - | | |
|
| Property and equipment transferred to inventory | |
$ | 0.6 | | |
$ | - | | |
$ | 0.6 | | |
|
|
| X |
- References
+ Details
| Name: |
us-gaap_AccountingChangesAndErrorCorrectionsAbstract |
| Namespace Prefix: |
us-gaap_ |
| Data Type: |
xbrli:stringItemType |
| Balance Type: |
na |
| Period Type: |
duration |
|
| X |
- DefinitionThe entire disclosure for reporting error correction. Reference 1: http://www.xbrl.org/2003/role/disclosureRef
-Topic 250
-SubTopic 10
-Name Accounting Standards Codification
-Section 50
-Paragraph 7
-Publisher FASB
-URI https://asc.fasb.org//1943274/2147483443/250-10-50-7
| Name: |
us-gaap_ErrorCorrectionTextBlock |
| Namespace Prefix: |
us-gaap_ |
| Data Type: |
dtr-types:textBlockItemType |
| Balance Type: |
na |
| Period Type: |
duration |
|
v3.24.0.1
Acquisitions and Disposals
|
3 Months Ended |
Mar. 31, 2023 |
|---|
| Business Combination and Asset Acquisition [Abstract] |
|
| Acquisitions and Disposals |
3.
Acquisitions and Disposals
In
January 2022, the Company sold its Italian VLT business, including all terminal and other assets, staff costs and facilities and contracts
to a non-connected party for total proceeds of €1.1 million ($1.3 million), recognizing a profit on disposal of €0.8 million
($0.9 million). The Company continues to serve these Italian markets in the form of the provision of platform and games.
|
| X |
- References
+ Details
| Name: |
us-gaap_BusinessCombinationAndAssetAcquisitionAbstract |
| Namespace Prefix: |
us-gaap_ |
| Data Type: |
xbrli:stringItemType |
| Balance Type: |
na |
| Period Type: |
duration |
|
| X |
- DefinitionThe entire disclosure for a business combination (or series of individually immaterial business combinations) completed during the period, including background, timing, and recognized assets and liabilities. The disclosure may include leverage buyout transactions (as applicable). Reference 1: http://www.xbrl.org/2003/role/disclosureRef
-Topic 805
-SubTopic 20
-Name Accounting Standards Codification
-Section 50
-Paragraph 5
-Subparagraph (b)
-Publisher FASB
-URI https://asc.fasb.org//1943274/2147479907/805-20-50-5
Reference 2: http://fasb.org/us-gaap/role/ref/legacyRef
-Topic 805
-Name Accounting Standards Codification
-Publisher FASB
-URI https://asc.fasb.org//805/tableOfContent
| Name: |
us-gaap_BusinessCombinationDisclosureTextBlock |
| Namespace Prefix: |
us-gaap_ |
| Data Type: |
dtr-types:textBlockItemType |
| Balance Type: |
na |
| Period Type: |
duration |
|
v3.24.0.1
Allowance for Credit Losses, as restated
|
3 Months Ended |
Mar. 31, 2023 |
|---|
| Receivables [Abstract] |
|
| Allowance for Credit Losses, as restated |
4.
Allowance for Credit Losses, as restated
Changes
in the allowance for doubtful accounts are as follows:
Schedule
of Changes in Allowance for Doubtful accounts
| | |
March
31, 2023 | | |
December
31, 2022 | |
| | |
(in millions) | |
| Beginning balance | |
$ | (1.4 | ) | |
$ | (1.8 | ) |
| Additional provision for doubtful accounts | |
| (0.1 | ) | |
| (0.2 | ) |
| Recoveries | |
| 0.1 | | |
| — | |
| Write offs | |
| — | | |
| 0.4 | |
| Foreign currency translation adjustments | |
| — | | |
| 0.2 | |
| Ending balance | |
$ | (1.4 | ) | |
$ | (1.4 | ) |
|
| X |
- DefinitionThe entire disclosure for allowance for credit losses. Reference 1: http://fasb.org/us-gaap/role/ref/legacyRef
-Name Accounting Standards Codification
-Topic 310
-Publisher FASB
-URI https://asc.fasb.org//310/tableOfContent
| Name: |
us-gaap_AllowanceForCreditLossesTextBlock |
| Namespace Prefix: |
us-gaap_ |
| Data Type: |
dtr-types:textBlockItemType |
| Balance Type: |
na |
| Period Type: |
duration |
|
| X |
- References
+ Details
| Name: |
us-gaap_ReceivablesAbstract |
| Namespace Prefix: |
us-gaap_ |
| Data Type: |
xbrli:stringItemType |
| Balance Type: |
na |
| Period Type: |
duration |
|
v3.24.0.1
Inventory, as restated
|
3 Months Ended |
Mar. 31, 2023 |
|---|
| Inventory Disclosure [Abstract] |
|
| Inventory, as restated |
5.
Inventory, as restated
Schedule
of Inventory
| | |
March
31, 2023 | | |
December
31, 2022 | |
| | |
(in millions) | |
| Component parts | |
$ | 21.4 | | |
$ | 20.7 | |
| Work in progress | |
| 2.9 | | |
| 3.6 | |
| Finished goods | |
| 10.3 | | |
| 6.0 | |
| Total inventories | |
$ | 34.6 | | |
$ | 30.3 | |
Component
parts include parts for gaming terminals. Our finished goods inventory primarily consists of gaming terminals which are ready for sale.
|
| X |
- References
+ Details
| Name: |
us-gaap_InventoryDisclosureAbstract |
| Namespace Prefix: |
us-gaap_ |
| Data Type: |
xbrli:stringItemType |
| Balance Type: |
na |
| Period Type: |
duration |
|
| X |
- DefinitionThe entire disclosure for inventory. Includes, but is not limited to, the basis of stating inventory, the method of determining inventory cost, the classes of inventory, and the nature of the cost elements included in inventory. Reference 1: http://www.xbrl.org/2003/role/disclosureRef
-Topic 330
-Name Accounting Standards Codification
-Publisher FASB
-URI https://asc.fasb.org//330/tableOfContent
| Name: |
us-gaap_InventoryDisclosureTextBlock |
| Namespace Prefix: |
us-gaap_ |
| Data Type: |
dtr-types:textBlockItemType |
| Balance Type: |
na |
| Period Type: |
duration |
|
v3.24.0.1
Contract Liabilities and Other Disclosures, as restated
|
3 Months Ended |
Mar. 31, 2023 |
|---|
| Contract Liabilities And Other Disclosures As Restated |
|
| Contract Liabilities and Other Disclosures, as restated |
6.
Contract Liabilities and Other Disclosures, as restated
The
following table summarizes contract related balances:
Schedule
of Contract Related Balances
| | |
Accounts Receivable | | |
Unbilled Accounts Receivable | | |
Deferred Income | | |
Customer Prepayments and Deposits | |
| | |
(in millions) | |
| At March 31, 2023 | |
$ | 36.7 | | |
$ | 15.4 | | |
$ | (7.2 | ) | |
$ | (2.6 | ) |
| At December 31, 2022 | |
$ | 44.6 | | |
$ | 18.0 | | |
$ | (7.4 | ) | |
$ | (2.4 | ) |
Revenue
recognized that was included in the deferred income balance at the beginning of the period amounted to $1.2 million and $2.5 million
for the three months ended March 31, 2023 and 2022, respectively.
For
the periods ended March 31, 2023 and 2022 respectively, there was
no significant amounts of revenue recognized as a result of changes in contract transaction
price related to performance obligations that were satisfied in the respective prior periods.
|
| X |
- DefinitionContract Liabilities And Other Disclosures [Text Block]
| Name: |
INSE_ContractLiabilitiesAndOtherDisclosuresTextBlock |
| Namespace Prefix: |
INSE_ |
| Data Type: |
dtr-types:textBlockItemType |
| Balance Type: |
na |
| Period Type: |
duration |
|
| X |
- References
+ Details
| Name: |
INSE_DisclosureContractLiabilitiesAndOtherDisclosuresAsRestatedAbstract |
| Namespace Prefix: |
INSE_ |
| Data Type: |
xbrli:stringItemType |
| Balance Type: |
na |
| Period Type: |
duration |
|
v3.24.0.1
Stock-Based Compensation
|
3 Months Ended |
Mar. 31, 2023 |
|---|
| Share-Based Payment Arrangement [Abstract] |
|
| Stock-Based Compensation |
7.
Stock-Based Compensation
A
summary of the Company’s RSU activity during the three months ended March 31, 2023 is as follows:
Schedule of Restricted Stock Unit Activity
| | |
Number of Shares | |
| | |
| |
| Unvested Outstanding at January 1, 2023 | |
| 1,647,544 | |
| Granted (1) | |
| 495,225 | |
| Forfeited | |
| (6,266 | ) |
| Vested | |
| (219,272 | ) |
| Unvested Outstanding at March 31, 2023 | |
| 1,917,231 | |
| (1) |
The
amount shown as granted in the table includes 219,213 performance-based target RSUs as to which the number that ultimately vests
would range from 0% to 200% of the target amount of RSUs (a maximum of 438,426 RSUs based on attainment of Adjusted EBITDA targets
for 2023). |
The
Company issued a total of 353,554 shares during the three months ended March 31, 2023 which included an aggregate of 332,227 shares issued
in connection with the net settlement of RSUs that vested during the prior year (on December 30, 2022).
|
| X |
- DefinitionThe entire disclosure for share-based payment arrangement. Reference 1: http://www.xbrl.org/2003/role/exampleRef
-Topic 718
-SubTopic 10
-Name Accounting Standards Codification
-Section 50
-Paragraph 2
-Subparagraph (a)(1)
-Publisher FASB
-URI https://asc.fasb.org//1943274/2147480429/718-10-50-2
Reference 2: http://www.xbrl.org/2003/role/disclosureRef
-Topic 718
-Name Accounting Standards Codification
-Publisher FASB
-URI https://asc.fasb.org//718/tableOfContent
Reference 3: http://www.xbrl.org/2003/role/disclosureRef
-Topic 718
-SubTopic 10
-Name Accounting Standards Codification
-Section 50
-Paragraph 2
-Subparagraph (a)
-Publisher FASB
-URI https://asc.fasb.org//1943274/2147480429/718-10-50-2
Reference 4: http://www.xbrl.org/2003/role/disclosureRef
-Topic 718
-SubTopic 10
-Name Accounting Standards Codification
-Section 50
-Paragraph 2
-Subparagraph (h)(2)
-Publisher FASB
-URI https://asc.fasb.org//1943274/2147480429/718-10-50-2
Reference 5: http://www.xbrl.org/2003/role/disclosureRef
-Topic 718
-SubTopic 10
-Name Accounting Standards Codification
-Section 50
-Paragraph 2
-Subparagraph (h)(2)(i)
-Publisher FASB
-URI https://asc.fasb.org//1943274/2147480429/718-10-50-2
Reference 6: http://www.xbrl.org/2003/role/disclosureRef
-Topic 718
-SubTopic 10
-Name Accounting Standards Codification
-Section 50
-Paragraph 2
-Subparagraph (l)
-Publisher FASB
-URI https://asc.fasb.org//1943274/2147480429/718-10-50-2
| Name: |
us-gaap_DisclosureOfCompensationRelatedCostsShareBasedPaymentsTextBlock |
| Namespace Prefix: |
us-gaap_ |
| Data Type: |
dtr-types:textBlockItemType |
| Balance Type: |
na |
| Period Type: |
duration |
|
v3.24.0.1
Accumulated Other Comprehensive Loss (Income), as restated
|
3 Months Ended |
Mar. 31, 2023 |
|---|
| Equity [Abstract] |
|
| Accumulated Other Comprehensive Loss (Income), as restated |
8.
Accumulated Other Comprehensive Loss (Income), as restated
The
accumulated balances for each classification of comprehensive loss (income) are presented below:
Schedule of Accumulated Other Comprehensive Loss (Income)
| | |
Foreign Currency Translation Adjustments | | |
Change in Fair Value of Hedging Instrument | | |
Unrecognized Pension Benefit Costs | | |
Accumulated Other Comprehensive (Income) | |
| | |
(in millions) | |
| Balance at January 1, 2023 | |
| (84.2 | ) | |
| 0.3 | | |
| 33.1 | | |
| (50.8 | ) |
| Change during the period | |
| 2.9 | | |
| (0.2 | ) | |
| (0.2 | ) | |
| 2.5 | |
| Balance at March 31, 2023 | |
$ | (81.3 | ) | |
$ | 0.1 | | |
$ | 32.9 | | |
$ | (48.3 | ) |
| | |
Foreign Currency Translation Adjustments | | |
Change in Fair Value of Hedging Instrument | | |
Unrecognized Pension Benefit Costs | | |
Accumulated Other Comprehensive (Income) | |
| | |
(in millions) | |
| Balance at January 1, 2022 | |
| (71.5 | ) | |
| 1.0 | | |
| 26.7 | | |
| (43.8 | ) |
| Change during the period | |
| (3.5 | ) | |
| (0.2 | ) | |
| (0.1 | ) | |
| (3.8 | ) |
| Balance at March 31, 2022 | |
$ | (75.0 | ) | |
$ | 0.8 | | |
$ | 26.6 | | |
$ | (47.6 | ) |
In
connection with the issuance of Senior Secured Notes and the entry into an RCF Agreement, on May 19, 2021, the Company terminated all
of its interest rate swaps. Accordingly, hedge accounting is no longer applicable. The amounts previously recorded in Accumulated Other
Comprehensive Income are amortized into Interest expense over the terms of the hedged forecasted interest payments. Losses reclassified
from Accumulated Other Comprehensive Income into Interest expense in the Consolidated Statements of Operations and Income for the three
months ended March 31, 2023 and March 31, 2022 amounted to $0.2 million and $0.2 million, respectively.
|
| X |
- DefinitionThe entire disclosure for comprehensive income, which includes, but is not limited to, 1) the amount of income tax expense or benefit allocated to each component of other comprehensive income, including reclassification adjustments, 2) the reclassification adjustments for each classification of other comprehensive income and 3) the ending accumulated balances for each component of comprehensive income. Reference 1: http://www.xbrl.org/2003/role/disclosureRef
-Topic 944
-SubTopic 220
-Name Accounting Standards Codification
-Section S99
-Paragraph 1
-Subparagraph (SX 210.7-04(19))
-Publisher FASB
-URI https://asc.fasb.org//1943274/2147483586/944-220-S99-1
Reference 2: http://www.xbrl.org/2003/role/disclosureRef
-Topic 220
-SubTopic 10
-Name Accounting Standards Codification
-Section S99
-Paragraph 2
-Subparagraph (SX 210.5-03(21))
-Publisher FASB
-URI https://asc.fasb.org//1943274/2147483621/220-10-S99-2
Reference 3: http://www.xbrl.org/2003/role/disclosureRef
-Topic 942
-SubTopic 220
-Name Accounting Standards Codification
-Section S99
-Paragraph 1
-Subparagraph (SX 210.9-04(23))
-Publisher FASB
-URI https://asc.fasb.org//1943274/2147483589/942-220-S99-1
Reference 4: http://fasb.org/us-gaap/role/ref/legacyRef
-Topic 220
-Name Accounting Standards Codification
-Publisher FASB
-URI https://asc.fasb.org//220/tableOfContent
| Name: |
us-gaap_ComprehensiveIncomeNoteTextBlock |
| Namespace Prefix: |
us-gaap_ |
| Data Type: |
dtr-types:textBlockItemType |
| Balance Type: |
na |
| Period Type: |
duration |
|
| X |
- References
+ Details
| Name: |
us-gaap_EquityAbstract |
| Namespace Prefix: |
us-gaap_ |
| Data Type: |
xbrli:stringItemType |
| Balance Type: |
na |
| Period Type: |
duration |
|
v3.24.0.1
Net Earnings (Loss) per Share, as restated
|
3 Months Ended |
Mar. 31, 2023 |
|---|
| Earnings Per Share [Abstract] |
|
| Net Earnings (Loss) per Share, as restated |
9.
Net Earnings (Loss) per Share, as restated
Basic
income/(loss) per share (“EPS”) is computed by dividing net income/(loss) attributable to common stockholders by the weighted
average number of common shares outstanding during the period, excluding the effects of any potentially dilutive securities. Diluted
EPS gives effect to all dilutive potential shares of common stock outstanding during the period, including RSUs, using the treasury stock
method, and convertible debt or convertible preferred stock, using the if-converted method, unless the inclusion would be anti-dilutive.
The
computation of diluted EPS excludes the common stock equivalents of the following potentially dilutive securities because they were either
contingently issuable shares or because their inclusion would be anti-dilutive:
Schedule of Anti-dilutive Securities Excluded from Computation of Earnings per Share
| | |
2023 | | |
2022 | |
| | |
Three Months Ended March 31, | |
| | |
2023 | | |
2022 | |
| RSUs | |
$ | 1,917,231 | | |
$ | 695,372 | |
The
following table reconciles the numerators and denominators of the basic and diluted EPS computations for the three months ended March
31, 2022. There were no reconciling items for the three months ended March 31, 2023.
Schedule
of Numerators and Denominators of the Basic and Diluted EPS Computations
| | |
Income
(Numerator) | | |
Shares
(Denominator) | | |
Per-Share Amount,
Three Months
Ended
March 31, 2022 | |
| | |
(in
millions) | | |
| | |
| |
| Basic EPS | |
| | | |
| | | |
| | |
| Income available to common stockholders | |
$ | 1.5 | | |
| 28,437,052 | | |
$ | 0.05 | |
| Effect of Dilutive Securities | |
| | | |
| | | |
| | |
| RSUs | |
| — | | |
| 925,330 | | |
| — | |
| Diluted EPS | |
| | | |
| | | |
| | |
| Income available to common stockholders | |
$ | 1.5 | | |
$ | 29,362,382 | | |
$ | 0.05 | |
The calculation of Basic EPS includes the effects
of 1,893,136 and 1,591,632 shares for the three months ended March 31 2023 and 2022, respectively, with respect to RSU awards that have
vested but have not yet been issued.
|
| X |
- References
+ Details
| Name: |
us-gaap_EarningsPerShareAbstract |
| Namespace Prefix: |
us-gaap_ |
| Data Type: |
xbrli:stringItemType |
| Balance Type: |
na |
| Period Type: |
duration |
|
| X |
- DefinitionThe entire disclosure for earnings per share. Reference 1: http://www.xbrl.org/2003/role/disclosureRef
-Topic 260
-SubTopic 10
-Name Accounting Standards Codification
-Section 50
-Paragraph 1
-Subparagraph (c)
-Publisher FASB
-URI https://asc.fasb.org//1943274/2147482662/260-10-50-1
Reference 2: http://www.xbrl.org/2003/role/disclosureRef
-Topic 260
-Name Accounting Standards Codification
-Publisher FASB
-URI https://asc.fasb.org//260/tableOfContent
Reference 3: http://www.xbrl.org/2003/role/disclosureRef
-Topic 260
-SubTopic 10
-Name Accounting Standards Codification
-Section 50
-Paragraph 2
-Publisher FASB
-URI https://asc.fasb.org//1943274/2147482662/260-10-50-2
Reference 4: http://www.xbrl.org/2003/role/disclosureRef
-Topic 260
-SubTopic 10
-Name Accounting Standards Codification
-Section 50
-Paragraph 3
-Publisher FASB
-URI https://asc.fasb.org//1943274/2147482662/260-10-50-3
| Name: |
us-gaap_EarningsPerShareTextBlock |
| Namespace Prefix: |
us-gaap_ |
| Data Type: |
dtr-types:textBlockItemType |
| Balance Type: |
na |
| Period Type: |
duration |
|
v3.24.0.1
Other Finance Income (Expense)
|
3 Months Ended |
Mar. 31, 2023 |
|---|
| Other Income and Expenses [Abstract] |
|
| Other Finance Income (Expense) |
10.
Other Finance Income (Expense)
Other
finance income (expense) consisted of the following:
Schedule of Other Finance Income (expense)
| | |
2023 | | |
2022 | |
| | |
Three Months Ended March 31, | |
| | |
2023 | | |
2022 | |
| | |
(in millions) | |
| Pension interest cost | |
$ | (0.8 | ) | |
$ | (0.6 | ) |
| Expected return on pension plan assets | |
| 0.9 | | |
| 0.9 | |
| Other finance income
(expense) | |
$ | 0.1 | | |
$ | 0.3 | |
|
| X |
- References
+ Details
| Name: |
us-gaap_OtherIncomeAndExpensesAbstract |
| Namespace Prefix: |
us-gaap_ |
| Data Type: |
xbrli:stringItemType |
| Balance Type: |
na |
| Period Type: |
duration |
|
| X |
- DefinitionThe entire disclosure for other income or other expense items (both operating and nonoperating). Sources of nonoperating income or nonoperating expense that may be disclosed, include amounts earned from dividends, interest on securities, profits (losses) on securities, net and miscellaneous other income or income deductions. Reference 1: http://fasb.org/us-gaap/role/ref/legacyRef
-Topic 610
-Name Accounting Standards Codification
-Publisher FASB
-URI https://asc.fasb.org//610/tableOfContent
Reference 2: http://fasb.org/us-gaap/role/ref/legacyRef
-Topic 720
-Name Accounting Standards Codification
-Publisher FASB
-URI https://asc.fasb.org//720/tableOfContent
| Name: |
us-gaap_OtherIncomeAndOtherExpenseDisclosureTextBlock |
| Namespace Prefix: |
us-gaap_ |
| Data Type: |
dtr-types:textBlockItemType |
| Balance Type: |
na |
| Period Type: |
duration |
|
v3.24.0.1
Income Taxes, as restated
|
3 Months Ended |
Mar. 31, 2023 |
|---|
| Income Tax Disclosure [Abstract] |
|
| Income Taxes, as restated |
11.
Income Taxes, as restated
The
effective income tax rate for the three months ended March 31, 2023 and 2022 was 13.2% and 5.3%, as restated, respectively, resulting in a $0.2 million
income tax benefit and $0.1 million income tax expense, respectively.
The
effective tax rate reported in any given year will continue to be influenced by a variety of factors including the level of pre-tax income
or loss, the income mix between jurisdictions, and any discrete items that may occur.
The
Company recorded a valuation allowance against all of our deferred tax assets as of both March 31, 2023 and 2022. We intend to continue
maintaining a full valuation allowance on our deferred tax assets until there is sufficient evidence to support the reversal of all or
some portion of these allowances. However, given our current earnings and anticipated future earnings, we believe that there is a reasonable
possibility that within the next 12 months, sufficient positive evidence may become available to allow us to reach a conclusion that
a significant portion of the valuation allowance will no longer be needed. Release of the valuation allowance would result in the recognition
of certain deferred tax assets and a decrease to income tax expense for the period the release is recorded. However, the exact timing
and amount of the valuation allowance release are subject to change on the basis of the level of profitability that we are able to actually
achieve.
|
| X |
- DefinitionThe entire disclosure for income taxes. Disclosures may include net deferred tax liability or asset recognized in an enterprise's statement of financial position, net change during the year in the total valuation allowance, approximate tax effect of each type of temporary difference and carryforward that gives rise to a significant portion of deferred tax liabilities and deferred tax assets, utilization of a tax carryback, and tax uncertainties information. Reference 1: http://www.xbrl.org/2003/role/disclosureRef
-Topic 946
-SubTopic 20
-Name Accounting Standards Codification
-Section 50
-Paragraph 13
-Publisher FASB
-URI https://asc.fasb.org//1943274/2147480990/946-20-50-13
Reference 2: http://www.xbrl.org/2003/role/disclosureRef
-Topic 235
-SubTopic 10
-Name Accounting Standards Codification
-Section S99
-Paragraph 1
-Subparagraph (SX 210.4-08(h)(2))
-Publisher FASB
-URI https://asc.fasb.org//1943274/2147480678/235-10-S99-1
Reference 3: http://www.xbrl.org/2003/role/disclosureRef
-Topic 740
-Name Accounting Standards Codification
-Publisher FASB
-URI https://asc.fasb.org//740/tableOfContent
Reference 4: http://www.xbrl.org/2003/role/disclosureRef
-Topic 740
-SubTopic 10
-Name Accounting Standards Codification
-Section 50
-Paragraph 14
-Publisher FASB
-URI https://asc.fasb.org//1943274/2147482685/740-10-50-14
Reference 5: http://www.xbrl.org/2003/role/disclosureRef
-Topic 740
-SubTopic 10
-Name Accounting Standards Codification
-Section 50
-Paragraph 21
-Publisher FASB
-URI https://asc.fasb.org//1943274/2147482685/740-10-50-21
Reference 6: http://www.xbrl.org/2003/role/disclosureRef
-Topic 740
-SubTopic 270
-Name Accounting Standards Codification
-Section 50
-Paragraph 1
-Publisher FASB
-URI https://asc.fasb.org//1943274/2147482526/740-270-50-1
Reference 7: http://www.xbrl.org/2003/role/disclosureRef
-Topic 740
-SubTopic 10
-Name Accounting Standards Codification
-Section 50
-Paragraph 17
-Subparagraph (b)
-Publisher FASB
-URI https://asc.fasb.org//1943274/2147482685/740-10-50-17
Reference 8: http://www.xbrl.org/2003/role/disclosureRef
-Topic 740
-SubTopic 10
-Name Accounting Standards Codification
-Section S99
-Paragraph 1
-Subparagraph (SAB TOPIC 6.I.5.Q1)
-Publisher FASB
-URI https://asc.fasb.org//1943274/2147479360/740-10-S99-1
Reference 9: http://www.xbrl.org/2003/role/disclosureRef
-Topic 740
-SubTopic 10
-Name Accounting Standards Codification
-Section S99
-Paragraph 2
-Subparagraph (SAB Topic 11.C)
-Publisher FASB
-URI https://asc.fasb.org//1943274/2147479360/740-10-S99-2
Reference 10: http://www.xbrl.org/2003/role/disclosureRef
-Topic 740
-SubTopic 30
-Name Accounting Standards Codification
-Section 50
-Paragraph 2
-Subparagraph (a)
-Publisher FASB
-URI https://asc.fasb.org//1943274/2147482603/740-30-50-2
| Name: |
us-gaap_IncomeTaxDisclosureTextBlock |
| Namespace Prefix: |
us-gaap_ |
| Data Type: |
dtr-types:textBlockItemType |
| Balance Type: |
na |
| Period Type: |
duration |
|
v3.24.0.1
Related Parties
|
3 Months Ended |
Mar. 31, 2023 |
|---|
| Related Party Transactions [Abstract] |
|
| Related Parties |
12.
Related Parties
Macquarie
Corporate Holdings Pty Limited (UK Branch) (“Macquarie UK”), (an arranger and lending party under our RCF Agreement) is an
affiliate of MIHI LLC, which beneficially owned approximately 11.51% of our common stock as of March 31, 2023. Macquarie UK did not hold
any of the Company’s aggregate senior debt at March 31, 2023 or December 31, 2022. Interest expense payable to Macquarie UK for
the three months ended March 31, 2023 and 2022 amounted to $0.0 million and $0.0 million, respectively. MIHI LLC is also a party to a
stockholders agreement with the Company and other stockholders, dated December 23, 2016, pursuant to which, subject to certain conditions,
MIHI LLC, jointly with Hydra Industries Sponsor LLC, are permitted to designate two directors to be nominated for election as directors
of the Company at any annual or special meeting of stockholders at which directors are to be elected, until such time as MIHI LLC and
Hydra Industries Sponsor LLC in the aggregate hold less than 5% of the outstanding shares of the Company.
On
December 31, 2021, the Company entered into a consultancy agreement with Richard Weil, the brother of A. Lorne Weil, our Executive Chairman,
under which he received a success fee in the amount of $0.1 million for services he provided in connection with our acquisition of Sportech
Lotteries, LLC. The success fee was paid during the year ended December 31, 2022. Under the agreement, as extended in November 2022,
he will provide consulting services relating to the lottery in the Dominican Republic through to June 30, 2023 at a rate of $10,000 per
month and, with respect to such services, the aggregate amount incurred by the Company in consulting fees for each of the three months
ended March 31, 2023 and March 31, 2022 was $30,000.
|
| X |
- DefinitionThe entire disclosure for related party transactions. Examples of related party transactions include transactions between (a) a parent company and its subsidiary; (b) subsidiaries of a common parent; (c) and entity and its principal owners; and (d) affiliates. Reference 1: http://www.xbrl.org/2003/role/disclosureRef
-Topic 946
-SubTopic 20
-Name Accounting Standards Codification
-Section 50
-Paragraph 2
-Publisher FASB
-URI https://asc.fasb.org//1943274/2147480990/946-20-50-2
Reference 2: http://www.xbrl.org/2003/role/disclosureRef
-Topic 946
-SubTopic 20
-Name Accounting Standards Codification
-Section 50
-Paragraph 5
-Publisher FASB
-URI https://asc.fasb.org//1943274/2147480990/946-20-50-5
Reference 3: http://www.xbrl.org/2003/role/disclosureRef
-Topic 946
-SubTopic 20
-Name Accounting Standards Codification
-Section 50
-Paragraph 6
-Publisher FASB
-URI https://asc.fasb.org//1943274/2147480990/946-20-50-6
Reference 4: http://www.xbrl.org/2003/role/disclosureRef
-Topic 946
-SubTopic 235
-Name Accounting Standards Codification
-Section 50
-Paragraph 2
-Subparagraph (c)
-Publisher FASB
-URI https://asc.fasb.org//1943274/2147481062/946-235-50-2
Reference 5: http://www.xbrl.org/2003/role/disclosureRef
-Topic 946
-SubTopic 235
-Name Accounting Standards Codification
-Section 50
-Paragraph 2
-Subparagraph (e)
-Publisher FASB
-URI https://asc.fasb.org//1943274/2147481062/946-235-50-2
Reference 6: http://www.xbrl.org/2003/role/disclosureRef
-Topic 850
-SubTopic 10
-Name Accounting Standards Codification
-Section 50
-Paragraph 1
-Subparagraph (d)
-Publisher FASB
-URI https://asc.fasb.org//1943274/2147483326/850-10-50-1
Reference 7: http://www.xbrl.org/2003/role/disclosureRef
-Topic 946
-SubTopic 220
-Name Accounting Standards Codification
-Section S99
-Paragraph 1
-Subparagraph (SX 210.6-07(2)(g)(3))
-Publisher FASB
-URI https://asc.fasb.org//1943274/2147483575/946-220-S99-1
Reference 8: http://www.xbrl.org/2003/role/disclosureRef
-Topic 946
-SubTopic 220
-Name Accounting Standards Codification
-Section S99
-Paragraph 1
-Subparagraph (SX 210.6-07(2)(c))
-Publisher FASB
-URI https://asc.fasb.org//1943274/2147483575/946-220-S99-1
Reference 9: http://www.xbrl.org/2003/role/disclosureRef
-Topic 946
-SubTopic 220
-Name Accounting Standards Codification
-Section S99
-Paragraph 1
-Subparagraph (SX 210.6-07(2)(e))
-Publisher FASB
-URI https://asc.fasb.org//1943274/2147483575/946-220-S99-1
Reference 10: http://www.xbrl.org/2003/role/disclosureRef
-Topic 850
-Name Accounting Standards Codification
-Publisher FASB
-URI https://asc.fasb.org//850/tableOfContent
Reference 11: http://www.xbrl.org/2003/role/disclosureRef
-Topic 850
-SubTopic 10
-Name Accounting Standards Codification
-Section 50
-Paragraph 6
-Publisher FASB
-URI https://asc.fasb.org//1943274/2147483326/850-10-50-6
Reference 12: http://www.xbrl.org/2003/role/disclosureRef
-Topic 850
-SubTopic 10
-Name Accounting Standards Codification
-Section 50
-Paragraph 1
-Subparagraph (a)
-Publisher FASB
-URI https://asc.fasb.org//1943274/2147483326/850-10-50-1
Reference 13: http://www.xbrl.org/2003/role/disclosureRef
-Topic 850
-SubTopic 10
-Name Accounting Standards Codification
-Section 50
-Paragraph 1
-Subparagraph (b)
-Publisher FASB
-URI https://asc.fasb.org//1943274/2147483326/850-10-50-1
| Name: |
us-gaap_RelatedPartyTransactionsDisclosureTextBlock |
| Namespace Prefix: |
us-gaap_ |
| Data Type: |
dtr-types:textBlockItemType |
| Balance Type: |
na |
| Period Type: |
duration |
|
v3.24.0.1
Leases, as restated
|
3 Months Ended |
Mar. 31, 2023 |
|---|
| Leases [Abstract] |
|
| Leases, as restated |
13.
Leases, as restated
Certain
of our arrangements include leases for equipment installed at customer locations. As the lessor, we combine lease and non-lease components
for all classes of underlying assets in arrangements that involve operating leases. The single combined component is accounted for under
ASC 606, Revenue from Contracts with Customers based on the consideration that the non-lease components are the predominant items
in the arrangements. If a component cannot be combined, the consideration is allocated between the lease component and the non-lease
component based on relative standalone selling price. The lease component is accounted for under ASC 842, Leases and the non-lease
component is accounted for under ASC 606.
Lease
income from operating leases and from sales type leases is not material for any of the periods presented.
|
| X |
- References
+ Details
| Name: |
us-gaap_LeasesAbstract |
| Namespace Prefix: |
us-gaap_ |
| Data Type: |
xbrli:stringItemType |
| Balance Type: |
na |
| Period Type: |
duration |
|
| X |
- DefinitionThe entire disclosure for operating leases of lessee. Includes, but is not limited to, description of operating lease and maturity analysis of operating lease liability. Reference 1: http://www.xbrl.org/2003/role/disclosureRef
-Topic 842
-SubTopic 20
-Name Accounting Standards Codification
-Publisher FASB
-URI https://asc.fasb.org//842-20/tableOfContent
| Name: |
us-gaap_LesseeOperatingLeasesTextBlock |
| Namespace Prefix: |
us-gaap_ |
| Data Type: |
dtr-types:textBlockItemType |
| Balance Type: |
na |
| Period Type: |
duration |
|
v3.24.0.1
Commitments and Contingencies
|
3 Months Ended |
Mar. 31, 2023 |
|---|
| Commitments and Contingencies Disclosure [Abstract] |
|
| Commitments and Contingencies |
14.
Commitments and Contingencies
Employment
Agreements
We
are party to employment agreements with our executive officers and other employees of the Company and our subsidiaries which contain,
among other terms, provisions relating to severance and notice requirements.
Arrangements
with Daniel B. Silvers, former Executive Vice President and Chief Strategy Officer
Effective
January 10, 2023, Mr. Silvers stepped down from his position as Executive Vice President and Chief Strategy Officer of the Company. Pursuant
to Mr. Silvers’ employment agreement dated December 14, 2016, as amended, Mr. Silvers was entitled to receive a base salary at
a rate of $385,000 per year, a target annual bonus of not less than 100% of his base salary and a maximum annual bonus of 200% of his
base salary. He was also entitled to reimbursement for private medical insurance and to certain severance benefits.
Legal
Matters
From
time to time, the Company may become involved in lawsuits and legal matters arising in the ordinary course of business. While the Company
believes that, currently, it has no such matters that are material, there can be no assurance that existing or new matters arising in
the ordinary course of business will not have a material adverse effect on the Company’s business, financial condition or results
of operations.
|
| X |
- References
+ Details
| Name: |
us-gaap_CommitmentsAndContingenciesDisclosureAbstract |
| Namespace Prefix: |
us-gaap_ |
| Data Type: |
xbrli:stringItemType |
| Balance Type: |
na |
| Period Type: |
duration |
|
| X |
- DefinitionThe entire disclosure for commitments and contingencies. Reference 1: http://www.xbrl.org/2003/role/disclosureRef
-Topic 440
-SubTopic 10
-Name Accounting Standards Codification
-Section 50
-Paragraph 4
-Subparagraph (a)
-Publisher FASB
-URI https://asc.fasb.org//1943274/2147482648/440-10-50-4
Reference 2: http://www.xbrl.org/2009/role/commonPracticeRef
-Topic 450
-Name Accounting Standards Codification
-Publisher FASB
-URI https://asc.fasb.org//450/tableOfContent
Reference 3: http://www.xbrl.org/2003/role/disclosureRef
-Topic 954
-SubTopic 440
-Name Accounting Standards Codification
-Section 50
-Paragraph 1
-Subparagraph (a)
-Publisher FASB
-URI https://asc.fasb.org//1943274/2147480327/954-440-50-1
Reference 4: http://www.xbrl.org/2003/role/disclosureRef
-Topic 440
-SubTopic 10
-Name Accounting Standards Codification
-Section 50
-Paragraph 4
-Subparagraph (c)
-Publisher FASB
-URI https://asc.fasb.org//1943274/2147482648/440-10-50-4
Reference 5: http://fasb.org/us-gaap/role/ref/legacyRef
-Topic 440
-Name Accounting Standards Codification
-Publisher FASB
-URI https://asc.fasb.org//440/tableOfContent
| Name: |
us-gaap_CommitmentsAndContingenciesDisclosureTextBlock |
| Namespace Prefix: |
us-gaap_ |
| Data Type: |
dtr-types:textBlockItemType |
| Balance Type: |
na |
| Period Type: |
duration |
|
v3.24.0.1
Pension Plan, as restated
|
3 Months Ended |
Mar. 31, 2023 |
|---|
| Retirement Benefits [Abstract] |
|
| Pension Plan, as restated |
15.
Pension Plan, as restated
We
operate a defined contribution plan in the US, and both defined benefit and defined contribution pension schemes in the UK. The defined
contribution scheme assets are held separately from those of the Company in independently administered funds.
Defined
Benefit Pension Scheme
The
defined benefit scheme has been closed to new entrants since April 1, 1999 and closed to future accruals for services rendered to the
Company for the entire financial statement periods presented. The Actuarial Valuation of the scheme as at March 31, 2021, determined
that the statutory funding objective was not met, i.e., there were insufficient assets to cover the scheme’s technical provisions
and there was a funding shortfall.
In
June 2022, a recovery plan was put in place to eliminate the funding shortfall. The plan expects the shortfall to be eliminated by October
31, 2026. Deficit reduction contributions of 1.1 million and expense contributions of $0.3 million will be payable during the year ending
December 31, 2023.
The
total amount of employer contributions paid during the three months ended March 31, 2023 amounted to $0.3 million.
The
following table presents the components of our net periodic pension benefit:
Schedule of Defined Benefit Plans
| | |
2023 | | |
2022 | |
| | |
Three Months Ended March 31, | |
| | |
2023 | | |
2022 | |
| | |
(in millions) | |
| Components of net periodic pension benefit: | |
| | |
| |
| Interest cost | |
$ | 0.8 | | |
$ | 0.6 | |
| Expected return on plan assets | |
| (0.9 | ) | |
| (0.9 | ) |
| Amortization of net loss | |
| 0.2 | | |
| 0.1 | |
| Net periodic benefit | |
$ | 0.1 | | |
$ | (0.2 | ) |
The
following table sets forth the estimate of the combined funded status of the pension plans and their reconciliation to the related amounts
recognized in our consolidated financial statements at the respective measurement dates:
Schedule of Pension Plans and their Reconciliation
| | |
March
31, 2023 | | |
December
31, 2022 | |
| | |
(in millions) | |
| Change in benefit obligation: | |
| | | |
| | |
| Benefit obligation at beginning of period | |
$ | 71.2 | | |
$ | 122.7 | |
| Interest cost | |
| 0.8 | | |
| 2.2 | |
| Actuarial loss (gain) | |
| — | | |
| (39.0 | ) |
| Benefits paid | |
| (0.7 | ) | |
| (3.5 | ) |
| Foreign currency translation adjustments | |
| 1.9 | | |
| (11.2 | ) |
| Benefit obligation at end of period | |
$ | 73.2 | | |
$ | 71.2 | |
| Change in plan assets: | |
| | | |
| | |
| Fair value of plan assets at beginning of period | |
$ | 69.1 | | |
$ | 125.7 | |
| Actual gain (loss) on plan assets | |
| 0.9 | | |
| (42.4 | ) |
| Employer contributions | |
| 0.3 | | |
| 1.4 | |
| Benefits paid | |
| (0.7 | ) | |
| (3.5 | ) |
| Foreign currency translation adjustments | |
| 1.8 | | |
| (12.1 | ) |
| Fair value of assets at end of period | |
$ | 71.4 | | |
$ | 69.1 | |
| Amount recognized in the consolidated balance sheets: | |
| | | |
| | |
| Unfunded status (non-current) | |
$ | (1.8 | ) | |
$ | (2.1 | ) |
| Net amount recognized | |
$ | (1.8 | ) | |
$ | (2.1 | ) |
|
| X |
- References
+ Details
| Name: |
us-gaap_CompensationAndRetirementDisclosureAbstract |
| Namespace Prefix: |
us-gaap_ |
| Data Type: |
xbrli:stringItemType |
| Balance Type: |
na |
| Period Type: |
duration |
|
| X |
- DefinitionThe entire disclosure for retirement benefits. Reference 1: http://www.xbrl.org/2003/role/disclosureRef
-Topic 715
-SubTopic 70
-Name Accounting Standards Codification
-Section 50
-Paragraph 1
-Publisher FASB
-URI https://asc.fasb.org//1943274/2147480794/715-70-50-1
Reference 2: http://www.xbrl.org/2003/role/exampleRef
-Topic 715
-SubTopic 20
-Name Accounting Standards Codification
-Section 55
-Paragraph 17
-Publisher FASB
-URI https://asc.fasb.org//1943274/2147480482/715-20-55-17
Reference 3: http://www.xbrl.org/2003/role/disclosureRef
-Topic 715
-SubTopic 20
-Name Accounting Standards Codification
-Section 50
-Paragraph 1
-Subparagraph (d)(iv)(03)
-Publisher FASB
-URI https://asc.fasb.org//1943274/2147480506/715-20-50-1
Reference 4: http://www.xbrl.org/2003/role/disclosureRef
-Topic 715
-SubTopic 20
-Name Accounting Standards Codification
-Section 50
-Paragraph 1
-Subparagraph (d)(i)
-Publisher FASB
-URI https://asc.fasb.org//1943274/2147480506/715-20-50-1
Reference 5: http://www.xbrl.org/2003/role/disclosureRef
-Topic 715
-SubTopic 20
-Name Accounting Standards Codification
-Section 50
-Paragraph 1
-Subparagraph (q)
-Publisher FASB
-URI https://asc.fasb.org//1943274/2147480506/715-20-50-1
Reference 6: http://www.xbrl.org/2003/role/disclosureRef
-Topic 715
-SubTopic 20
-Name Accounting Standards Codification
-Section 50
-Paragraph 1
-Subparagraph (l)
-Publisher FASB
-URI https://asc.fasb.org//1943274/2147480506/715-20-50-1
Reference 7: http://www.xbrl.org/2003/role/disclosureRef
-Topic 715
-Name Accounting Standards Codification
-Publisher FASB
-URI https://asc.fasb.org//715/tableOfContent
Reference 8: http://www.xbrl.org/2003/role/disclosureRef
-Topic 715
-SubTopic 20
-Name Accounting Standards Codification
-Section 50
-Paragraph 1
-Subparagraph (d)(iii)
-Publisher FASB
-URI https://asc.fasb.org//1943274/2147480506/715-20-50-1
Reference 9: http://www.xbrl.org/2003/role/disclosureRef
-Topic 715
-SubTopic 20
-Name Accounting Standards Codification
-Section 50
-Paragraph 1
-Subparagraph (o)
-Publisher FASB
-URI https://asc.fasb.org//1943274/2147480506/715-20-50-1
Reference 10: http://www.xbrl.org/2003/role/disclosureRef
-Topic 715
-SubTopic 20
-Name Accounting Standards Codification
-Section 50
-Paragraph 1
-Subparagraph (p)
-Publisher FASB
-URI https://asc.fasb.org//1943274/2147480506/715-20-50-1
Reference 11: http://www.xbrl.org/2003/role/disclosureRef
-Topic 715
-SubTopic 20
-Name Accounting Standards Codification
-Section 50
-Paragraph 1
-Subparagraph (r)(1)
-Publisher FASB
-URI https://asc.fasb.org//1943274/2147480506/715-20-50-1
Reference 12: http://www.xbrl.org/2003/role/disclosureRef
-Topic 715
-SubTopic 20
-Name Accounting Standards Codification
-Section 50
-Paragraph 1
-Subparagraph (r)(2)
-Publisher FASB
-URI https://asc.fasb.org//1943274/2147480506/715-20-50-1
Reference 13: http://www.xbrl.org/2003/role/disclosureRef
-Topic 715
-SubTopic 20
-Name Accounting Standards Codification
-Section S99
-Paragraph 2
-Publisher FASB
-URI https://asc.fasb.org//1943274/2147480126/715-20-S99-2
Reference 14: http://www.xbrl.org/2003/role/disclosureRef
-Topic 715
-SubTopic 60
-Name Accounting Standards Codification
-Section 50
-Paragraph 3
-Subparagraph (c)
-Publisher FASB
-URI https://asc.fasb.org//1943274/2147480266/715-60-50-3
| Name: |
us-gaap_PensionAndOtherPostretirementBenefitsDisclosureTextBlock |
| Namespace Prefix: |
us-gaap_ |
| Data Type: |
dtr-types:textBlockItemType |
| Balance Type: |
na |
| Period Type: |
duration |
|
v3.24.0.1
Segment Reporting and Geographic Information, as restated
|
3 Months Ended |
Mar. 31, 2023 |
|---|
| Segment Reporting [Abstract] |
|
| Segment Reporting and Geographic Information, as restated |
16.
Segment Reporting and Geographic Information, as restated
The
Company operates its business along four operating segments, which are segregated on the basis of revenue stream: Gaming, Virtual Sports,
Interactive and Leisure. The Company believes this method of segment reporting reflects both the way its business segments are managed
and the way the performance of each segment is evaluated.
The
following tables present revenue, cost of sales, excluding depreciation and amortization, selling, general and administrative expenses,
depreciation and amortization, stock-based compensation expense and acquisition related transaction expenses, operating profit/(loss),
and total capital expenditures for the periods ended March 31, 2023 and March 31, 2022, respectively, by business segment. Certain unallocated
corporate function costs have not been allocated to the Company’s reportable operating segments because these costs are not allocable
and to do so would not be practical. Corporate function costs consist primarily of selling, general and administrative expenses, depreciation
and amortization, capital expenditures, right of use assets, cash, prepaid expenses and property and equipment and software development
costs relating to corporate/shared functions.
Segment
Information
Schedule of Segment Reporting Information by Segment
Three
Months Ended March 31, 2023
| | |
Gaming | | |
Virtual Sports | | |
Interactive | | |
Leisure | | |
Corporate Functions | | |
Total | |
| | |
(in millions) | |
| Revenue: | |
| | |
| | |
| | |
| | |
| | |
| |
| Service | |
$ | 20.2 | | |
$ | 14.8 | | |
$ | 5.9 | | |
$ | 16.6 | | |
$ | — | | |
$ | 57.5 | |
| Product sales | |
| 6.9 | | |
| — | | |
| — | | |
| 0.5 | | |
| — | | |
| 7.4 | |
| Total revenue | |
| 27.1 | | |
| 14.8 | | |
| 5.9 | | |
| 17.1 | | |
| — | | |
| 64.9 | |
| Cost of sales, excluding depreciation and amortization: | |
| | | |
| | | |
| | | |
| | | |
| | | |
| | |
| Cost of service | |
| (5.9 | ) | |
| (0.4 | ) | |
| (0.3 | ) | |
| (8.4 | ) | |
| — | | |
| (15.0 | ) |
| Cost of product sales | |
| (5.8 | ) | |
| — | | |
| — | | |
| (0.9 | ) | |
| — | | |
| (6.7 | ) |
| Selling, general and administrative expenses | |
| (5.7 | ) | |
| (1.7 | ) | |
| (2.5 | ) | |
| (6.9 | ) | |
| (9.5 | ) | |
| (26.3 | ) |
| Stock-based compensation expense | |
| (0.3 | ) | |
| (0.2 | ) | |
| (0.2 | ) | |
| (0.1 | ) | |
| (2.1 | ) | |
| (2.9 | ) |
| Acquisition and integration related transaction expenses | |
| — | | |
| — | | |
| — | | |
| — | | |
| — | | |
| — | |
| Depreciation and amortization | |
| (4.5 | ) | |
| (0.8 | ) | |
| (0.6 | ) | |
| (3.1 | ) | |
| (0.4 | ) | |
| (9.4 | ) |
| Segment operating income (loss) | |
| 4.9 | | |
| 11.7 | | |
| 2.3 | | |
| (2.3 | ) | |
| (12.0 | ) | |
| 4.6 | |
| | |
| | | |
| | | |
| | | |
| | | |
| | | |
| | |
| Net operating income | |
| | | |
| | | |
| | | |
| | | |
| | | |
$ | 4.6 | |
| | |
| | | |
| | | |
| | | |
| | | |
| | | |
| | |
| Total capital expenditures for the three months ended March 31, 2023 | |
$ | 2.4 | | |
$ | 0.4 | | |
$ | 1.1 | | |
$ | 5.2 | | |
$ | 0.5 | | |
$ | 9.6 | |
Three
Months Ended March 31, 2022
| | |
Gaming | | |
Virtual Sports | | |
Interactive | | |
Leisure | | |
Corporate Functions | | |
Total | |
| | |
(in millions) | |
| Revenue: | |
| | |
| | |
| | |
| | |
| | |
| |
| Service | |
$ | 21.1 | | |
$ | 11.3 | | |
$ | 4.6 | | |
$ | 19.0 | | |
$ | — | | |
$ | 56.0 | |
| Product sales | |
| 3.7 | | |
| — | | |
| — | | |
| 0.6 | | |
| — | | |
| 4.3 | |
| Total revenue | |
| 24.8 | | |
| 11.3 | | |
| 4.6 | | |
| 19.6 | | |
| — | | |
| 60.3 | |
| Cost of sales, excluding depreciation and amortization: | |
| | | |
| | | |
| | | |
| | | |
| | | |
| | |
| Cost of service | |
| (6.0 | ) | |
| (0.4 | ) | |
| (0.3 | ) | |
| (10.1 | ) | |
| — | | |
| (16.8 | ) |
| Cost of product sales | |
| (2.3 | ) | |
| — | | |
| — | | |
| (0.2 | ) | |
| — | | |
| (2.5 | ) |
| Selling, general and administrative expenses | |
| (5.0 | ) | |
| (1.7 | ) | |
| (1.4 | ) | |
| (6.6 | ) | |
| (5.7 | ) | |
| (20.4 | ) |
| Stock-based compensation expense | |
| (0.3 | ) | |
| (0.1 | ) | |
| (0.1 | ) | |
| (0.2 | ) | |
| (2.1 | ) | |
| (2.8 | ) |
| Acquisition and integration related transaction expenses | |
| (0.1 | ) | |
| — | | |
| — | | |
| — | | |
| (0.1 | ) | |
| (0.2 | ) |
| Depreciation and amortization | |
| (5.2 | ) | |
| (0.8 | ) | |
| (0.6 | ) | |
| (3.6 | ) | |
| (0.5 | ) | |
| (10.7 | ) |
| Segment operating income (loss) | |
| 5.9 | | |
| 8.3 | | |
| 2.2 | | |
| (1.1 | ) | |
| (8.4 | ) | |
| 6.9 | |
| | |
| | | |
| | | |
| | | |
| | | |
| | | |
| | |
| Net operating income | |
| | | |
| | | |
| | | |
| | | |
| | | |
$ | 6.9 | |
| | |
| | | |
| | | |
| | | |
| | | |
| | | |
| | |
| Total capital expenditures for the three months ended March 31, 2022 | |
$ | 2.9 | | |
$ | 0.5 | | |
$ | 0.9 | | |
$ | 4.0 | | |
$ | 1.2 | | |
$ | 9.5 | |
Geographic
Information
Geographic
information for revenue is set forth below:
Schedule of Geographic Information
| | |
2023 | | |
2022 | |
| | |
Three Months Ended March 31, | |
| | |
2023 | | |
2022 | |
| | |
(in millions) | |
| Total revenue | |
| | | |
| | |
| UK | |
$ | 49.0 | | |
$ | 45.9 | |
| Greece | |
| 5.6 | | |
| 5.6 | |
| Rest of world | |
| 10.3 | | |
| 8.8 | |
| Total | |
$ | 64.9 | | |
$ | 60.3 | |
| Total
revenue | |
$ | 64.9 | | |
$ | 60.3 | |
UK
revenue includes revenue from customers headquartered in the UK, but whose revenue is generated globally.
Geographic
information of our non-current assets excluding goodwill is set forth below:
| | |
March
31, 2023 | | |
December
31, 2022 | |
| | |
(in millions) | |
| UK | |
$ | 87.5 | | |
$ | 82.7 | |
| Greece | |
| 5.1 | | |
| 5.8 | |
| Rest of world | |
| 16.1 | | |
| 16.3 | |
| Total | |
$ | 108.7 | | |
$ | 104.8 | |
| Total non-current assets excluding goodwill | |
$ | 108.7 | | |
$ | 104.8 | |
Software
development costs are included as attributable to the market in which they are utilized.
|
| X |
- References
+ Details
| Name: |
us-gaap_SegmentReportingAbstract |
| Namespace Prefix: |
us-gaap_ |
| Data Type: |
xbrli:stringItemType |
| Balance Type: |
na |
| Period Type: |
duration |
|
| X |
- DefinitionThe entire disclosure for reporting segments including data and tables. Reportable segments include those that meet any of the following quantitative thresholds a) it's reported revenue, including sales to external customers and intersegment sales or transfers is 10 percent or more of the combined revenue, internal and external, of all operating segments b) the absolute amount of its reported profit or loss is 10 percent or more of the greater, in absolute amount of 1) the combined reported profit of all operating segments that did not report a loss or 2) the combined reported loss of all operating segments that did report a loss c) its assets are 10 percent or more of the combined assets of all operating segments. Reference 1: http://www.xbrl.org/2003/role/disclosureRef
-Topic 280
-SubTopic 10
-Name Accounting Standards Codification
-Section 50
-Paragraph 22
-Publisher FASB
-URI https://asc.fasb.org//1943274/2147482810/280-10-50-22
Reference 2: http://www.xbrl.org/2003/role/disclosureRef
-Topic 280
-SubTopic 10
-Name Accounting Standards Codification
-Section 50
-Paragraph 15
-Publisher FASB
-URI https://asc.fasb.org//1943274/2147482810/280-10-50-15
Reference 3: http://www.xbrl.org/2003/role/disclosureRef
-Topic 280
-SubTopic 10
-Name Accounting Standards Codification
-Section 50
-Paragraph 31
-Publisher FASB
-URI https://asc.fasb.org//1943274/2147482810/280-10-50-31
Reference 4: http://www.xbrl.org/2003/role/disclosureRef
-Topic 280
-SubTopic 10
-Name Accounting Standards Codification
-Section 50
-Paragraph 32
-Subparagraph (d)
-Publisher FASB
-URI https://asc.fasb.org//1943274/2147482810/280-10-50-32
Reference 5: http://www.xbrl.org/2003/role/disclosureRef
-Topic 280
-SubTopic 10
-Name Accounting Standards Codification
-Section 50
-Paragraph 42
-Publisher FASB
-URI https://asc.fasb.org//1943274/2147482810/280-10-50-42
Reference 6: http://www.xbrl.org/2003/role/disclosureRef
-Topic 280
-SubTopic 10
-Name Accounting Standards Codification
-Section 50
-Paragraph 32
-Subparagraph (f)
-Publisher FASB
-URI https://asc.fasb.org//1943274/2147482810/280-10-50-32
Reference 7: http://www.xbrl.org/2003/role/disclosureRef
-Topic 280
-SubTopic 10
-Name Accounting Standards Codification
-Section 50
-Paragraph 40
-Publisher FASB
-URI https://asc.fasb.org//1943274/2147482810/280-10-50-40
Reference 8: http://www.xbrl.org/2003/role/disclosureRef
-Topic 280
-Name Accounting Standards Codification
-Publisher FASB
-URI https://asc.fasb.org//280/tableOfContent
Reference 9: http://www.xbrl.org/2003/role/disclosureRef
-Topic 280
-SubTopic 10
-Name Accounting Standards Codification
-Section 50
-Paragraph 26
-Publisher FASB
-URI https://asc.fasb.org//1943274/2147482810/280-10-50-26
Reference 10: http://www.xbrl.org/2003/role/disclosureRef
-Topic 280
-SubTopic 10
-Name Accounting Standards Codification
-Section 50
-Paragraph 34
-Publisher FASB
-URI https://asc.fasb.org//1943274/2147482810/280-10-50-34
Reference 11: http://www.xbrl.org/2003/role/disclosureRef
-Topic 280
-SubTopic 10
-Name Accounting Standards Codification
-Section 50
-Paragraph 41
-Publisher FASB
-URI https://asc.fasb.org//1943274/2147482810/280-10-50-41
Reference 12: http://www.xbrl.org/2003/role/disclosureRef
-Topic 280
-SubTopic 10
-Name Accounting Standards Codification
-Section 50
-Paragraph 21
-Subparagraph (a)
-Publisher FASB
-URI https://asc.fasb.org//1943274/2147482810/280-10-50-21
Reference 13: http://www.xbrl.org/2003/role/disclosureRef
-Topic 280
-SubTopic 10
-Name Accounting Standards Codification
-Section 50
-Paragraph 21
-Subparagraph (b)
-Publisher FASB
-URI https://asc.fasb.org//1943274/2147482810/280-10-50-21
Reference 14: http://www.xbrl.org/2003/role/disclosureRef
-Topic 280
-SubTopic 10
-Name Accounting Standards Codification
-Section 50
-Paragraph 32
-Subparagraph (e)
-Publisher FASB
-URI https://asc.fasb.org//1943274/2147482810/280-10-50-32
| Name: |
us-gaap_SegmentReportingDisclosureTextBlock |
| Namespace Prefix: |
us-gaap_ |
| Data Type: |
dtr-types:textBlockItemType |
| Balance Type: |
na |
| Period Type: |
duration |
|
v3.24.0.1
Customer Concentration
|
3 Months Ended |
Mar. 31, 2023 |
|---|
| Risks and Uncertainties [Abstract] |
|
| Customer Concentration |
17.
Customer Concentration
During
the three months ended March 31, 2023, there was one customer that represented at least 10% of the Company’s revenues, accounting
for 15% of the Company’s revenues. This customer was served by the Virtual Sports and Interactive segments. During the three months
ended March 31, 2022, there was one customer that represented at least 10% of the Company’s revenues, accounting for 12% of the
Company’s revenues. This customer was served by the Virtual Sports and Interactive segments.
At
March 31, 2023 no customers represented at least 10% of the Company’s accounts receivable. At December 31, 2022, there was one
customer that represented at least 10% of the Company’s accounts receivable, accounting for 24% of the Company’s accounts
receivable.
|
| X |
- DefinitionThe entire disclosure for any concentrations existing at the date of the financial statements that make an entity vulnerable to a reasonably possible, near-term, severe impact. This disclosure informs financial statement users about the general nature of the risk associated with the concentration, and may indicate the percentage of concentration risk as of the balance sheet date. Reference 1: http://fasb.org/us-gaap/role/ref/legacyRef
-Topic 275
-Name Accounting Standards Codification
-Publisher FASB
-URI https://asc.fasb.org//275/tableOfContent
| Name: |
us-gaap_ConcentrationRiskDisclosureTextBlock |
| Namespace Prefix: |
us-gaap_ |
| Data Type: |
dtr-types:textBlockItemType |
| Balance Type: |
na |
| Period Type: |
duration |
|
| X |
- References
+ Details
| Name: |
us-gaap_RisksAndUncertaintiesAbstract |
| Namespace Prefix: |
us-gaap_ |
| Data Type: |
xbrli:stringItemType |
| Balance Type: |
na |
| Period Type: |
duration |
|
v3.24.0.1
Subsequent Events
|
3 Months Ended |
Mar. 31, 2023 |
|---|
| Subsequent Events [Abstract] |
|
| Subsequent Events |
18.
Subsequent Events
The
Company evaluates subsequent events and transactions that occur after the balance sheet date up to the date that the financial
statements were issued. Other than as described below, and except for the effects of the restatement as discussed in Note 2 to the
consolidated financial statements, the Company did not identify subsequent events that would have required adjustment or disclosure
in the consolidated financial statements.
On
April 10, 2023, the Company’s Board of Directors adopted the 2023 Omnibus Incentive Plan (the “2023 Plan”), subject
to the approval of our stockholders, which was obtained at the Company’s annual meeting of stockholders held on May 9, 2023. The
2023 Plan authorizes a total of 2,700,000 shares to be issued pursuant to awards and will also replace the Company’s predecessor
plan (the 2021 Plan) such that shares available for grant under the 2021 Plan would instead be available for grant under the 2023 Plan.
Upon approval of the 2023 Plan, the sign-on RSUs previously disclosed for Messrs. Weil and Pierce as part of amendments to their employment
contracts in January 2023 were effective (comprising an aggregate of 250,000 performance-based RSUs and 125,000 stock price-based RSUs).
|
| X |
- References
+ Details
| Name: |
us-gaap_SubsequentEventsAbstract |
| Namespace Prefix: |
us-gaap_ |
| Data Type: |
xbrli:stringItemType |
| Balance Type: |
na |
| Period Type: |
duration |
|
| X |
- DefinitionThe entire disclosure for significant events or transactions that occurred after the balance sheet date through the date the financial statements were issued or the date the financial statements were available to be issued. Examples include: the sale of a capital stock issue, purchase of a business, settlement of litigation, catastrophic loss, significant foreign exchange rate changes, loans to insiders or affiliates, and transactions not in the ordinary course of business. Reference 1: http://www.xbrl.org/2003/role/disclosureRef
-Topic 855
-Name Accounting Standards Codification
-Publisher FASB
-URI https://asc.fasb.org//855/tableOfContent
Reference 2: http://www.xbrl.org/2003/role/disclosureRef
-Topic 855
-SubTopic 10
-Name Accounting Standards Codification
-Section 50
-Paragraph 2
-Subparagraph (a)
-Publisher FASB
-URI https://asc.fasb.org//1943274/2147483399/855-10-50-2
| Name: |
us-gaap_SubsequentEventsTextBlock |
| Namespace Prefix: |
us-gaap_ |
| Data Type: |
dtr-types:textBlockItemType |
| Balance Type: |
na |
| Period Type: |
duration |
|
v3.24.0.1
Nature of Operations, Management’s Plans and Summary of Significant Accounting Policies, as restated (Policies)
|
3 Months Ended |
Mar. 31, 2023 |
|---|
| Accounting Policies [Abstract] |
|
| Company Description and Nature of Operations |
Company
Description and Nature of Operations
We
are a global gaming technology company, supplying content, platform, gaming terminals and other products and services to online and land-based
regulated lottery, betting and gaming operators worldwide through a broad range of distribution channels, predominantly on a business-to-business
basis. We provide end-to-end digital gaming solutions (i) on our own proprietary and secure network, which accommodates a wide range
of devices, including land-based gaming machine terminals, mobile devices and online computer applications and (ii) through third party
networks. Our content and other products can be found through the consumer-facing portals of our interactive customers and, through our
land-based customers, in licensed betting offices, adult gaming centers, pubs, bingo halls, airports, motorway service areas and leisure
parks.
|
| Management Liquidity Plans |
Management
Liquidity Plans
As
of March 31, 2023, the Company’s cash on hand was $27.8 million, and the Company had working capital in addition to cash of $24.9
million. The Company recorded a net loss of $1.4 million and net income of $1.5 million for the three months ended March 31, 2023 and
2022, respectively. Net income/losses include non-cash stock-based compensation of $2.9 million and $2.8 million for the three months
ended March 31, 2023 and 2022, respectively. Historically, the Company has generally had positive cash flows from operating activities
and has relied on a combination of cash flows provided by operations and the incurrence of debt and/or the refinancing of existing debt
to fund its obligations. Cash flows provided by operations amounted to $11.6 million and $2.7 million for the three months ended March
31, 2023 and 2022, respectively. The change year on year was due primarily to improved working capital levels, with the three months
ended March 31, 2023 benefitting from favorable receipts due to the timing of sales, and the three months ended March 31, 2022 showing
significant inventory increases after the Company made the strategic decision to secure components and protect sales in a challenging
global supply chain market. Working capital of $52.7 million includes a non-cash settled item of $4.9 million of deferred income. Management
currently believes that, absent any long-term coronavirus (“COVID-19”) impact (see below), the Company’s cash balances
on hand, cash flows expected to be generated from operations, ability to control and defer capital projects and amounts available from
the Company’s external borrowings will be sufficient to fund the Company’s net cash requirements through May 2024.
There
have been no COVID-19 restrictions in the United Kingdom since July 2021 and social distancing measures throughout Greece and Italy are
no longer in force as of the second quarter of 2022. There have been no COVID-19 restrictions in the United States and social distancing
measures are no longer in force. While states have varying requirements based on occupation, no mandates related to, or would prohibit,
our normal business operations.
|
| Basis of Presentation |
Basis
of Presentation
The
accompanying unaudited interim condensed consolidated financial statements have been prepared in accordance with accounting principles
generally accepted in the United States of America (“U.S. GAAP”) for interim financial information and pursuant to the instructions
to Form 10-Q and Article 8 of Regulation S-X of the United States Securities and Exchange Commission (“SEC”). Certain information
or footnote disclosures normally included in financial statements prepared in accordance with U.S. GAAP have been condensed or omitted,
pursuant to the rules and regulations of the SEC for interim financial reporting. Accordingly, they do not include all the information
and footnotes necessary for a comprehensive presentation of financial position, results of operations, or cash flows. It is management’s
opinion, however, that the accompanying unaudited interim condensed consolidated financial statements include all adjustments, consisting
of a normal recurring nature, which are necessary for a fair presentation of the financial position, operating results and cash flows
for the periods presented.
The
accompanying unaudited interim condensed consolidated financial statements should be read in conjunction with the Company’s consolidated
financial statements and notes thereto for the years ended December 31, 2022 and 2021. The financial information as of December 31, 2022
is derived from the audited consolidated financial statements presented in the Company’s Annual Report on Form 10-K/A filed with
the SEC on February 27, 2024. The interim results for the three months ended March 31, 2023 are not necessarily indicative of the results
to be expected for the year ending December 31, 2023 or for any future interim periods.
|
| Newly Adopted Accounting Standards |
Newly
Adopted Accounting Standards
On
January 1, 2023, the Company adopted Topic 326 Financial Instruments – Credit Losses (“ASC 326”). ASC 326 affects loans,
debt securities, trade receivables, and any other financial assets that have the contractual right to receive cash. It requires an entity
to recognize expected credit losses rather than incurred losses for financial assets and requires a modified retrospective transition
approach through a cumulative-effect adjustment to retained earnings as of the beginning of the period of adoption.
The
adoption of ASC 326 did not have a material impact. Disclosures with respect to allowances for credit losses are given in footnote 4
to these financial statements.
|
| X |
- DefinitionCompany description and nature of operations [Policy Text Block]
| Name: |
INSE_CompanyDescriptionAndNatureOfOperationsPolicyTextBlock |
| Namespace Prefix: |
INSE_ |
| Data Type: |
dtr-types:textBlockItemType |
| Balance Type: |
na |
| Period Type: |
duration |
|
| X |
- DefinitionManagement Liquidity Plans [Policy Text Block]
| Name: |
INSE_ManagementLiquidityPlansPolicyTextBlock |
| Namespace Prefix: |
INSE_ |
| Data Type: |
dtr-types:textBlockItemType |
| Balance Type: |
na |
| Period Type: |
duration |
|
| X |
- References
+ Details
| Name: |
us-gaap_AccountingPoliciesAbstract |
| Namespace Prefix: |
us-gaap_ |
| Data Type: |
xbrli:stringItemType |
| Balance Type: |
na |
| Period Type: |
duration |
|
| X |
- DefinitionDisclosure of accounting policy for basis of accounting, or basis of presentation, used to prepare the financial statements (for example, US Generally Accepted Accounting Principles, Other Comprehensive Basis of Accounting, IFRS).
| Name: |
us-gaap_BasisOfAccountingPolicyPolicyTextBlock |
| Namespace Prefix: |
us-gaap_ |
| Data Type: |
dtr-types:textBlockItemType |
| Balance Type: |
na |
| Period Type: |
duration |
|
| X |
- DefinitionDisclosure of accounting policy pertaining to new accounting pronouncements that may impact the entity's financial reporting. Includes, but is not limited to, quantification of the expected or actual impact.
| Name: |
us-gaap_NewAccountingPronouncementsPolicyPolicyTextBlock |
| Namespace Prefix: |
us-gaap_ |
| Data Type: |
dtr-types:textBlockItemType |
| Balance Type: |
na |
| Period Type: |
duration |
|
v3.24.0.1
Restatement of Previously Issued Financial Statements (Tables)
|
3 Months Ended |
Mar. 31, 2023 |
|---|
| Accounting Changes and Error Corrections [Abstract] |
|
| Schedule of Restatement Items to Prior Period Financial Statements |
The
following tables present the effect of the Restatement Items on the Company’s consolidated balance sheets for the periods indicated
(in millions, except per share):
Schedule
of Restatement Items to Prior Period Financial Statements
| | |
| | |
| | |
| | |
| | |
|
| | |
As of March 31, 2023 (unaudited) |
| | |
As Previously | | |
Previous | | |
Restatement | | |
| | |
Restatement |
| | |
Reported | | |
Revision | | |
Adjustments | | |
As Restated | | |
References |
| Assets | |
| | |
| | |
| | |
| | |
|
| Cash | |
$ | 27.8 | | |
$ | - | | |
$ | - | | |
$ | 27.8 | | |
|
| Accounts receivable, net | |
| 33.0 | | |
| - | | |
| (0.1 | ) | |
| 32.9 | | |
f |
| Inventory, net | |
| 36.5 | | |
| - | | |
| (1.9 | ) | |
| 34.6 | | |
c |
| Prepaid expenses and other current assets | |
| 31.1 | | |
| - | | |
| (0.4 | ) | |
| 30.7 | | |
f |
| Total current assets | |
| 128.4 | | |
| - | | |
| (2.4 | ) | |
| 126.0 | | |
|
| | |
| | | |
| | | |
| | | |
| | | |
|
| Property and equipment, net | |
| 47.7 | | |
| - | | |
| (0.3 | ) | |
| 47.4 | | |
b |
| Software development costs, net | |
| 38.1 | | |
| (1.0 | ) | |
| (17.6 | ) | |
| 19.5 | | |
a |
| Other acquired intangible assets subject to amortization, net | |
| 14.6 | | |
| - | | |
| (0.3 | ) | |
| 14.3 | | |
d, f |
| Goodwill | |
| 75.8 | | |
| - | | |
| (18.8 | ) | |
| 57.0 | | |
d |
| Operating lease right of use asset | |
| 8.1 | | |
| - | | |
| 7.6 | | |
| 15.7 | | |
e |
| Cost of obtaining and fulfilling customer contracts, net | |
| - | | |
| - | | |
| 7.7 | | |
| 7.7 | | |
a, b |
| Other assets | |
| 3.8 | | |
| - | | |
| 0.3 | | |
| 4.1 | | |
f |
| Total assets | |
$ | 316.5 | | |
$ | (1.0 | ) | |
$ | (23.8 | ) | |
$ | 291.7 | | |
|
| | |
| | | |
| | | |
| | | |
| | | |
|
| Liabilities and Stockholders’ Deficit | |
| | | |
| | | |
| | | |
| | | |
|
| Current liabilities | |
| | | |
| | | |
| | | |
| | | |
|
| Accounts payable | |
| 22.2 | | |
| - | | |
| - | | |
| 22.2 | | |
|
| Accrued expenses | |
| 34.9 | | |
| - | | |
| 0.7 | | |
| 35.6 | | |
f |
| Corporate tax and other current taxes payable | |
| 5.0 | | |
| - | | |
| (1.6 | ) | |
| 3.4 | | |
|
| Deferred revenue, current | |
| 5.1 | | |
| - | | |
| (0.2 | ) | |
| 4.9 | | |
b |
| Operating lease liabilities | |
| 2.8 | | |
| - | | |
| 1.2 | | |
| 4.0 | | |
e |
| Other current liabilities | |
| 3.2 | | |
| - | | |
| - | | |
| 3.2 | | |
|
| Total current liabilities | |
| 73.2 | | |
| - | | |
| 0.1 | | |
| 73.3 | | |
|
| | |
| | | |
| | | |
| | | |
| | | |
|
| Long-term debt | |
| 285.5 | | |
| - | | |
| - | | |
| 285.5 | | |
|
| Finance lease liabilities, net of current portion | |
| 1.2 | | |
| - | | |
| - | | |
| 1.2 | | |
|
| Deferred revenue, net of current portion | |
| 3.2 | | |
| - | | |
| (0.9 | ) | |
| 2.3 | | |
b |
| Operating lease liabilities | |
| 5.6 | | |
| - | | |
| 6.3 | | |
| 11.9 | | |
e |
| Other long-term liabilities | |
| 2.2 | | |
| - | | |
| 1.8 | | |
| 4.0 | | |
g |
| Total liabilities | |
$ | 370.9 | | |
$ | - | | |
$ | 7.3 | | |
$ | 378.2 | | |
|
| | |
| | | |
| | | |
| | | |
| | | |
|
| Commitments and contingencies | |
| | | |
| | | |
| | | |
| | | |
|
| | |
| | | |
| | | |
| | | |
| | | |
|
| Stockholders’ deficit | |
| | | |
| | | |
| | | |
| | | |
|
| Preferred stock; $0.0001 par value; 1,000,000 shares authorized | |
| - | | |
| - | | |
| - | | |
| - | | |
|
| Common stock; $0.0001 par value; 49,000,000 shares authorized; 25,909,516 shares and 26,433,562 shares issued and outstanding at December 31, 2022 and December 31, 2021, respectively | |
| - | | |
| - | | |
| - | | |
| - | | |
|
| Additional paid in capital | |
| 381.2 | | |
| - | | |
| - | | |
| 381.2 | | |
|
| Accumulated other comprehensive income | |
| 46.8 | | |
| - | | |
| 1.5 | | |
| 48.3 | | |
|
| Accumulated deficit | |
| (482.4 | ) | |
| (1.0 | ) | |
| (32.6 | ) | |
| (516.0 | ) | |
|
| Total stockholders’ deficit | |
| (54.4 | ) | |
| (1.0 | ) | |
| (31.1 | ) | |
| (86.5 | ) | |
|
| Total liabilities and stockholders’ deficit | |
$ | 316.5 | | |
$ | (1.0 | ) | |
$ | (23.8 | ) | |
$ | 291.7 | | |
|
The
following tables present the effect of the Restatement Items on the Company’s consolidated statement of operations for the periods
indicated (in millions, except share and per share amounts):
| | |
| | |
| | |
| | |
|
| | |
For Three Months Ended March 31, 2023 (unaudited) |
| | |
As Previously | | |
Restatement | | |
| | |
Restatement |
| | |
Reported | | |
Adjustments | | |
As Restated | | |
References |
| Revenue: | |
| | |
| | |
| | |
|
| Service | |
$ | 58.3 | | |
$ | (0.8 | ) | |
$ | 57.5 | | |
b, f |
| Product sales | |
| 7.7 | | |
| (0.3 | ) | |
| 7.4 | | |
b |
| Total Revenue | |
| 66.0 | | |
| (1.1 | ) | |
| 64.9 | | |
|
| | |
| | | |
| | | |
| | | |
|
| Cost of Sales | |
| | | |
| | | |
| | | |
|
| Cost of service(1) | |
| (10.9 | ) | |
| (4.1 | ) | |
| (15.0 | ) | |
b, f |
| Cost of product sales | |
| (5.8 | ) | |
| (0.9 | ) | |
| (6.7 | ) | |
b, c |
| Selling, general and administrative expenses | |
| (34.3 | ) | |
| 5.1 | | |
| (29.2 | ) | |
a, f |
| Acquisition and integration related transaction expenses | |
| - | | |
| - | | |
| - | | |
|
| Depreciation and amortization | |
| (8.9 | ) | |
| (0.5 | ) | |
| (9.4 | ) | |
a, b |
| Net operating income (loss) | |
| 6.1 | | |
| (1.5 | ) | |
| 4.6 | | |
|
| | |
| | | |
| - | | |
| | | |
|
| Other expense | |
| | | |
| | | |
| | | |
|
| Interest expense, net | |
| (6.3 | ) | |
| - | | |
| (6.3 | ) | |
|
| Gain on disposal of business | |
| - | | |
| - | | |
| - | | |
|
| Other finance income (expense) | |
| 0.1 | | |
| - | | |
| 0.1 | | |
|
| | |
| | | |
| | | |
| | | |
|
| Total other expense, net | |
| (6.2 | ) | |
| - | | |
| (6.2 | ) | |
|
| | |
| | | |
| - | | |
| | | |
|
| Income tax (expense) benefit | |
| (0.1 | ) | |
| 0.3 | | |
| 0.2 | | |
|
| Net loss | |
| (0.2 | ) | |
| (1.2 | ) | |
| (1.4 | ) | |
|
| | |
| | | |
| | | |
| | | |
|
| Other comprehensive income (loss) | |
| | | |
| | | |
| | | |
|
| Foreign currency translation gain (loss) | |
| (1.7 | ) | |
| (1.2 | ) | |
| (2.9 | ) | |
|
| Reclassification of loss on hedging instrument to comprehensive income | |
| 0.2 | | |
| - | | |
| 0.2 | | |
|
| Actuarial gains (losses) on pension plan | |
| 2.0 | | |
| (1.8 | ) | |
| 0.2 | | |
g |
| Other comprehensive income (loss) | |
| 0.5 | | |
| (3.0 | ) | |
| (2.5 | ) | |
|
| | |
| | | |
| | | |
| | | |
|
| Comprehensive income (loss) | |
$ | 0.3 | | |
$ | (4.2 | ) | |
$ | (3.9 | ) | |
|
| | |
| | | |
| | | |
| | | |
|
| Net income (loss) per common share - basic | |
$ | (0.01 | ) | |
$ | (0.04 | ) | |
$ | (0.05 | ) | |
|
| Net income (loss) per common share - diluted | |
$ | (0.01 | ) | |
$ | (0.04 | ) | |
$ | (0.05 | ) | |
|
| | |
| | | |
| | | |
| | | |
|
| Weighted average number of shares outstanding during the year - basic | |
| 26,155,346 | | |
| 1,818,836 | | |
| 27,974,182 | | |
h |
| Weighted average number of shares outstanding during the year - diluted | |
| 26,155,346 | | |
| 1,818,836 | | |
| 27,974,182 | | |
|
| Stock-based compensation included in: | |
| | | |
| | | |
| | | |
|
| Selling, general, and administrative expenses | |
$ | (2.9 | ) | |
| | | |
$ | (2.9 | ) | |
|
| (1) |
Excluding
depreciation and amortization |
| | |
| | | |
| | | |
| | | |
|
| | |
For Three Months Ended March 31, 2022 (unaudited) |
| | |
As Previously | | |
Restatement | | |
| | |
Restatement |
| | |
Reported | | |
Adjustments | | |
As Restated | | |
References |
| Revenue: | |
| | | |
| | | |
| | | |
|
| Service | |
$ | 57.0 | | |
$ | (1.0 | ) | |
$ | 56.0 | | |
b |
| Product Sales | |
| 3.6 | | |
| 0.7 | | |
| 4.3 | | |
b |
| Total Revenue | |
| 60.6 | | |
| (0.3 | ) | |
| 60.3 | | |
|
| | |
| | | |
| | | |
| | | |
|
| Cost of Sales | |
| | | |
| | | |
| | | |
|
| Cost of Service | |
| (11.8 | ) | |
| (5.0 | ) | |
| (16.8 | ) | |
b, f |
| Cost of Product sales | |
| (2.1 | ) | |
| (0.4 | ) | |
| (2.5 | ) | |
b, c |
| Selling, general and administrative expenses | |
| (29.6 | ) | |
| 6.4 | | |
| (23.2 | ) | |
a, f |
| Acquisition and integration related transaction expenses | |
| (0.1 | ) | |
| (0.1 | ) | |
| (0.2 | ) | |
|
| Depreciation and amortization | |
| (10.1 | ) | |
| (0.6 | ) | |
| (10.7 | ) | |
a, b, d |
| Net operating income (loss) | |
| 6.9 | | |
| - | | |
| 6.9 | | |
|
| | |
| | | |
| | | |
| | | |
|
| Other expense | |
| | | |
| | | |
| | | |
|
| Interest expense, net | |
| (6.5 | ) | |
| - | | |
| (6.5 | ) | |
|
| Gain on disposal of business | |
| 0.9 | | |
| - | | |
| 0.9 | | |
|
| Other finance income (expense) | |
| 0.3 | | |
| - | | |
| 0.3 | | |
|
| | |
| | | |
| | | |
| | | |
|
| Total other expense, net | |
| (5.3 | ) | |
| - | | |
| (5.3 | ) | |
|
| | |
| | | |
| | | |
| | | |
|
| Income tax expense | |
| (0.1 | ) | |
| - | | |
| (0.1 | ) | |
|
| Net income | |
| 1.5 | | |
| - | | |
| 1.5 | | |
|
| | |
| | | |
| | | |
| | | |
|
| Other comprehensive income: | |
| | | |
| | | |
| | | |
|
| Foreign currency translation (loss) gain | |
| 2.4 | | |
| 1.1 | | |
| 3.5 | | |
|
| Reclassification of loss on hedging instrument to comprehensive income | |
| 0.2 | | |
| - | | |
| 0.2 | | |
|
| Actuarial gains (losses) on pension plan | |
| 0.7 | | |
| (0.6 | ) | |
| 0.1 | | |
g |
| Other comprehensive income | |
| 3.3 | | |
| 0.5 | | |
| 3.8 | | |
|
| | |
| | | |
| | | |
| | | |
|
| Comprehensive income | |
$ | 4.8 | | |
$ | 0.5 | | |
$ | 5.3 | | |
|
| | |
| | | |
| | | |
| | | |
|
| Net income (loss) per common share - basic | |
$ | 0.06 | | |
$ | (0.01 | ) | |
$ | 0.05 | | |
|
| Net income (loss) per common share - diluted | |
$ | 0.05 | | |
$ | - | | |
$ | 0.05 | | |
|
| | |
| | | |
| | | |
| | | |
|
| Weighted average number of shares outstanding during the year - basic | |
| 26,850,326 | | |
| 1,586,726 | | |
| 28,437,052 | | |
h |
| Weighted average number of shares outstanding during the year - diluted | |
| 29,294,973 | | |
| 67,409 | | |
| 29,362,382 | | |
|
The
following tables present the effect of the Restatement Items on the Company’s consolidated statements of stockholders’ equity
(deficit) for the periods indicated (in millions, except per share amounts):
| | |
| | |
| | |
| | |
| | |
| | |
| | |
|
| | |
| | |
| | |
| | |
Accumulated | | |
| | |
| | |
|
| | |
| | |
| | |
Additional | | |
other | | |
| | |
Total | | |
|
| | |
Common Stock | | |
paid in | | |
comprehensive | | |
Accumulated | | |
stockholders’ | | |
Restatement |
| | |
Shares | | |
Amount | | |
capital | | |
income | | |
deficit | | |
deficit | | |
References |
| | |
| | | |
| | | |
| | | |
| | | |
| | | |
| | | |
|
| Balance as of March 31, 2023 (As Previously Reported) | |
| 26,263,070 | | |
| - | | |
| 381.2 | | |
| 46.8 | | |
| (482.4 | ) | |
| (54.4 | ) | |
|
| Previous Revision | |
| - | | |
| - | | |
| - | | |
| - | | |
| (1.0 | ) | |
| (1.0 | ) | |
|
| Restatement Items | |
| - | | |
| - | | |
| - | | |
| 1.5 | | |
| (32.6 | ) | |
| (31.1 | ) | |
|
| Balance as of March 31, 2023 (As Restated) (Unaudited) | |
| 26,263,070 | | |
$ | - | | |
$ | 381.2 | | |
$ | 48.3 | | |
$ | (516.0 | ) | |
$ | (86.5 | ) | |
|
| | |
| | |
| | |
| | |
| | |
| | |
| | |
|
| | |
| | |
| | |
| | |
Accumulated | | |
| | |
| | |
|
| | |
| | |
| | |
Additional | | |
other | | |
| | |
Total | | |
|
| | |
Common Stock | | |
paid in | | |
comprehensive | | |
Accumulated | | |
stockholders’ | | |
Restatement |
| | |
Shares | | |
Amount | | |
capital | | |
income | | |
deficit | | |
deficit | | |
References |
| | |
| | | |
| | | |
| | | |
| | | |
| | | |
| | | |
|
| Balance as of March 31, 2022 (As Previously Reported) | |
| 26,880,622 | | |
| - | | |
| 375.0 | | |
| 47.1 | | |
| (492.6 | ) | |
| (70.5 | ) | |
|
| Balance | |
| 26,880,622 | | |
| - | | |
| 375.0 | | |
| 47.1 | | |
| (492.6 | ) | |
| (70.5 | ) | |
|
| Restatement Items | |
| - | | |
| - | | |
| - | | |
| 0.5 | | |
| (30.7 | ) | |
| (30.2 | ) | |
|
| Balance as of March 31, 2022 (As Restated) (Unaudited) | |
| 26,880,622 | | |
$ | - | | |
$ | 375.0 | | |
$ | 47.6 | | |
$ | (523.3 | ) | |
$ | (100.7 | ) | |
|
| Balance | |
| 26,880,622 | | |
$ | - | | |
$ | 375.0 | | |
$ | 47.6 | | |
$ | (523.3 | ) | |
$ | (100.7 | ) | |
|
The
following tables present the effect of the Restatement Items on the Company’s consolidated statements of cashflows for the periods
indicated (in millions):
| | |
| | | |
| | | |
| | | |
| | | |
|
| | |
Three Months Ended March 31, 2023 (unaudited) |
| | |
As Previously | | |
Previous | | |
Restatement | | |
| | |
Restatement |
| | |
Reported | | |
Revision | | |
Adjustments | | |
As Restated | | |
References |
| Cash flows from operating activities: | |
| | | |
| | | |
| | | |
| | | |
|
| Net income (loss) | |
$ | (0.2 | ) | |
$ | - | | |
$ | (1.2 | ) | |
$ | (1.4 | ) | |
a, b, c, f |
| Adjustments to reconcile net income (loss) to net cash provided by operating activities: | |
| | | |
| - | | |
| | | |
| | | |
|
| Depreciation and amortization | |
| 8.9 | | |
| - | | |
| 0.5 | | |
| 9.4 | | |
a, b, d |
| Amortization of right of use asset | |
| 0.5 | | |
| - | | |
| 0.3 | | |
| 0.8 | | |
e |
| Profit on sale of trade and asset | |
| | | |
| | | |
| | | |
| | | |
|
| Stock-based compensation expense | |
| 2.9 | | |
| - | | |
| - | | |
| 2.9 | | |
|
| Contract cost expense | |
| - | | |
| - | | |
| (2.6 | ) | |
| (2.6 | ) | |
a, b |
| Reclassification of loss on hedging instrument to comprehensive income | |
| 0.2 | | |
| - | | |
| - | | |
| 0.2 | | |
|
| Non-cash interest expense relating to senior debt | |
| 0.3 | | |
| - | | |
| - | | |
| 0.3 | | |
|
| Changes in assets and liabilities: | |
| | | |
| - | | |
| | | |
| | | |
|
| Accounts receivable | |
| 8.5 | | |
| - | | |
| (0.2 | ) | |
| 8.3 | | |
g |
| Inventory | |
| (4.6 | ) | |
| - | | |
| 1.1 | | |
| (3.5 | ) | |
c, g |
| Prepaid expenses and other assets | |
| 1.6 | | |
| - | | |
| (0.6 | ) | |
| 1.0 | | |
f, g |
| Corporate tax and other current taxes payable | |
| (3.8 | ) | |
| - | | |
| (2.4 | ) | |
| (6.2 | ) | |
g |
| Accounts payable | |
| (4.1 | ) | |
| - | | |
| 2.0 | | |
| (2.1 | ) | |
g |
| Deferred revenues and customer prepayment | |
| (0.3 | ) | |
| - | | |
| 0.1 | | |
| (0.2 | ) | |
g |
| Accrued expenses | |
| 5.5 | | |
| - | | |
| 0.1 | | |
| 5.6 | | |
f, g |
| Other lease liabilities | |
| (0.6 | ) | |
| - | | |
| (0.3 | ) | |
| (0.9 | ) | |
g |
| Other long-term liabilities | |
| - | | |
| - | | |
| - | | |
| - | | |
|
| Net cash provided by operating activities | |
| 14.8 | | |
| - | | |
| (3.2 | ) | |
| 11.6 | | |
|
| | |
| | | |
| | | |
| | | |
| | | |
|
| Cash flows from investing activities: | |
| | | |
| | | |
| | | |
| | | |
|
| Purchases of property and equipment | |
| (6.1 | ) | |
| - | | |
| 0.6 | | |
| (5.5 | ) | |
g |
| Acquisition of subsidiary company assets | |
| - | | |
| - | | |
| | | |
| - | | |
|
| Acquisition of third-party company trade and assets | |
| (0.6 | ) | |
| - | | |
| - | | |
| (0.6 | ) | |
|
| Disposal of trade and assets | |
| | | |
| | | |
| | | |
| | | |
|
| Purchases of capital software | |
| (4.8 | ) | |
| - | | |
| 2.0 | | |
| (2.8 | ) | |
a, g |
| Net cash used in investing activities | |
| (11.5 | ) | |
| - | | |
| 2.6 | | |
| (8.9 | ) | |
|
| | |
| | | |
| | | |
| | | |
| | | |
|
| Cash flows from financing activities: | |
| | | |
| | | |
| | | |
| | | |
|
| Repayments of finance leases | |
| (0.5 | ) | |
| - | | |
| - | | |
| (0.5 | ) | |
|
| Net cash used in financing activities | |
| (0.5 | ) | |
| - | | |
| - | | |
| (0.5 | ) | |
|
| | |
| | | |
| | | |
| | | |
| | | |
|
| Effect of exchange rate changes on cash | |
| - | | |
| - | | |
| 0.6 | | |
| 0.6 | | |
g |
| Net increase (decrease) in cash | |
| 2.8 | | |
| - | | |
| - | | |
| 2.8 | | |
|
| Cash, beginning of period | |
| 25.0 | | |
| - | | |
| 0 | | |
| 25.0 | | |
|
| Cash, end of period | |
$ | 27.8 | | |
| - | | |
| 0 | | |
| 27.8 | | |
|
| | |
| | | |
| | | |
| | | |
| | | |
|
| Supplemental cash flow disclosures | |
| | | |
| | | |
| | | |
| | | |
|
| Cash paid during the period for interest | |
$ | 0.1 | | |
$ | - | | |
$ | - | | |
$ | 0.1 | | |
|
| Cash paid during the period for income taxes | |
$ | 0.1 | | |
$ | - | | |
$ | - | | |
$ | 0.1 | | |
|
| Cash paid during the period for operating leases | |
$ | 1.2 | | |
$ | - | | |
$ | 0.9 | | |
$ | 2.1 | | |
|
| | |
| | | |
| | | |
| | | |
| | | |
|
| Supplemental disclosure of noncash investing and financing activities | |
| | | |
| | | |
| | | |
| | | |
|
| Lease liabilities arising from obtaining right of use assets | |
$ | (0.1 | ) | |
$ | | | |
$ | | | |
$ | (0.1 | ) | |
|
| Property and equipment acquired through finance lease | |
| | | |
| | | |
| | | |
| | | |
|
| Property and equipment transferred to inventory | |
| | | |
| | | |
| | | |
| | | |
|
| | |
Reported | | |
Adjustments | | |
As Restated | | |
References |
| | |
Three Months Ended March 31, 2022 (unaudited) |
| | |
As Previously | | |
Restatement | | |
| | |
Restatement |
| | |
Reported | | |
Adjustments | | |
As Restated | | |
References |
| Cash flows from operating activities: | |
| | | |
| | | |
| | | |
|
| Net income (loss) | |
$ | 1.5 | | |
$ | - | | |
$ | 1.5 | | |
a, b, c, d, f |
| Adjustments to reconcile net income (loss) to net cash provided by operating activities: | |
| | | |
| | | |
| | | |
|
| Depreciation and amortization | |
| 10.1 | | |
| 0.6 | | |
| 10.7 | | |
a, b, d |
| Amortization of right of use asset | |
| 0.7 | | |
| 0.3 | | |
| 1.0 | | |
e |
| Profit on sale of trade and asset | |
| - | | |
| (0.9 | ) | |
| (0.9 | ) | |
f |
| Stock-based compensation expense | |
| 2.8 | | |
| - | | |
| 2.8 | | |
|
| Contract Cost expense | |
| - | | |
| (1.6 | ) | |
| (1.6 | ) | |
a, b |
| Reclassification of loss on hedging instrument to comprehensive income | |
| 0.2 | | |
| - | | |
| 0.2 | | |
|
| Non-cash interest expense relating to senior debt | |
| 0.4 | | |
| - | | |
| 0.4 | | |
|
| Changes in assets and liabilities: | |
| | | |
| | | |
| | | |
|
| Accounts receivable | |
| (2.1 | ) | |
| (0.1 | ) | |
| (2.2 | ) | |
g |
| Inventory | |
| (11.9 | ) | |
| 0.3 | | |
| (11.6 | ) | |
c, g |
| Prepaid expenses and other assets | |
| 0.9 | | |
| (0.9 | ) | |
| - | | |
g |
| Corporate tax and other current taxes payable | |
| (7.2 | ) | |
| - | | |
| (7.2 | ) | |
|
| Accounts payable | |
| 4.3 | | |
| (0.1 | ) | |
| 4.2 | | |
g |
| Deferred revenues and customer prepayment | |
| (0.3 | ) | |
| 0.3 | | |
| - | | |
a, b, g |
| Accrued expenses | |
| 7.1 | | |
| - | | |
| 7.1 | | |
|
| Operating lease liabilities | |
| (0.7 | ) | |
| (0.3 | ) | |
| (1.0 | ) | |
e |
| Other long-term liabilities | |
| (0.7 | ) | |
| - | | |
| (0.7 | ) | |
|
| Net cash provided by operating activities | |
| 5.1 | | |
| (2.4 | ) | |
| 2.7 | | |
|
| | |
| | | |
| | | |
| | | |
|
| Cash flows from investing activities: | |
| | | |
| | | |
| | | |
|
| Purchases of property and equipment | |
| (5.2 | ) | |
| (0.4 | ) | |
| (5.6 | ) | |
|
| Acquisition of subsidiary company assets | |
| (0.6 | ) | |
| - | | |
| (0.6 | ) | |
|
| Disposal of trade and assets | |
| - | | |
| 1.3 | | |
| 1.3 | | |
|
| Purchases of capital software | |
| (5.1 | ) | |
| 1.2 | | |
| (3.9 | ) | |
|
| Net cash used in investing activities | |
| (10.9 | ) | |
| 2.1 | | |
| (8.8 | ) | |
|
| | |
| | | |
| | | |
| | | |
|
| Cash flows from financing activities: | |
| | | |
| | | |
| | | |
|
| Repayments of finance leases | |
| (0.1 | ) | |
| - | | |
| (0.1 | ) | |
|
| Net cash (used in) provided by financing activities | |
| (0.1 | ) | |
| - | | |
| (0.1 | ) | |
|
| | |
| | | |
| | | |
| | | |
|
| Effect of exchange rate changes on cash | |
| (1.1 | ) | |
| 0.3 | | |
| (0.8 | ) | |
g |
| Net increase in cash | |
| (7.0 | ) | |
| - | | |
| (7.0 | ) | |
|
| Cash, beginning of period | |
| 47.8 | | |
| - | | |
| 47.8 | | |
|
| Cash, end of period | |
$ | 40.8 | | |
$ | - | | |
$ | 40.8 | | |
|
| | |
| | | |
| | | |
| | | |
|
| Supplemental cash flow disclosures | |
| | | |
| | | |
| | | |
|
| Cash paid during the period for interest | |
$ | 0.2 | | |
$ | - | | |
$ | 0.2 | | |
|
| Cash paid during the period for income taxes | |
$ | - | | |
$ | - | | |
$ | - | | |
|
| Cash paid during the period for operating leases | |
$ | 0.9 | | |
$ | 0.8 | | |
$ | 1.7 | | |
|
| | |
| | | |
| | | |
| | | |
|
| Supplemental disclosure of noncash investing and financing activities | |
| | | |
| | | |
| | | |
|
| Property and equipment acquired through finance lease | |
$ | - | | |
$ | - | | |
$ | - | | |
|
| Property and equipment transferred to inventory | |
$ | 0.6 | | |
$ | - | | |
$ | 0.6 | | |
|
|
| X |
- References
+ Details
| Name: |
us-gaap_AccountingChangesAndErrorCorrectionsAbstract |
| Namespace Prefix: |
us-gaap_ |
| Data Type: |
xbrli:stringItemType |
| Balance Type: |
na |
| Period Type: |
duration |
|
| X |
- DefinitionTabular disclosure of prior period adjustments to previously issued financial statements including (1) the effect of the correction on each financial statement line item and any per-share amounts affected for each prior period presented (2) the cumulative effect of the change on retained earnings or other appropriate components of equity or net assets in the statement of financial position, as of the beginning of the earliest period presented, and (3) the effect of the prior period adjustments (both gross and net of applicable income tax) on the net income of each prior period presented in the entity's annual report for the year in which the adjustments are made. Reference 1: http://fasb.org/us-gaap/role/ref/legacyRef
-Name Accounting Standards Codification
-Topic 250
-SubTopic 10
-Section 50
-Paragraph 8
-Publisher FASB
-URI https://asc.fasb.org//1943274/2147483443/250-10-50-8
Reference 2: http://fasb.org/us-gaap/role/ref/legacyRef
-Name Accounting Standards Codification
-Topic 250
-SubTopic 10
-Section 50
-Paragraph 7
-Publisher FASB
-URI https://asc.fasb.org//1943274/2147483443/250-10-50-7
Reference 3: http://fasb.org/us-gaap/role/ref/legacyRef
-Name Accounting Standards Codification
-Topic 250
-SubTopic 10
-Section 50
-Paragraph 9
-Publisher FASB
-URI https://asc.fasb.org//1943274/2147483443/250-10-50-9
| Name: |
us-gaap_ScheduleOfErrorCorrectionsAndPriorPeriodAdjustmentsTextBlock |
| Namespace Prefix: |
us-gaap_ |
| Data Type: |
dtr-types:textBlockItemType |
| Balance Type: |
na |
| Period Type: |
duration |
|
v3.24.0.1
Allowance for Credit Losses, as restated (Tables)
|
3 Months Ended |
Mar. 31, 2023 |
|---|
| Receivables [Abstract] |
|
| Schedule of Changes in Allowance for Doubtful accounts |
Changes
in the allowance for doubtful accounts are as follows:
Schedule
of Changes in Allowance for Doubtful accounts
| | |
March
31, 2023 | | |
December
31, 2022 | |
| | |
(in millions) | |
| Beginning balance | |
$ | (1.4 | ) | |
$ | (1.8 | ) |
| Additional provision for doubtful accounts | |
| (0.1 | ) | |
| (0.2 | ) |
| Recoveries | |
| 0.1 | | |
| — | |
| Write offs | |
| — | | |
| 0.4 | |
| Foreign currency translation adjustments | |
| — | | |
| 0.2 | |
| Ending balance | |
$ | (1.4 | ) | |
$ | (1.4 | ) |
|
| X |
- DefinitionTabular disclosure of allowance for credit loss on accounts receivable. Reference 1: http://www.xbrl.org/2009/role/commonPracticeRef
-Topic 326
-SubTopic 20
-Name Accounting Standards Codification
-Section 50
-Paragraph 13
-Publisher FASB
-URI https://asc.fasb.org//1943274/2147479319/326-20-50-13
| Name: |
us-gaap_AccountsReceivableAllowanceForCreditLossTableTextBlock |
| Namespace Prefix: |
us-gaap_ |
| Data Type: |
dtr-types:textBlockItemType |
| Balance Type: |
na |
| Period Type: |
duration |
|
| X |
- References
+ Details
| Name: |
us-gaap_ReceivablesAbstract |
| Namespace Prefix: |
us-gaap_ |
| Data Type: |
xbrli:stringItemType |
| Balance Type: |
na |
| Period Type: |
duration |
|
v3.24.0.1
Inventory, as restated (Tables)
|
3 Months Ended |
Mar. 31, 2023 |
|---|
| Inventory Disclosure [Abstract] |
|
| Schedule of Inventory |
Schedule
of Inventory
| | |
March
31, 2023 | | |
December
31, 2022 | |
| | |
(in millions) | |
| Component parts | |
$ | 21.4 | | |
$ | 20.7 | |
| Work in progress | |
| 2.9 | | |
| 3.6 | |
| Finished goods | |
| 10.3 | | |
| 6.0 | |
| Total inventories | |
$ | 34.6 | | |
$ | 30.3 | |
|
| X |
- References
+ Details
| Name: |
us-gaap_InventoryDisclosureAbstract |
| Namespace Prefix: |
us-gaap_ |
| Data Type: |
xbrli:stringItemType |
| Balance Type: |
na |
| Period Type: |
duration |
|
| X |
- DefinitionTabular disclosure of the carrying amount as of the balance sheet date of merchandise, goods, commodities, or supplies held for future sale or to be used in manufacturing, servicing or production process. Reference 1: http://fasb.org/us-gaap/role/ref/legacyRef
-Topic 210
-SubTopic 10
-Name Accounting Standards Codification
-Section S99
-Paragraph 1
-Subparagraph (SX 210.5-02(6)(a))
-Publisher FASB
-URI https://asc.fasb.org//1943274/2147480566/210-10-S99-1
Reference 2: http://fasb.org/us-gaap/role/ref/legacyRef
-Topic 210
-SubTopic 10
-Name Accounting Standards Codification
-Section S99
-Paragraph 1
-Subparagraph (SX 210.5-02(6)(b))
-Publisher FASB
-URI https://asc.fasb.org//1943274/2147480566/210-10-S99-1
Reference 3: http://fasb.org/us-gaap/role/ref/legacyRef
-Topic 210
-SubTopic 10
-Name Accounting Standards Codification
-Section S99
-Paragraph 1
-Subparagraph (SX 210.5-02(6)(c))
-Publisher FASB
-URI https://asc.fasb.org//1943274/2147480566/210-10-S99-1
Reference 4: http://fasb.org/us-gaap/role/ref/legacyRef
-Name Accounting Standards Codification
-Topic 210
-SubTopic 10
-Section 50
-Paragraph 1
-Publisher FASB
-URI https://asc.fasb.org//1943274/2147483489/210-10-50-1
| Name: |
us-gaap_ScheduleOfInventoryCurrentTableTextBlock |
| Namespace Prefix: |
us-gaap_ |
| Data Type: |
dtr-types:textBlockItemType |
| Balance Type: |
na |
| Period Type: |
duration |
|
v3.24.0.1
Contract Liabilities and Other Disclosures, as restated (Tables)
|
3 Months Ended |
Mar. 31, 2023 |
|---|
| Contract Liabilities And Other Disclosures As Restated |
|
| Schedule of Contract Related Balances |
The
following table summarizes contract related balances:
Schedule
of Contract Related Balances
| | |
Accounts Receivable | | |
Unbilled Accounts Receivable | | |
Deferred Income | | |
Customer Prepayments and Deposits | |
| | |
(in millions) | |
| At March 31, 2023 | |
$ | 36.7 | | |
$ | 15.4 | | |
$ | (7.2 | ) | |
$ | (2.6 | ) |
| At December 31, 2022 | |
$ | 44.6 | | |
$ | 18.0 | | |
$ | (7.4 | ) | |
$ | (2.4 | ) |
|
| X |
- References
+ Details
| Name: |
INSE_DisclosureContractLiabilitiesAndOtherDisclosuresAsRestatedAbstract |
| Namespace Prefix: |
INSE_ |
| Data Type: |
xbrli:stringItemType |
| Balance Type: |
na |
| Period Type: |
duration |
|
| X |
- DefinitionTabular disclosure of receivable, contract asset, and contract liability from contract with customer. Includes, but is not limited to, change in contract asset and contract liability. Reference 1: http://www.xbrl.org/2009/role/commonPracticeRef
-Topic 606
-SubTopic 10
-Name Accounting Standards Codification
-Section 50
-Paragraph 10
-Publisher FASB
-URI https://asc.fasb.org//1943274/2147479806/606-10-50-10
| Name: |
us-gaap_ContractWithCustomerAssetAndLiabilityTableTextBlock |
| Namespace Prefix: |
us-gaap_ |
| Data Type: |
dtr-types:textBlockItemType |
| Balance Type: |
na |
| Period Type: |
duration |
|
v3.24.0.1
Stock-Based Compensation (Tables)
|
3 Months Ended |
Mar. 31, 2023 |
|---|
| Share-Based Payment Arrangement [Abstract] |
|
| Schedule of Restricted Stock Unit Activity |
A
summary of the Company’s RSU activity during the three months ended March 31, 2023 is as follows:
Schedule of Restricted Stock Unit Activity
| | |
Number of Shares | |
| | |
| |
| Unvested Outstanding at January 1, 2023 | |
| 1,647,544 | |
| Granted (1) | |
| 495,225 | |
| Forfeited | |
| (6,266 | ) |
| Vested | |
| (219,272 | ) |
| Unvested Outstanding at March 31, 2023 | |
| 1,917,231 | |
| (1) |
The
amount shown as granted in the table includes 219,213 performance-based target RSUs as to which the number that ultimately vests
would range from 0% to 200% of the target amount of RSUs (a maximum of 438,426 RSUs based on attainment of Adjusted EBITDA targets
for 2023). |
|
| X |
- DefinitionTabular disclosure of the number and weighted-average grant date fair value for restricted stock units that were outstanding at the beginning and end of the year, and the number of restricted stock units that were granted, vested, or forfeited during the year. Reference 1: http://fasb.org/us-gaap/role/ref/legacyRef
-Name Accounting Standards Codification
-Topic 718
-SubTopic 10
-Section 50
-Paragraph 2
-Subparagraph (c)(1)
-Publisher FASB
-URI https://asc.fasb.org//1943274/2147480429/718-10-50-2
| Name: |
us-gaap_ScheduleOfShareBasedCompensationRestrictedStockUnitsAwardActivityTableTextBlock |
| Namespace Prefix: |
us-gaap_ |
| Data Type: |
dtr-types:textBlockItemType |
| Balance Type: |
na |
| Period Type: |
duration |
|
v3.24.0.1
Accumulated Other Comprehensive Loss (Income), as restated (Tables)
|
3 Months Ended |
Mar. 31, 2023 |
|---|
| Equity [Abstract] |
|
| Schedule of Accumulated Other Comprehensive Loss (Income) |
The
accumulated balances for each classification of comprehensive loss (income) are presented below:
Schedule of Accumulated Other Comprehensive Loss (Income)
| | |
Foreign Currency Translation Adjustments | | |
Change in Fair Value of Hedging Instrument | | |
Unrecognized Pension Benefit Costs | | |
Accumulated Other Comprehensive (Income) | |
| | |
(in millions) | |
| Balance at January 1, 2023 | |
| (84.2 | ) | |
| 0.3 | | |
| 33.1 | | |
| (50.8 | ) |
| Change during the period | |
| 2.9 | | |
| (0.2 | ) | |
| (0.2 | ) | |
| 2.5 | |
| Balance at March 31, 2023 | |
$ | (81.3 | ) | |
$ | 0.1 | | |
$ | 32.9 | | |
$ | (48.3 | ) |
| | |
Foreign Currency Translation Adjustments | | |
Change in Fair Value of Hedging Instrument | | |
Unrecognized Pension Benefit Costs | | |
Accumulated Other Comprehensive (Income) | |
| | |
(in millions) | |
| Balance at January 1, 2022 | |
| (71.5 | ) | |
| 1.0 | | |
| 26.7 | | |
| (43.8 | ) |
| Change during the period | |
| (3.5 | ) | |
| (0.2 | ) | |
| (0.1 | ) | |
| (3.8 | ) |
| Balance at March 31, 2022 | |
$ | (75.0 | ) | |
$ | 0.8 | | |
$ | 26.6 | | |
$ | (47.6 | ) |
|
| X |
- References
+ Details
| Name: |
us-gaap_EquityAbstract |
| Namespace Prefix: |
us-gaap_ |
| Data Type: |
xbrli:stringItemType |
| Balance Type: |
na |
| Period Type: |
duration |
|
| X |
- DefinitionTabular disclosure of the components of accumulated other comprehensive income (loss). Reference 1: http://fasb.org/us-gaap/role/ref/legacyRef
-Name Accounting Standards Codification
-Topic 220
-SubTopic 10
-Section 45
-Paragraph 14A
-Publisher FASB
-URI https://asc.fasb.org//1943274/2147482790/220-10-45-14A
Reference 2: http://www.xbrl.org/2009/role/commonPracticeRef
-Topic 830
-SubTopic 30
-Name Accounting Standards Codification
-Section 50
-Paragraph 1
-Publisher FASB
-URI https://asc.fasb.org//1943274/2147481674/830-30-50-1
Reference 3: http://www.xbrl.org/2009/role/commonPracticeRef
-Topic 830
-SubTopic 30
-Name Accounting Standards Codification
-Section 45
-Paragraph 20
-Publisher FASB
-URI https://asc.fasb.org//1943274/2147481694/830-30-45-20
| Name: |
us-gaap_ScheduleOfAccumulatedOtherComprehensiveIncomeLossTableTextBlock |
| Namespace Prefix: |
us-gaap_ |
| Data Type: |
dtr-types:textBlockItemType |
| Balance Type: |
na |
| Period Type: |
duration |
|
v3.24.0.1
Net Earnings (Loss) per Share, as restated (Tables)
|
3 Months Ended |
Mar. 31, 2023 |
|---|
| Earnings Per Share [Abstract] |
|
| Schedule of Anti-dilutive Securities Excluded from Computation of Earnings per Share |
The
computation of diluted EPS excludes the common stock equivalents of the following potentially dilutive securities because they were either
contingently issuable shares or because their inclusion would be anti-dilutive:
Schedule of Anti-dilutive Securities Excluded from Computation of Earnings per Share
| | |
2023 | | |
2022 | |
| | |
Three Months Ended March 31, | |
| | |
2023 | | |
2022 | |
| RSUs | |
$ | 1,917,231 | | |
$ | 695,372 | |
|
| Schedule of Numerators and Denominators of the Basic and Diluted EPS Computations |
The
following table reconciles the numerators and denominators of the basic and diluted EPS computations for the three months ended March
31, 2022. There were no reconciling items for the three months ended March 31, 2023.
Schedule
of Numerators and Denominators of the Basic and Diluted EPS Computations
| | |
Income
(Numerator) | | |
Shares
(Denominator) | | |
Per-Share Amount,
Three Months
Ended
March 31, 2022 | |
| | |
(in
millions) | | |
| | |
| |
| Basic EPS | |
| | | |
| | | |
| | |
| Income available to common stockholders | |
$ | 1.5 | | |
| 28,437,052 | | |
$ | 0.05 | |
| Effect of Dilutive Securities | |
| | | |
| | | |
| | |
| RSUs | |
| — | | |
| 925,330 | | |
| — | |
| Diluted EPS | |
| | | |
| | | |
| | |
| Income available to common stockholders | |
$ | 1.5 | | |
$ | 29,362,382 | | |
$ | 0.05 | |
The calculation of Basic EPS includes the effects
of 1,893,136 and 1,591,632 shares for the three months ended March 31 2023 and 2022, respectively, with respect to RSU awards that have
vested but have not yet been issued.
|
| X |
- References
+ Details
| Name: |
us-gaap_EarningsPerShareAbstract |
| Namespace Prefix: |
us-gaap_ |
| Data Type: |
xbrli:stringItemType |
| Balance Type: |
na |
| Period Type: |
duration |
|
| X |
- DefinitionTabular disclosure of securities (including those issuable pursuant to contingent stock agreements) that could potentially dilute basic earnings per share (EPS) in the future that were not included in the computation of diluted EPS because to do so would increase EPS amounts or decrease loss per share amounts for the period presented, by antidilutive securities. Reference 1: http://fasb.org/us-gaap/role/ref/legacyRef
-Name Accounting Standards Codification
-Topic 260
-SubTopic 10
-Section 50
-Paragraph 1
-Subparagraph (c)
-Publisher FASB
-URI https://asc.fasb.org//1943274/2147482662/260-10-50-1
| Name: |
us-gaap_ScheduleOfAntidilutiveSecuritiesExcludedFromComputationOfEarningsPerShareTextBlock |
| Namespace Prefix: |
us-gaap_ |
| Data Type: |
dtr-types:textBlockItemType |
| Balance Type: |
na |
| Period Type: |
duration |
|
| X |
- DefinitionTabular disclosure of an entity's basic and diluted earnings per share calculations, including a reconciliation of numerators and denominators of the basic and diluted per-share computations for income from continuing operations. Reference 1: http://www.xbrl.org/2009/role/commonPracticeRef
-Topic 260
-SubTopic 10
-Name Accounting Standards Codification
-Section 50
-Paragraph 1
-Subparagraph (a)
-Publisher FASB
-URI https://asc.fasb.org//1943274/2147482662/260-10-50-1
| Name: |
us-gaap_ScheduleOfEarningsPerShareBasicAndDilutedTableTextBlock |
| Namespace Prefix: |
us-gaap_ |
| Data Type: |
dtr-types:textBlockItemType |
| Balance Type: |
na |
| Period Type: |
duration |
|
v3.24.0.1
Other Finance Income (Expense) (Tables)
|
3 Months Ended |
Mar. 31, 2023 |
|---|
| Other Income and Expenses [Abstract] |
|
| Schedule of Other Finance Income (expense) |
Other
finance income (expense) consisted of the following:
Schedule of Other Finance Income (expense)
| | |
2023 | | |
2022 | |
| | |
Three Months Ended March 31, | |
| | |
2023 | | |
2022 | |
| | |
(in millions) | |
| Pension interest cost | |
$ | (0.8 | ) | |
$ | (0.6 | ) |
| Expected return on pension plan assets | |
| 0.9 | | |
| 0.9 | |
| Other finance income
(expense) | |
$ | 0.1 | | |
$ | 0.3 | |
|
| X |
- DefinitionTabular disclosure of interest income and income classified as other.
| Name: |
us-gaap_InterestAndOtherIncomeTableTextBlock |
| Namespace Prefix: |
us-gaap_ |
| Data Type: |
dtr-types:textBlockItemType |
| Balance Type: |
na |
| Period Type: |
duration |
|
| X |
- References
+ Details
| Name: |
us-gaap_OtherIncomeAndExpensesAbstract |
| Namespace Prefix: |
us-gaap_ |
| Data Type: |
xbrli:stringItemType |
| Balance Type: |
na |
| Period Type: |
duration |
|
v3.24.0.1
Pension Plan, as restated (Tables)
|
3 Months Ended |
Mar. 31, 2023 |
|---|
| Retirement Benefits [Abstract] |
|
| Schedule of Defined Benefit Plans |
The
following table presents the components of our net periodic pension benefit:
Schedule of Defined Benefit Plans
| | |
2023 | | |
2022 | |
| | |
Three Months Ended March 31, | |
| | |
2023 | | |
2022 | |
| | |
(in millions) | |
| Components of net periodic pension benefit: | |
| | |
| |
| Interest cost | |
$ | 0.8 | | |
$ | 0.6 | |
| Expected return on plan assets | |
| (0.9 | ) | |
| (0.9 | ) |
| Amortization of net loss | |
| 0.2 | | |
| 0.1 | |
| Net periodic benefit | |
$ | 0.1 | | |
$ | (0.2 | ) |
|
| Schedule of Pension Plans and their Reconciliation |
The
following table sets forth the estimate of the combined funded status of the pension plans and their reconciliation to the related amounts
recognized in our consolidated financial statements at the respective measurement dates:
Schedule of Pension Plans and their Reconciliation
| | |
March
31, 2023 | | |
December
31, 2022 | |
| | |
(in millions) | |
| Change in benefit obligation: | |
| | | |
| | |
| Benefit obligation at beginning of period | |
$ | 71.2 | | |
$ | 122.7 | |
| Interest cost | |
| 0.8 | | |
| 2.2 | |
| Actuarial loss (gain) | |
| — | | |
| (39.0 | ) |
| Benefits paid | |
| (0.7 | ) | |
| (3.5 | ) |
| Foreign currency translation adjustments | |
| 1.9 | | |
| (11.2 | ) |
| Benefit obligation at end of period | |
$ | 73.2 | | |
$ | 71.2 | |
| Change in plan assets: | |
| | | |
| | |
| Fair value of plan assets at beginning of period | |
$ | 69.1 | | |
$ | 125.7 | |
| Actual gain (loss) on plan assets | |
| 0.9 | | |
| (42.4 | ) |
| Employer contributions | |
| 0.3 | | |
| 1.4 | |
| Benefits paid | |
| (0.7 | ) | |
| (3.5 | ) |
| Foreign currency translation adjustments | |
| 1.8 | | |
| (12.1 | ) |
| Fair value of assets at end of period | |
$ | 71.4 | | |
$ | 69.1 | |
| Amount recognized in the consolidated balance sheets: | |
| | | |
| | |
| Unfunded status (non-current) | |
$ | (1.8 | ) | |
$ | (2.1 | ) |
| Net amount recognized | |
$ | (1.8 | ) | |
$ | (2.1 | ) |
|
| X |
- References
+ Details
| Name: |
us-gaap_CompensationAndRetirementDisclosureAbstract |
| Namespace Prefix: |
us-gaap_ |
| Data Type: |
xbrli:stringItemType |
| Balance Type: |
na |
| Period Type: |
duration |
|
| X |
- DefinitionTabular disclosure of one or more of the entity's defined benefit pension plans or one or more other defined benefit postretirement plans, separately for pension plans and other postretirement benefit plans including the entity's schedule of fair value of plan assets for defined benefit or other postretirement plans. Reference 1: http://fasb.org/us-gaap/role/ref/legacyRef
-Name Accounting Standards Codification
-Section 50
-Paragraph 1
-SubTopic 20
-Topic 715
-Publisher FASB
-URI https://asc.fasb.org//1943274/2147480506/715-20-50-1
Reference 2: http://fasb.org/us-gaap/role/ref/legacyRef
-Name Accounting Standards Codification
-Topic 715
-SubTopic 20
-Section 55
-Paragraph 17
-Publisher FASB
-URI https://asc.fasb.org//1943274/2147480482/715-20-55-17
Reference 3: http://fasb.org/us-gaap/role/ref/legacyRef
-Name Accounting Standards Codification
-Topic 715
-SubTopic 20
-Section 50
-Paragraph 3
-Publisher FASB
-URI https://asc.fasb.org//1943274/2147480506/715-20-50-3
Reference 4: http://fasb.org/us-gaap/role/ref/legacyRef
-Name Accounting Standards Codification
-Topic 715
-SubTopic 20
-Section 50
-Paragraph 4
-Publisher FASB
-URI https://asc.fasb.org//1943274/2147480506/715-20-50-4
Reference 5: http://fasb.org/us-gaap/role/ref/legacyRef
-Name Accounting Standards Codification
-Topic 715
-SubTopic 20
-Section 50
-Paragraph 2
-Publisher FASB
-URI https://asc.fasb.org//1943274/2147480506/715-20-50-2
| Name: |
us-gaap_ScheduleOfDefinedBenefitPlansDisclosuresTextBlock |
| Namespace Prefix: |
us-gaap_ |
| Data Type: |
dtr-types:textBlockItemType |
| Balance Type: |
na |
| Period Type: |
duration |
|
| X |
- DefinitionTabular disclosure of the amounts related to pension plans and/or other employee benefit plans in accumulated other comprehensive income or loss that have not yet been recognized as components of net periodic benefit cost, such as the net gain (loss), net prior service cost or credit, and net transition asset or obligation. Reference 1: http://fasb.org/us-gaap/role/ref/legacyRef
-Topic 715
-SubTopic 20
-Subparagraph (j)
-Name Accounting Standards Codification
-Paragraph 1
-Section 50
-Publisher FASB
-URI https://asc.fasb.org//1943274/2147480506/715-20-50-1
| Name: |
us-gaap_ScheduleOfNetPeriodicBenefitCostNotYetRecognizedTableTextBlock |
| Namespace Prefix: |
us-gaap_ |
| Data Type: |
dtr-types:textBlockItemType |
| Balance Type: |
na |
| Period Type: |
duration |
|
v3.24.0.1
Segment Reporting and Geographic Information, as restated (Tables)
|
3 Months Ended |
Mar. 31, 2023 |
|---|
| Segment Reporting [Abstract] |
|
| Schedule of Segment Reporting Information by Segment |
Segment
Information
Schedule of Segment Reporting Information by Segment
Three
Months Ended March 31, 2023
| | |
Gaming | | |
Virtual Sports | | |
Interactive | | |
Leisure | | |
Corporate Functions | | |
Total | |
| | |
(in millions) | |
| Revenue: | |
| | |
| | |
| | |
| | |
| | |
| |
| Service | |
$ | 20.2 | | |
$ | 14.8 | | |
$ | 5.9 | | |
$ | 16.6 | | |
$ | — | | |
$ | 57.5 | |
| Product sales | |
| 6.9 | | |
| — | | |
| — | | |
| 0.5 | | |
| — | | |
| 7.4 | |
| Total revenue | |
| 27.1 | | |
| 14.8 | | |
| 5.9 | | |
| 17.1 | | |
| — | | |
| 64.9 | |
| Cost of sales, excluding depreciation and amortization: | |
| | | |
| | | |
| | | |
| | | |
| | | |
| | |
| Cost of service | |
| (5.9 | ) | |
| (0.4 | ) | |
| (0.3 | ) | |
| (8.4 | ) | |
| — | | |
| (15.0 | ) |
| Cost of product sales | |
| (5.8 | ) | |
| — | | |
| — | | |
| (0.9 | ) | |
| — | | |
| (6.7 | ) |
| Selling, general and administrative expenses | |
| (5.7 | ) | |
| (1.7 | ) | |
| (2.5 | ) | |
| (6.9 | ) | |
| (9.5 | ) | |
| (26.3 | ) |
| Stock-based compensation expense | |
| (0.3 | ) | |
| (0.2 | ) | |
| (0.2 | ) | |
| (0.1 | ) | |
| (2.1 | ) | |
| (2.9 | ) |
| Acquisition and integration related transaction expenses | |
| — | | |
| — | | |
| — | | |
| — | | |
| — | | |
| — | |
| Depreciation and amortization | |
| (4.5 | ) | |
| (0.8 | ) | |
| (0.6 | ) | |
| (3.1 | ) | |
| (0.4 | ) | |
| (9.4 | ) |
| Segment operating income (loss) | |
| 4.9 | | |
| 11.7 | | |
| 2.3 | | |
| (2.3 | ) | |
| (12.0 | ) | |
| 4.6 | |
| | |
| | | |
| | | |
| | | |
| | | |
| | | |
| | |
| Net operating income | |
| | | |
| | | |
| | | |
| | | |
| | | |
$ | 4.6 | |
| | |
| | | |
| | | |
| | | |
| | | |
| | | |
| | |
| Total capital expenditures for the three months ended March 31, 2023 | |
$ | 2.4 | | |
$ | 0.4 | | |
$ | 1.1 | | |
$ | 5.2 | | |
$ | 0.5 | | |
$ | 9.6 | |
Three
Months Ended March 31, 2022
| | |
Gaming | | |
Virtual Sports | | |
Interactive | | |
Leisure | | |
Corporate Functions | | |
Total | |
| | |
(in millions) | |
| Revenue: | |
| | |
| | |
| | |
| | |
| | |
| |
| Service | |
$ | 21.1 | | |
$ | 11.3 | | |
$ | 4.6 | | |
$ | 19.0 | | |
$ | — | | |
$ | 56.0 | |
| Product sales | |
| 3.7 | | |
| — | | |
| — | | |
| 0.6 | | |
| — | | |
| 4.3 | |
| Total revenue | |
| 24.8 | | |
| 11.3 | | |
| 4.6 | | |
| 19.6 | | |
| — | | |
| 60.3 | |
| Cost of sales, excluding depreciation and amortization: | |
| | | |
| | | |
| | | |
| | | |
| | | |
| | |
| Cost of service | |
| (6.0 | ) | |
| (0.4 | ) | |
| (0.3 | ) | |
| (10.1 | ) | |
| — | | |
| (16.8 | ) |
| Cost of product sales | |
| (2.3 | ) | |
| — | | |
| — | | |
| (0.2 | ) | |
| — | | |
| (2.5 | ) |
| Selling, general and administrative expenses | |
| (5.0 | ) | |
| (1.7 | ) | |
| (1.4 | ) | |
| (6.6 | ) | |
| (5.7 | ) | |
| (20.4 | ) |
| Stock-based compensation expense | |
| (0.3 | ) | |
| (0.1 | ) | |
| (0.1 | ) | |
| (0.2 | ) | |
| (2.1 | ) | |
| (2.8 | ) |
| Acquisition and integration related transaction expenses | |
| (0.1 | ) | |
| — | | |
| — | | |
| — | | |
| (0.1 | ) | |
| (0.2 | ) |
| Depreciation and amortization | |
| (5.2 | ) | |
| (0.8 | ) | |
| (0.6 | ) | |
| (3.6 | ) | |
| (0.5 | ) | |
| (10.7 | ) |
| Segment operating income (loss) | |
| 5.9 | | |
| 8.3 | | |
| 2.2 | | |
| (1.1 | ) | |
| (8.4 | ) | |
| 6.9 | |
| | |
| | | |
| | | |
| | | |
| | | |
| | | |
| | |
| Net operating income | |
| | | |
| | | |
| | | |
| | | |
| | | |
$ | 6.9 | |
| | |
| | | |
| | | |
| | | |
| | | |
| | | |
| | |
| Total capital expenditures for the three months ended March 31, 2022 | |
$ | 2.9 | | |
$ | 0.5 | | |
$ | 0.9 | | |
$ | 4.0 | | |
$ | 1.2 | | |
$ | 9.5 | |
|
| Schedule of Geographic Information |
Geographic
information for revenue is set forth below:
Schedule of Geographic Information
| | |
2023 | | |
2022 | |
| | |
Three Months Ended March 31, | |
| | |
2023 | | |
2022 | |
| | |
(in millions) | |
| Total revenue | |
| | | |
| | |
| UK | |
$ | 49.0 | | |
$ | 45.9 | |
| Greece | |
| 5.6 | | |
| 5.6 | |
| Rest of world | |
| 10.3 | | |
| 8.8 | |
| Total | |
$ | 64.9 | | |
$ | 60.3 | |
| Total
revenue | |
$ | 64.9 | | |
$ | 60.3 | |
Geographic
information of our non-current assets excluding goodwill is set forth below:
| | |
March
31, 2023 | | |
December
31, 2022 | |
| | |
(in millions) | |
| UK | |
$ | 87.5 | | |
$ | 82.7 | |
| Greece | |
| 5.1 | | |
| 5.8 | |
| Rest of world | |
| 16.1 | | |
| 16.3 | |
| Total | |
$ | 108.7 | | |
$ | 104.8 | |
| Total non-current assets excluding goodwill | |
$ | 108.7 | | |
$ | 104.8 | |
|
| X |
- DefinitionTabular disclosure of information concerning material long-lived assets (excluding financial instruments, customer relationships with financial institutions, mortgage and other servicing rights, deferred policy acquisition costs, and deferred taxes assets) located in identified geographic areas and/or the amount of revenue from external customers attributed to that country from which revenue is material. An entity may also provide subtotals of geographic information about groups of countries. Reference 1: http://fasb.org/us-gaap/role/ref/legacyRef
-Name Accounting Standards Codification
-Topic 280
-SubTopic 10
-Section 50
-Paragraph 41
-Publisher FASB
-URI https://asc.fasb.org//1943274/2147482810/280-10-50-41
Reference 2: http://fasb.org/us-gaap/role/ref/legacyRef
-Topic 220
-SubTopic 10
-Name Accounting Standards Codification
-Section S99
-Paragraph 2
-Subparagraph (SX 210.5-03.1)
-Publisher FASB
-URI https://asc.fasb.org//1943274/2147483621/220-10-S99-2
| Name: |
us-gaap_ScheduleOfRevenuesFromExternalCustomersAndLongLivedAssetsByGeographicalAreasTableTextBlock |
| Namespace Prefix: |
us-gaap_ |
| Data Type: |
dtr-types:textBlockItemType |
| Balance Type: |
na |
| Period Type: |
duration |
|
| X |
- DefinitionTabular disclosure of the profit or loss and total assets for each reportable segment. An entity discloses certain information on each reportable segment if the amounts (a) are included in the measure of segment profit or loss reviewed by the chief operating decision maker or (b) are otherwise regularly provided to the chief operating decision maker, even if not included in that measure of segment profit or loss. Reference 1: http://fasb.org/us-gaap/role/ref/legacyRef
-Name Accounting Standards Codification
-Topic 350
-SubTopic 20
-Section 50
-Paragraph 1
-Publisher FASB
-URI https://asc.fasb.org//1943274/2147482573/350-20-50-1
Reference 2: http://fasb.org/us-gaap/role/ref/legacyRef
-Name Accounting Standards Codification
-Topic 280
-SubTopic 10
-Section 50
-Paragraph 25
-Publisher FASB
-URI https://asc.fasb.org//1943274/2147482810/280-10-50-25
Reference 3: http://fasb.org/us-gaap/role/ref/legacyRef
-Name Accounting Standards Codification
-Topic 280
-SubTopic 10
-Section 50
-Paragraph 22
-Publisher FASB
-URI https://asc.fasb.org//1943274/2147482810/280-10-50-22
Reference 4: http://fasb.org/us-gaap/role/ref/legacyRef
-Name Accounting Standards Codification
-Topic 280
-SubTopic 10
-Section 50
-Paragraph 30
-Publisher FASB
-URI https://asc.fasb.org//1943274/2147482810/280-10-50-30
| Name: |
us-gaap_ScheduleOfSegmentReportingInformationBySegmentTextBlock |
| Namespace Prefix: |
us-gaap_ |
| Data Type: |
dtr-types:textBlockItemType |
| Balance Type: |
na |
| Period Type: |
duration |
|
| X |
- References
+ Details
| Name: |
us-gaap_SegmentReportingAbstract |
| Namespace Prefix: |
us-gaap_ |
| Data Type: |
xbrli:stringItemType |
| Balance Type: |
na |
| Period Type: |
duration |
|
v3.24.0.1
| X |
- DefinitionAdditional working capital.
| Name: |
INSE_AdditionalWorkingCapital |
| Namespace Prefix: |
INSE_ |
| Data Type: |
xbrli:monetaryItemType |
| Balance Type: |
credit |
| Period Type: |
instant |
|
| X |
- DefinitionAmount of working capital.
| Name: |
INSE_WorkingCapital |
| Namespace Prefix: |
INSE_ |
| Data Type: |
xbrli:monetaryItemType |
| Balance Type: |
credit |
| Period Type: |
instant |
|
| X |
- References
+ Details
| Name: |
us-gaap_AccountingPoliciesAbstract |
| Namespace Prefix: |
us-gaap_ |
| Data Type: |
xbrli:stringItemType |
| Balance Type: |
na |
| Period Type: |
duration |
|
| X |
- DefinitionAmount of expense for award under share-based payment arrangement. Excludes amount capitalized. Reference 1: http://www.xbrl.org/2003/role/disclosureRef
-Topic 718
-SubTopic 10
-Name Accounting Standards Codification
-Section S99
-Paragraph 1
-Subparagraph (SAB Topic 14.F)
-Publisher FASB
-URI https://asc.fasb.org//1943274/2147479830/718-10-S99-1
Reference 2: http://www.xbrl.org/2003/role/disclosureRef
-Topic 718
-SubTopic 10
-Name Accounting Standards Codification
-Section 50
-Paragraph 2
-Subparagraph (h)(1)(i)
-Publisher FASB
-URI https://asc.fasb.org//1943274/2147480429/718-10-50-2
| Name: |
us-gaap_AllocatedShareBasedCompensationExpense |
| Namespace Prefix: |
us-gaap_ |
| Data Type: |
xbrli:monetaryItemType |
| Balance Type: |
debit |
| Period Type: |
duration |
|
| X |
- DefinitionAmount of currency on hand as well as demand deposits with banks or financial institutions. Includes other kinds of accounts that have the general characteristics of demand deposits. Excludes cash and cash equivalents within disposal group and discontinued operation. Reference 1: http://www.xbrl.org/2003/role/exampleRef
-Topic 852
-SubTopic 10
-Name Accounting Standards Codification
-Section 55
-Paragraph 10
-Publisher FASB
-URI https://asc.fasb.org//1943274/2147481372/852-10-55-10
Reference 2: http://www.xbrl.org/2003/role/exampleRef
-Topic 946
-SubTopic 830
-Name Accounting Standards Codification
-Section 55
-Paragraph 12
-Publisher FASB
-URI https://asc.fasb.org//1943274/2147480167/946-830-55-12
Reference 3: http://www.xbrl.org/2003/role/disclosureRef
-Topic 944
-SubTopic 210
-Name Accounting Standards Codification
-Section S99
-Paragraph 1
-Subparagraph (SX 210.7-03(a)(2))
-Publisher FASB
-URI https://asc.fasb.org//1943274/2147479440/944-210-S99-1
Reference 4: http://www.xbrl.org/2003/role/disclosureRef
-Topic 946
-SubTopic 210
-Name Accounting Standards Codification
-Section S99
-Paragraph 1
-Subparagraph (SX 210.6-04(4))
-Publisher FASB
-URI https://asc.fasb.org//1943274/2147479617/946-210-S99-1
Reference 5: http://www.xbrl.org/2003/role/disclosureRef
-Topic 946
-SubTopic 210
-Name Accounting Standards Codification
-Section 45
-Paragraph 21
-Publisher FASB
-URI https://asc.fasb.org//1943274/2147480555/946-210-45-21
Reference 6: http://www.xbrl.org/2009/role/commonPracticeRef
-Topic 210
-SubTopic 10
-Name Accounting Standards Codification
-Section S99
-Paragraph 1
-Subparagraph (SX 210.5-02(1))
-Publisher FASB
-URI https://asc.fasb.org//1943274/2147480566/210-10-S99-1
Reference 7: http://www.xbrl.org/2003/role/disclosureRef
-Name Accounting Standards Codification
-Section 45
-Paragraph 20
-SubTopic 210
-Topic 946
-Publisher FASB
-URI https://asc.fasb.org//1943274/2147480555/946-210-45-20
| Name: |
us-gaap_Cash |
| Namespace Prefix: |
us-gaap_ |
| Data Type: |
xbrli:monetaryItemType |
| Balance Type: |
debit |
| Period Type: |
instant |
|
| X |
- DefinitionAmount of deferred income excluding obligation to transfer product and service to customer for which consideration has been received or is receivable. Reference 1: http://www.xbrl.org/2009/role/commonPracticeRef
-Topic 944
-SubTopic 30
-Name Accounting Standards Codification
-Section 50
-Paragraph 2B
-Subparagraph (a)
-Publisher FASB
-URI https://asc.fasb.org//1943274/2147479432/944-30-50-2B
Reference 2: http://www.xbrl.org/2009/role/commonPracticeRef
-Topic 944
-SubTopic 40
-Name Accounting Standards Codification
-Section 65
-Paragraph 2
-Subparagraph (g)(1)
-Publisher FASB
-URI https://asc.fasb.org//1943274/2147480016/944-40-65-2
Reference 3: http://www.xbrl.org/2009/role/commonPracticeRef
-Name Accounting Standards Codification
-Section 25
-Paragraph 2
-SubTopic 10
-Topic 470
-Publisher FASB
-URI https://asc.fasb.org//1943274/2147481174/470-10-25-2
| Name: |
us-gaap_DeferredIncome |
| Namespace Prefix: |
us-gaap_ |
| Data Type: |
xbrli:monetaryItemType |
| Balance Type: |
credit |
| Period Type: |
instant |
|
| X |
- DefinitionAmount of cash inflow (outflow) from operating activities, including discontinued operations. Operating activity cash flows include transactions, adjustments, and changes in value not defined as investing or financing activities. Reference 1: http://fasb.org/us-gaap/role/ref/legacyRef
-Topic 230
-SubTopic 10
-Name Accounting Standards Codification
-Section 45
-Paragraph 28
-Publisher FASB
-URI https://asc.fasb.org//1943274/2147482740/230-10-45-28
Reference 2: http://fasb.org/us-gaap/role/ref/legacyRef
-Topic 230
-SubTopic 10
-Name Accounting Standards Codification
-Section 45
-Paragraph 24
-Publisher FASB
-URI https://asc.fasb.org//1943274/2147482740/230-10-45-24
Reference 3: http://fasb.org/us-gaap/role/ref/legacyRef
-Topic 230
-SubTopic 10
-Name Accounting Standards Codification
-Section 45
-Paragraph 25
-Publisher FASB
-URI https://asc.fasb.org//1943274/2147482740/230-10-45-25
| Name: |
us-gaap_NetCashProvidedByUsedInOperatingActivities |
| Namespace Prefix: |
us-gaap_ |
| Data Type: |
xbrli:monetaryItemType |
| Balance Type: |
na |
| Period Type: |
duration |
|
| X |
- DefinitionThe portion of profit or loss for the period, net of income taxes, which is attributable to the parent. Reference 1: http://www.xbrl.org/2003/role/disclosureRef
-Topic 235
-SubTopic 10
-Name Accounting Standards Codification
-Section S99
-Paragraph 1
-Subparagraph (SX 210.4-08(g)(1)(ii))
-Publisher FASB
-URI https://asc.fasb.org//1943274/2147480678/235-10-S99-1
Reference 2: http://www.xbrl.org/2003/role/disclosureRef
-Topic 323
-SubTopic 10
-Name Accounting Standards Codification
-Section 50
-Paragraph 3
-Subparagraph (c)
-Publisher FASB
-URI https://asc.fasb.org//1943274/2147481687/323-10-50-3
Reference 3: http://www.xbrl.org/2003/role/disclosureRef
-Topic 825
-SubTopic 10
-Name Accounting Standards Codification
-Section 50
-Paragraph 28
-Subparagraph (f)
-Publisher FASB
-URI https://asc.fasb.org//1943274/2147482907/825-10-50-28
Reference 4: http://www.xbrl.org/2003/role/disclosureRef
-Topic 220
-SubTopic 10
-Name Accounting Standards Codification
-Section 50
-Paragraph 6
-Publisher FASB
-URI https://asc.fasb.org//1943274/2147482765/220-10-50-6
Reference 5: http://www.xbrl.org/2003/role/disclosureRef
-Topic 250
-SubTopic 10
-Name Accounting Standards Codification
-Section 50
-Paragraph 3
-Publisher FASB
-URI https://asc.fasb.org//1943274/2147483443/250-10-50-3
Reference 6: http://www.xbrl.org/2003/role/disclosureRef
-Topic 250
-SubTopic 10
-Name Accounting Standards Codification
-Section 50
-Paragraph 1
-Subparagraph (b)(2)
-Publisher FASB
-URI https://asc.fasb.org//1943274/2147483443/250-10-50-1
Reference 7: http://www.xbrl.org/2003/role/disclosureRef
-Topic 815
-SubTopic 40
-Name Accounting Standards Codification
-Section 65
-Paragraph 1
-Subparagraph (f)
-Publisher FASB
-URI https://asc.fasb.org//1943274/2147480175/815-40-65-1
Reference 8: http://www.xbrl.org/2003/role/disclosureRef
-Topic 250
-SubTopic 10
-Name Accounting Standards Codification
-Section 50
-Paragraph 8
-Publisher FASB
-URI https://asc.fasb.org//1943274/2147483443/250-10-50-8
Reference 9: http://www.xbrl.org/2003/role/disclosureRef
-Topic 250
-SubTopic 10
-Name Accounting Standards Codification
-Section 50
-Paragraph 9
-Publisher FASB
-URI https://asc.fasb.org//1943274/2147483443/250-10-50-9
Reference 10: http://www.xbrl.org/2003/role/disclosureRef
-Topic 250
-SubTopic 10
-Name Accounting Standards Codification
-Section 50
-Paragraph 11
-Subparagraph (a)
-Publisher FASB
-URI https://asc.fasb.org//1943274/2147483443/250-10-50-11
Reference 11: http://www.xbrl.org/2003/role/disclosureRef
-Topic 250
-SubTopic 10
-Name Accounting Standards Codification
-Section 50
-Paragraph 11
-Subparagraph (b)
-Publisher FASB
-URI https://asc.fasb.org//1943274/2147483443/250-10-50-11
Reference 12: http://www.xbrl.org/2003/role/disclosureRef
-Topic 250
-SubTopic 10
-Name Accounting Standards Codification
-Section 50
-Paragraph 4
-Publisher FASB
-URI https://asc.fasb.org//1943274/2147483443/250-10-50-4
Reference 13: http://www.xbrl.org/2003/role/exampleRef
-Topic 946
-SubTopic 830
-Name Accounting Standards Codification
-Section 55
-Paragraph 10
-Publisher FASB
-URI https://asc.fasb.org//1943274/2147480167/946-830-55-10
Reference 14: http://www.xbrl.org/2003/role/disclosureRef
-Topic 946
-SubTopic 220
-Name Accounting Standards Codification
-Section 45
-Paragraph 7
-Publisher FASB
-URI https://asc.fasb.org//1943274/2147483581/946-220-45-7
Reference 15: http://www.xbrl.org/2003/role/disclosureRef
-Topic 944
-SubTopic 220
-Name Accounting Standards Codification
-Section S99
-Paragraph 1
-Subparagraph (SX 210.7-04(18))
-Publisher FASB
-URI https://asc.fasb.org//1943274/2147483586/944-220-S99-1
Reference 16: http://www.xbrl.org/2003/role/disclosureRef
-Topic 280
-SubTopic 10
-Name Accounting Standards Codification
-Section 50
-Paragraph 22
-Publisher FASB
-URI https://asc.fasb.org//1943274/2147482810/280-10-50-22
Reference 17: http://www.xbrl.org/2003/role/disclosureRef
-Topic 946
-SubTopic 220
-Name Accounting Standards Codification
-Section S99
-Paragraph 1
-Subparagraph (SX 210.6-07(9))
-Publisher FASB
-URI https://asc.fasb.org//1943274/2147483575/946-220-S99-1
Reference 18: http://www.xbrl.org/2003/role/disclosureRef
-Topic 946
-SubTopic 220
-Name Accounting Standards Codification
-Section S99
-Paragraph 3
-Subparagraph (SX 210.6-09(1)(d))
-Publisher FASB
-URI https://asc.fasb.org//1943274/2147483575/946-220-S99-3
Reference 19: http://www.xbrl.org/2003/role/disclosureRef
-Topic 470
-SubTopic 10
-Name Accounting Standards Codification
-Section S99
-Paragraph 1A
-Subparagraph (SX 210.13-01(a)(4)(i))
-Publisher FASB
-URI https://asc.fasb.org//1943274/2147480097/470-10-S99-1A
Reference 20: http://www.xbrl.org/2009/role/commonPracticeRef
-Topic 470
-SubTopic 10
-Name Accounting Standards Codification
-Section S99
-Paragraph 1A
-Subparagraph (SX 210.13-01(a)(4)(ii))
-Publisher FASB
-URI https://asc.fasb.org//1943274/2147480097/470-10-S99-1A
Reference 21: http://www.xbrl.org/2003/role/disclosureRef
-Topic 470
-SubTopic 10
-Name Accounting Standards Codification
-Section S99
-Paragraph 1A
-Subparagraph (SX 210.13-01(a)(4)(iii)(A))
-Publisher FASB
-URI https://asc.fasb.org//1943274/2147480097/470-10-S99-1A
Reference 22: http://www.xbrl.org/2003/role/disclosureRef
-Topic 470
-SubTopic 10
-Name Accounting Standards Codification
-Section S99
-Paragraph 1A
-Subparagraph (SX 210.13-01(a)(4)(iv))
-Publisher FASB
-URI https://asc.fasb.org//1943274/2147480097/470-10-S99-1A
Reference 23: http://www.xbrl.org/2003/role/disclosureRef
-Topic 470
-SubTopic 10
-Name Accounting Standards Codification
-Section S99
-Paragraph 1A
-Subparagraph (SX 210.13-01(a)(5))
-Publisher FASB
-URI https://asc.fasb.org//1943274/2147480097/470-10-S99-1A
Reference 24: http://www.xbrl.org/2003/role/disclosureRef
-Topic 470
-SubTopic 10
-Name Accounting Standards Codification
-Section S99
-Paragraph 1B
-Subparagraph (SX 210.13-02(a)(4)(i))
-Publisher FASB
-URI https://asc.fasb.org//1943274/2147480097/470-10-S99-1B
Reference 25: http://www.xbrl.org/2003/role/disclosureRef
-Topic 470
-SubTopic 10
-Name Accounting Standards Codification
-Section S99
-Paragraph 1B
-Subparagraph (SX 210.13-02(a)(4)(iii)(A))
-Publisher FASB
-URI https://asc.fasb.org//1943274/2147480097/470-10-S99-1B
Reference 26: http://www.xbrl.org/2003/role/disclosureRef
-Topic 470
-SubTopic 10
-Name Accounting Standards Codification
-Section S99
-Paragraph 1B
-Subparagraph (SX 210.13-02(a)(4)(iii)(B))
-Publisher FASB
-URI https://asc.fasb.org//1943274/2147480097/470-10-S99-1B
Reference 27: http://www.xbrl.org/2003/role/disclosureRef
-Topic 470
-SubTopic 10
-Name Accounting Standards Codification
-Section S99
-Paragraph 1B
-Subparagraph (SX 210.13-02(a)(4)(iv))
-Publisher FASB
-URI https://asc.fasb.org//1943274/2147480097/470-10-S99-1B
Reference 28: http://www.xbrl.org/2003/role/disclosureRef
-Topic 470
-SubTopic 10
-Name Accounting Standards Codification
-Section S99
-Paragraph 1B
-Subparagraph (SX 210.13-02(a)(5))
-Publisher FASB
-URI https://asc.fasb.org//1943274/2147480097/470-10-S99-1B
Reference 29: http://www.xbrl.org/2003/role/disclosureRef
-Topic 280
-SubTopic 10
-Name Accounting Standards Codification
-Section 50
-Paragraph 30
-Subparagraph (b)
-Publisher FASB
-URI https://asc.fasb.org//1943274/2147482810/280-10-50-30
Reference 30: http://www.xbrl.org/2003/role/disclosureRef
-Topic 280
-SubTopic 10
-Name Accounting Standards Codification
-Section 50
-Paragraph 32
-Subparagraph (f)
-Publisher FASB
-URI https://asc.fasb.org//1943274/2147482810/280-10-50-32
Reference 31: http://www.xbrl.org/2003/role/disclosureRef
-Topic 260
-SubTopic 10
-Name Accounting Standards Codification
-Section 45
-Paragraph 60B
-Subparagraph (a)
-Publisher FASB
-URI https://asc.fasb.org//1943274/2147482689/260-10-45-60B
Reference 32: http://www.xbrl.org/2003/role/exampleRef
-Topic 280
-SubTopic 10
-Name Accounting Standards Codification
-Section 50
-Paragraph 31
-Publisher FASB
-URI https://asc.fasb.org//1943274/2147482810/280-10-50-31
Reference 33: http://www.xbrl.org/2003/role/disclosureRef
-Topic 280
-SubTopic 10
-Name Accounting Standards Codification
-Section 50
-Paragraph 32
-Subparagraph (c)
-Publisher FASB
-URI https://asc.fasb.org//1943274/2147482810/280-10-50-32
Reference 34: http://www.xbrl.org/2003/role/disclosureRef
-Topic 205
-SubTopic 20
-Name Accounting Standards Codification
-Section 50
-Paragraph 7
-Publisher FASB
-URI https://asc.fasb.org//1943274/2147483499/205-20-50-7
Reference 35: http://fasb.org/us-gaap/role/ref/legacyRef
-Topic 230
-SubTopic 10
-Name Accounting Standards Codification
-Section 45
-Paragraph 28
-Publisher FASB
-URI https://asc.fasb.org//1943274/2147482740/230-10-45-28
Reference 36: http://www.xbrl.org/2003/role/disclosureRef
-Topic 220
-SubTopic 10
-Name Accounting Standards Codification
-Section 45
-Paragraph 1A
-Subparagraph (a)
-Publisher FASB
-URI https://asc.fasb.org//1943274/2147482790/220-10-45-1A
Reference 37: http://www.xbrl.org/2003/role/disclosureRef
-Topic 220
-SubTopic 10
-Name Accounting Standards Codification
-Section 45
-Paragraph 1B
-Subparagraph (a)
-Publisher FASB
-URI https://asc.fasb.org//1943274/2147482790/220-10-45-1B
Reference 38: http://fasb.org/us-gaap/role/ref/legacyRef
-Topic 220
-SubTopic 10
-Name Accounting Standards Codification
-Section S99
-Paragraph 2
-Subparagraph (SX 210.5-03(20))
-Publisher FASB
-URI https://asc.fasb.org//1943274/2147483621/220-10-S99-2
Reference 39: http://fasb.org/us-gaap/role/ref/legacyRef
-Topic 942
-SubTopic 220
-Name Accounting Standards Codification
-Section S99
-Paragraph 1
-Subparagraph (SX 210.9-04(22))
-Publisher FASB
-URI https://asc.fasb.org//1943274/2147483589/942-220-S99-1
| Name: |
us-gaap_NetIncomeLoss |
| Namespace Prefix: |
us-gaap_ |
| Data Type: |
xbrli:monetaryItemType |
| Balance Type: |
credit |
| Period Type: |
duration |
|
v3.24.0.1
Schedule of Restatement Items on Consolidated Balance Sheets (Unaudited) (Details) - USD ($)
$ in Millions |
Mar. 31, 2023 |
Dec. 31, 2022 |
Mar. 31, 2022 |
Dec. 31, 2021 |
| Assets |
|
|
|
|
| Cash |
$ 27.8
|
$ 25.0
|
|
|
| Accounts receivable, net |
32.9
|
40.4
|
|
|
| Inventory, net |
34.6
|
30.3
|
|
|
| Prepaid expenses and other current assets |
30.7
|
31.2
|
|
|
| Total current assets |
126.0
|
126.9
|
|
|
| Property and equipment, net |
47.4
|
45.1
|
|
|
| Software development costs, net |
19.5
|
18.3
|
|
|
| Other acquired intangible assets subject to amortization, net |
14.3
|
14.6
|
|
|
| Goodwill |
57.0
|
55.5
|
|
|
| Operating lease right of use asset |
15.7
|
16.0
|
|
|
| Cost of obtaining and fulfilling customer contracts, net |
7.7
|
7.0
|
|
|
| Other assets |
4.1
|
3.8
|
|
|
| Total assets |
291.7
|
287.2
|
|
|
| Current liabilities |
|
|
|
|
| Accounts payable |
22.2
|
23.7
|
|
|
| Accrued expenses |
35.6
|
29.0
|
|
|
| Corporate tax and other current taxes payable |
3.4
|
10.1
|
|
|
| Deferred revenue, current |
4.9
|
4.6
|
|
|
| Operating lease liabilities |
4.0
|
3.9
|
|
|
| Other current liabilities |
3.2
|
3.6
|
|
|
| Total current liabilities |
73.3
|
74.9
|
|
|
| Long-term debt |
285.5
|
277.6
|
|
|
| Finance lease liabilities, net of current portion |
1.2
|
1.2
|
|
|
| Deferred revenue, net of current portion |
2.3
|
2.8
|
|
|
| Operating lease liabilities |
11.9
|
12.3
|
|
|
| Other long-term liabilities |
4.0
|
4.0
|
|
|
| Total liabilities |
378.2
|
372.8
|
|
|
| Commitments and contingencies |
|
|
|
|
| Stockholders’ deficit |
|
|
|
|
| Preferred stock; $0.0001 par value; 1,000,000 shares authorized |
|
|
|
|
| Common stock; $0.0001 par value; 49,000,000 shares authorized; 25,909,516 shares and 26,433,562 shares issued and outstanding at December 31, 2022 and December 31, 2021, respectively |
|
|
|
|
| Additional paid in capital |
381.2
|
378.2
|
|
|
| Accumulated other comprehensive income |
48.3
|
50.8
|
$ 47.6
|
$ 43.8
|
| Accumulated deficit |
(516.0)
|
(514.6)
|
|
|
| Total stockholders’ deficit |
(86.5)
|
(85.6)
|
(100.7)
|
$ (108.7)
|
| Total liabilities and stockholders’ deficit |
291.7
|
$ 287.2
|
|
|
| Previously Reported [Member] |
|
|
|
|
| Assets |
|
|
|
|
| Cash |
27.8
|
|
|
|
| Accounts receivable, net |
33.0
|
|
|
|
| Inventory, net |
36.5
|
|
|
|
| Prepaid expenses and other current assets |
31.1
|
|
|
|
| Total current assets |
128.4
|
|
|
|
| Property and equipment, net |
47.7
|
|
|
|
| Software development costs, net |
38.1
|
|
|
|
| Other acquired intangible assets subject to amortization, net |
14.6
|
|
|
|
| Goodwill |
75.8
|
|
|
|
| Operating lease right of use asset |
8.1
|
|
|
|
| Cost of obtaining and fulfilling customer contracts, net |
|
|
|
|
| Other assets |
3.8
|
|
|
|
| Total assets |
316.5
|
|
|
|
| Current liabilities |
|
|
|
|
| Accounts payable |
22.2
|
|
|
|
| Accrued expenses |
34.9
|
|
|
|
| Corporate tax and other current taxes payable |
5.0
|
|
|
|
| Deferred revenue, current |
5.1
|
|
|
|
| Operating lease liabilities |
2.8
|
|
|
|
| Other current liabilities |
3.2
|
|
|
|
| Total current liabilities |
73.2
|
|
|
|
| Long-term debt |
285.5
|
|
|
|
| Finance lease liabilities, net of current portion |
1.2
|
|
|
|
| Deferred revenue, net of current portion |
3.2
|
|
|
|
| Operating lease liabilities |
5.6
|
|
|
|
| Other long-term liabilities |
2.2
|
|
|
|
| Total liabilities |
370.9
|
|
|
|
| Stockholders’ deficit |
|
|
|
|
| Preferred stock; $0.0001 par value; 1,000,000 shares authorized |
|
|
|
|
| Common stock; $0.0001 par value; 49,000,000 shares authorized; 25,909,516 shares and 26,433,562 shares issued and outstanding at December 31, 2022 and December 31, 2021, respectively |
|
|
|
|
| Additional paid in capital |
381.2
|
|
|
|
| Accumulated other comprehensive income |
46.8
|
|
|
|
| Accumulated deficit |
(482.4)
|
|
|
|
| Total stockholders’ deficit |
(54.4)
|
|
(70.5)
|
|
| Total liabilities and stockholders’ deficit |
316.5
|
|
|
|
| Previous Revision [Member] |
|
|
|
|
| Assets |
|
|
|
|
| Cash |
|
|
|
|
| Accounts receivable, net |
|
|
|
|
| Inventory, net |
|
|
|
|
| Prepaid expenses and other current assets |
|
|
|
|
| Total current assets |
|
|
|
|
| Property and equipment, net |
|
|
|
|
| Software development costs, net |
(1.0)
|
|
|
|
| Other acquired intangible assets subject to amortization, net |
|
|
|
|
| Goodwill |
|
|
|
|
| Operating lease right of use asset |
|
|
|
|
| Cost of obtaining and fulfilling customer contracts, net |
|
|
|
|
| Other assets |
|
|
|
|
| Total assets |
(1.0)
|
|
|
|
| Current liabilities |
|
|
|
|
| Accounts payable |
|
|
|
|
| Accrued expenses |
|
|
|
|
| Corporate tax and other current taxes payable |
|
|
|
|
| Deferred revenue, current |
|
|
|
|
| Operating lease liabilities |
|
|
|
|
| Other current liabilities |
|
|
|
|
| Total current liabilities |
|
|
|
|
| Long-term debt |
|
|
|
|
| Finance lease liabilities, net of current portion |
|
|
|
|
| Deferred revenue, net of current portion |
|
|
|
|
| Operating lease liabilities |
|
|
|
|
| Other long-term liabilities |
|
|
|
|
| Total liabilities |
|
|
|
|
| Stockholders’ deficit |
|
|
|
|
| Preferred stock; $0.0001 par value; 1,000,000 shares authorized |
|
|
|
|
| Common stock; $0.0001 par value; 49,000,000 shares authorized; 25,909,516 shares and 26,433,562 shares issued and outstanding at December 31, 2022 and December 31, 2021, respectively |
|
|
|
|
| Additional paid in capital |
|
|
|
|
| Accumulated other comprehensive income |
|
|
|
|
| Accumulated deficit |
(1.0)
|
|
|
|
| Total stockholders’ deficit |
(1.0)
|
|
|
|
| Total liabilities and stockholders’ deficit |
(1.0)
|
|
|
|
| Revision of Prior Period, Reclassification, Adjustment [Member] |
|
|
|
|
| Assets |
|
|
|
|
| Cash |
|
|
|
|
| Accounts receivable, net |
(0.1)
|
|
|
|
| Inventory, net |
(1.9)
|
|
|
|
| Prepaid expenses and other current assets |
(0.4)
|
|
|
|
| Total current assets |
(2.4)
|
|
|
|
| Property and equipment, net |
(0.3)
|
|
|
|
| Software development costs, net |
(17.6)
|
|
|
|
| Other acquired intangible assets subject to amortization, net |
(0.3)
|
|
|
|
| Goodwill |
(18.8)
|
|
|
|
| Operating lease right of use asset |
7.6
|
|
|
|
| Cost of obtaining and fulfilling customer contracts, net |
7.7
|
|
|
|
| Other assets |
0.3
|
|
|
|
| Total assets |
(23.8)
|
|
|
|
| Current liabilities |
|
|
|
|
| Accounts payable |
|
|
|
|
| Accrued expenses |
0.7
|
|
|
|
| Corporate tax and other current taxes payable |
(1.6)
|
|
|
|
| Deferred revenue, current |
(0.2)
|
|
|
|
| Operating lease liabilities |
1.2
|
|
|
|
| Other current liabilities |
|
|
|
|
| Total current liabilities |
0.1
|
|
|
|
| Long-term debt |
|
|
|
|
| Finance lease liabilities, net of current portion |
|
|
|
|
| Deferred revenue, net of current portion |
(0.9)
|
|
|
|
| Operating lease liabilities |
6.3
|
|
|
|
| Other long-term liabilities |
1.8
|
|
|
|
| Total liabilities |
7.3
|
|
|
|
| Stockholders’ deficit |
|
|
|
|
| Preferred stock; $0.0001 par value; 1,000,000 shares authorized |
|
|
|
|
| Common stock; $0.0001 par value; 49,000,000 shares authorized; 25,909,516 shares and 26,433,562 shares issued and outstanding at December 31, 2022 and December 31, 2021, respectively |
|
|
|
|
| Additional paid in capital |
|
|
|
|
| Accumulated other comprehensive income |
1.5
|
|
|
|
| Accumulated deficit |
(32.6)
|
|
|
|
| Total stockholders’ deficit |
(31.1)
|
|
$ (30.2)
|
|
| Total liabilities and stockholders’ deficit |
$ (23.8)
|
|
|
|
| X |
- DefinitionCarrying value as of the balance sheet date of liabilities incurred (and for which invoices have typically been received) and payable to vendors for goods and services received that are used in an entity's business. Used to reflect the current portion of the liabilities (due within one year or within the normal operating cycle if longer). Reference 1: http://www.xbrl.org/2003/role/exampleRef
-Topic 852
-SubTopic 10
-Name Accounting Standards Codification
-Section 55
-Paragraph 10
-Publisher FASB
-URI https://asc.fasb.org//1943274/2147481372/852-10-55-10
Reference 2: http://fasb.org/us-gaap/role/ref/legacyRef
-Name Accounting Standards Codification
-Topic 210
-SubTopic 10
-Section S99
-Paragraph 1
-Subparagraph (SX 210.5-02.19(a))
-Publisher FASB
-URI https://asc.fasb.org//1943274/2147480566/210-10-S99-1
| Name: |
us-gaap_AccountsPayableCurrent |
| Namespace Prefix: |
us-gaap_ |
| Data Type: |
xbrli:monetaryItemType |
| Balance Type: |
credit |
| Period Type: |
instant |
|
| X |
- DefinitionAmount, after allowance for credit loss, of right to consideration from customer for product sold and service rendered in normal course of business. Reference 1: http://www.xbrl.org/2003/role/exampleRef
-Topic 946
-SubTopic 310
-Name Accounting Standards Codification
-Section 45
-Paragraph 1
-Subparagraph (d)
-Publisher FASB
-URI https://asc.fasb.org//1943274/2147480833/946-310-45-1
Reference 2: http://www.xbrl.org/2009/role/commonPracticeRef
-Topic 944
-SubTopic 210
-Name Accounting Standards Codification
-Section S99
-Paragraph 1
-Subparagraph (SX 210.7-03(a)(5))
-Publisher FASB
-URI https://asc.fasb.org//1943274/2147479440/944-210-S99-1
Reference 3: http://www.xbrl.org/2003/role/disclosureRef
-Topic 946
-SubTopic 210
-Name Accounting Standards Codification
-Section S99
-Paragraph 1
-Subparagraph (SX 210.6-04(5)(b))
-Publisher FASB
-URI https://asc.fasb.org//1943274/2147479617/946-210-S99-1
Reference 4: http://www.xbrl.org/2003/role/disclosureRef
-Topic 954
-SubTopic 310
-Name Accounting Standards Codification
-Section 45
-Paragraph 1
-Publisher FASB
-URI https://asc.fasb.org//1943274/2147481058/954-310-45-1
| Name: |
us-gaap_AccountsReceivableNet |
| Namespace Prefix: |
us-gaap_ |
| Data Type: |
xbrli:monetaryItemType |
| Balance Type: |
debit |
| Period Type: |
instant |
|
| X |
- DefinitionCarrying value as of the balance sheet date of obligations incurred and payable, pertaining to costs that are statutory in nature, are incurred on contractual obligations, or accumulate over time and for which invoices have not yet been received or will not be rendered. Examples include taxes, interest, rent and utilities. Used to reflect the current portion of the liabilities (due within one year or within the normal operating cycle if longer). Reference 1: http://fasb.org/us-gaap/role/ref/legacyRef
-Name Accounting Standards Codification
-Topic 210
-SubTopic 10
-Section S99
-Paragraph 1
-Subparagraph (SX 210.5-02.20)
-Publisher FASB
-URI https://asc.fasb.org//1943274/2147480566/210-10-S99-1
| Name: |
us-gaap_AccruedLiabilitiesCurrent |
| Namespace Prefix: |
us-gaap_ |
| Data Type: |
xbrli:monetaryItemType |
| Balance Type: |
credit |
| Period Type: |
instant |
|
| X |
- DefinitionAmount, after tax, of accumulated increase (decrease) in equity from transaction and other event and circumstance from nonowner source. Reference 1: http://fasb.org/us-gaap/role/ref/legacyRef
-Name Accounting Standards Codification
-Topic 220
-SubTopic 10
-Section 45
-Paragraph 14A
-Publisher FASB
-URI https://asc.fasb.org//1943274/2147482790/220-10-45-14A
Reference 2: http://fasb.org/us-gaap/role/ref/legacyRef
-Topic 220
-SubTopic 10
-Name Accounting Standards Codification
-Section 45
-Paragraph 11
-Publisher FASB
-URI https://asc.fasb.org//1943274/2147482790/220-10-45-11
Reference 3: http://www.xbrl.org/2003/role/disclosureRef
-Topic 944
-SubTopic 40
-Name Accounting Standards Codification
-Section 65
-Paragraph 2
-Subparagraph (g)(2)(ii)
-Publisher FASB
-URI https://asc.fasb.org//1943274/2147480016/944-40-65-2
Reference 4: http://www.xbrl.org/2003/role/disclosureRef
-Topic 944
-SubTopic 40
-Name Accounting Standards Codification
-Section 65
-Paragraph 2
-Subparagraph (h)(2)
-Publisher FASB
-URI https://asc.fasb.org//1943274/2147480016/944-40-65-2
Reference 5: http://www.xbrl.org/2003/role/disclosureRef
-Topic 210
-SubTopic 10
-Name Accounting Standards Codification
-Section S99
-Paragraph 1
-Subparagraph (SX 210.5-02(30)(a)(4))
-Publisher FASB
-URI https://asc.fasb.org//1943274/2147480566/210-10-S99-1
Reference 6: http://www.xbrl.org/2003/role/disclosureRef
-Topic 944
-SubTopic 210
-Name Accounting Standards Codification
-Section S99
-Paragraph 1
-Subparagraph (SX 210.7-03(a)(23)(a)(3))
-Publisher FASB
-URI https://asc.fasb.org//1943274/2147479440/944-210-S99-1
Reference 7: http://fasb.org/us-gaap/role/ref/legacyRef
-Name Accounting Standards Codification
-Topic 220
-SubTopic 10
-Section 45
-Paragraph 14
-Publisher FASB
-URI https://asc.fasb.org//1943274/2147482790/220-10-45-14
| Name: |
us-gaap_AccumulatedOtherComprehensiveIncomeLossNetOfTax |
| Namespace Prefix: |
us-gaap_ |
| Data Type: |
xbrli:monetaryItemType |
| Balance Type: |
credit |
| Period Type: |
instant |
|
| X |
- DefinitionAmount of excess of issue price over par or stated value of stock and from other transaction involving stock or stockholder. Includes, but is not limited to, additional paid-in capital (APIC) for common and preferred stock. Reference 1: http://www.xbrl.org/2003/role/exampleRef
-Topic 852
-SubTopic 10
-Name Accounting Standards Codification
-Section 55
-Paragraph 10
-Publisher FASB
-URI https://asc.fasb.org//1943274/2147481372/852-10-55-10
Reference 2: http://www.xbrl.org/2009/role/commonPracticeRef
-Topic 946
-SubTopic 210
-Name Accounting Standards Codification
-Section S99
-Paragraph 1
-Subparagraph (SX 210.6-04(18))
-Publisher FASB
-URI https://asc.fasb.org//1943274/2147479617/946-210-S99-1
Reference 3: http://fasb.org/us-gaap/role/ref/legacyRef
-Topic 210
-SubTopic 10
-Name Accounting Standards Codification
-Section S99
-Paragraph 1
-Subparagraph (SX 210.5-02(30)(a)(1))
-Publisher FASB
-URI https://asc.fasb.org//1943274/2147480566/210-10-S99-1
| Name: |
us-gaap_AdditionalPaidInCapital |
| Namespace Prefix: |
us-gaap_ |
| Data Type: |
xbrli:monetaryItemType |
| Balance Type: |
credit |
| Period Type: |
instant |
|
| X |
- DefinitionSum of the carrying amounts as of the balance sheet date of all assets that are recognized. Assets are probable future economic benefits obtained or controlled by an entity as a result of past transactions or events. Reference 1: http://www.xbrl.org/2003/role/disclosureRef
-Topic 810
-SubTopic 10
-Name Accounting Standards Codification
-Section 50
-Paragraph 3
-Subparagraph (bb)
-Publisher FASB
-URI https://asc.fasb.org//1943274/2147481203/810-10-50-3
Reference 2: http://www.xbrl.org/2003/role/disclosureRef
-Topic 810
-SubTopic 10
-Name Accounting Standards Codification
-Section 45
-Paragraph 25
-Subparagraph (a)
-Publisher FASB
-URI https://asc.fasb.org//1943274/2147481231/810-10-45-25
Reference 3: http://www.xbrl.org/2003/role/disclosureRef
-Topic 235
-SubTopic 10
-Name Accounting Standards Codification
-Section S99
-Paragraph 1
-Subparagraph (SX 210.4-08(g)(1)(ii))
-Publisher FASB
-URI https://asc.fasb.org//1943274/2147480678/235-10-S99-1
Reference 4: http://www.xbrl.org/2003/role/disclosureRef
-Topic 323
-SubTopic 10
-Name Accounting Standards Codification
-Section 50
-Paragraph 3
-Subparagraph (c)
-Publisher FASB
-URI https://asc.fasb.org//1943274/2147481687/323-10-50-3
Reference 5: http://www.xbrl.org/2003/role/disclosureRef
-Topic 825
-SubTopic 10
-Name Accounting Standards Codification
-Section 50
-Paragraph 28
-Subparagraph (f)
-Publisher FASB
-URI https://asc.fasb.org//1943274/2147482907/825-10-50-28
Reference 6: http://www.xbrl.org/2003/role/exampleRef
-Topic 852
-SubTopic 10
-Name Accounting Standards Codification
-Section 55
-Paragraph 10
-Publisher FASB
-URI https://asc.fasb.org//1943274/2147481372/852-10-55-10
Reference 7: http://www.xbrl.org/2003/role/exampleRef
-Topic 946
-SubTopic 830
-Name Accounting Standards Codification
-Section 55
-Paragraph 12
-Publisher FASB
-URI https://asc.fasb.org//1943274/2147480167/946-830-55-12
Reference 8: http://www.xbrl.org/2003/role/disclosureRef
-Topic 944
-SubTopic 210
-Name Accounting Standards Codification
-Section S99
-Paragraph 1
-Subparagraph (SX 210.7-03(a)(12))
-Publisher FASB
-URI https://asc.fasb.org//1943274/2147479440/944-210-S99-1
Reference 9: http://www.xbrl.org/2003/role/disclosureRef
-Topic 280
-SubTopic 10
-Name Accounting Standards Codification
-Section 50
-Paragraph 22
-Publisher FASB
-URI https://asc.fasb.org//1943274/2147482810/280-10-50-22
Reference 10: http://www.xbrl.org/2003/role/disclosureRef
-Topic 946
-SubTopic 210
-Name Accounting Standards Codification
-Section S99
-Paragraph 1
-Subparagraph (SX 210.6-04(8))
-Publisher FASB
-URI https://asc.fasb.org//1943274/2147479617/946-210-S99-1
Reference 11: http://www.xbrl.org/2003/role/disclosureRef
-Topic 210
-SubTopic 10
-Name Accounting Standards Codification
-Section S99
-Paragraph 1
-Subparagraph (SX 210.5-02(18))
-Publisher FASB
-URI https://asc.fasb.org//1943274/2147480566/210-10-S99-1
Reference 12: http://www.xbrl.org/2003/role/disclosureRef
-Topic 470
-SubTopic 10
-Name Accounting Standards Codification
-Section S99
-Paragraph 1A
-Subparagraph (SX 210.13-01(a)(4)(i))
-Publisher FASB
-URI https://asc.fasb.org//1943274/2147480097/470-10-S99-1A
Reference 13: http://www.xbrl.org/2009/role/commonPracticeRef
-Topic 470
-SubTopic 10
-Name Accounting Standards Codification
-Section S99
-Paragraph 1A
-Subparagraph (SX 210.13-01(a)(4)(ii))
-Publisher FASB
-URI https://asc.fasb.org//1943274/2147480097/470-10-S99-1A
Reference 14: http://www.xbrl.org/2009/role/commonPracticeRef
-Topic 470
-SubTopic 10
-Name Accounting Standards Codification
-Section S99
-Paragraph 1A
-Subparagraph (SX 210.13-01(a)(4)(iii))
-Publisher FASB
-URI https://asc.fasb.org//1943274/2147480097/470-10-S99-1A
Reference 15: http://www.xbrl.org/2003/role/disclosureRef
-Topic 470
-SubTopic 10
-Name Accounting Standards Codification
-Section S99
-Paragraph 1A
-Subparagraph (SX 210.13-01(a)(4)(iii)(A))
-Publisher FASB
-URI https://asc.fasb.org//1943274/2147480097/470-10-S99-1A
Reference 16: http://www.xbrl.org/2003/role/disclosureRef
-Topic 470
-SubTopic 10
-Name Accounting Standards Codification
-Section S99
-Paragraph 1A
-Subparagraph (SX 210.13-01(a)(4)(iv))
-Publisher FASB
-URI https://asc.fasb.org//1943274/2147480097/470-10-S99-1A
Reference 17: http://www.xbrl.org/2003/role/disclosureRef
-Topic 470
-SubTopic 10
-Name Accounting Standards Codification
-Section S99
-Paragraph 1A
-Subparagraph (SX 210.13-01(a)(5))
-Publisher FASB
-URI https://asc.fasb.org//1943274/2147480097/470-10-S99-1A
Reference 18: http://www.xbrl.org/2003/role/disclosureRef
-Topic 470
-SubTopic 10
-Name Accounting Standards Codification
-Section S99
-Paragraph 1B
-Subparagraph (SX 210.13-02(a)(4)(i))
-Publisher FASB
-URI https://asc.fasb.org//1943274/2147480097/470-10-S99-1B
Reference 19: http://www.xbrl.org/2003/role/disclosureRef
-Topic 470
-SubTopic 10
-Name Accounting Standards Codification
-Section S99
-Paragraph 1B
-Subparagraph (SX 210.13-02(a)(4)(iii)(A))
-Publisher FASB
-URI https://asc.fasb.org//1943274/2147480097/470-10-S99-1B
Reference 20: http://www.xbrl.org/2003/role/disclosureRef
-Topic 470
-SubTopic 10
-Name Accounting Standards Codification
-Section S99
-Paragraph 1B
-Subparagraph (SX 210.13-02(a)(4)(iii)(B))
-Publisher FASB
-URI https://asc.fasb.org//1943274/2147480097/470-10-S99-1B
Reference 21: http://www.xbrl.org/2003/role/disclosureRef
-Topic 470
-SubTopic 10
-Name Accounting Standards Codification
-Section S99
-Paragraph 1B
-Subparagraph (SX 210.13-02(a)(4)(iv))
-Publisher FASB
-URI https://asc.fasb.org//1943274/2147480097/470-10-S99-1B
Reference 22: http://www.xbrl.org/2003/role/disclosureRef
-Topic 470
-SubTopic 10
-Name Accounting Standards Codification
-Section S99
-Paragraph 1B
-Subparagraph (SX 210.13-02(a)(5))
-Publisher FASB
-URI https://asc.fasb.org//1943274/2147480097/470-10-S99-1B
Reference 23: http://www.xbrl.org/2009/role/commonPracticeRef
-Topic 852
-SubTopic 10
-Name Accounting Standards Codification
-Section 50
-Paragraph 7
-Subparagraph (a)
-Publisher FASB
-URI https://asc.fasb.org//1943274/2147481404/852-10-50-7
Reference 24: http://www.xbrl.org/2003/role/disclosureRef
-Topic 280
-SubTopic 10
-Name Accounting Standards Codification
-Section 50
-Paragraph 30
-Subparagraph (c)
-Publisher FASB
-URI https://asc.fasb.org//1943274/2147482810/280-10-50-30
Reference 25: http://www.xbrl.org/2003/role/disclosureRef
-Topic 280
-SubTopic 10
-Name Accounting Standards Codification
-Section 50
-Paragraph 32
-Subparagraph (d)
-Publisher FASB
-URI https://asc.fasb.org//1943274/2147482810/280-10-50-32
Reference 26: http://fasb.org/us-gaap/role/ref/legacyRef
-Topic 942
-SubTopic 210
-Name Accounting Standards Codification
-Section S99
-Paragraph 1
-Subparagraph (SX 210.9-03(11))
-Publisher FASB
-URI https://asc.fasb.org//1943274/2147479853/942-210-S99-1
| Name: |
us-gaap_Assets |
| Namespace Prefix: |
us-gaap_ |
| Data Type: |
xbrli:monetaryItemType |
| Balance Type: |
debit |
| Period Type: |
instant |
|
| X |
- References
+ Details
| Name: |
us-gaap_AssetsAbstract |
| Namespace Prefix: |
us-gaap_ |
| Data Type: |
xbrli:stringItemType |
| Balance Type: |
na |
| Period Type: |
duration |
|
| X |
- DefinitionSum of the carrying amounts as of the balance sheet date of all assets that are expected to be realized in cash, sold, or consumed within one year (or the normal operating cycle, if longer). Assets are probable future economic benefits obtained or controlled by an entity as a result of past transactions or events. Reference 1: http://www.xbrl.org/2003/role/disclosureRef
-Topic 810
-SubTopic 10
-Name Accounting Standards Codification
-Section 50
-Paragraph 3
-Subparagraph (bb)
-Publisher FASB
-URI https://asc.fasb.org//1943274/2147481203/810-10-50-3
Reference 2: http://www.xbrl.org/2003/role/disclosureRef
-Topic 810
-SubTopic 10
-Name Accounting Standards Codification
-Section 45
-Paragraph 25
-Subparagraph (a)
-Publisher FASB
-URI https://asc.fasb.org//1943274/2147481231/810-10-45-25
Reference 3: http://www.xbrl.org/2003/role/disclosureRef
-Topic 235
-SubTopic 10
-Name Accounting Standards Codification
-Section S99
-Paragraph 1
-Subparagraph (SX 210.4-08(g)(1)(ii))
-Publisher FASB
-URI https://asc.fasb.org//1943274/2147480678/235-10-S99-1
Reference 4: http://www.xbrl.org/2003/role/disclosureRef
-Topic 323
-SubTopic 10
-Name Accounting Standards Codification
-Section 50
-Paragraph 3
-Subparagraph (c)
-Publisher FASB
-URI https://asc.fasb.org//1943274/2147481687/323-10-50-3
Reference 5: http://www.xbrl.org/2003/role/disclosureRef
-Topic 825
-SubTopic 10
-Name Accounting Standards Codification
-Section 50
-Paragraph 28
-Subparagraph (f)
-Publisher FASB
-URI https://asc.fasb.org//1943274/2147482907/825-10-50-28
Reference 6: http://www.xbrl.org/2003/role/exampleRef
-Topic 852
-SubTopic 10
-Name Accounting Standards Codification
-Section 55
-Paragraph 10
-Publisher FASB
-URI https://asc.fasb.org//1943274/2147481372/852-10-55-10
Reference 7: http://www.xbrl.org/2003/role/disclosureRef
-Topic 210
-SubTopic 10
-Name Accounting Standards Codification
-Section 45
-Paragraph 1
-Publisher FASB
-URI https://asc.fasb.org//1943274/2147483467/210-10-45-1
Reference 8: http://www.xbrl.org/2003/role/disclosureRef
-Topic 210
-SubTopic 10
-Name Accounting Standards Codification
-Section S99
-Paragraph 1
-Subparagraph (SX 210.5-02(9))
-Publisher FASB
-URI https://asc.fasb.org//1943274/2147480566/210-10-S99-1
Reference 9: http://www.xbrl.org/2003/role/disclosureRef
-Topic 470
-SubTopic 10
-Name Accounting Standards Codification
-Section S99
-Paragraph 1A
-Subparagraph (SX 210.13-01(a)(4)(i))
-Publisher FASB
-URI https://asc.fasb.org//1943274/2147480097/470-10-S99-1A
Reference 10: http://www.xbrl.org/2009/role/commonPracticeRef
-Topic 470
-SubTopic 10
-Name Accounting Standards Codification
-Section S99
-Paragraph 1A
-Subparagraph (SX 210.13-01(a)(4)(ii))
-Publisher FASB
-URI https://asc.fasb.org//1943274/2147480097/470-10-S99-1A
Reference 11: http://www.xbrl.org/2009/role/commonPracticeRef
-Topic 470
-SubTopic 10
-Name Accounting Standards Codification
-Section S99
-Paragraph 1A
-Subparagraph (SX 210.13-01(a)(4)(iii))
-Publisher FASB
-URI https://asc.fasb.org//1943274/2147480097/470-10-S99-1A
Reference 12: http://www.xbrl.org/2003/role/disclosureRef
-Topic 470
-SubTopic 10
-Name Accounting Standards Codification
-Section S99
-Paragraph 1A
-Subparagraph (SX 210.13-01(a)(4)(iii)(A))
-Publisher FASB
-URI https://asc.fasb.org//1943274/2147480097/470-10-S99-1A
Reference 13: http://www.xbrl.org/2003/role/disclosureRef
-Topic 470
-SubTopic 10
-Name Accounting Standards Codification
-Section S99
-Paragraph 1A
-Subparagraph (SX 210.13-01(a)(4)(iv))
-Publisher FASB
-URI https://asc.fasb.org//1943274/2147480097/470-10-S99-1A
Reference 14: http://www.xbrl.org/2003/role/disclosureRef
-Topic 470
-SubTopic 10
-Name Accounting Standards Codification
-Section S99
-Paragraph 1A
-Subparagraph (SX 210.13-01(a)(5))
-Publisher FASB
-URI https://asc.fasb.org//1943274/2147480097/470-10-S99-1A
Reference 15: http://www.xbrl.org/2003/role/disclosureRef
-Topic 470
-SubTopic 10
-Name Accounting Standards Codification
-Section S99
-Paragraph 1B
-Subparagraph (SX 210.13-02(a)(4)(i))
-Publisher FASB
-URI https://asc.fasb.org//1943274/2147480097/470-10-S99-1B
Reference 16: http://www.xbrl.org/2003/role/disclosureRef
-Topic 470
-SubTopic 10
-Name Accounting Standards Codification
-Section S99
-Paragraph 1B
-Subparagraph (SX 210.13-02(a)(4)(iii)(A))
-Publisher FASB
-URI https://asc.fasb.org//1943274/2147480097/470-10-S99-1B
Reference 17: http://www.xbrl.org/2003/role/disclosureRef
-Topic 470
-SubTopic 10
-Name Accounting Standards Codification
-Section S99
-Paragraph 1B
-Subparagraph (SX 210.13-02(a)(4)(iii)(B))
-Publisher FASB
-URI https://asc.fasb.org//1943274/2147480097/470-10-S99-1B
Reference 18: http://www.xbrl.org/2003/role/disclosureRef
-Topic 470
-SubTopic 10
-Name Accounting Standards Codification
-Section S99
-Paragraph 1B
-Subparagraph (SX 210.13-02(a)(4)(iv))
-Publisher FASB
-URI https://asc.fasb.org//1943274/2147480097/470-10-S99-1B
Reference 19: http://www.xbrl.org/2003/role/disclosureRef
-Topic 470
-SubTopic 10
-Name Accounting Standards Codification
-Section S99
-Paragraph 1B
-Subparagraph (SX 210.13-02(a)(5))
-Publisher FASB
-URI https://asc.fasb.org//1943274/2147480097/470-10-S99-1B
Reference 20: http://www.xbrl.org/2009/role/commonPracticeRef
-Topic 852
-SubTopic 10
-Name Accounting Standards Codification
-Section 50
-Paragraph 7
-Subparagraph (a)
-Publisher FASB
-URI https://asc.fasb.org//1943274/2147481404/852-10-50-7
| Name: |
us-gaap_AssetsCurrent |
| Namespace Prefix: |
us-gaap_ |
| Data Type: |
xbrli:monetaryItemType |
| Balance Type: |
debit |
| Period Type: |
instant |
|
| X |
- DefinitionThe carrying amount of capitalized computer software costs net of accumulated amortization as of the balance sheet date. Reference 1: http://www.xbrl.org/2003/role/disclosureRef
-Topic 985
-SubTopic 20
-Name Accounting Standards Codification
-Section 50
-Paragraph 1
-Subparagraph (a)
-Publisher FASB
-URI https://asc.fasb.org//1943274/2147481283/985-20-50-1
| Name: |
us-gaap_CapitalizedComputerSoftwareNet |
| Namespace Prefix: |
us-gaap_ |
| Data Type: |
xbrli:monetaryItemType |
| Balance Type: |
debit |
| Period Type: |
instant |
|
| X |
- DefinitionAmount, after accumulated amortization and accumulated impairment loss, of asset recognized from cost incurred to obtain or fulfill contract with customer. Reference 1: http://www.xbrl.org/2003/role/disclosureRef
-Topic 340
-SubTopic 40
-Name Accounting Standards Codification
-Section 50
-Paragraph 3
-Subparagraph (a)
-Publisher FASB
-URI https://asc.fasb.org//1943274/2147479483/340-40-50-3
| Name: |
us-gaap_CapitalizedContractCostNet |
| Namespace Prefix: |
us-gaap_ |
| Data Type: |
xbrli:monetaryItemType |
| Balance Type: |
debit |
| Period Type: |
instant |
|
| X |
- DefinitionAmount of currency on hand as well as demand deposits with banks or financial institutions. Includes other kinds of accounts that have the general characteristics of demand deposits. Excludes cash and cash equivalents within disposal group and discontinued operation. Reference 1: http://www.xbrl.org/2003/role/exampleRef
-Topic 852
-SubTopic 10
-Name Accounting Standards Codification
-Section 55
-Paragraph 10
-Publisher FASB
-URI https://asc.fasb.org//1943274/2147481372/852-10-55-10
Reference 2: http://www.xbrl.org/2003/role/exampleRef
-Topic 946
-SubTopic 830
-Name Accounting Standards Codification
-Section 55
-Paragraph 12
-Publisher FASB
-URI https://asc.fasb.org//1943274/2147480167/946-830-55-12
Reference 3: http://www.xbrl.org/2003/role/disclosureRef
-Topic 944
-SubTopic 210
-Name Accounting Standards Codification
-Section S99
-Paragraph 1
-Subparagraph (SX 210.7-03(a)(2))
-Publisher FASB
-URI https://asc.fasb.org//1943274/2147479440/944-210-S99-1
Reference 4: http://www.xbrl.org/2003/role/disclosureRef
-Topic 946
-SubTopic 210
-Name Accounting Standards Codification
-Section S99
-Paragraph 1
-Subparagraph (SX 210.6-04(4))
-Publisher FASB
-URI https://asc.fasb.org//1943274/2147479617/946-210-S99-1
Reference 5: http://www.xbrl.org/2003/role/disclosureRef
-Topic 946
-SubTopic 210
-Name Accounting Standards Codification
-Section 45
-Paragraph 21
-Publisher FASB
-URI https://asc.fasb.org//1943274/2147480555/946-210-45-21
Reference 6: http://www.xbrl.org/2009/role/commonPracticeRef
-Topic 210
-SubTopic 10
-Name Accounting Standards Codification
-Section S99
-Paragraph 1
-Subparagraph (SX 210.5-02(1))
-Publisher FASB
-URI https://asc.fasb.org//1943274/2147480566/210-10-S99-1
Reference 7: http://www.xbrl.org/2003/role/disclosureRef
-Name Accounting Standards Codification
-Section 45
-Paragraph 20
-SubTopic 210
-Topic 946
-Publisher FASB
-URI https://asc.fasb.org//1943274/2147480555/946-210-45-20
| Name: |
us-gaap_Cash |
| Namespace Prefix: |
us-gaap_ |
| Data Type: |
xbrli:monetaryItemType |
| Balance Type: |
debit |
| Period Type: |
instant |
|
| X |
- DefinitionRepresents the caption on the face of the balance sheet to indicate that the entity has entered into (1) purchase or supply arrangements that will require expending a portion of its resources to meet the terms thereof, and (2) is exposed to potential losses or, less frequently, gains, arising from (a) possible claims against a company's resources due to future performance under contract terms, and (b) possible losses or likely gains from uncertainties that will ultimately be resolved when one or more future events that are deemed likely to occur do occur or fail to occur. Reference 1: http://www.xbrl.org/2003/role/disclosureRef
-Topic 944
-SubTopic 210
-Name Accounting Standards Codification
-Section S99
-Paragraph 1
-Subparagraph (SX 210.7-03(a)(19))
-Publisher FASB
-URI https://asc.fasb.org//1943274/2147479440/944-210-S99-1
Reference 2: http://www.xbrl.org/2003/role/disclosureRef
-Topic 946
-SubTopic 210
-Name Accounting Standards Codification
-Section S99
-Paragraph 1
-Subparagraph (SX 210.6-04(15))
-Publisher FASB
-URI https://asc.fasb.org//1943274/2147479617/946-210-S99-1
Reference 3: http://fasb.org/us-gaap/role/ref/legacyRef
-Name Accounting Standards Codification
-Topic 942
-SubTopic 210
-Section S99
-Paragraph 1
-Subparagraph (SX 210.9-03.17)
-Publisher FASB
-URI https://asc.fasb.org//1943274/2147479853/942-210-S99-1
Reference 4: http://fasb.org/us-gaap/role/ref/legacyRef
-Name Accounting Standards Codification
-Topic 210
-SubTopic 10
-Section S99
-Paragraph 1
-Subparagraph (SX 210.5-02.25)
-Publisher FASB
-URI https://asc.fasb.org//1943274/2147480566/210-10-S99-1
| Name: |
us-gaap_CommitmentsAndContingencies |
| Namespace Prefix: |
us-gaap_ |
| Data Type: |
xbrli:monetaryItemType |
| Balance Type: |
credit |
| Period Type: |
instant |
|
| X |
- DefinitionAggregate par or stated value of issued nonredeemable common stock (or common stock redeemable solely at the option of the issuer). This item includes treasury stock repurchased by the entity. Note: elements for number of nonredeemable common shares, par value and other disclosure concepts are in another section within stockholders' equity. Reference 1: http://www.xbrl.org/2003/role/exampleRef
-Topic 852
-SubTopic 10
-Name Accounting Standards Codification
-Section 55
-Paragraph 10
-Publisher FASB
-URI https://asc.fasb.org//1943274/2147481372/852-10-55-10
Reference 2: http://www.xbrl.org/2003/role/disclosureRef
-Topic 944
-SubTopic 210
-Name Accounting Standards Codification
-Section S99
-Paragraph 1
-Subparagraph (SX 210.7-03(a)(22))
-Publisher FASB
-URI https://asc.fasb.org//1943274/2147479440/944-210-S99-1
Reference 3: http://fasb.org/us-gaap/role/ref/legacyRef
-Topic 210
-SubTopic 10
-Name Accounting Standards Codification
-Section S99
-Paragraph 1
-Subparagraph (SX 210.5-02(29))
-Publisher FASB
-URI https://asc.fasb.org//1943274/2147480566/210-10-S99-1
| Name: |
us-gaap_CommonStockValue |
| Namespace Prefix: |
us-gaap_ |
| Data Type: |
xbrli:monetaryItemType |
| Balance Type: |
credit |
| Period Type: |
instant |
|
| X |
- DefinitionAmount of obligation to transfer good or service to customer for which consideration has been received or is receivable, classified as current. Reference 1: http://www.xbrl.org/2003/role/disclosureRef
-Topic 606
-SubTopic 10
-Name Accounting Standards Codification
-Section 45
-Paragraph 1
-Publisher FASB
-URI https://asc.fasb.org//1943274/2147479837/606-10-45-1
Reference 2: http://www.xbrl.org/2003/role/disclosureRef
-Topic 606
-SubTopic 10
-Name Accounting Standards Codification
-Section 50
-Paragraph 8
-Subparagraph (a)
-Publisher FASB
-URI https://asc.fasb.org//1943274/2147479806/606-10-50-8
Reference 3: http://www.xbrl.org/2003/role/disclosureRef
-Topic 606
-SubTopic 10
-Name Accounting Standards Codification
-Section 45
-Paragraph 2
-Publisher FASB
-URI https://asc.fasb.org//1943274/2147479837/606-10-45-2
| Name: |
us-gaap_ContractWithCustomerLiabilityCurrent |
| Namespace Prefix: |
us-gaap_ |
| Data Type: |
xbrli:monetaryItemType |
| Balance Type: |
credit |
| Period Type: |
instant |
|
| X |
- DefinitionAmount of obligation to transfer good or service to customer for which consideration has been received or is receivable, classified as noncurrent. Reference 1: http://www.xbrl.org/2003/role/disclosureRef
-Topic 606
-SubTopic 10
-Name Accounting Standards Codification
-Section 45
-Paragraph 1
-Publisher FASB
-URI https://asc.fasb.org//1943274/2147479837/606-10-45-1
Reference 2: http://www.xbrl.org/2003/role/disclosureRef
-Topic 606
-SubTopic 10
-Name Accounting Standards Codification
-Section 50
-Paragraph 8
-Subparagraph (a)
-Publisher FASB
-URI https://asc.fasb.org//1943274/2147479806/606-10-50-8
Reference 3: http://www.xbrl.org/2003/role/disclosureRef
-Topic 606
-SubTopic 10
-Name Accounting Standards Codification
-Section 45
-Paragraph 2
-Publisher FASB
-URI https://asc.fasb.org//1943274/2147479837/606-10-45-2
| Name: |
us-gaap_ContractWithCustomerLiabilityNoncurrent |
| Namespace Prefix: |
us-gaap_ |
| Data Type: |
xbrli:monetaryItemType |
| Balance Type: |
credit |
| Period Type: |
instant |
|
| X |
- DefinitionPresent value of lessee's discounted obligation for lease payments from finance lease, classified as noncurrent. Reference 1: http://www.xbrl.org/2003/role/disclosureRef
-Topic 842
-SubTopic 20
-Name Accounting Standards Codification
-Section 45
-Paragraph 1
-Subparagraph (b)
-Publisher FASB
-URI https://asc.fasb.org//1943274/2147479041/842-20-45-1
| Name: |
us-gaap_FinanceLeaseLiabilityNoncurrent |
| Namespace Prefix: |
us-gaap_ |
| Data Type: |
xbrli:monetaryItemType |
| Balance Type: |
credit |
| Period Type: |
instant |
|
| X |
- DefinitionAmount after accumulated impairment loss of an asset representing future economic benefits arising from other assets acquired in a business combination that are not individually identified and separately recognized. Reference 1: http://www.xbrl.org/2003/role/exampleRef
-Topic 852
-SubTopic 10
-Name Accounting Standards Codification
-Section 55
-Paragraph 10
-Publisher FASB
-URI https://asc.fasb.org//1943274/2147481372/852-10-55-10
Reference 2: http://www.xbrl.org/2003/role/exampleRef
-Topic 350
-SubTopic 20
-Name Accounting Standards Codification
-Section 55
-Paragraph 24
-Publisher FASB
-URI https://asc.fasb.org//1943274/2147482548/350-20-55-24
Reference 3: http://www.xbrl.org/2003/role/disclosureRef
-Topic 210
-SubTopic 10
-Name Accounting Standards Codification
-Section S99
-Paragraph 1
-Subparagraph (SX 210.5-02(15))
-Publisher FASB
-URI https://asc.fasb.org//1943274/2147480566/210-10-S99-1
Reference 4: http://www.xbrl.org/2003/role/disclosureRef
-Topic 350
-SubTopic 20
-Name Accounting Standards Codification
-Section 45
-Paragraph 1
-Publisher FASB
-URI https://asc.fasb.org//1943274/2147482598/350-20-45-1
Reference 5: http://www.xbrl.org/2009/role/commonPracticeRef
-Topic 350
-SubTopic 20
-Name Accounting Standards Codification
-Section 50
-Paragraph 1
-Subparagraph (a)
-Publisher FASB
-URI https://asc.fasb.org//1943274/2147482573/350-20-50-1
Reference 6: http://www.xbrl.org/2009/role/commonPracticeRef
-Topic 350
-SubTopic 20
-Name Accounting Standards Codification
-Section 50
-Paragraph 1
-Subparagraph (h)
-Publisher FASB
-URI https://asc.fasb.org//1943274/2147482573/350-20-50-1
Reference 7: http://www.xbrl.org/2003/role/disclosureRef
-Topic 942
-SubTopic 210
-Name Accounting Standards Codification
-Section S99
-Paragraph 1
-Subparagraph (SX 210.9-03(10)(1))
-Publisher FASB
-URI https://asc.fasb.org//1943274/2147479853/942-210-S99-1
| Name: |
us-gaap_Goodwill |
| Namespace Prefix: |
us-gaap_ |
| Data Type: |
xbrli:monetaryItemType |
| Balance Type: |
debit |
| Period Type: |
instant |
|
| X |
- DefinitionAmount after valuation and LIFO reserves of inventory expected to be sold, or consumed within one year or operating cycle, if longer. Reference 1: http://www.xbrl.org/2003/role/exampleRef
-Topic 852
-SubTopic 10
-Name Accounting Standards Codification
-Section 55
-Paragraph 10
-Publisher FASB
-URI https://asc.fasb.org//1943274/2147481372/852-10-55-10
Reference 2: http://www.xbrl.org/2003/role/exampleRef
-Topic 210
-SubTopic 10
-Name Accounting Standards Codification
-Section 45
-Paragraph 1
-Subparagraph (b)
-Publisher FASB
-URI https://asc.fasb.org//1943274/2147483467/210-10-45-1
Reference 3: http://www.xbrl.org/2003/role/disclosureRef
-Topic 210
-SubTopic 10
-Name Accounting Standards Codification
-Section S99
-Paragraph 1
-Subparagraph (SX 210.5-02(6))
-Publisher FASB
-URI https://asc.fasb.org//1943274/2147480566/210-10-S99-1
| Name: |
us-gaap_InventoryNet |
| Namespace Prefix: |
us-gaap_ |
| Data Type: |
xbrli:monetaryItemType |
| Balance Type: |
debit |
| Period Type: |
instant |
|
| X |
- DefinitionSum of the carrying amounts as of the balance sheet date of all liabilities that are recognized. Liabilities are probable future sacrifices of economic benefits arising from present obligations of an entity to transfer assets or provide services to other entities in the future. Reference 1: http://www.xbrl.org/2003/role/disclosureRef
-Topic 810
-SubTopic 10
-Name Accounting Standards Codification
-Section 50
-Paragraph 3
-Subparagraph (c)
-Publisher FASB
-URI https://asc.fasb.org//1943274/2147481203/810-10-50-3
Reference 2: http://www.xbrl.org/2003/role/disclosureRef
-Topic 810
-SubTopic 10
-Name Accounting Standards Codification
-Section 45
-Paragraph 25
-Subparagraph (b)
-Publisher FASB
-URI https://asc.fasb.org//1943274/2147481231/810-10-45-25
Reference 3: http://www.xbrl.org/2003/role/disclosureRef
-Topic 810
-SubTopic 10
-Name Accounting Standards Codification
-Section 50
-Paragraph 3
-Subparagraph (bb)
-Publisher FASB
-URI https://asc.fasb.org//1943274/2147481203/810-10-50-3
Reference 4: http://www.xbrl.org/2003/role/disclosureRef
-Topic 235
-SubTopic 10
-Name Accounting Standards Codification
-Section S99
-Paragraph 1
-Subparagraph (SX 210.4-08(g)(1)(ii))
-Publisher FASB
-URI https://asc.fasb.org//1943274/2147480678/235-10-S99-1
Reference 5: http://www.xbrl.org/2003/role/disclosureRef
-Topic 323
-SubTopic 10
-Name Accounting Standards Codification
-Section 50
-Paragraph 3
-Subparagraph (c)
-Publisher FASB
-URI https://asc.fasb.org//1943274/2147481687/323-10-50-3
Reference 6: http://www.xbrl.org/2003/role/disclosureRef
-Topic 825
-SubTopic 10
-Name Accounting Standards Codification
-Section 50
-Paragraph 28
-Subparagraph (f)
-Publisher FASB
-URI https://asc.fasb.org//1943274/2147482907/825-10-50-28
Reference 7: http://www.xbrl.org/2003/role/exampleRef
-Topic 946
-SubTopic 830
-Name Accounting Standards Codification
-Section 55
-Paragraph 12
-Publisher FASB
-URI https://asc.fasb.org//1943274/2147480167/946-830-55-12
Reference 8: http://www.xbrl.org/2003/role/disclosureRef
-Topic 946
-SubTopic 210
-Name Accounting Standards Codification
-Section S99
-Paragraph 1
-Subparagraph (SX 210.6-04(14))
-Publisher FASB
-URI https://asc.fasb.org//1943274/2147479617/946-210-S99-1
Reference 9: http://www.xbrl.org/2003/role/disclosureRef
-Topic 470
-SubTopic 10
-Name Accounting Standards Codification
-Section S99
-Paragraph 1A
-Subparagraph (SX 210.13-01(a)(4)(i))
-Publisher FASB
-URI https://asc.fasb.org//1943274/2147480097/470-10-S99-1A
Reference 10: http://www.xbrl.org/2009/role/commonPracticeRef
-Topic 470
-SubTopic 10
-Name Accounting Standards Codification
-Section S99
-Paragraph 1A
-Subparagraph (SX 210.13-01(a)(4)(ii))
-Publisher FASB
-URI https://asc.fasb.org//1943274/2147480097/470-10-S99-1A
Reference 11: http://www.xbrl.org/2003/role/disclosureRef
-Topic 470
-SubTopic 10
-Name Accounting Standards Codification
-Section S99
-Paragraph 1A
-Subparagraph (SX 210.13-01(a)(4)(iii)(A))
-Publisher FASB
-URI https://asc.fasb.org//1943274/2147480097/470-10-S99-1A
Reference 12: http://www.xbrl.org/2003/role/disclosureRef
-Topic 470
-SubTopic 10
-Name Accounting Standards Codification
-Section S99
-Paragraph 1A
-Subparagraph (SX 210.13-01(a)(4)(iv))
-Publisher FASB
-URI https://asc.fasb.org//1943274/2147480097/470-10-S99-1A
Reference 13: http://www.xbrl.org/2003/role/disclosureRef
-Topic 470
-SubTopic 10
-Name Accounting Standards Codification
-Section S99
-Paragraph 1A
-Subparagraph (SX 210.13-01(a)(5))
-Publisher FASB
-URI https://asc.fasb.org//1943274/2147480097/470-10-S99-1A
Reference 14: http://www.xbrl.org/2003/role/disclosureRef
-Topic 470
-SubTopic 10
-Name Accounting Standards Codification
-Section S99
-Paragraph 1B
-Subparagraph (SX 210.13-02(a)(4)(i))
-Publisher FASB
-URI https://asc.fasb.org//1943274/2147480097/470-10-S99-1B
Reference 15: http://www.xbrl.org/2003/role/disclosureRef
-Topic 470
-SubTopic 10
-Name Accounting Standards Codification
-Section S99
-Paragraph 1B
-Subparagraph (SX 210.13-02(a)(4)(iii)(A))
-Publisher FASB
-URI https://asc.fasb.org//1943274/2147480097/470-10-S99-1B
Reference 16: http://www.xbrl.org/2003/role/disclosureRef
-Topic 470
-SubTopic 10
-Name Accounting Standards Codification
-Section S99
-Paragraph 1B
-Subparagraph (SX 210.13-02(a)(4)(iii)(B))
-Publisher FASB
-URI https://asc.fasb.org//1943274/2147480097/470-10-S99-1B
Reference 17: http://www.xbrl.org/2003/role/disclosureRef
-Topic 470
-SubTopic 10
-Name Accounting Standards Codification
-Section S99
-Paragraph 1B
-Subparagraph (SX 210.13-02(a)(4)(iv))
-Publisher FASB
-URI https://asc.fasb.org//1943274/2147480097/470-10-S99-1B
Reference 18: http://www.xbrl.org/2003/role/disclosureRef
-Topic 470
-SubTopic 10
-Name Accounting Standards Codification
-Section S99
-Paragraph 1B
-Subparagraph (SX 210.13-02(a)(5))
-Publisher FASB
-URI https://asc.fasb.org//1943274/2147480097/470-10-S99-1B
Reference 19: http://www.xbrl.org/2009/role/commonPracticeRef
-Topic 852
-SubTopic 10
-Name Accounting Standards Codification
-Section 50
-Paragraph 7
-Subparagraph (a)
-Publisher FASB
-URI https://asc.fasb.org//1943274/2147481404/852-10-50-7
Reference 20: http://www.xbrl.org/2009/role/commonPracticeRef
-Topic 852
-SubTopic 10
-Name Accounting Standards Codification
-Section 50
-Paragraph 7
-Subparagraph (b)
-Publisher FASB
-URI https://asc.fasb.org//1943274/2147481404/852-10-50-7
Reference 21: http://www.xbrl.org/2003/role/exampleRef
-Topic 280
-SubTopic 10
-Name Accounting Standards Codification
-Section 50
-Paragraph 30
-Subparagraph (d)
-Publisher FASB
-URI https://asc.fasb.org//1943274/2147482810/280-10-50-30
Reference 22: http://fasb.org/us-gaap/role/ref/legacyRef
-Name Accounting Standards Codification
-Topic 210
-SubTopic 10
-Section S99
-Paragraph 1
-Subparagraph (SX 210.5-02.19-26)
-Publisher FASB
-URI https://asc.fasb.org//1943274/2147480566/210-10-S99-1
| Name: |
us-gaap_Liabilities |
| Namespace Prefix: |
us-gaap_ |
| Data Type: |
xbrli:monetaryItemType |
| Balance Type: |
credit |
| Period Type: |
instant |
|
| X |
- DefinitionAmount of liabilities and equity items, including the portion of equity attributable to noncontrolling interests, if any. Reference 1: http://www.xbrl.org/2003/role/exampleRef
-Topic 852
-SubTopic 10
-Name Accounting Standards Codification
-Section 55
-Paragraph 10
-Publisher FASB
-URI https://asc.fasb.org//1943274/2147481372/852-10-55-10
Reference 2: http://www.xbrl.org/2003/role/disclosureRef
-Topic 944
-SubTopic 210
-Name Accounting Standards Codification
-Section S99
-Paragraph 1
-Subparagraph (SX 210.7-03(a)(25))
-Publisher FASB
-URI https://asc.fasb.org//1943274/2147479440/944-210-S99-1
Reference 3: http://www.xbrl.org/2009/role/commonPracticeRef
-Topic 235
-SubTopic 10
-Name Accounting Standards Codification
-Section S99
-Paragraph 1
-Subparagraph (SX 210.4-08(g)(1)(ii))
-Publisher FASB
-URI https://asc.fasb.org//1943274/2147480678/235-10-S99-1
Reference 4: http://www.xbrl.org/2009/role/commonPracticeRef
-Topic 323
-SubTopic 10
-Name Accounting Standards Codification
-Section 50
-Paragraph 3
-Subparagraph (c)
-Publisher FASB
-URI https://asc.fasb.org//1943274/2147481687/323-10-50-3
Reference 5: http://www.xbrl.org/2009/role/commonPracticeRef
-Topic 825
-SubTopic 10
-Name Accounting Standards Codification
-Section 50
-Paragraph 28
-Subparagraph (f)
-Publisher FASB
-URI https://asc.fasb.org//1943274/2147482907/825-10-50-28
Reference 6: http://fasb.org/us-gaap/role/ref/legacyRef
-Topic 942
-SubTopic 210
-Name Accounting Standards Codification
-Section S99
-Paragraph 1
-Subparagraph (SX 210.9-03(23))
-Publisher FASB
-URI https://asc.fasb.org//1943274/2147479853/942-210-S99-1
Reference 7: http://fasb.org/us-gaap/role/ref/legacyRef
-Topic 210
-SubTopic 10
-Name Accounting Standards Codification
-Section S99
-Paragraph 1
-Subparagraph (SX 210.5-02(32))
-Publisher FASB
-URI https://asc.fasb.org//1943274/2147480566/210-10-S99-1
| Name: |
us-gaap_LiabilitiesAndStockholdersEquity |
| Namespace Prefix: |
us-gaap_ |
| Data Type: |
xbrli:monetaryItemType |
| Balance Type: |
credit |
| Period Type: |
instant |
|
| X |
- DefinitionTotal obligations incurred as part of normal operations that are expected to be paid during the following twelve months or within one business cycle, if longer. Reference 1: http://www.xbrl.org/2003/role/disclosureRef
-Topic 810
-SubTopic 10
-Name Accounting Standards Codification
-Section 50
-Paragraph 3
-Subparagraph (c)
-Publisher FASB
-URI https://asc.fasb.org//1943274/2147481203/810-10-50-3
Reference 2: http://www.xbrl.org/2003/role/disclosureRef
-Topic 810
-SubTopic 10
-Name Accounting Standards Codification
-Section 45
-Paragraph 25
-Subparagraph (b)
-Publisher FASB
-URI https://asc.fasb.org//1943274/2147481231/810-10-45-25
Reference 3: http://www.xbrl.org/2003/role/disclosureRef
-Topic 810
-SubTopic 10
-Name Accounting Standards Codification
-Section 50
-Paragraph 3
-Subparagraph (bb)
-Publisher FASB
-URI https://asc.fasb.org//1943274/2147481203/810-10-50-3
Reference 4: http://www.xbrl.org/2003/role/disclosureRef
-Topic 235
-SubTopic 10
-Name Accounting Standards Codification
-Section S99
-Paragraph 1
-Subparagraph (SX 210.4-08(g)(1)(ii))
-Publisher FASB
-URI https://asc.fasb.org//1943274/2147480678/235-10-S99-1
Reference 5: http://www.xbrl.org/2003/role/disclosureRef
-Topic 323
-SubTopic 10
-Name Accounting Standards Codification
-Section 50
-Paragraph 3
-Subparagraph (c)
-Publisher FASB
-URI https://asc.fasb.org//1943274/2147481687/323-10-50-3
Reference 6: http://www.xbrl.org/2003/role/disclosureRef
-Topic 825
-SubTopic 10
-Name Accounting Standards Codification
-Section 50
-Paragraph 28
-Subparagraph (f)
-Publisher FASB
-URI https://asc.fasb.org//1943274/2147482907/825-10-50-28
Reference 7: http://www.xbrl.org/2003/role/exampleRef
-Topic 852
-SubTopic 10
-Name Accounting Standards Codification
-Section 55
-Paragraph 10
-Publisher FASB
-URI https://asc.fasb.org//1943274/2147481372/852-10-55-10
Reference 8: http://www.xbrl.org/2003/role/disclosureRef
-Topic 210
-SubTopic 10
-Name Accounting Standards Codification
-Section 45
-Paragraph 5
-Publisher FASB
-URI https://asc.fasb.org//1943274/2147483467/210-10-45-5
Reference 9: http://www.xbrl.org/2003/role/disclosureRef
-Topic 470
-SubTopic 10
-Name Accounting Standards Codification
-Section S99
-Paragraph 1A
-Subparagraph (SX 210.13-01(a)(4)(i))
-Publisher FASB
-URI https://asc.fasb.org//1943274/2147480097/470-10-S99-1A
Reference 10: http://www.xbrl.org/2009/role/commonPracticeRef
-Topic 470
-SubTopic 10
-Name Accounting Standards Codification
-Section S99
-Paragraph 1A
-Subparagraph (SX 210.13-01(a)(4)(ii))
-Publisher FASB
-URI https://asc.fasb.org//1943274/2147480097/470-10-S99-1A
Reference 11: http://www.xbrl.org/2003/role/disclosureRef
-Topic 470
-SubTopic 10
-Name Accounting Standards Codification
-Section S99
-Paragraph 1A
-Subparagraph (SX 210.13-01(a)(4)(iii)(A))
-Publisher FASB
-URI https://asc.fasb.org//1943274/2147480097/470-10-S99-1A
Reference 12: http://www.xbrl.org/2003/role/disclosureRef
-Topic 470
-SubTopic 10
-Name Accounting Standards Codification
-Section S99
-Paragraph 1A
-Subparagraph (SX 210.13-01(a)(4)(iv))
-Publisher FASB
-URI https://asc.fasb.org//1943274/2147480097/470-10-S99-1A
Reference 13: http://www.xbrl.org/2003/role/disclosureRef
-Topic 470
-SubTopic 10
-Name Accounting Standards Codification
-Section S99
-Paragraph 1A
-Subparagraph (SX 210.13-01(a)(5))
-Publisher FASB
-URI https://asc.fasb.org//1943274/2147480097/470-10-S99-1A
Reference 14: http://www.xbrl.org/2003/role/disclosureRef
-Topic 470
-SubTopic 10
-Name Accounting Standards Codification
-Section S99
-Paragraph 1B
-Subparagraph (SX 210.13-02(a)(4)(i))
-Publisher FASB
-URI https://asc.fasb.org//1943274/2147480097/470-10-S99-1B
Reference 15: http://www.xbrl.org/2003/role/disclosureRef
-Topic 470
-SubTopic 10
-Name Accounting Standards Codification
-Section S99
-Paragraph 1B
-Subparagraph (SX 210.13-02(a)(4)(iii)(A))
-Publisher FASB
-URI https://asc.fasb.org//1943274/2147480097/470-10-S99-1B
Reference 16: http://www.xbrl.org/2003/role/disclosureRef
-Topic 470
-SubTopic 10
-Name Accounting Standards Codification
-Section S99
-Paragraph 1B
-Subparagraph (SX 210.13-02(a)(4)(iii)(B))
-Publisher FASB
-URI https://asc.fasb.org//1943274/2147480097/470-10-S99-1B
Reference 17: http://www.xbrl.org/2003/role/disclosureRef
-Topic 470
-SubTopic 10
-Name Accounting Standards Codification
-Section S99
-Paragraph 1B
-Subparagraph (SX 210.13-02(a)(4)(iv))
-Publisher FASB
-URI https://asc.fasb.org//1943274/2147480097/470-10-S99-1B
Reference 18: http://www.xbrl.org/2003/role/disclosureRef
-Topic 470
-SubTopic 10
-Name Accounting Standards Codification
-Section S99
-Paragraph 1B
-Subparagraph (SX 210.13-02(a)(5))
-Publisher FASB
-URI https://asc.fasb.org//1943274/2147480097/470-10-S99-1B
Reference 19: http://www.xbrl.org/2009/role/commonPracticeRef
-Topic 852
-SubTopic 10
-Name Accounting Standards Codification
-Section 50
-Paragraph 7
-Subparagraph (a)
-Publisher FASB
-URI https://asc.fasb.org//1943274/2147481404/852-10-50-7
Reference 20: http://www.xbrl.org/2009/role/commonPracticeRef
-Topic 852
-SubTopic 10
-Name Accounting Standards Codification
-Section 50
-Paragraph 7
-Subparagraph (b)
-Publisher FASB
-URI https://asc.fasb.org//1943274/2147481404/852-10-50-7
Reference 21: http://fasb.org/us-gaap/role/ref/legacyRef
-Name Accounting Standards Codification
-Topic 210
-SubTopic 10
-Section S99
-Paragraph 1
-Subparagraph (SX 210.5-02.21)
-Publisher FASB
-URI https://asc.fasb.org//1943274/2147480566/210-10-S99-1
| Name: |
us-gaap_LiabilitiesCurrent |
| Namespace Prefix: |
us-gaap_ |
| Data Type: |
xbrli:monetaryItemType |
| Balance Type: |
credit |
| Period Type: |
instant |
|
| X |
- References
+ Details
| Name: |
us-gaap_LiabilitiesCurrentAbstract |
| Namespace Prefix: |
us-gaap_ |
| Data Type: |
xbrli:stringItemType |
| Balance Type: |
na |
| Period Type: |
duration |
|
| X |
- DefinitionAmount, after deduction of unamortized premium (discount) and debt issuance cost, of long-term debt classified as noncurrent. Excludes lease obligation. Reference 1: http://www.xbrl.org/2003/role/disclosureRef
-Topic 210
-SubTopic 10
-Name Accounting Standards Codification
-Section S99
-Paragraph 1
-Subparagraph (SX 210.5-02(22))
-Publisher FASB
-URI https://asc.fasb.org//1943274/2147480566/210-10-S99-1
| Name: |
us-gaap_LongTermDebtNoncurrent |
| Namespace Prefix: |
us-gaap_ |
| Data Type: |
xbrli:monetaryItemType |
| Balance Type: |
credit |
| Period Type: |
instant |
|
| X |
- DefinitionPresent value of lessee's discounted obligation for lease payments from operating lease, classified as current. Reference 1: http://www.xbrl.org/2003/role/disclosureRef
-Topic 842
-SubTopic 20
-Name Accounting Standards Codification
-Section 45
-Paragraph 1
-Subparagraph (b)
-Publisher FASB
-URI https://asc.fasb.org//1943274/2147479041/842-20-45-1
| Name: |
us-gaap_OperatingLeaseLiabilityCurrent |
| Namespace Prefix: |
us-gaap_ |
| Data Type: |
xbrli:monetaryItemType |
| Balance Type: |
credit |
| Period Type: |
instant |
|
| X |
- DefinitionPresent value of lessee's discounted obligation for lease payments from operating lease, classified as noncurrent. Reference 1: http://www.xbrl.org/2003/role/disclosureRef
-Topic 842
-SubTopic 20
-Name Accounting Standards Codification
-Section 45
-Paragraph 1
-Subparagraph (b)
-Publisher FASB
-URI https://asc.fasb.org//1943274/2147479041/842-20-45-1
| Name: |
us-gaap_OperatingLeaseLiabilityNoncurrent |
| Namespace Prefix: |
us-gaap_ |
| Data Type: |
xbrli:monetaryItemType |
| Balance Type: |
credit |
| Period Type: |
instant |
|
| X |
- DefinitionAmount of lessee's right to use underlying asset under operating lease. Reference 1: http://www.xbrl.org/2003/role/disclosureRef
-Topic 842
-SubTopic 20
-Name Accounting Standards Codification
-Section 45
-Paragraph 1
-Subparagraph (a)
-Publisher FASB
-URI https://asc.fasb.org//1943274/2147479041/842-20-45-1
| Name: |
us-gaap_OperatingLeaseRightOfUseAsset |
| Namespace Prefix: |
us-gaap_ |
| Data Type: |
xbrli:monetaryItemType |
| Balance Type: |
debit |
| Period Type: |
instant |
|
| X |
- DefinitionAmount of assets classified as other. Reference 1: http://www.xbrl.org/2003/role/exampleRef
-Topic 946
-SubTopic 830
-Name Accounting Standards Codification
-Section 55
-Paragraph 12
-Publisher FASB
-URI https://asc.fasb.org//1943274/2147480167/946-830-55-12
Reference 2: http://www.xbrl.org/2003/role/disclosureRef
-Topic 944
-SubTopic 210
-Name Accounting Standards Codification
-Section S99
-Paragraph 1
-Subparagraph (SX 210.7-03(a)(10))
-Publisher FASB
-URI https://asc.fasb.org//1943274/2147479440/944-210-S99-1
Reference 3: http://www.xbrl.org/2003/role/disclosureRef
-Topic 210
-SubTopic 10
-Name Accounting Standards Codification
-Section S99
-Paragraph 1
-Subparagraph (SX 210.5-02(17))
-Publisher FASB
-URI https://asc.fasb.org//1943274/2147480566/210-10-S99-1
Reference 4: http://fasb.org/us-gaap/role/ref/legacyRef
-Topic 942
-SubTopic 210
-Name Accounting Standards Codification
-Section S99
-Paragraph 1
-Subparagraph (SX 210.9-03(10))
-Publisher FASB
-URI https://asc.fasb.org//1943274/2147479853/942-210-S99-1
| Name: |
us-gaap_OtherAssets |
| Namespace Prefix: |
us-gaap_ |
| Data Type: |
xbrli:monetaryItemType |
| Balance Type: |
debit |
| Period Type: |
instant |
|
| X |
- DefinitionAmount after accumulated amortization of finite-lived and indefinite-lived intangible assets classified as other.
| Name: |
us-gaap_OtherIntangibleAssetsNet |
| Namespace Prefix: |
us-gaap_ |
| Data Type: |
xbrli:monetaryItemType |
| Balance Type: |
debit |
| Period Type: |
instant |
|
| X |
- DefinitionAmount of liabilities classified as other, due within one year or the normal operating cycle, if longer. Reference 1: http://www.xbrl.org/2003/role/exampleRef
-Topic 852
-SubTopic 10
-Name Accounting Standards Codification
-Section 55
-Paragraph 10
-Publisher FASB
-URI https://asc.fasb.org//1943274/2147481372/852-10-55-10
Reference 2: http://fasb.org/us-gaap/role/ref/legacyRef
-Name Accounting Standards Codification
-Topic 210
-SubTopic 10
-Section S99
-Paragraph 1
-Subparagraph (SX 210.5-02.20)
-Publisher FASB
-URI https://asc.fasb.org//1943274/2147480566/210-10-S99-1
| Name: |
us-gaap_OtherLiabilitiesCurrent |
| Namespace Prefix: |
us-gaap_ |
| Data Type: |
xbrli:monetaryItemType |
| Balance Type: |
credit |
| Period Type: |
instant |
|
| X |
- DefinitionAmount of liabilities classified as other, due after one year or the normal operating cycle, if longer. Reference 1: http://fasb.org/us-gaap/role/ref/legacyRef
-Name Accounting Standards Codification
-Topic 210
-SubTopic 10
-Section S99
-Paragraph 1
-Subparagraph (SX 210.5-02.24)
-Publisher FASB
-URI https://asc.fasb.org//1943274/2147480566/210-10-S99-1
| Name: |
us-gaap_OtherLiabilitiesNoncurrent |
| Namespace Prefix: |
us-gaap_ |
| Data Type: |
xbrli:monetaryItemType |
| Balance Type: |
credit |
| Period Type: |
instant |
|
| X |
- DefinitionAggregate par or stated value of issued nonredeemable preferred stock (or preferred stock redeemable solely at the option of the issuer). This item includes treasury stock repurchased by the entity. Note: elements for number of nonredeemable preferred shares, par value and other disclosure concepts are in another section within stockholders' equity. Reference 1: http://www.xbrl.org/2003/role/exampleRef
-Topic 852
-SubTopic 10
-Name Accounting Standards Codification
-Section 55
-Paragraph 10
-Publisher FASB
-URI https://asc.fasb.org//1943274/2147481372/852-10-55-10
Reference 2: http://www.xbrl.org/2003/role/disclosureRef
-Topic 944
-SubTopic 210
-Name Accounting Standards Codification
-Section S99
-Paragraph 1
-Subparagraph (SX 210.7-03(a)(21))
-Publisher FASB
-URI https://asc.fasb.org//1943274/2147479440/944-210-S99-1
Reference 3: http://fasb.org/us-gaap/role/ref/legacyRef
-Topic 210
-SubTopic 10
-Name Accounting Standards Codification
-Section S99
-Paragraph 1
-Subparagraph (SX 210.5-02(28))
-Publisher FASB
-URI https://asc.fasb.org//1943274/2147480566/210-10-S99-1
| Name: |
us-gaap_PreferredStockValue |
| Namespace Prefix: |
us-gaap_ |
| Data Type: |
xbrli:monetaryItemType |
| Balance Type: |
credit |
| Period Type: |
instant |
|
| X |
- DefinitionAmount of asset related to consideration paid in advance for costs that provide economic benefits in future periods, and amount of other assets that are expected to be realized or consumed within one year or the normal operating cycle, if longer. Reference 1: http://www.xbrl.org/2009/role/commonPracticeRef
-Topic 210
-SubTopic 10
-Name Accounting Standards Codification
-Section S99
-Paragraph 1
-Subparagraph (SX 210.5-02(9))
-Publisher FASB
-URI https://asc.fasb.org//1943274/2147480566/210-10-S99-1
| Name: |
us-gaap_PrepaidExpenseAndOtherAssetsCurrent |
| Namespace Prefix: |
us-gaap_ |
| Data Type: |
xbrli:monetaryItemType |
| Balance Type: |
debit |
| Period Type: |
instant |
|
| X |
- DefinitionAmount after accumulated depreciation, depletion and amortization of physical assets used in the normal conduct of business to produce goods and services and not intended for resale. Examples include, but are not limited to, land, buildings, machinery and equipment, office equipment, and furniture and fixtures. Reference 1: http://fasb.org/us-gaap/role/ref/legacyRef
-Name Accounting Standards Codification
-Section 50
-Paragraph 1
-SubTopic 10
-Topic 360
-Publisher FASB
-URI https://asc.fasb.org//1943274/2147482099/360-10-50-1
Reference 2: http://www.xbrl.org/2003/role/exampleRef
-Topic 852
-SubTopic 10
-Name Accounting Standards Codification
-Section 55
-Paragraph 10
-Publisher FASB
-URI https://asc.fasb.org//1943274/2147481372/852-10-55-10
Reference 3: http://www.xbrl.org/2003/role/disclosureRef
-Topic 944
-SubTopic 210
-Name Accounting Standards Codification
-Section S99
-Paragraph 1
-Subparagraph (SX 210.7-03(a)(8))
-Publisher FASB
-URI https://asc.fasb.org//1943274/2147479440/944-210-S99-1
Reference 4: http://www.xbrl.org/2003/role/disclosureRef
-Topic 942
-SubTopic 360
-Name Accounting Standards Codification
-Section 50
-Paragraph 1
-Publisher FASB
-URI https://asc.fasb.org//1943274/2147480842/942-360-50-1
| Name: |
us-gaap_PropertyPlantAndEquipmentNet |
| Namespace Prefix: |
us-gaap_ |
| Data Type: |
xbrli:monetaryItemType |
| Balance Type: |
debit |
| Period Type: |
instant |
|
| X |
- DefinitionAmount of accumulated undistributed earnings (deficit). Reference 1: http://www.xbrl.org/2003/role/exampleRef
-Topic 852
-SubTopic 10
-Name Accounting Standards Codification
-Section 55
-Paragraph 10
-Publisher FASB
-URI https://asc.fasb.org//1943274/2147481372/852-10-55-10
Reference 2: http://www.xbrl.org/2003/role/disclosureRef
-Topic 944
-SubTopic 40
-Name Accounting Standards Codification
-Section 65
-Paragraph 2
-Subparagraph (g)(2)(i)
-Publisher FASB
-URI https://asc.fasb.org//1943274/2147480016/944-40-65-2
Reference 3: http://www.xbrl.org/2003/role/disclosureRef
-Topic 944
-SubTopic 40
-Name Accounting Standards Codification
-Section 65
-Paragraph 2
-Subparagraph (h)(2)
-Publisher FASB
-URI https://asc.fasb.org//1943274/2147480016/944-40-65-2
Reference 4: http://www.xbrl.org/2003/role/disclosureRef
-Topic 946
-SubTopic 20
-Name Accounting Standards Codification
-Section 50
-Paragraph 11
-Publisher FASB
-URI https://asc.fasb.org//1943274/2147480990/946-20-50-11
Reference 5: http://www.xbrl.org/2003/role/disclosureRef
-Topic 944
-SubTopic 210
-Name Accounting Standards Codification
-Section S99
-Paragraph 1
-Subparagraph (SX 210.7-03(a)(23)(a)(4))
-Publisher FASB
-URI https://asc.fasb.org//1943274/2147479440/944-210-S99-1
Reference 6: http://www.xbrl.org/2003/role/disclosureRef
-Topic 946
-SubTopic 210
-Name Accounting Standards Codification
-Section S99
-Paragraph 1
-Subparagraph (SX 210.6-04(17))
-Publisher FASB
-URI https://asc.fasb.org//1943274/2147479617/946-210-S99-1
Reference 7: http://fasb.org/us-gaap/role/ref/legacyRef
-Topic 505
-SubTopic 10
-Name Accounting Standards Codification
-Section S99
-Paragraph 1
-Subparagraph (SX 210.3-04)
-Publisher FASB
-URI https://asc.fasb.org//1943274/2147480008/505-10-S99-1
Reference 8: http://fasb.org/us-gaap/role/ref/legacyRef
-Topic 210
-SubTopic 10
-Name Accounting Standards Codification
-Section S99
-Paragraph 1
-Subparagraph (SX 210.5-02(30)(a)(3))
-Publisher FASB
-URI https://asc.fasb.org//1943274/2147480566/210-10-S99-1
| Name: |
us-gaap_RetainedEarningsAccumulatedDeficit |
| Namespace Prefix: |
us-gaap_ |
| Data Type: |
xbrli:monetaryItemType |
| Balance Type: |
credit |
| Period Type: |
instant |
|
| X |
- DefinitionAmount of equity (deficit) attributable to parent. Excludes temporary equity and equity attributable to noncontrolling interest. Reference 1: http://www.xbrl.org/2003/role/exampleRef
-Topic 852
-SubTopic 10
-Name Accounting Standards Codification
-Section 55
-Paragraph 10
-Publisher FASB
-URI https://asc.fasb.org//1943274/2147481372/852-10-55-10
Reference 2: http://www.xbrl.org/2003/role/exampleRef
-Topic 946
-SubTopic 830
-Name Accounting Standards Codification
-Section 55
-Paragraph 12
-Publisher FASB
-URI https://asc.fasb.org//1943274/2147480167/946-830-55-12
Reference 3: http://www.xbrl.org/2003/role/disclosureRef
-Topic 946
-SubTopic 210
-Name Accounting Standards Codification
-Section S99
-Paragraph 1
-Subparagraph (SX 210.6-04(19))
-Publisher FASB
-URI https://asc.fasb.org//1943274/2147479617/946-210-S99-1
Reference 4: http://www.xbrl.org/2003/role/disclosureRef
-Topic 946
-SubTopic 210
-Name Accounting Standards Codification
-Section S99
-Paragraph 2
-Subparagraph (SX 210.6-05(4))
-Publisher FASB
-URI https://asc.fasb.org//1943274/2147479617/946-210-S99-2
Reference 5: http://www.xbrl.org/2009/role/commonPracticeRef
-Topic 946
-SubTopic 220
-Name Accounting Standards Codification
-Section S99
-Paragraph 3
-Subparagraph (SX 210.6-09(4)(b))
-Publisher FASB
-URI https://asc.fasb.org//1943274/2147483575/946-220-S99-3
Reference 6: http://www.xbrl.org/2003/role/disclosureRef
-Topic 946
-SubTopic 220
-Name Accounting Standards Codification
-Section S99
-Paragraph 3
-Subparagraph (SX 210.6-09(6))
-Publisher FASB
-URI https://asc.fasb.org//1943274/2147483575/946-220-S99-3
Reference 7: http://www.xbrl.org/2003/role/disclosureRef
-Topic 946
-SubTopic 220
-Name Accounting Standards Codification
-Section S99
-Paragraph 3
-Subparagraph (SX 210.6-09(7))
-Publisher FASB
-URI https://asc.fasb.org//1943274/2147483575/946-220-S99-3
Reference 8: http://www.xbrl.org/2009/role/commonPracticeRef
-Topic 235
-SubTopic 10
-Name Accounting Standards Codification
-Section S99
-Paragraph 1
-Subparagraph (SX 210.4-08(g)(1)(ii))
-Publisher FASB
-URI https://asc.fasb.org//1943274/2147480678/235-10-S99-1
Reference 9: http://www.xbrl.org/2009/role/commonPracticeRef
-Topic 323
-SubTopic 10
-Name Accounting Standards Codification
-Section 50
-Paragraph 3
-Subparagraph (c)
-Publisher FASB
-URI https://asc.fasb.org//1943274/2147481687/323-10-50-3
Reference 10: http://www.xbrl.org/2009/role/commonPracticeRef
-Topic 825
-SubTopic 10
-Name Accounting Standards Codification
-Section 50
-Paragraph 28
-Subparagraph (f)
-Publisher FASB
-URI https://asc.fasb.org//1943274/2147482907/825-10-50-28
Reference 11: http://fasb.org/us-gaap/role/ref/legacyRef
-Topic 210
-SubTopic 10
-Name Accounting Standards Codification
-Section S99
-Paragraph 1
-Subparagraph (SX 210.5-02(29))
-Publisher FASB
-URI https://asc.fasb.org//1943274/2147480566/210-10-S99-1
Reference 12: http://fasb.org/us-gaap/role/ref/legacyRef
-Topic 210
-SubTopic 10
-Name Accounting Standards Codification
-Section S99
-Paragraph 1
-Subparagraph (SX 210.5-02(31))
-Publisher FASB
-URI https://asc.fasb.org//1943274/2147480566/210-10-S99-1
Reference 13: http://fasb.org/us-gaap/role/ref/legacyRef
-Topic 210
-SubTopic 10
-Name Accounting Standards Codification
-Section S99
-Paragraph 1
-Subparagraph (SX 210.5-02(30))
-Publisher FASB
-URI https://asc.fasb.org//1943274/2147480566/210-10-S99-1
Reference 14: http://fasb.org/us-gaap/role/ref/legacyRef
-Topic 310
-SubTopic 10
-Name Accounting Standards Codification
-Section S99
-Paragraph 2
-Subparagraph (SAB Topic 4.E)
-Publisher FASB
-URI https://asc.fasb.org//1943274/2147480418/310-10-S99-2
| Name: |
us-gaap_StockholdersEquity |
| Namespace Prefix: |
us-gaap_ |
| Data Type: |
xbrli:monetaryItemType |
| Balance Type: |
credit |
| Period Type: |
instant |
|
| X |
- References
+ Details
| Name: |
us-gaap_StockholdersEquityAbstract |
| Namespace Prefix: |
us-gaap_ |
| Data Type: |
xbrli:stringItemType |
| Balance Type: |
na |
| Period Type: |
duration |
|
| X |
- DefinitionCarrying value as of the balance sheet date of obligations incurred and payable for statutory income, sales, use, payroll, excise, real, property and other taxes. Used to reflect the current portion of the liabilities (due within one year or within the normal operating cycle if longer). Reference 1: http://fasb.org/us-gaap/role/ref/legacyRef
-Name Accounting Standards Codification
-Topic 210
-SubTopic 10
-Section S99
-Paragraph 1
-Subparagraph (SX 210.5-02.19,20)
-Publisher FASB
-URI https://asc.fasb.org//1943274/2147480566/210-10-S99-1
| Name: |
us-gaap_TaxesPayableCurrent |
| Namespace Prefix: |
us-gaap_ |
| Data Type: |
xbrli:monetaryItemType |
| Balance Type: |
credit |
| Period Type: |
instant |
|
| X |
- Details
| Name: |
srt_RestatementAxis=srt_ScenarioPreviouslyReportedMember |
| Namespace Prefix: |
|
| Data Type: |
na |
| Balance Type: |
|
| Period Type: |
|
|
| X |
- Details
| Name: |
srt_RestatementAxis=INSE_PreviousRevisionMember |
| Namespace Prefix: |
|
| Data Type: |
na |
| Balance Type: |
|
| Period Type: |
|
|
| X |
- Details
| Name: |
srt_RestatementAxis=srt_RevisionOfPriorPeriodReclassificationAdjustmentMember |
| Namespace Prefix: |
|
| Data Type: |
na |
| Balance Type: |
|
| Period Type: |
|
|
v3.24.0.1
Schedule of Restatement Items on Consolidated Balance Sheets (Unaudited) (Details) (Parenthetical) - $ / shares
|
Mar. 31, 2023 |
Dec. 31, 2022 |
Dec. 31, 2021 |
| Accounting Changes and Error Corrections [Abstract] |
|
|
|
| Preferred stock, par value |
$ 0.0001
|
$ 0.0001
|
|
| Preferred stock, shares authorized |
1,000,000
|
1,000,000
|
|
| Common stock, par value |
$ 0.0001
|
$ 0.0001
|
$ 0.0001
|
| Common stock, shares authorized |
49,000,000
|
49,000,000
|
49,000,000
|
| Common stock, shares issued |
26,263,070
|
25,909,516
|
26,433,562
|
| Common stock, shares outstanding |
26,263,070
|
25,909,516
|
26,433,562
|
| X |
- References
+ Details
| Name: |
us-gaap_AccountingChangesAndErrorCorrectionsAbstract |
| Namespace Prefix: |
us-gaap_ |
| Data Type: |
xbrli:stringItemType |
| Balance Type: |
na |
| Period Type: |
duration |
|
| X |
- DefinitionFace amount or stated value per share of common stock. Reference 1: http://fasb.org/us-gaap/role/ref/legacyRef
-Topic 210
-SubTopic 10
-Name Accounting Standards Codification
-Section S99
-Paragraph 1
-Subparagraph (SX 210.5-02(29))
-Publisher FASB
-URI https://asc.fasb.org//1943274/2147480566/210-10-S99-1
| Name: |
us-gaap_CommonStockParOrStatedValuePerShare |
| Namespace Prefix: |
us-gaap_ |
| Data Type: |
dtr-types:perShareItemType |
| Balance Type: |
na |
| Period Type: |
instant |
|
| X |
- DefinitionThe maximum number of common shares permitted to be issued by an entity's charter and bylaws. Reference 1: http://www.xbrl.org/2003/role/disclosureRef
-Topic 946
-SubTopic 210
-Name Accounting Standards Codification
-Section S99
-Paragraph 1
-Subparagraph (SX 210.6-04(16)(a))
-Publisher FASB
-URI https://asc.fasb.org//1943274/2147479617/946-210-S99-1
Reference 2: http://fasb.org/us-gaap/role/ref/legacyRef
-Topic 210
-SubTopic 10
-Name Accounting Standards Codification
-Section S99
-Paragraph 1
-Subparagraph (SX 210.5-02(29))
-Publisher FASB
-URI https://asc.fasb.org//1943274/2147480566/210-10-S99-1
| Name: |
us-gaap_CommonStockSharesAuthorized |
| Namespace Prefix: |
us-gaap_ |
| Data Type: |
xbrli:sharesItemType |
| Balance Type: |
na |
| Period Type: |
instant |
|
| X |
- DefinitionTotal number of common shares of an entity that have been sold or granted to shareholders (includes common shares that were issued, repurchased and remain in the treasury). These shares represent capital invested by the firm's shareholders and owners, and may be all or only a portion of the number of shares authorized. Shares issued include shares outstanding and shares held in the treasury. Reference 1: http://fasb.org/us-gaap/role/ref/legacyRef
-Topic 210
-SubTopic 10
-Name Accounting Standards Codification
-Section S99
-Paragraph 1
-Subparagraph (SX 210.5-02(29))
-Publisher FASB
-URI https://asc.fasb.org//1943274/2147480566/210-10-S99-1
| Name: |
us-gaap_CommonStockSharesIssued |
| Namespace Prefix: |
us-gaap_ |
| Data Type: |
xbrli:sharesItemType |
| Balance Type: |
na |
| Period Type: |
instant |
|
| X |
- DefinitionNumber of shares of common stock outstanding. Common stock represent the ownership interest in a corporation. Reference 1: http://fasb.org/us-gaap/role/ref/legacyRef
-Name Accounting Standards Codification
-Section 50
-Paragraph 2
-SubTopic 10
-Topic 505
-Publisher FASB
-URI https://asc.fasb.org//1943274/2147481112/505-10-50-2
Reference 2: http://www.xbrl.org/2003/role/disclosureRef
-Topic 946
-SubTopic 210
-Name Accounting Standards Codification
-Section S99
-Paragraph 2
-Subparagraph (SX 210.6-05(4))
-Publisher FASB
-URI https://asc.fasb.org//1943274/2147479617/946-210-S99-2
Reference 3: http://www.xbrl.org/2009/role/commonPracticeRef
-Topic 946
-SubTopic 220
-Name Accounting Standards Codification
-Section S99
-Paragraph 3
-Subparagraph (SX 210.6-09(4)(b))
-Publisher FASB
-URI https://asc.fasb.org//1943274/2147483575/946-220-S99-3
Reference 4: http://www.xbrl.org/2003/role/disclosureRef
-Topic 946
-SubTopic 210
-Name Accounting Standards Codification
-Section S99
-Paragraph 1
-Subparagraph (SX 210.6-04(16)(a))
-Publisher FASB
-URI https://asc.fasb.org//1943274/2147479617/946-210-S99-1
Reference 5: http://www.xbrl.org/2009/role/commonPracticeRef
-Topic 946
-SubTopic 220
-Name Accounting Standards Codification
-Section S99
-Paragraph 3
-Subparagraph (SX 210.6-09(7))
-Publisher FASB
-URI https://asc.fasb.org//1943274/2147483575/946-220-S99-3
Reference 6: http://fasb.org/us-gaap/role/ref/legacyRef
-Topic 210
-SubTopic 10
-Name Accounting Standards Codification
-Section S99
-Paragraph 1
-Subparagraph (SX 210.5-02(29))
-Publisher FASB
-URI https://asc.fasb.org//1943274/2147480566/210-10-S99-1
| Name: |
us-gaap_CommonStockSharesOutstanding |
| Namespace Prefix: |
us-gaap_ |
| Data Type: |
xbrli:sharesItemType |
| Balance Type: |
na |
| Period Type: |
instant |
|
| X |
- DefinitionFace amount or stated value per share of preferred stock nonredeemable or redeemable solely at the option of the issuer. Reference 1: http://www.xbrl.org/2003/role/disclosureRef
-Topic 505
-SubTopic 10
-Name Accounting Standards Codification
-Section 50
-Paragraph 13
-Subparagraph (a)
-Publisher FASB
-URI https://asc.fasb.org//1943274/2147481112/505-10-50-13
Reference 2: http://fasb.org/us-gaap/role/ref/legacyRef
-Topic 210
-SubTopic 10
-Name Accounting Standards Codification
-Section S99
-Paragraph 1
-Subparagraph (SX 210.5-02(28))
-Publisher FASB
-URI https://asc.fasb.org//1943274/2147480566/210-10-S99-1
| Name: |
us-gaap_PreferredStockParOrStatedValuePerShare |
| Namespace Prefix: |
us-gaap_ |
| Data Type: |
dtr-types:perShareItemType |
| Balance Type: |
na |
| Period Type: |
instant |
|
| X |
- DefinitionThe maximum number of nonredeemable preferred shares (or preferred stock redeemable solely at the option of the issuer) permitted to be issued by an entity's charter and bylaws. Reference 1: http://www.xbrl.org/2003/role/disclosureRef
-Topic 946
-SubTopic 210
-Name Accounting Standards Codification
-Section S99
-Paragraph 1
-Subparagraph (SX 210.6-04(16)(a))
-Publisher FASB
-URI https://asc.fasb.org//1943274/2147479617/946-210-S99-1
Reference 2: http://fasb.org/us-gaap/role/ref/legacyRef
-Topic 210
-SubTopic 10
-Name Accounting Standards Codification
-Section S99
-Paragraph 1
-Subparagraph (SX 210.5-02(28))
-Publisher FASB
-URI https://asc.fasb.org//1943274/2147480566/210-10-S99-1
| Name: |
us-gaap_PreferredStockSharesAuthorized |
| Namespace Prefix: |
us-gaap_ |
| Data Type: |
xbrli:sharesItemType |
| Balance Type: |
na |
| Period Type: |
instant |
|
v3.24.0.1
Schedule of Restatement Items on Consolidated Statement of Operations (Unaudited) (Details) - USD ($)
$ / shares in Units, $ in Millions |
3 Months Ended |
Mar. 31, 2023 |
Mar. 31, 2022 |
| Revenue: |
|
|
|
|
| Total Revenue |
|
$ 64.9
|
|
$ 60.3
|
| Cost of Sales |
|
|
|
|
| Cost of Service |
[1] |
(15.0)
|
|
(16.8)
|
| Cost of Product sales |
|
(6.7)
|
|
(2.5)
|
| Selling, general and administrative expenses |
|
(29.2)
|
|
(23.2)
|
| Acquisition and integration related transaction expenses |
|
|
|
(0.2)
|
| Depreciation and amortization |
|
(9.4)
|
|
(10.7)
|
| Net operating income |
|
4.6
|
|
6.9
|
| Other expense |
|
|
|
|
| Interest expense, net |
|
(6.3)
|
|
(6.5)
|
| Gain on disposal of business |
|
|
|
0.9
|
| Other finance income (expense) |
|
0.1
|
|
0.3
|
| Total other expense, net |
|
(6.2)
|
|
(5.3)
|
| Net income before income taxes |
|
(1.6)
|
|
1.6
|
| Income tax expense |
|
0.2
|
|
(0.1)
|
| Net (loss) income |
|
(1.4)
|
|
1.5
|
| Other comprehensive income: |
|
|
|
|
| Foreign currency translation (loss) gain |
|
(2.9)
|
|
3.5
|
| Reclassification of loss on hedging instrument to comprehensive income |
|
0.2
|
|
0.2
|
| Actuarial gains (losses) on pension plan |
|
0.2
|
|
0.1
|
| Other comprehensive income |
|
(2.5)
|
|
3.8
|
| Comprehensive (loss) income |
|
$ (3.9)
|
|
$ 5.3
|
| Net income (loss) per common share - basic |
|
$ (0.05)
|
|
$ 0.05
|
| Net income (loss) per common share - diluted |
|
$ (0.05)
|
|
$ 0.05
|
| Weighted average number of shares outstanding during the year - basic |
|
27,974,182
|
|
28,437,052
|
| Weighted average number of shares outstanding during the year - diluted |
|
27,974,182
|
|
29,362,382
|
| Stock-based compensation included in: |
|
|
|
|
| Selling, general, and administrative expenses |
|
$ (2.9)
|
|
$ (2.8)
|
| Service [Member] |
|
|
|
|
| Revenue: |
|
|
|
|
| Total Revenue |
|
57.5
|
|
56.0
|
| Product Sales [Member] |
|
|
|
|
| Revenue: |
|
|
|
|
| Total Revenue |
|
7.4
|
|
4.3
|
| Previously Reported [Member] |
|
|
|
|
| Revenue: |
|
|
|
|
| Total Revenue |
|
66.0
|
|
60.6
|
| Cost of Sales |
|
|
|
|
| Cost of Service |
|
(10.9)
|
[2] |
(11.8)
|
| Cost of Product sales |
|
(5.8)
|
|
(2.1)
|
| Selling, general and administrative expenses |
|
(34.3)
|
|
(29.6)
|
| Acquisition and integration related transaction expenses |
|
|
|
(0.1)
|
| Depreciation and amortization |
|
(8.9)
|
|
(10.1)
|
| Net operating income |
|
6.1
|
|
6.9
|
| Other expense |
|
|
|
|
| Interest expense, net |
|
(6.3)
|
|
(6.5)
|
| Gain on disposal of business |
|
|
|
0.9
|
| Other finance income (expense) |
|
0.1
|
|
0.3
|
| Total other expense, net |
|
(6.2)
|
|
(5.3)
|
| Net income before income taxes |
|
(0.1)
|
|
1.6
|
| Income tax expense |
|
(0.1)
|
|
(0.1)
|
| Net (loss) income |
|
(0.2)
|
|
1.5
|
| Other comprehensive income: |
|
|
|
|
| Foreign currency translation (loss) gain |
|
(1.7)
|
|
2.4
|
| Reclassification of loss on hedging instrument to comprehensive income |
|
0.2
|
|
0.2
|
| Actuarial gains (losses) on pension plan |
|
2.0
|
|
0.7
|
| Other comprehensive income |
|
0.5
|
|
3.3
|
| Comprehensive (loss) income |
|
$ 0.3
|
|
$ 4.8
|
| Net income (loss) per common share - basic |
|
$ (0.01)
|
|
$ 0.06
|
| Net income (loss) per common share - diluted |
|
$ (0.01)
|
|
$ 0.05
|
| Weighted average number of shares outstanding during the year - basic |
|
26,155,346
|
|
26,850,326
|
| Weighted average number of shares outstanding during the year - diluted |
|
26,155,346
|
|
29,294,973
|
| Stock-based compensation included in: |
|
|
|
|
| Selling, general, and administrative expenses |
|
$ (2.9)
|
|
|
| Previously Reported [Member] | Service [Member] |
|
|
|
|
| Revenue: |
|
|
|
|
| Total Revenue |
|
58.3
|
|
$ 57.0
|
| Previously Reported [Member] | Product Sales [Member] |
|
|
|
|
| Revenue: |
|
|
|
|
| Total Revenue |
|
7.7
|
|
3.6
|
| Revision of Prior Period, Reclassification, Adjustment [Member] |
|
|
|
|
| Revenue: |
|
|
|
|
| Total Revenue |
|
(1.1)
|
|
(0.3)
|
| Cost of Sales |
|
|
|
|
| Cost of Service |
|
(4.1)
|
[2] |
(5.0)
|
| Cost of Product sales |
|
(0.9)
|
|
(0.4)
|
| Selling, general and administrative expenses |
|
5.1
|
|
6.4
|
| Acquisition and integration related transaction expenses |
|
|
|
(0.1)
|
| Depreciation and amortization |
|
(0.5)
|
|
(0.6)
|
| Net operating income |
|
(1.5)
|
|
|
| Other expense |
|
|
|
|
| Interest expense, net |
|
|
|
|
| Gain on disposal of business |
|
|
|
|
| Other finance income (expense) |
|
|
|
|
| Total other expense, net |
|
|
|
|
| Net income before income taxes |
|
(1.5)
|
|
|
| Income tax expense |
|
0.3
|
|
|
| Net (loss) income |
|
(1.2)
|
|
|
| Other comprehensive income: |
|
|
|
|
| Foreign currency translation (loss) gain |
|
(1.2)
|
|
1.1
|
| Reclassification of loss on hedging instrument to comprehensive income |
|
|
|
|
| Actuarial gains (losses) on pension plan |
|
(1.8)
|
|
(0.6)
|
| Other comprehensive income |
|
(3.0)
|
|
0.5
|
| Comprehensive (loss) income |
|
$ (4.2)
|
|
$ 0.5
|
| Net income (loss) per common share - basic |
|
$ (0.04)
|
|
$ (0.01)
|
| Net income (loss) per common share - diluted |
|
$ (0.04)
|
|
|
| Weighted average number of shares outstanding during the year - basic |
|
1,818,836
|
|
1,586,726
|
| Weighted average number of shares outstanding during the year - diluted |
|
1,818,836
|
|
67,409
|
| Revision of Prior Period, Reclassification, Adjustment [Member] | Service [Member] |
|
|
|
|
| Revenue: |
|
|
|
|
| Total Revenue |
|
$ (0.8)
|
|
$ (1.0)
|
| Revision of Prior Period, Reclassification, Adjustment [Member] | Product Sales [Member] |
|
|
|
|
| Revenue: |
|
|
|
|
| Total Revenue |
|
$ (0.3)
|
|
$ 0.7
|
|
|
| X |
- DefinitionSelling general and administrative expenses.
| Name: |
INSE_SellingGeneralAndAdministrativeExpenses |
| Namespace Prefix: |
INSE_ |
| Data Type: |
xbrli:monetaryItemType |
| Balance Type: |
debit |
| Period Type: |
duration |
|
| X |
- DefinitionStock based compensation included in abstract.
| Name: |
INSE_StockbasedCompensationIncludedInAbstract |
| Namespace Prefix: |
INSE_ |
| Data Type: |
xbrli:stringItemType |
| Balance Type: |
na |
| Period Type: |
duration |
|
| X |
- DefinitionAmount after tax of increase (decrease) in equity from transactions and other events and circumstances from net income and other comprehensive income, attributable to parent entity. Excludes changes in equity resulting from investments by owners and distributions to owners. Reference 1: http://www.xbrl.org/2003/role/disclosureRef
-Topic 220
-SubTopic 10
-Name Accounting Standards Codification
-Section S99
-Paragraph 2
-Subparagraph (SX 210.5-03(24))
-Publisher FASB
-URI https://asc.fasb.org//1943274/2147483621/220-10-S99-2
Reference 2: http://www.xbrl.org/2003/role/disclosureRef
-Topic 942
-SubTopic 220
-Name Accounting Standards Codification
-Section S99
-Paragraph 1
-Subparagraph (SX 210.9-04(26))
-Publisher FASB
-URI https://asc.fasb.org//1943274/2147483589/942-220-S99-1
Reference 3: http://www.xbrl.org/2003/role/disclosureRef
-Topic 944
-SubTopic 220
-Name Accounting Standards Codification
-Section S99
-Paragraph 1
-Subparagraph (SX 210.7-04(22))
-Publisher FASB
-URI https://asc.fasb.org//1943274/2147483586/944-220-S99-1
Reference 4: http://www.xbrl.org/2003/role/disclosureRef
-Topic 220
-SubTopic 10
-Name Accounting Standards Codification
-Section 45
-Paragraph 1A
-Subparagraph (c)
-Publisher FASB
-URI https://asc.fasb.org//1943274/2147482790/220-10-45-1A
Reference 5: http://www.xbrl.org/2003/role/disclosureRef
-Topic 220
-SubTopic 10
-Name Accounting Standards Codification
-Section 45
-Paragraph 1B
-Subparagraph (b)
-Publisher FASB
-URI https://asc.fasb.org//1943274/2147482790/220-10-45-1B
Reference 6: http://fasb.org/us-gaap/role/ref/legacyRef
-Name Accounting Standards Codification
-Topic 220
-SubTopic 10
-Section 45
-Paragraph 5
-Publisher FASB
-URI https://asc.fasb.org//1943274/2147482790/220-10-45-5
| Name: |
us-gaap_ComprehensiveIncomeNetOfTax |
| Namespace Prefix: |
us-gaap_ |
| Data Type: |
xbrli:monetaryItemType |
| Balance Type: |
credit |
| Period Type: |
duration |
|
| X |
- DefinitionThe aggregate costs related to goods produced and sold and services rendered by an entity during the reporting period. This excludes costs incurred during the reporting period related to financial services rendered and other revenue generating activities. Reference 1: http://www.xbrl.org/2003/role/disclosureRef
-Topic 924
-SubTopic 10
-Name Accounting Standards Codification
-Section S99
-Paragraph 1
-Subparagraph (SAB Topic 11.L)
-Publisher FASB
-URI https://asc.fasb.org//1943274/2147479941/924-10-S99-1
Reference 2: http://fasb.org/us-gaap/role/ref/legacyRef
-Topic 220
-SubTopic 10
-Name Accounting Standards Codification
-Section S99
-Paragraph 2
-Subparagraph (SX 210.5-03.2(a),(d))
-Publisher FASB
-URI https://asc.fasb.org//1943274/2147483621/220-10-S99-2
| Name: |
us-gaap_CostOfGoodsAndServicesSold |
| Namespace Prefix: |
us-gaap_ |
| Data Type: |
xbrli:monetaryItemType |
| Balance Type: |
debit |
| Period Type: |
duration |
|
| X |
- References
+ Details
| Name: |
us-gaap_CostOfRevenueAbstract |
| Namespace Prefix: |
us-gaap_ |
| Data Type: |
xbrli:stringItemType |
| Balance Type: |
na |
| Period Type: |
duration |
|
| X |
- DefinitionThe current period expense charged against earnings on long-lived, physical assets not used in production, and which are not intended for resale, to allocate or recognize the cost of such assets over their useful lives; or to record the reduction in book value of an intangible asset over the benefit period of such asset; or to reflect consumption during the period of an asset that is not used in production. Reference 1: http://fasb.org/us-gaap/role/ref/legacyRef
-Name Accounting Standards Codification
-Section 45
-Paragraph 28
-Subparagraph (b)
-SubTopic 10
-Topic 230
-Publisher FASB
-URI https://asc.fasb.org//1943274/2147482740/230-10-45-28
Reference 2: http://fasb.org/us-gaap/role/ref/legacyRef
-Name Accounting Standards Codification
-Topic 360
-SubTopic 10
-Section 50
-Paragraph 1
-Subparagraph (a)
-Publisher FASB
-URI https://asc.fasb.org//1943274/2147482099/360-10-50-1
| Name: |
us-gaap_DepreciationAndAmortization |
| Namespace Prefix: |
us-gaap_ |
| Data Type: |
xbrli:monetaryItemType |
| Balance Type: |
debit |
| Period Type: |
duration |
|
| X |
- DefinitionThe amount of net income (loss) for the period per each share of common stock or unit outstanding during the reporting period. Reference 1: http://www.xbrl.org/2003/role/disclosureRef
-Topic 250
-SubTopic 10
-Name Accounting Standards Codification
-Section 50
-Paragraph 3
-Publisher FASB
-URI https://asc.fasb.org//1943274/2147483443/250-10-50-3
Reference 2: http://www.xbrl.org/2003/role/disclosureRef
-Topic 260
-SubTopic 10
-Name Accounting Standards Codification
-Section 55
-Paragraph 15
-Publisher FASB
-URI https://asc.fasb.org//1943274/2147482635/260-10-55-15
Reference 3: http://www.xbrl.org/2003/role/disclosureRef
-Topic 815
-SubTopic 40
-Name Accounting Standards Codification
-Section 65
-Paragraph 1
-Subparagraph (e)(4)
-Publisher FASB
-URI https://asc.fasb.org//1943274/2147480175/815-40-65-1
Reference 4: http://www.xbrl.org/2003/role/disclosureRef
-Topic 815
-SubTopic 40
-Name Accounting Standards Codification
-Section 65
-Paragraph 1
-Subparagraph (f)
-Publisher FASB
-URI https://asc.fasb.org//1943274/2147480175/815-40-65-1
Reference 5: http://www.xbrl.org/2003/role/disclosureRef
-Topic 250
-SubTopic 10
-Name Accounting Standards Codification
-Section 50
-Paragraph 11
-Subparagraph (a)
-Publisher FASB
-URI https://asc.fasb.org//1943274/2147483443/250-10-50-11
Reference 6: http://www.xbrl.org/2003/role/disclosureRef
-Topic 250
-SubTopic 10
-Name Accounting Standards Codification
-Section 50
-Paragraph 11
-Subparagraph (b)
-Publisher FASB
-URI https://asc.fasb.org//1943274/2147483443/250-10-50-11
Reference 7: http://www.xbrl.org/2003/role/disclosureRef
-Topic 250
-SubTopic 10
-Name Accounting Standards Codification
-Section 50
-Paragraph 7
-Subparagraph (a)
-Publisher FASB
-URI https://asc.fasb.org//1943274/2147483443/250-10-50-7
Reference 8: http://www.xbrl.org/2003/role/disclosureRef
-Topic 260
-SubTopic 10
-Name Accounting Standards Codification
-Section 45
-Paragraph 2
-Publisher FASB
-URI https://asc.fasb.org//1943274/2147482689/260-10-45-2
Reference 9: http://www.xbrl.org/2003/role/disclosureRef
-Topic 260
-SubTopic 10
-Name Accounting Standards Codification
-Section 45
-Paragraph 60B
-Subparagraph (d)
-Publisher FASB
-URI https://asc.fasb.org//1943274/2147482689/260-10-45-60B
Reference 10: http://www.xbrl.org/2003/role/disclosureRef
-Topic 250
-SubTopic 10
-Name Accounting Standards Codification
-Section 50
-Paragraph 4
-Publisher FASB
-URI https://asc.fasb.org//1943274/2147483443/250-10-50-4
Reference 11: http://www.xbrl.org/2003/role/disclosureRef
-Topic 260
-SubTopic 10
-Name Accounting Standards Codification
-Section 50
-Paragraph 1
-Subparagraph (a)
-Publisher FASB
-URI https://asc.fasb.org//1943274/2147482662/260-10-50-1
Reference 12: http://www.xbrl.org/2003/role/disclosureRef
-Topic 260
-SubTopic 10
-Name Accounting Standards Codification
-Section 45
-Paragraph 10
-Publisher FASB
-URI https://asc.fasb.org//1943274/2147482689/260-10-45-10
Reference 13: http://www.xbrl.org/2003/role/disclosureRef
-Topic 220
-SubTopic 10
-Name Accounting Standards Codification
-Section S99
-Paragraph 2
-Subparagraph (SX 210.5-03(25))
-Publisher FASB
-URI https://asc.fasb.org//1943274/2147483621/220-10-S99-2
Reference 14: http://www.xbrl.org/2003/role/disclosureRef
-Topic 942
-SubTopic 220
-Name Accounting Standards Codification
-Section S99
-Paragraph 1
-Subparagraph (SX 210.9-04(27))
-Publisher FASB
-URI https://asc.fasb.org//1943274/2147483589/942-220-S99-1
Reference 15: http://www.xbrl.org/2003/role/disclosureRef
-Topic 944
-SubTopic 220
-Name Accounting Standards Codification
-Section S99
-Paragraph 1
-Subparagraph (SX 210.7-04(23))
-Publisher FASB
-URI https://asc.fasb.org//1943274/2147483586/944-220-S99-1
Reference 16: http://www.xbrl.org/2003/role/exampleRef
-Topic 260
-SubTopic 10
-Name Accounting Standards Codification
-Section 55
-Paragraph 52
-Publisher FASB
-URI https://asc.fasb.org//1943274/2147482635/260-10-55-52
Reference 17: http://www.xbrl.org/2003/role/disclosureRef
-Topic 260
-SubTopic 10
-Name Accounting Standards Codification
-Section 45
-Paragraph 7
-Publisher FASB
-URI https://asc.fasb.org//1943274/2147482689/260-10-45-7
| Name: |
us-gaap_EarningsPerShareBasic |
| Namespace Prefix: |
us-gaap_ |
| Data Type: |
dtr-types:perShareItemType |
| Balance Type: |
na |
| Period Type: |
duration |
|
| X |
- DefinitionThe amount of net income (loss) for the period available to each share of common stock or common unit outstanding during the reporting period and to each share or unit that would have been outstanding assuming the issuance of common shares or units for all dilutive potential common shares or units outstanding during the reporting period. Reference 1: http://www.xbrl.org/2003/role/disclosureRef
-Topic 250
-SubTopic 10
-Name Accounting Standards Codification
-Section 50
-Paragraph 3
-Publisher FASB
-URI https://asc.fasb.org//1943274/2147483443/250-10-50-3
Reference 2: http://www.xbrl.org/2003/role/disclosureRef
-Topic 260
-SubTopic 10
-Name Accounting Standards Codification
-Section 55
-Paragraph 15
-Publisher FASB
-URI https://asc.fasb.org//1943274/2147482635/260-10-55-15
Reference 3: http://www.xbrl.org/2003/role/disclosureRef
-Topic 815
-SubTopic 40
-Name Accounting Standards Codification
-Section 65
-Paragraph 1
-Subparagraph (e)(4)
-Publisher FASB
-URI https://asc.fasb.org//1943274/2147480175/815-40-65-1
Reference 4: http://www.xbrl.org/2003/role/disclosureRef
-Topic 815
-SubTopic 40
-Name Accounting Standards Codification
-Section 65
-Paragraph 1
-Subparagraph (f)
-Publisher FASB
-URI https://asc.fasb.org//1943274/2147480175/815-40-65-1
Reference 5: http://www.xbrl.org/2003/role/disclosureRef
-Topic 250
-SubTopic 10
-Name Accounting Standards Codification
-Section 50
-Paragraph 11
-Subparagraph (a)
-Publisher FASB
-URI https://asc.fasb.org//1943274/2147483443/250-10-50-11
Reference 6: http://www.xbrl.org/2003/role/disclosureRef
-Topic 250
-SubTopic 10
-Name Accounting Standards Codification
-Section 50
-Paragraph 11
-Subparagraph (b)
-Publisher FASB
-URI https://asc.fasb.org//1943274/2147483443/250-10-50-11
Reference 7: http://www.xbrl.org/2003/role/disclosureRef
-Topic 250
-SubTopic 10
-Name Accounting Standards Codification
-Section 50
-Paragraph 7
-Subparagraph (a)
-Publisher FASB
-URI https://asc.fasb.org//1943274/2147483443/250-10-50-7
Reference 8: http://www.xbrl.org/2003/role/disclosureRef
-Topic 260
-SubTopic 10
-Name Accounting Standards Codification
-Section 45
-Paragraph 2
-Publisher FASB
-URI https://asc.fasb.org//1943274/2147482689/260-10-45-2
Reference 9: http://www.xbrl.org/2003/role/disclosureRef
-Topic 260
-SubTopic 10
-Name Accounting Standards Codification
-Section 45
-Paragraph 60B
-Subparagraph (d)
-Publisher FASB
-URI https://asc.fasb.org//1943274/2147482689/260-10-45-60B
Reference 10: http://www.xbrl.org/2003/role/disclosureRef
-Topic 250
-SubTopic 10
-Name Accounting Standards Codification
-Section 50
-Paragraph 4
-Publisher FASB
-URI https://asc.fasb.org//1943274/2147483443/250-10-50-4
Reference 11: http://www.xbrl.org/2003/role/disclosureRef
-Topic 260
-SubTopic 10
-Name Accounting Standards Codification
-Section 50
-Paragraph 1
-Subparagraph (a)
-Publisher FASB
-URI https://asc.fasb.org//1943274/2147482662/260-10-50-1
Reference 12: http://www.xbrl.org/2003/role/disclosureRef
-Topic 220
-SubTopic 10
-Name Accounting Standards Codification
-Section S99
-Paragraph 2
-Subparagraph (SX 210.5-03(25))
-Publisher FASB
-URI https://asc.fasb.org//1943274/2147483621/220-10-S99-2
Reference 13: http://www.xbrl.org/2003/role/disclosureRef
-Topic 942
-SubTopic 220
-Name Accounting Standards Codification
-Section S99
-Paragraph 1
-Subparagraph (SX 210.9-04(27))
-Publisher FASB
-URI https://asc.fasb.org//1943274/2147483589/942-220-S99-1
Reference 14: http://www.xbrl.org/2003/role/disclosureRef
-Topic 944
-SubTopic 220
-Name Accounting Standards Codification
-Section S99
-Paragraph 1
-Subparagraph (SX 210.7-04(23))
-Publisher FASB
-URI https://asc.fasb.org//1943274/2147483586/944-220-S99-1
Reference 15: http://www.xbrl.org/2003/role/exampleRef
-Topic 260
-SubTopic 10
-Name Accounting Standards Codification
-Section 55
-Paragraph 52
-Publisher FASB
-URI https://asc.fasb.org//1943274/2147482635/260-10-55-52
Reference 16: http://www.xbrl.org/2003/role/disclosureRef
-Topic 260
-SubTopic 10
-Name Accounting Standards Codification
-Section 45
-Paragraph 7
-Publisher FASB
-URI https://asc.fasb.org//1943274/2147482689/260-10-45-7
| Name: |
us-gaap_EarningsPerShareDiluted |
| Namespace Prefix: |
us-gaap_ |
| Data Type: |
dtr-types:perShareItemType |
| Balance Type: |
na |
| Period Type: |
duration |
|
| X |
- DefinitionAmount of gain (loss) from sale and disposal of integrated set of activities and assets capable of being conducted and managed for purpose of providing return in form of dividend, lower cost, or other economic benefit to investor, owner, member and participant. Reference 1: http://www.xbrl.org/2009/role/commonPracticeRef
-Topic 230
-SubTopic 10
-Name Accounting Standards Codification
-Section 45
-Paragraph 28
-Subparagraph (b)
-Publisher FASB
-URI https://asc.fasb.org//1943274/2147482740/230-10-45-28
Reference 2: http://www.xbrl.org/2003/role/disclosureRef
-Topic 810
-SubTopic 10
-Name Accounting Standards Codification
-Section 50
-Paragraph 1B
-Subparagraph (a)
-Publisher FASB
-URI https://asc.fasb.org//1943274/2147481203/810-10-50-1B
| Name: |
us-gaap_GainLossOnSaleOfBusiness |
| Namespace Prefix: |
us-gaap_ |
| Data Type: |
xbrli:monetaryItemType |
| Balance Type: |
credit |
| Period Type: |
duration |
|
| X |
- DefinitionThe aggregate total of expenses of managing and administering the affairs of an entity, including affiliates of the reporting entity, which are not directly or indirectly associated with the manufacture, sale or creation of a product or product line. Reference 1: http://www.xbrl.org/2003/role/disclosureRef
-Topic 946
-SubTopic 220
-Name Accounting Standards Codification
-Section S99
-Paragraph 1
-Subparagraph (SX 210.6-07(2)(a))
-Publisher FASB
-URI https://asc.fasb.org//1943274/2147483575/946-220-S99-1
Reference 2: http://fasb.org/us-gaap/role/ref/legacyRef
-Topic 220
-SubTopic 10
-Name Accounting Standards Codification
-Section S99
-Paragraph 2
-Subparagraph (SX 210.5-03.4)
-Publisher FASB
-URI https://asc.fasb.org//1943274/2147483621/220-10-S99-2
| Name: |
us-gaap_GeneralAndAdministrativeExpense |
| Namespace Prefix: |
us-gaap_ |
| Data Type: |
xbrli:monetaryItemType |
| Balance Type: |
debit |
| Period Type: |
duration |
|
| X |
- DefinitionAmount of the cost of borrowed funds accounted for as interest expense. Reference 1: http://www.xbrl.org/2003/role/exampleRef
-Topic 946
-SubTopic 830
-Name Accounting Standards Codification
-Section 55
-Paragraph 10
-Publisher FASB
-URI https://asc.fasb.org//1943274/2147480167/946-830-55-10
Reference 2: http://www.xbrl.org/2009/role/commonPracticeRef
-Topic 946
-SubTopic 220
-Name Accounting Standards Codification
-Section 45
-Paragraph 3
-Subparagraph (i)
-Publisher FASB
-URI https://asc.fasb.org//1943274/2147483581/946-220-45-3
Reference 3: http://www.xbrl.org/2003/role/disclosureRef
-Topic 946
-SubTopic 220
-Name Accounting Standards Codification
-Section S99
-Paragraph 1
-Subparagraph (SX 210.6-07(3))
-Publisher FASB
-URI https://asc.fasb.org//1943274/2147483575/946-220-S99-1
Reference 4: http://www.xbrl.org/2003/role/disclosureRef
-Topic 280
-SubTopic 10
-Name Accounting Standards Codification
-Section 50
-Paragraph 22
-Subparagraph (d)
-Publisher FASB
-URI https://asc.fasb.org//1943274/2147482810/280-10-50-22
Reference 5: http://fasb.org/us-gaap/role/ref/legacyRef
-Name Accounting Standards Codification
-Topic 835
-SubTopic 30
-Section 45
-Paragraph 3
-Publisher FASB
-URI https://asc.fasb.org//1943274/2147482925/835-30-45-3
Reference 6: http://fasb.org/us-gaap/role/ref/legacyRef
-Topic 942
-SubTopic 220
-Name Accounting Standards Codification
-Section S99
-Paragraph 1
-Subparagraph (SX 210.9-04.9)
-Publisher FASB
-URI https://asc.fasb.org//1943274/2147483589/942-220-S99-1
Reference 7: http://www.xbrl.org/2003/role/disclosureRef
-Topic 220
-SubTopic 10
-Name Accounting Standards Codification
-Section S99
-Paragraph 2
-Subparagraph (210.5-03(11))
-Publisher FASB
-URI https://asc.fasb.org//1943274/2147483621/220-10-S99-2
Reference 8: http://www.xbrl.org/2003/role/disclosureRef
-Topic 835
-SubTopic 20
-Name Accounting Standards Codification
-Section 50
-Paragraph 1
-Subparagraph (a)
-Publisher FASB
-URI https://asc.fasb.org//1943274/2147483013/835-20-50-1
| Name: |
us-gaap_InterestExpense |
| Namespace Prefix: |
us-gaap_ |
| Data Type: |
xbrli:monetaryItemType |
| Balance Type: |
debit |
| Period Type: |
duration |
|
| X |
- DefinitionThe portion of profit or loss for the period, net of income taxes, which is attributable to the parent. Reference 1: http://www.xbrl.org/2003/role/disclosureRef
-Topic 235
-SubTopic 10
-Name Accounting Standards Codification
-Section S99
-Paragraph 1
-Subparagraph (SX 210.4-08(g)(1)(ii))
-Publisher FASB
-URI https://asc.fasb.org//1943274/2147480678/235-10-S99-1
Reference 2: http://www.xbrl.org/2003/role/disclosureRef
-Topic 323
-SubTopic 10
-Name Accounting Standards Codification
-Section 50
-Paragraph 3
-Subparagraph (c)
-Publisher FASB
-URI https://asc.fasb.org//1943274/2147481687/323-10-50-3
Reference 3: http://www.xbrl.org/2003/role/disclosureRef
-Topic 825
-SubTopic 10
-Name Accounting Standards Codification
-Section 50
-Paragraph 28
-Subparagraph (f)
-Publisher FASB
-URI https://asc.fasb.org//1943274/2147482907/825-10-50-28
Reference 4: http://www.xbrl.org/2003/role/disclosureRef
-Topic 220
-SubTopic 10
-Name Accounting Standards Codification
-Section 50
-Paragraph 6
-Publisher FASB
-URI https://asc.fasb.org//1943274/2147482765/220-10-50-6
Reference 5: http://www.xbrl.org/2003/role/disclosureRef
-Topic 250
-SubTopic 10
-Name Accounting Standards Codification
-Section 50
-Paragraph 3
-Publisher FASB
-URI https://asc.fasb.org//1943274/2147483443/250-10-50-3
Reference 6: http://www.xbrl.org/2003/role/disclosureRef
-Topic 250
-SubTopic 10
-Name Accounting Standards Codification
-Section 50
-Paragraph 1
-Subparagraph (b)(2)
-Publisher FASB
-URI https://asc.fasb.org//1943274/2147483443/250-10-50-1
Reference 7: http://www.xbrl.org/2003/role/disclosureRef
-Topic 815
-SubTopic 40
-Name Accounting Standards Codification
-Section 65
-Paragraph 1
-Subparagraph (f)
-Publisher FASB
-URI https://asc.fasb.org//1943274/2147480175/815-40-65-1
Reference 8: http://www.xbrl.org/2003/role/disclosureRef
-Topic 250
-SubTopic 10
-Name Accounting Standards Codification
-Section 50
-Paragraph 8
-Publisher FASB
-URI https://asc.fasb.org//1943274/2147483443/250-10-50-8
Reference 9: http://www.xbrl.org/2003/role/disclosureRef
-Topic 250
-SubTopic 10
-Name Accounting Standards Codification
-Section 50
-Paragraph 9
-Publisher FASB
-URI https://asc.fasb.org//1943274/2147483443/250-10-50-9
Reference 10: http://www.xbrl.org/2003/role/disclosureRef
-Topic 250
-SubTopic 10
-Name Accounting Standards Codification
-Section 50
-Paragraph 11
-Subparagraph (a)
-Publisher FASB
-URI https://asc.fasb.org//1943274/2147483443/250-10-50-11
Reference 11: http://www.xbrl.org/2003/role/disclosureRef
-Topic 250
-SubTopic 10
-Name Accounting Standards Codification
-Section 50
-Paragraph 11
-Subparagraph (b)
-Publisher FASB
-URI https://asc.fasb.org//1943274/2147483443/250-10-50-11
Reference 12: http://www.xbrl.org/2003/role/disclosureRef
-Topic 250
-SubTopic 10
-Name Accounting Standards Codification
-Section 50
-Paragraph 4
-Publisher FASB
-URI https://asc.fasb.org//1943274/2147483443/250-10-50-4
Reference 13: http://www.xbrl.org/2003/role/exampleRef
-Topic 946
-SubTopic 830
-Name Accounting Standards Codification
-Section 55
-Paragraph 10
-Publisher FASB
-URI https://asc.fasb.org//1943274/2147480167/946-830-55-10
Reference 14: http://www.xbrl.org/2003/role/disclosureRef
-Topic 946
-SubTopic 220
-Name Accounting Standards Codification
-Section 45
-Paragraph 7
-Publisher FASB
-URI https://asc.fasb.org//1943274/2147483581/946-220-45-7
Reference 15: http://www.xbrl.org/2003/role/disclosureRef
-Topic 944
-SubTopic 220
-Name Accounting Standards Codification
-Section S99
-Paragraph 1
-Subparagraph (SX 210.7-04(18))
-Publisher FASB
-URI https://asc.fasb.org//1943274/2147483586/944-220-S99-1
Reference 16: http://www.xbrl.org/2003/role/disclosureRef
-Topic 280
-SubTopic 10
-Name Accounting Standards Codification
-Section 50
-Paragraph 22
-Publisher FASB
-URI https://asc.fasb.org//1943274/2147482810/280-10-50-22
Reference 17: http://www.xbrl.org/2003/role/disclosureRef
-Topic 946
-SubTopic 220
-Name Accounting Standards Codification
-Section S99
-Paragraph 1
-Subparagraph (SX 210.6-07(9))
-Publisher FASB
-URI https://asc.fasb.org//1943274/2147483575/946-220-S99-1
Reference 18: http://www.xbrl.org/2003/role/disclosureRef
-Topic 946
-SubTopic 220
-Name Accounting Standards Codification
-Section S99
-Paragraph 3
-Subparagraph (SX 210.6-09(1)(d))
-Publisher FASB
-URI https://asc.fasb.org//1943274/2147483575/946-220-S99-3
Reference 19: http://www.xbrl.org/2003/role/disclosureRef
-Topic 470
-SubTopic 10
-Name Accounting Standards Codification
-Section S99
-Paragraph 1A
-Subparagraph (SX 210.13-01(a)(4)(i))
-Publisher FASB
-URI https://asc.fasb.org//1943274/2147480097/470-10-S99-1A
Reference 20: http://www.xbrl.org/2009/role/commonPracticeRef
-Topic 470
-SubTopic 10
-Name Accounting Standards Codification
-Section S99
-Paragraph 1A
-Subparagraph (SX 210.13-01(a)(4)(ii))
-Publisher FASB
-URI https://asc.fasb.org//1943274/2147480097/470-10-S99-1A
Reference 21: http://www.xbrl.org/2003/role/disclosureRef
-Topic 470
-SubTopic 10
-Name Accounting Standards Codification
-Section S99
-Paragraph 1A
-Subparagraph (SX 210.13-01(a)(4)(iii)(A))
-Publisher FASB
-URI https://asc.fasb.org//1943274/2147480097/470-10-S99-1A
Reference 22: http://www.xbrl.org/2003/role/disclosureRef
-Topic 470
-SubTopic 10
-Name Accounting Standards Codification
-Section S99
-Paragraph 1A
-Subparagraph (SX 210.13-01(a)(4)(iv))
-Publisher FASB
-URI https://asc.fasb.org//1943274/2147480097/470-10-S99-1A
Reference 23: http://www.xbrl.org/2003/role/disclosureRef
-Topic 470
-SubTopic 10
-Name Accounting Standards Codification
-Section S99
-Paragraph 1A
-Subparagraph (SX 210.13-01(a)(5))
-Publisher FASB
-URI https://asc.fasb.org//1943274/2147480097/470-10-S99-1A
Reference 24: http://www.xbrl.org/2003/role/disclosureRef
-Topic 470
-SubTopic 10
-Name Accounting Standards Codification
-Section S99
-Paragraph 1B
-Subparagraph (SX 210.13-02(a)(4)(i))
-Publisher FASB
-URI https://asc.fasb.org//1943274/2147480097/470-10-S99-1B
Reference 25: http://www.xbrl.org/2003/role/disclosureRef
-Topic 470
-SubTopic 10
-Name Accounting Standards Codification
-Section S99
-Paragraph 1B
-Subparagraph (SX 210.13-02(a)(4)(iii)(A))
-Publisher FASB
-URI https://asc.fasb.org//1943274/2147480097/470-10-S99-1B
Reference 26: http://www.xbrl.org/2003/role/disclosureRef
-Topic 470
-SubTopic 10
-Name Accounting Standards Codification
-Section S99
-Paragraph 1B
-Subparagraph (SX 210.13-02(a)(4)(iii)(B))
-Publisher FASB
-URI https://asc.fasb.org//1943274/2147480097/470-10-S99-1B
Reference 27: http://www.xbrl.org/2003/role/disclosureRef
-Topic 470
-SubTopic 10
-Name Accounting Standards Codification
-Section S99
-Paragraph 1B
-Subparagraph (SX 210.13-02(a)(4)(iv))
-Publisher FASB
-URI https://asc.fasb.org//1943274/2147480097/470-10-S99-1B
Reference 28: http://www.xbrl.org/2003/role/disclosureRef
-Topic 470
-SubTopic 10
-Name Accounting Standards Codification
-Section S99
-Paragraph 1B
-Subparagraph (SX 210.13-02(a)(5))
-Publisher FASB
-URI https://asc.fasb.org//1943274/2147480097/470-10-S99-1B
Reference 29: http://www.xbrl.org/2003/role/disclosureRef
-Topic 280
-SubTopic 10
-Name Accounting Standards Codification
-Section 50
-Paragraph 30
-Subparagraph (b)
-Publisher FASB
-URI https://asc.fasb.org//1943274/2147482810/280-10-50-30
Reference 30: http://www.xbrl.org/2003/role/disclosureRef
-Topic 280
-SubTopic 10
-Name Accounting Standards Codification
-Section 50
-Paragraph 32
-Subparagraph (f)
-Publisher FASB
-URI https://asc.fasb.org//1943274/2147482810/280-10-50-32
Reference 31: http://www.xbrl.org/2003/role/disclosureRef
-Topic 260
-SubTopic 10
-Name Accounting Standards Codification
-Section 45
-Paragraph 60B
-Subparagraph (a)
-Publisher FASB
-URI https://asc.fasb.org//1943274/2147482689/260-10-45-60B
Reference 32: http://www.xbrl.org/2003/role/exampleRef
-Topic 280
-SubTopic 10
-Name Accounting Standards Codification
-Section 50
-Paragraph 31
-Publisher FASB
-URI https://asc.fasb.org//1943274/2147482810/280-10-50-31
Reference 33: http://www.xbrl.org/2003/role/disclosureRef
-Topic 280
-SubTopic 10
-Name Accounting Standards Codification
-Section 50
-Paragraph 32
-Subparagraph (c)
-Publisher FASB
-URI https://asc.fasb.org//1943274/2147482810/280-10-50-32
Reference 34: http://www.xbrl.org/2003/role/disclosureRef
-Topic 205
-SubTopic 20
-Name Accounting Standards Codification
-Section 50
-Paragraph 7
-Publisher FASB
-URI https://asc.fasb.org//1943274/2147483499/205-20-50-7
Reference 35: http://fasb.org/us-gaap/role/ref/legacyRef
-Topic 230
-SubTopic 10
-Name Accounting Standards Codification
-Section 45
-Paragraph 28
-Publisher FASB
-URI https://asc.fasb.org//1943274/2147482740/230-10-45-28
Reference 36: http://www.xbrl.org/2003/role/disclosureRef
-Topic 220
-SubTopic 10
-Name Accounting Standards Codification
-Section 45
-Paragraph 1A
-Subparagraph (a)
-Publisher FASB
-URI https://asc.fasb.org//1943274/2147482790/220-10-45-1A
Reference 37: http://www.xbrl.org/2003/role/disclosureRef
-Topic 220
-SubTopic 10
-Name Accounting Standards Codification
-Section 45
-Paragraph 1B
-Subparagraph (a)
-Publisher FASB
-URI https://asc.fasb.org//1943274/2147482790/220-10-45-1B
Reference 38: http://fasb.org/us-gaap/role/ref/legacyRef
-Topic 220
-SubTopic 10
-Name Accounting Standards Codification
-Section S99
-Paragraph 2
-Subparagraph (SX 210.5-03(20))
-Publisher FASB
-URI https://asc.fasb.org//1943274/2147483621/220-10-S99-2
Reference 39: http://fasb.org/us-gaap/role/ref/legacyRef
-Topic 942
-SubTopic 220
-Name Accounting Standards Codification
-Section S99
-Paragraph 1
-Subparagraph (SX 210.9-04(22))
-Publisher FASB
-URI https://asc.fasb.org//1943274/2147483589/942-220-S99-1
| Name: |
us-gaap_NetIncomeLoss |
| Namespace Prefix: |
us-gaap_ |
| Data Type: |
xbrli:monetaryItemType |
| Balance Type: |
credit |
| Period Type: |
duration |
|
| X |
- DefinitionThe aggregate amount of income or expense from ancillary business-related activities (that is to say, excluding major activities considered part of the normal operations of the business). Reference 1: http://fasb.org/us-gaap/role/ref/legacyRef
-Topic 220
-SubTopic 10
-Name Accounting Standards Codification
-Section S99
-Paragraph 2
-Subparagraph (SX 210.5-03.7)
-Publisher FASB
-URI https://asc.fasb.org//1943274/2147483621/220-10-S99-2
| Name: |
us-gaap_NonoperatingIncomeExpense |
| Namespace Prefix: |
us-gaap_ |
| Data Type: |
xbrli:monetaryItemType |
| Balance Type: |
credit |
| Period Type: |
duration |
|
| X |
- References
+ Details
| Name: |
us-gaap_NonoperatingIncomeExpenseAbstract |
| Namespace Prefix: |
us-gaap_ |
| Data Type: |
xbrli:stringItemType |
| Balance Type: |
na |
| Period Type: |
duration |
|
| X |
- DefinitionThe net result for the period of deducting operating expenses from operating revenues. Reference 1: http://www.xbrl.org/2003/role/disclosureRef
-Topic 280
-SubTopic 10
-Name Accounting Standards Codification
-Section 50
-Paragraph 22
-Publisher FASB
-URI https://asc.fasb.org//1943274/2147482810/280-10-50-22
Reference 2: http://www.xbrl.org/2003/role/disclosureRef
-Topic 280
-SubTopic 10
-Name Accounting Standards Codification
-Section 50
-Paragraph 30
-Subparagraph (b)
-Publisher FASB
-URI https://asc.fasb.org//1943274/2147482810/280-10-50-30
Reference 3: http://www.xbrl.org/2003/role/disclosureRef
-Topic 280
-SubTopic 10
-Name Accounting Standards Codification
-Section 50
-Paragraph 32
-Subparagraph (f)
-Publisher FASB
-URI https://asc.fasb.org//1943274/2147482810/280-10-50-32
Reference 4: http://www.xbrl.org/2003/role/exampleRef
-Topic 280
-SubTopic 10
-Name Accounting Standards Codification
-Section 50
-Paragraph 31
-Publisher FASB
-URI https://asc.fasb.org//1943274/2147482810/280-10-50-31
Reference 5: http://www.xbrl.org/2003/role/disclosureRef
-Topic 280
-SubTopic 10
-Name Accounting Standards Codification
-Section 50
-Paragraph 32
-Subparagraph (c)
-Publisher FASB
-URI https://asc.fasb.org//1943274/2147482810/280-10-50-32
| Name: |
us-gaap_OperatingIncomeLoss |
| Namespace Prefix: |
us-gaap_ |
| Data Type: |
xbrli:monetaryItemType |
| Balance Type: |
credit |
| Period Type: |
duration |
|
| X |
- DefinitionAmount after tax and reclassification adjustments of gain (loss) on foreign currency translation adjustments, foreign currency transactions designated and effective as economic hedges of a net investment in a foreign entity and intra-entity foreign currency transactions that are of a long-term-investment nature, attributable to parent entity. Reference 1: http://fasb.org/us-gaap/role/ref/legacyRef
-Topic 810
-SubTopic 10
-Name Accounting Standards Codification
-Section 45
-Paragraph 19
-Publisher FASB
-URI https://asc.fasb.org//1943274/2147481231/810-10-45-19
Reference 2: http://fasb.org/us-gaap/role/ref/legacyRef
-Name Accounting Standards Codification
-Section 45
-Paragraph 20
-SubTopic 10
-Topic 810
-Publisher FASB
-URI https://asc.fasb.org//1943274/2147481231/810-10-45-20
Reference 3: http://fasb.org/us-gaap/role/ref/legacyRef
-Name Accounting Standards Codification
-Section 50
-Paragraph 1A
-Subparagraph (c)(3)
-SubTopic 10
-Topic 810
-Publisher FASB
-URI https://asc.fasb.org//1943274/2147481203/810-10-50-1A
| Name: |
us-gaap_OtherComprehensiveIncomeForeignCurrencyTransactionAndTranslationAdjustmentNetOfTaxPortionAttributableToParent |
| Namespace Prefix: |
us-gaap_ |
| Data Type: |
xbrli:monetaryItemType |
| Balance Type: |
credit |
| Period Type: |
duration |
|
| X |
- DefinitionAmount of tax expense (benefit) for reclassification of gain (loss) from accumulated other comprehensive income (AOCI) for derivative instrument designated and qualifying as cash flow hedge included in assessment of hedge effectiveness. Reference 1: http://www.xbrl.org/2003/role/disclosureRef
-Topic 220
-SubTopic 10
-Name Accounting Standards Codification
-Section 45
-Paragraph 12
-Publisher FASB
-URI https://asc.fasb.org//1943274/2147482790/220-10-45-12
| Name: |
us-gaap_OtherComprehensiveIncomeLossCashFlowHedgeGainLossReclassificationTax |
| Namespace Prefix: |
us-gaap_ |
| Data Type: |
xbrli:monetaryItemType |
| Balance Type: |
credit |
| Period Type: |
duration |
|
| X |
- DefinitionAmount after tax and reclassification adjustments of other comprehensive income (loss). Reference 1: http://fasb.org/us-gaap/role/ref/legacyRef
-Name Accounting Standards Codification
-Section 50
-Paragraph 2
-SubTopic 10
-Topic 505
-Publisher FASB
-URI https://asc.fasb.org//1943274/2147481112/505-10-50-2
Reference 2: http://www.xbrl.org/2003/role/disclosureRef
-Topic 830
-SubTopic 30
-Name Accounting Standards Codification
-Section 50
-Paragraph 1
-Publisher FASB
-URI https://asc.fasb.org//1943274/2147481674/830-30-50-1
Reference 3: http://www.xbrl.org/2003/role/disclosureRef
-Topic 830
-SubTopic 30
-Name Accounting Standards Codification
-Section 45
-Paragraph 17
-Publisher FASB
-URI https://asc.fasb.org//1943274/2147481694/830-30-45-17
Reference 4: http://www.xbrl.org/2003/role/disclosureRef
-Topic 944
-SubTopic 220
-Name Accounting Standards Codification
-Section S99
-Paragraph 1
-Subparagraph (SX 210.7-04(19))
-Publisher FASB
-URI https://asc.fasb.org//1943274/2147483586/944-220-S99-1
Reference 5: http://www.xbrl.org/2009/role/commonPracticeRef
-Topic 220
-SubTopic 10
-Name Accounting Standards Codification
-Section 50
-Paragraph 4
-Publisher FASB
-URI https://asc.fasb.org//1943274/2147482765/220-10-50-4
Reference 6: http://www.xbrl.org/2009/role/commonPracticeRef
-Topic 220
-SubTopic 10
-Name Accounting Standards Codification
-Section 50
-Paragraph 5
-Publisher FASB
-URI https://asc.fasb.org//1943274/2147482765/220-10-50-5
Reference 7: http://www.xbrl.org/2003/role/disclosureRef
-Topic 830
-SubTopic 30
-Name Accounting Standards Codification
-Section 45
-Paragraph 20
-Publisher FASB
-URI https://asc.fasb.org//1943274/2147481694/830-30-45-20
Reference 8: http://www.xbrl.org/2003/role/disclosureRef
-Topic 220
-SubTopic 10
-Name Accounting Standards Codification
-Section S99
-Paragraph 2
-Subparagraph (SX 210.5-03(21))
-Publisher FASB
-URI https://asc.fasb.org//1943274/2147483621/220-10-S99-2
Reference 9: http://www.xbrl.org/2003/role/disclosureRef
-Topic 942
-SubTopic 220
-Name Accounting Standards Codification
-Section S99
-Paragraph 1
-Subparagraph (SX 210.9-04(23))
-Publisher FASB
-URI https://asc.fasb.org//1943274/2147483589/942-220-S99-1
Reference 10: http://www.xbrl.org/2003/role/disclosureRef
-Topic 220
-SubTopic 10
-Name Accounting Standards Codification
-Section 45
-Paragraph 1B
-Subparagraph (b)
-Publisher FASB
-URI https://asc.fasb.org//1943274/2147482790/220-10-45-1B
Reference 11: http://fasb.org/us-gaap/role/ref/legacyRef
-Name Accounting Standards Codification
-Section 55
-Paragraph 15
-SubTopic 10
-Topic 220
-Publisher FASB
-URI https://asc.fasb.org//1943274/2147482739/220-10-55-15
Reference 12: http://www.xbrl.org/2003/role/disclosureRef
-Topic 220
-SubTopic 10
-Name Accounting Standards Codification
-Section 45
-Paragraph 1A
-Subparagraph (b)
-Publisher FASB
-URI https://asc.fasb.org//1943274/2147482790/220-10-45-1A
| Name: |
us-gaap_OtherComprehensiveIncomeLossNetOfTax |
| Namespace Prefix: |
us-gaap_ |
| Data Type: |
xbrli:monetaryItemType |
| Balance Type: |
credit |
| Period Type: |
duration |
|
| X |
- References
+ Details
| Name: |
us-gaap_OtherComprehensiveIncomeLossNetOfTaxPortionAttributableToParentAbstract |
| Namespace Prefix: |
us-gaap_ |
| Data Type: |
xbrli:stringItemType |
| Balance Type: |
na |
| Period Type: |
duration |
|
| X |
- DefinitionAmount, after tax, of reclassification adjustment from accumulated other comprehensive (income) loss for net periodic benefit cost (credit) of defined benefit plan. Reference 1: http://fasb.org/us-gaap/role/ref/legacyRef
-Name Accounting Standards Codification
-Section 45
-Paragraph 15
-SubTopic 10
-Topic 220
-Publisher FASB
-URI https://asc.fasb.org//1943274/2147482790/220-10-45-15
Reference 2: http://fasb.org/us-gaap/role/ref/legacyRef
-Topic 220
-SubTopic 10
-Name Accounting Standards Codification
-Section 45
-Paragraph 11
-Publisher FASB
-URI https://asc.fasb.org//1943274/2147482790/220-10-45-11
Reference 3: http://fasb.org/us-gaap/role/ref/legacyRef
-Topic 715
-SubTopic 20
-Name Accounting Standards Codification
-Section 50
-Paragraph 1
-Subparagraph (i)
-Publisher FASB
-URI https://asc.fasb.org//1943274/2147480506/715-20-50-1
Reference 4: http://www.xbrl.org/2003/role/disclosureRef
-Topic 220
-SubTopic 10
-Name Accounting Standards Codification
-Section 45
-Paragraph 17A
-Publisher FASB
-URI https://asc.fasb.org//1943274/2147482790/220-10-45-17A
| Name: |
us-gaap_OtherComprehensiveIncomeLossReclassificationAdjustmentFromAOCIPensionAndOtherPostretirementBenefitPlansNetOfTax |
| Namespace Prefix: |
us-gaap_ |
| Data Type: |
xbrli:monetaryItemType |
| Balance Type: |
credit |
| Period Type: |
duration |
|
| X |
- DefinitionAmount of income (expense) related to nonoperating activities, classified as other. Reference 1: http://fasb.org/us-gaap/role/ref/legacyRef
-Topic 220
-SubTopic 10
-Name Accounting Standards Codification
-Section S99
-Paragraph 2
-Subparagraph (SX 210.5-03.9)
-Publisher FASB
-URI https://asc.fasb.org//1943274/2147483621/220-10-S99-2
| Name: |
us-gaap_OtherNonoperatingIncomeExpense |
| Namespace Prefix: |
us-gaap_ |
| Data Type: |
xbrli:monetaryItemType |
| Balance Type: |
credit |
| Period Type: |
duration |
|
| X |
- DefinitionAmount, excluding tax collected from customer, of revenue from satisfaction of performance obligation by transferring promised good or service to customer. Tax collected from customer is tax assessed by governmental authority that is both imposed on and concurrent with specific revenue-producing transaction, including, but not limited to, sales, use, value added and excise. Reference 1: http://www.xbrl.org/2003/role/disclosureRef
-Topic 924
-SubTopic 10
-Name Accounting Standards Codification
-Section S99
-Paragraph 1
-Subparagraph (SAB Topic 11.L)
-Publisher FASB
-URI https://asc.fasb.org//1943274/2147479941/924-10-S99-1
Reference 2: http://www.xbrl.org/2003/role/disclosureRef
-Topic 606
-SubTopic 10
-Name Accounting Standards Codification
-Section 50
-Paragraph 5
-Publisher FASB
-URI https://asc.fasb.org//1943274/2147479806/606-10-50-5
Reference 3: http://www.xbrl.org/2003/role/disclosureRef
-Topic 280
-SubTopic 10
-Name Accounting Standards Codification
-Section 50
-Paragraph 30
-Subparagraph (a)
-Publisher FASB
-URI https://asc.fasb.org//1943274/2147482810/280-10-50-30
Reference 4: http://www.xbrl.org/2003/role/disclosureRef
-Topic 280
-SubTopic 10
-Name Accounting Standards Codification
-Section 50
-Paragraph 42
-Publisher FASB
-URI https://asc.fasb.org//1943274/2147482810/280-10-50-42
Reference 5: http://www.xbrl.org/2003/role/disclosureRef
-Topic 280
-SubTopic 10
-Name Accounting Standards Codification
-Section 50
-Paragraph 22
-Subparagraph (b)
-Publisher FASB
-URI https://asc.fasb.org//1943274/2147482810/280-10-50-22
Reference 6: http://www.xbrl.org/2003/role/disclosureRef
-Topic 280
-SubTopic 10
-Name Accounting Standards Codification
-Section 50
-Paragraph 32
-Subparagraph (b)
-Publisher FASB
-URI https://asc.fasb.org//1943274/2147482810/280-10-50-32
Reference 7: http://www.xbrl.org/2003/role/disclosureRef
-Topic 280
-SubTopic 10
-Name Accounting Standards Codification
-Section 50
-Paragraph 40
-Publisher FASB
-URI https://asc.fasb.org//1943274/2147482810/280-10-50-40
Reference 8: http://www.xbrl.org/2003/role/disclosureRef
-Topic 280
-SubTopic 10
-Name Accounting Standards Codification
-Section 50
-Paragraph 22
-Subparagraph (a)
-Publisher FASB
-URI https://asc.fasb.org//1943274/2147482810/280-10-50-22
Reference 9: http://www.xbrl.org/2003/role/disclosureRef
-Topic 280
-SubTopic 10
-Name Accounting Standards Codification
-Section 50
-Paragraph 32
-Subparagraph (a)
-Publisher FASB
-URI https://asc.fasb.org//1943274/2147482810/280-10-50-32
Reference 10: http://www.xbrl.org/2003/role/disclosureRef
-Topic 280
-SubTopic 10
-Name Accounting Standards Codification
-Section 50
-Paragraph 41
-Subparagraph (a)
-Publisher FASB
-URI https://asc.fasb.org//1943274/2147482810/280-10-50-41
Reference 11: http://www.xbrl.org/2003/role/disclosureRef
-Topic 606
-SubTopic 10
-Name Accounting Standards Codification
-Section 50
-Paragraph 4
-Subparagraph (a)
-Publisher FASB
-URI https://asc.fasb.org//1943274/2147479806/606-10-50-4
| Name: |
us-gaap_RevenueFromContractWithCustomerExcludingAssessedTax |
| Namespace Prefix: |
us-gaap_ |
| Data Type: |
xbrli:monetaryItemType |
| Balance Type: |
credit |
| Period Type: |
duration |
|
| X |
- References
+ Details
| Name: |
us-gaap_RevenuesAbstract |
| Namespace Prefix: |
us-gaap_ |
| Data Type: |
xbrli:stringItemType |
| Balance Type: |
na |
| Period Type: |
duration |
|
| X |
- DefinitionThe average number of shares or units issued and outstanding that are used in calculating diluted EPS or earnings per unit (EPU), determined based on the timing of issuance of shares or units in the period. Reference 1: http://www.xbrl.org/2003/role/disclosureRef
-Topic 260
-SubTopic 10
-Name Accounting Standards Codification
-Section 50
-Paragraph 1
-Subparagraph (a)
-Publisher FASB
-URI https://asc.fasb.org//1943274/2147482662/260-10-50-1
Reference 2: http://www.xbrl.org/2003/role/disclosureRef
-Topic 260
-SubTopic 10
-Name Accounting Standards Codification
-Section 45
-Paragraph 16
-Publisher FASB
-URI https://asc.fasb.org//1943274/2147482689/260-10-45-16
| Name: |
us-gaap_WeightedAverageNumberOfDilutedSharesOutstanding |
| Namespace Prefix: |
us-gaap_ |
| Data Type: |
xbrli:sharesItemType |
| Balance Type: |
na |
| Period Type: |
duration |
|
| X |
- DefinitionNumber of [basic] shares or units, after adjustment for contingently issuable shares or units and other shares or units not deemed outstanding, determined by relating the portion of time within a reporting period that common shares or units have been outstanding to the total time in that period. Reference 1: http://www.xbrl.org/2003/role/disclosureRef
-Topic 260
-SubTopic 10
-Name Accounting Standards Codification
-Section 50
-Paragraph 1
-Subparagraph (a)
-Publisher FASB
-URI https://asc.fasb.org//1943274/2147482662/260-10-50-1
Reference 2: http://www.xbrl.org/2003/role/disclosureRef
-Topic 260
-SubTopic 10
-Name Accounting Standards Codification
-Section 45
-Paragraph 10
-Publisher FASB
-URI https://asc.fasb.org//1943274/2147482689/260-10-45-10
| Name: |
us-gaap_WeightedAverageNumberOfSharesOutstandingBasic |
| Namespace Prefix: |
us-gaap_ |
| Data Type: |
xbrli:sharesItemType |
| Balance Type: |
na |
| Period Type: |
duration |
|
| X |
- Details
| Name: |
srt_ProductOrServiceAxis=us-gaap_ServiceMember |
| Namespace Prefix: |
|
| Data Type: |
na |
| Balance Type: |
|
| Period Type: |
|
|
| X |
- Details
| Name: |
srt_ProductOrServiceAxis=INSE_ProductSalesMember |
| Namespace Prefix: |
|
| Data Type: |
na |
| Balance Type: |
|
| Period Type: |
|
|
| X |
- Details
| Name: |
srt_RestatementAxis=srt_ScenarioPreviouslyReportedMember |
| Namespace Prefix: |
|
| Data Type: |
na |
| Balance Type: |
|
| Period Type: |
|
|
| X |
- Details
| Name: |
srt_RestatementAxis=srt_RevisionOfPriorPeriodReclassificationAdjustmentMember |
| Namespace Prefix: |
|
| Data Type: |
na |
| Balance Type: |
|
| Period Type: |
|
|
v3.24.0.1
Schedule of Restatement Items on Consolidated Statements of Stockholders' Equity (Deficit) (Details) - USD ($)
$ in Millions |
Mar. 31, 2023 |
Dec. 31, 2022 |
Mar. 31, 2022 |
Dec. 31, 2021 |
| New Accounting Pronouncements or Change in Accounting Principle [Line Items] |
|
|
|
|
| Balance |
$ (86.5)
|
$ (85.6)
|
$ (100.7)
|
$ (108.7)
|
| Common Stock [Member] |
|
|
|
|
| New Accounting Pronouncements or Change in Accounting Principle [Line Items] |
|
|
|
|
| Balance |
|
|
|
|
| Shares, Outstanding |
26,263,070
|
25,909,516
|
26,880,622
|
26,433,562
|
| Additional Paid-in Capital [Member] |
|
|
|
|
| New Accounting Pronouncements or Change in Accounting Principle [Line Items] |
|
|
|
|
| Balance |
$ 381.2
|
$ 378.2
|
$ 375.0
|
$ 372.3
|
| AOCI Attributable to Parent [Member] |
|
|
|
|
| New Accounting Pronouncements or Change in Accounting Principle [Line Items] |
|
|
|
|
| Balance |
48.3
|
50.8
|
47.6
|
43.8
|
| Retained Earnings [Member] |
|
|
|
|
| New Accounting Pronouncements or Change in Accounting Principle [Line Items] |
|
|
|
|
| Balance |
(516.0)
|
$ (514.6)
|
(523.3)
|
$ (524.8)
|
| Previously Reported [Member] |
|
|
|
|
| New Accounting Pronouncements or Change in Accounting Principle [Line Items] |
|
|
|
|
| Balance |
(54.4)
|
|
(70.5)
|
|
| Previously Reported [Member] | Common Stock [Member] |
|
|
|
|
| New Accounting Pronouncements or Change in Accounting Principle [Line Items] |
|
|
|
|
| Balance |
|
|
|
|
| Shares, Outstanding |
26,263,070
|
|
26,880,622
|
|
| Previously Reported [Member] | Additional Paid-in Capital [Member] |
|
|
|
|
| New Accounting Pronouncements or Change in Accounting Principle [Line Items] |
|
|
|
|
| Balance |
$ 381.2
|
|
$ 375.0
|
|
| Previously Reported [Member] | AOCI Attributable to Parent [Member] |
|
|
|
|
| New Accounting Pronouncements or Change in Accounting Principle [Line Items] |
|
|
|
|
| Balance |
46.8
|
|
47.1
|
|
| Previously Reported [Member] | Retained Earnings [Member] |
|
|
|
|
| New Accounting Pronouncements or Change in Accounting Principle [Line Items] |
|
|
|
|
| Balance |
(482.4)
|
|
(492.6)
|
|
| Previous Revision [Member] |
|
|
|
|
| New Accounting Pronouncements or Change in Accounting Principle [Line Items] |
|
|
|
|
| Balance |
(1.0)
|
|
|
|
| Previous Revision [Member] | Common Stock [Member] |
|
|
|
|
| New Accounting Pronouncements or Change in Accounting Principle [Line Items] |
|
|
|
|
| Balance |
|
|
|
|
| Previous Revision [Member] | Additional Paid-in Capital [Member] |
|
|
|
|
| New Accounting Pronouncements or Change in Accounting Principle [Line Items] |
|
|
|
|
| Balance |
|
|
|
|
| Previous Revision [Member] | AOCI Attributable to Parent [Member] |
|
|
|
|
| New Accounting Pronouncements or Change in Accounting Principle [Line Items] |
|
|
|
|
| Balance |
|
|
|
|
| Previous Revision [Member] | Retained Earnings [Member] |
|
|
|
|
| New Accounting Pronouncements or Change in Accounting Principle [Line Items] |
|
|
|
|
| Balance |
(1.0)
|
|
|
|
| Revision of Prior Period, Reclassification, Adjustment [Member] |
|
|
|
|
| New Accounting Pronouncements or Change in Accounting Principle [Line Items] |
|
|
|
|
| Balance |
(31.1)
|
|
(30.2)
|
|
| Revision of Prior Period, Reclassification, Adjustment [Member] | Common Stock [Member] |
|
|
|
|
| New Accounting Pronouncements or Change in Accounting Principle [Line Items] |
|
|
|
|
| Balance |
|
|
|
|
| Revision of Prior Period, Reclassification, Adjustment [Member] | Additional Paid-in Capital [Member] |
|
|
|
|
| New Accounting Pronouncements or Change in Accounting Principle [Line Items] |
|
|
|
|
| Balance |
|
|
|
|
| Revision of Prior Period, Reclassification, Adjustment [Member] | AOCI Attributable to Parent [Member] |
|
|
|
|
| New Accounting Pronouncements or Change in Accounting Principle [Line Items] |
|
|
|
|
| Balance |
1.5
|
|
0.5
|
|
| Revision of Prior Period, Reclassification, Adjustment [Member] | Retained Earnings [Member] |
|
|
|
|
| New Accounting Pronouncements or Change in Accounting Principle [Line Items] |
|
|
|
|
| Balance |
$ (32.6)
|
|
$ (30.7)
|
|
| X |
- DefinitionLine items represent financial concepts included in a table. These concepts are used to disclose reportable information associated with domain members defined in one or many axes to the table. Reference 1: http://www.xbrl.org/2003/role/disclosureRef
-Topic 405
-SubTopic 50
-Name Accounting Standards Codification
-Section 65
-Paragraph 1
-Subparagraph (a)
-Publisher FASB
-URI https://asc.fasb.org//1943274/2147477123/405-50-65-1
Reference 2: http://www.xbrl.org/2003/role/disclosureRef
-Topic 820
-SubTopic 10
-Name Accounting Standards Codification
-Section 65
-Paragraph 13
-Subparagraph (a)
-Publisher FASB
-URI https://asc.fasb.org//1943274/2147482477/820-10-65-13
Reference 3: http://www.xbrl.org/2003/role/disclosureRef
-Topic 820
-SubTopic 10
-Name Accounting Standards Codification
-Section 65
-Paragraph 13
-Subparagraph (b)
-Publisher FASB
-URI https://asc.fasb.org//1943274/2147482477/820-10-65-13
Reference 4: http://www.xbrl.org/2003/role/disclosureRef
-Topic 326
-SubTopic 10
-Name Accounting Standards Codification
-Section 65
-Paragraph 5
-Subparagraph (a)
-Publisher FASB
-URI https://asc.fasb.org//1943274/2147479654/326-10-65-5
Reference 5: http://www.xbrl.org/2003/role/disclosureRef
-Topic 326
-SubTopic 10
-Name Accounting Standards Codification
-Section 65
-Paragraph 5
-Subparagraph (b)
-Publisher FASB
-URI https://asc.fasb.org//1943274/2147479654/326-10-65-5
Reference 6: http://www.xbrl.org/2003/role/disclosureRef
-Topic 326
-SubTopic 10
-Name Accounting Standards Codification
-Section 65
-Paragraph 5
-Subparagraph (b)(1)
-Publisher FASB
-URI https://asc.fasb.org//1943274/2147479654/326-10-65-5
Reference 7: http://www.xbrl.org/2003/role/disclosureRef
-Topic 326
-SubTopic 10
-Name Accounting Standards Codification
-Section 65
-Paragraph 5
-Subparagraph (c)(2)
-Publisher FASB
-URI https://asc.fasb.org//1943274/2147479654/326-10-65-5
Reference 8: http://www.xbrl.org/2003/role/disclosureRef
-Topic 815
-SubTopic 20
-Name Accounting Standards Codification
-Section 65
-Paragraph 6
-Subparagraph (a)
-Publisher FASB
-URI https://asc.fasb.org//1943274/2147480528/815-20-65-6
Reference 9: http://www.xbrl.org/2003/role/disclosureRef
-Topic 815
-SubTopic 20
-Name Accounting Standards Codification
-Section 65
-Paragraph 6
-Subparagraph (b)
-Publisher FASB
-URI https://asc.fasb.org//1943274/2147480528/815-20-65-6
Reference 10: http://www.xbrl.org/2003/role/disclosureRef
-Topic 815
-SubTopic 20
-Name Accounting Standards Codification
-Section 65
-Paragraph 6
-Subparagraph (c)
-Publisher FASB
-URI https://asc.fasb.org//1943274/2147480528/815-20-65-6
Reference 11: http://www.xbrl.org/2003/role/disclosureRef
-Topic 815
-SubTopic 20
-Name Accounting Standards Codification
-Section 65
-Paragraph 6
-Subparagraph (e)
-Publisher FASB
-URI https://asc.fasb.org//1943274/2147480528/815-20-65-6
Reference 12: http://www.xbrl.org/2003/role/disclosureRef
-Topic 815
-SubTopic 20
-Name Accounting Standards Codification
-Section 65
-Paragraph 6
-Subparagraph (f)
-Publisher FASB
-URI https://asc.fasb.org//1943274/2147480528/815-20-65-6
Reference 13: http://www.xbrl.org/2003/role/disclosureRef
-Topic 815
-SubTopic 20
-Name Accounting Standards Codification
-Section 65
-Paragraph 6
-Subparagraph (h)(1)
-Publisher FASB
-URI https://asc.fasb.org//1943274/2147480528/815-20-65-6
Reference 14: http://www.xbrl.org/2003/role/disclosureRef
-Topic 815
-SubTopic 20
-Name Accounting Standards Codification
-Section 65
-Paragraph 6
-Subparagraph (h)(1)(i)
-Publisher FASB
-URI https://asc.fasb.org//1943274/2147480528/815-20-65-6
Reference 15: http://www.xbrl.org/2003/role/disclosureRef
-Topic 815
-SubTopic 20
-Name Accounting Standards Codification
-Section 65
-Paragraph 6
-Subparagraph (h)(1)(iii)
-Publisher FASB
-URI https://asc.fasb.org//1943274/2147480528/815-20-65-6
Reference 16: http://www.xbrl.org/2003/role/disclosureRef
-Topic 815
-SubTopic 20
-Name Accounting Standards Codification
-Section 65
-Paragraph 6
-Subparagraph (h)(1)(iv)
-Publisher FASB
-URI https://asc.fasb.org//1943274/2147480528/815-20-65-6
Reference 17: http://www.xbrl.org/2003/role/disclosureRef
-Topic 815
-SubTopic 20
-Name Accounting Standards Codification
-Section 65
-Paragraph 6
-Subparagraph (i)(2)
-Publisher FASB
-URI https://asc.fasb.org//1943274/2147480528/815-20-65-6
Reference 18: http://www.xbrl.org/2003/role/disclosureRef
-Topic 815
-SubTopic 20
-Name Accounting Standards Codification
-Section 65
-Paragraph 6
-Subparagraph (i)(3)
-Publisher FASB
-URI https://asc.fasb.org//1943274/2147480528/815-20-65-6
Reference 19: http://www.xbrl.org/2003/role/disclosureRef
-Topic 832
-SubTopic 10
-Name Accounting Standards Codification
-Section 65
-Paragraph 1
-Subparagraph (a)
-Publisher FASB
-URI https://asc.fasb.org//1943274/2147483482/832-10-65-1
Reference 20: http://www.xbrl.org/2003/role/disclosureRef
-Topic 832
-SubTopic 10
-Name Accounting Standards Codification
-Section 65
-Paragraph 1
-Subparagraph (b)
-Publisher FASB
-URI https://asc.fasb.org//1943274/2147483482/832-10-65-1
Reference 21: http://www.xbrl.org/2003/role/disclosureRef
-Topic 805
-SubTopic 20
-Name Accounting Standards Codification
-Section 65
-Paragraph 3
-Subparagraph (a)
-Publisher FASB
-URI https://asc.fasb.org//1943274/2147479845/805-20-65-3
Reference 22: http://www.xbrl.org/2003/role/disclosureRef
-Topic 805
-SubTopic 20
-Name Accounting Standards Codification
-Section 65
-Paragraph 3
-Subparagraph (b)
-Publisher FASB
-URI https://asc.fasb.org//1943274/2147479845/805-20-65-3
Reference 23: http://www.xbrl.org/2003/role/disclosureRef
-Topic 805
-SubTopic 20
-Name Accounting Standards Codification
-Section 65
-Paragraph 3
-Subparagraph (d)
-Publisher FASB
-URI https://asc.fasb.org//1943274/2147479845/805-20-65-3
Reference 24: http://www.xbrl.org/2003/role/disclosureRef
-Topic 842
-SubTopic 10
-Name Accounting Standards Codification
-Section 65
-Paragraph 5
-Subparagraph (a)
-Publisher FASB
-URI https://asc.fasb.org//1943274/2147479832/842-10-65-5
Reference 25: http://www.xbrl.org/2003/role/disclosureRef
-Topic 842
-SubTopic 10
-Name Accounting Standards Codification
-Section 65
-Paragraph 5
-Subparagraph (b)
-Publisher FASB
-URI https://asc.fasb.org//1943274/2147479832/842-10-65-5
Reference 26: http://www.xbrl.org/2003/role/disclosureRef
-Topic 842
-SubTopic 10
-Name Accounting Standards Codification
-Section 65
-Paragraph 5
-Subparagraph (c)
-Publisher FASB
-URI https://asc.fasb.org//1943274/2147479832/842-10-65-5
Reference 27: http://www.xbrl.org/2003/role/disclosureRef
-Topic 842
-SubTopic 10
-Name Accounting Standards Codification
-Section 65
-Paragraph 5
-Subparagraph (d)(1)
-Publisher FASB
-URI https://asc.fasb.org//1943274/2147479832/842-10-65-5
Reference 28: http://www.xbrl.org/2003/role/disclosureRef
-Topic 815
-SubTopic 40
-Name Accounting Standards Codification
-Section 65
-Paragraph 2
-Subparagraph (a)
-Publisher FASB
-URI https://asc.fasb.org//1943274/2147480175/815-40-65-2
Reference 29: http://www.xbrl.org/2003/role/disclosureRef
-Topic 848
-SubTopic 10
-Name Accounting Standards Codification
-Section 65
-Paragraph 2
-Subparagraph (a)
-Publisher FASB
-URI https://asc.fasb.org//1943274/2147483550/848-10-65-2
Reference 30: http://www.xbrl.org/2003/role/disclosureRef
-Topic 848
-SubTopic 10
-Name Accounting Standards Codification
-Section 65
-Paragraph 2
-Subparagraph (a)(1)
-Publisher FASB
-URI https://asc.fasb.org//1943274/2147483550/848-10-65-2
Reference 31: http://www.xbrl.org/2003/role/disclosureRef
-Topic 848
-SubTopic 10
-Name Accounting Standards Codification
-Section 65
-Paragraph 2
-Subparagraph (a)(2)
-Publisher FASB
-URI https://asc.fasb.org//1943274/2147483550/848-10-65-2
Reference 32: http://www.xbrl.org/2003/role/disclosureRef
-Topic 848
-SubTopic 10
-Name Accounting Standards Codification
-Section 65
-Paragraph 2
-Subparagraph (a)(3)(iii)(01)
-Publisher FASB
-URI https://asc.fasb.org//1943274/2147483550/848-10-65-2
Reference 33: http://www.xbrl.org/2003/role/disclosureRef
-Topic 848
-SubTopic 10
-Name Accounting Standards Codification
-Section 65
-Paragraph 2
-Subparagraph (a)(3)(iii)(03)
-Publisher FASB
-URI https://asc.fasb.org//1943274/2147483550/848-10-65-2
Reference 34: http://www.xbrl.org/2003/role/disclosureRef
-Topic 105
-SubTopic 10
-Name Accounting Standards Codification
-Section 65
-Paragraph 6
-Subparagraph (a)
-Publisher FASB
-URI https://asc.fasb.org//1943274/2147479343/105-10-65-6
Reference 35: http://www.xbrl.org/2003/role/disclosureRef
-Topic 105
-SubTopic 10
-Name Accounting Standards Codification
-Section 65
-Paragraph 6
-Subparagraph (b)
-Publisher FASB
-URI https://asc.fasb.org//1943274/2147479343/105-10-65-6
Reference 36: http://www.xbrl.org/2003/role/disclosureRef
-Topic 105
-SubTopic 10
-Name Accounting Standards Codification
-Section 65
-Paragraph 6
-Subparagraph (c)
-Publisher FASB
-URI https://asc.fasb.org//1943274/2147479343/105-10-65-6
Reference 37: http://www.xbrl.org/2003/role/disclosureRef
-Topic 105
-SubTopic 10
-Name Accounting Standards Codification
-Section 65
-Paragraph 6
-Subparagraph (d)
-Publisher FASB
-URI https://asc.fasb.org//1943274/2147479343/105-10-65-6
Reference 38: http://www.xbrl.org/2003/role/disclosureRef
-Topic 105
-SubTopic 10
-Name Accounting Standards Codification
-Section 65
-Paragraph 6
-Subparagraph (e)
-Publisher FASB
-URI https://asc.fasb.org//1943274/2147479343/105-10-65-6
Reference 39: http://www.xbrl.org/2003/role/disclosureRef
-Topic 944
-SubTopic 40
-Name Accounting Standards Codification
-Section 65
-Paragraph 2
-Subparagraph (a)
-Publisher FASB
-URI https://asc.fasb.org//1943274/2147480016/944-40-65-2
Reference 40: http://www.xbrl.org/2003/role/disclosureRef
-Topic 944
-SubTopic 40
-Name Accounting Standards Codification
-Section 65
-Paragraph 2
-Subparagraph (b)
-Publisher FASB
-URI https://asc.fasb.org//1943274/2147480016/944-40-65-2
Reference 41: http://www.xbrl.org/2003/role/disclosureRef
-Topic 944
-SubTopic 40
-Name Accounting Standards Codification
-Section 65
-Paragraph 2
-Subparagraph (e)
-Publisher FASB
-URI https://asc.fasb.org//1943274/2147480016/944-40-65-2
Reference 42: http://www.xbrl.org/2003/role/disclosureRef
-Topic 944
-SubTopic 40
-Name Accounting Standards Codification
-Section 65
-Paragraph 2
-Subparagraph (f)(1)
-Publisher FASB
-URI https://asc.fasb.org//1943274/2147480016/944-40-65-2
Reference 43: http://www.xbrl.org/2003/role/disclosureRef
-Topic 944
-SubTopic 40
-Name Accounting Standards Codification
-Section 65
-Paragraph 2
-Subparagraph (f)(2)
-Publisher FASB
-URI https://asc.fasb.org//1943274/2147480016/944-40-65-2
Reference 44: http://www.xbrl.org/2003/role/disclosureRef
-Topic 944
-SubTopic 40
-Name Accounting Standards Codification
-Section 65
-Paragraph 2
-Subparagraph (g)(1)
-Publisher FASB
-URI https://asc.fasb.org//1943274/2147480016/944-40-65-2
Reference 45: http://www.xbrl.org/2003/role/disclosureRef
-Topic 944
-SubTopic 40
-Name Accounting Standards Codification
-Section 65
-Paragraph 2
-Subparagraph (g)(2)(i)
-Publisher FASB
-URI https://asc.fasb.org//1943274/2147480016/944-40-65-2
Reference 46: http://www.xbrl.org/2003/role/disclosureRef
-Topic 944
-SubTopic 40
-Name Accounting Standards Codification
-Section 65
-Paragraph 2
-Subparagraph (g)(2)(ii)
-Publisher FASB
-URI https://asc.fasb.org//1943274/2147480016/944-40-65-2
Reference 47: http://www.xbrl.org/2003/role/disclosureRef
-Topic 944
-SubTopic 40
-Name Accounting Standards Codification
-Section 65
-Paragraph 2
-Subparagraph (g)(2)(iii)
-Publisher FASB
-URI https://asc.fasb.org//1943274/2147480016/944-40-65-2
Reference 48: http://www.xbrl.org/2003/role/disclosureRef
-Topic 944
-SubTopic 40
-Name Accounting Standards Codification
-Section 65
-Paragraph 2
-Subparagraph (g)(2)(iv)
-Publisher FASB
-URI https://asc.fasb.org//1943274/2147480016/944-40-65-2
Reference 49: http://www.xbrl.org/2003/role/disclosureRef
-Topic 944
-SubTopic 40
-Name Accounting Standards Codification
-Section 65
-Paragraph 2
-Subparagraph (h)(1)
-Publisher FASB
-URI https://asc.fasb.org//1943274/2147480016/944-40-65-2
Reference 50: http://www.xbrl.org/2003/role/disclosureRef
-Topic 944
-SubTopic 40
-Name Accounting Standards Codification
-Section 65
-Paragraph 2
-Subparagraph (h)(2)
-Publisher FASB
-URI https://asc.fasb.org//1943274/2147480016/944-40-65-2
Reference 51: http://www.xbrl.org/2003/role/disclosureRef
-Topic 250
-SubTopic 10
-Name Accounting Standards Codification
-Section S99
-Paragraph 5
-Subparagraph (SAB Topic 11.M.Q2)
-Publisher FASB
-URI https://asc.fasb.org//1943274/2147480530/250-10-S99-5
Reference 52: http://www.xbrl.org/2003/role/disclosureRef
-Topic 326
-SubTopic 10
-Name Accounting Standards Codification
-Section 65
-Paragraph 4
-Subparagraph (a)
-Publisher FASB
-URI https://asc.fasb.org//1943274/2147479654/326-10-65-4
Reference 53: http://www.xbrl.org/2003/role/disclosureRef
-Topic 326
-SubTopic 10
-Name Accounting Standards Codification
-Section 65
-Paragraph 4
-Subparagraph (b)
-Publisher FASB
-URI https://asc.fasb.org//1943274/2147479654/326-10-65-4
Reference 54: http://www.xbrl.org/2003/role/disclosureRef
-Topic 326
-SubTopic 10
-Name Accounting Standards Codification
-Section 65
-Paragraph 4
-Subparagraph (c)
-Publisher FASB
-URI https://asc.fasb.org//1943274/2147479654/326-10-65-4
Reference 55: http://www.xbrl.org/2003/role/disclosureRef
-Topic 740
-SubTopic 10
-Name Accounting Standards Codification
-Section 65
-Paragraph 8
-Subparagraph (a)
-Publisher FASB
-URI https://asc.fasb.org//1943274/2147482615/740-10-65-8
Reference 56: http://www.xbrl.org/2003/role/disclosureRef
-Topic 740
-SubTopic 10
-Name Accounting Standards Codification
-Section 65
-Paragraph 8
-Subparagraph (b)
-Publisher FASB
-URI https://asc.fasb.org//1943274/2147482615/740-10-65-8
Reference 57: http://www.xbrl.org/2003/role/disclosureRef
-Topic 740
-SubTopic 10
-Name Accounting Standards Codification
-Section 65
-Paragraph 8
-Subparagraph (d)(2)
-Publisher FASB
-URI https://asc.fasb.org//1943274/2147482615/740-10-65-8
Reference 58: http://www.xbrl.org/2003/role/disclosureRef
-Topic 740
-SubTopic 10
-Name Accounting Standards Codification
-Section 65
-Paragraph 8
-Subparagraph (d)(3)
-Publisher FASB
-URI https://asc.fasb.org//1943274/2147482615/740-10-65-8
Reference 59: http://www.xbrl.org/2003/role/disclosureRef
-Topic 326
-SubTopic 10
-Name Accounting Standards Codification
-Section 65
-Paragraph 4
-Subparagraph (d)
-Publisher FASB
-URI https://asc.fasb.org//1943274/2147479654/326-10-65-4
Reference 60: http://www.xbrl.org/2003/role/disclosureRef
-Topic 326
-SubTopic 10
-Name Accounting Standards Codification
-Section 65
-Paragraph 4
-Subparagraph (e)(3)
-Publisher FASB
-URI https://asc.fasb.org//1943274/2147479654/326-10-65-4
Reference 61: http://www.xbrl.org/2003/role/disclosureRef
-Topic 326
-SubTopic 10
-Name Accounting Standards Codification
-Section 65
-Paragraph 4
-Subparagraph (e)(4)
-Publisher FASB
-URI https://asc.fasb.org//1943274/2147479654/326-10-65-4
Reference 62: http://www.xbrl.org/2003/role/disclosureRef
-Topic 718
-SubTopic 10
-Name Accounting Standards Codification
-Section 65
-Paragraph 15
-Subparagraph (e)
-Publisher FASB
-URI https://asc.fasb.org//1943274/2147480336/718-10-65-15
Reference 63: http://www.xbrl.org/2003/role/disclosureRef
-Topic 718
-SubTopic 10
-Name Accounting Standards Codification
-Section 65
-Paragraph 15
-Subparagraph (f)(1)
-Publisher FASB
-URI https://asc.fasb.org//1943274/2147480336/718-10-65-15
Reference 64: http://www.xbrl.org/2003/role/disclosureRef
-Topic 718
-SubTopic 10
-Name Accounting Standards Codification
-Section 65
-Paragraph 15
-Subparagraph (f)(2)
-Publisher FASB
-URI https://asc.fasb.org//1943274/2147480336/718-10-65-15
Reference 65: http://www.xbrl.org/2003/role/disclosureRef
-Topic 926
-SubTopic 20
-Name Accounting Standards Codification
-Section 65
-Paragraph 2
-Subparagraph (a)
-Publisher FASB
-URI https://asc.fasb.org//1943274/2147483194/926-20-65-2
Reference 66: http://www.xbrl.org/2003/role/disclosureRef
-Topic 926
-SubTopic 20
-Name Accounting Standards Codification
-Section 65
-Paragraph 2
-Subparagraph (b)
-Publisher FASB
-URI https://asc.fasb.org//1943274/2147483194/926-20-65-2
Reference 67: http://www.xbrl.org/2003/role/disclosureRef
-Topic 926
-SubTopic 20
-Name Accounting Standards Codification
-Section 65
-Paragraph 2
-Subparagraph (c)
-Publisher FASB
-URI https://asc.fasb.org//1943274/2147483194/926-20-65-2
Reference 68: http://www.xbrl.org/2003/role/disclosureRef
-Topic 250
-SubTopic 10
-Name Accounting Standards Codification
-Section 50
-Paragraph 3
-Publisher FASB
-URI https://asc.fasb.org//1943274/2147483443/250-10-50-3
Reference 69: http://www.xbrl.org/2003/role/disclosureRef
-Topic 250
-SubTopic 10
-Name Accounting Standards Codification
-Section 50
-Paragraph 1
-Subparagraph (b)(2)
-Publisher FASB
-URI https://asc.fasb.org//1943274/2147483443/250-10-50-1
Reference 70: http://www.xbrl.org/2003/role/disclosureRef
-Topic 250
-SubTopic 10
-Name Accounting Standards Codification
-Section 50
-Paragraph 1
-Subparagraph (b)(3)
-Publisher FASB
-URI https://asc.fasb.org//1943274/2147483443/250-10-50-1
Reference 71: http://www.xbrl.org/2003/role/disclosureRef
-Topic 250
-SubTopic 10
-Name Accounting Standards Codification
-Section 50
-Paragraph 1
-Subparagraph (b)(4)
-Publisher FASB
-URI https://asc.fasb.org//1943274/2147483443/250-10-50-1
Reference 72: http://www.xbrl.org/2003/role/disclosureRef
-Topic 250
-SubTopic 10
-Name Accounting Standards Codification
-Section 50
-Paragraph 1
-Subparagraph (c)(2)
-Publisher FASB
-URI https://asc.fasb.org//1943274/2147483443/250-10-50-1
Reference 73: http://www.xbrl.org/2003/role/disclosureRef
-Topic 260
-SubTopic 10
-Name Accounting Standards Codification
-Section 55
-Paragraph 15
-Publisher FASB
-URI https://asc.fasb.org//1943274/2147482635/260-10-55-15
Reference 74: http://www.xbrl.org/2003/role/disclosureRef
-Topic 250
-SubTopic 10
-Name Accounting Standards Codification
-Section 45
-Paragraph 6
-Publisher FASB
-URI https://asc.fasb.org//1943274/2147483421/250-10-45-6
Reference 75: http://www.xbrl.org/2003/role/disclosureRef
-Topic 825
-SubTopic 10
-Name Accounting Standards Codification
-Section 65
-Paragraph 6
-Subparagraph (a)
-Publisher FASB
-URI https://asc.fasb.org//1943274/2147482833/825-10-65-6
Reference 76: http://www.xbrl.org/2003/role/disclosureRef
-Topic 825
-SubTopic 10
-Name Accounting Standards Codification
-Section 65
-Paragraph 6
-Subparagraph (b)
-Publisher FASB
-URI https://asc.fasb.org//1943274/2147482833/825-10-65-6
Reference 77: http://www.xbrl.org/2003/role/disclosureRef
-Topic 825
-SubTopic 10
-Name Accounting Standards Codification
-Section 65
-Paragraph 6
-Subparagraph (c)(1)
-Publisher FASB
-URI https://asc.fasb.org//1943274/2147482833/825-10-65-6
Reference 78: http://www.xbrl.org/2003/role/disclosureRef
-Topic 825
-SubTopic 10
-Name Accounting Standards Codification
-Section 65
-Paragraph 6
-Subparagraph (c)(2)
-Publisher FASB
-URI https://asc.fasb.org//1943274/2147482833/825-10-65-6
Reference 79: http://www.xbrl.org/2003/role/disclosureRef
-Topic 815
-SubTopic 40
-Name Accounting Standards Codification
-Section 65
-Paragraph 1
-Subparagraph (a)(1)
-Publisher FASB
-URI https://asc.fasb.org//1943274/2147480175/815-40-65-1
Reference 80: http://www.xbrl.org/2003/role/disclosureRef
-Topic 815
-SubTopic 40
-Name Accounting Standards Codification
-Section 65
-Paragraph 1
-Subparagraph (a)(2)
-Publisher FASB
-URI https://asc.fasb.org//1943274/2147480175/815-40-65-1
Reference 81: http://www.xbrl.org/2003/role/disclosureRef
-Topic 815
-SubTopic 40
-Name Accounting Standards Codification
-Section 65
-Paragraph 1
-Subparagraph (a)(3)
-Publisher FASB
-URI https://asc.fasb.org//1943274/2147480175/815-40-65-1
Reference 82: http://www.xbrl.org/2003/role/disclosureRef
-Topic 815
-SubTopic 40
-Name Accounting Standards Codification
-Section 65
-Paragraph 1
-Subparagraph (b)(1)
-Publisher FASB
-URI https://asc.fasb.org//1943274/2147480175/815-40-65-1
Reference 83: http://www.xbrl.org/2003/role/disclosureRef
-Topic 815
-SubTopic 40
-Name Accounting Standards Codification
-Section 65
-Paragraph 1
-Subparagraph (b)(2)
-Publisher FASB
-URI https://asc.fasb.org//1943274/2147480175/815-40-65-1
Reference 84: http://www.xbrl.org/2003/role/disclosureRef
-Topic 815
-SubTopic 40
-Name Accounting Standards Codification
-Section 65
-Paragraph 1
-Subparagraph (c)
-Publisher FASB
-URI https://asc.fasb.org//1943274/2147480175/815-40-65-1
Reference 85: http://www.xbrl.org/2003/role/disclosureRef
-Topic 815
-SubTopic 40
-Name Accounting Standards Codification
-Section 65
-Paragraph 1
-Subparagraph (d)
-Publisher FASB
-URI https://asc.fasb.org//1943274/2147480175/815-40-65-1
Reference 86: http://www.xbrl.org/2003/role/disclosureRef
-Topic 815
-SubTopic 40
-Name Accounting Standards Codification
-Section 65
-Paragraph 1
-Subparagraph (e)(2)
-Publisher FASB
-URI https://asc.fasb.org//1943274/2147480175/815-40-65-1
Reference 87: http://www.xbrl.org/2003/role/disclosureRef
-Topic 815
-SubTopic 40
-Name Accounting Standards Codification
-Section 65
-Paragraph 1
-Subparagraph (e)(3)
-Publisher FASB
-URI https://asc.fasb.org//1943274/2147480175/815-40-65-1
Reference 88: http://www.xbrl.org/2003/role/disclosureRef
-Topic 815
-SubTopic 40
-Name Accounting Standards Codification
-Section 65
-Paragraph 1
-Subparagraph (e)(4)
-Publisher FASB
-URI https://asc.fasb.org//1943274/2147480175/815-40-65-1
Reference 89: http://www.xbrl.org/2003/role/disclosureRef
-Topic 815
-SubTopic 40
-Name Accounting Standards Codification
-Section 65
-Paragraph 1
-Subparagraph (f)
-Publisher FASB
-URI https://asc.fasb.org//1943274/2147480175/815-40-65-1
Reference 90: http://www.xbrl.org/2003/role/disclosureRef
-Topic 310
-SubTopic 20
-Name Accounting Standards Codification
-Section 65
-Paragraph 2
-Subparagraph (a)
-Publisher FASB
-URI https://asc.fasb.org//1943274/2147481925/310-20-65-2
Reference 91: http://www.xbrl.org/2003/role/disclosureRef
-Topic 310
-SubTopic 20
-Name Accounting Standards Codification
-Section 65
-Paragraph 2
-Subparagraph (b)
-Publisher FASB
-URI https://asc.fasb.org//1943274/2147481925/310-20-65-2
Reference 92: http://www.xbrl.org/2003/role/disclosureRef
-Topic 946
-SubTopic 10
-Name Accounting Standards Codification
-Section 50
-Paragraph 3
-Publisher FASB
-URI https://asc.fasb.org//1943274/2147480424/946-10-50-3
| Name: |
us-gaap_NewAccountingPronouncementsOrChangeInAccountingPrincipleLineItems |
| Namespace Prefix: |
us-gaap_ |
| Data Type: |
xbrli:stringItemType |
| Balance Type: |
na |
| Period Type: |
duration |
|
| X |
- DefinitionNumber of shares issued which are neither cancelled nor held in the treasury.
| Name: |
us-gaap_SharesOutstanding |
| Namespace Prefix: |
us-gaap_ |
| Data Type: |
xbrli:sharesItemType |
| Balance Type: |
na |
| Period Type: |
instant |
|
| X |
- DefinitionAmount of equity (deficit) attributable to parent. Excludes temporary equity and equity attributable to noncontrolling interest. Reference 1: http://www.xbrl.org/2003/role/exampleRef
-Topic 852
-SubTopic 10
-Name Accounting Standards Codification
-Section 55
-Paragraph 10
-Publisher FASB
-URI https://asc.fasb.org//1943274/2147481372/852-10-55-10
Reference 2: http://www.xbrl.org/2003/role/exampleRef
-Topic 946
-SubTopic 830
-Name Accounting Standards Codification
-Section 55
-Paragraph 12
-Publisher FASB
-URI https://asc.fasb.org//1943274/2147480167/946-830-55-12
Reference 3: http://www.xbrl.org/2003/role/disclosureRef
-Topic 946
-SubTopic 210
-Name Accounting Standards Codification
-Section S99
-Paragraph 1
-Subparagraph (SX 210.6-04(19))
-Publisher FASB
-URI https://asc.fasb.org//1943274/2147479617/946-210-S99-1
Reference 4: http://www.xbrl.org/2003/role/disclosureRef
-Topic 946
-SubTopic 210
-Name Accounting Standards Codification
-Section S99
-Paragraph 2
-Subparagraph (SX 210.6-05(4))
-Publisher FASB
-URI https://asc.fasb.org//1943274/2147479617/946-210-S99-2
Reference 5: http://www.xbrl.org/2009/role/commonPracticeRef
-Topic 946
-SubTopic 220
-Name Accounting Standards Codification
-Section S99
-Paragraph 3
-Subparagraph (SX 210.6-09(4)(b))
-Publisher FASB
-URI https://asc.fasb.org//1943274/2147483575/946-220-S99-3
Reference 6: http://www.xbrl.org/2003/role/disclosureRef
-Topic 946
-SubTopic 220
-Name Accounting Standards Codification
-Section S99
-Paragraph 3
-Subparagraph (SX 210.6-09(6))
-Publisher FASB
-URI https://asc.fasb.org//1943274/2147483575/946-220-S99-3
Reference 7: http://www.xbrl.org/2003/role/disclosureRef
-Topic 946
-SubTopic 220
-Name Accounting Standards Codification
-Section S99
-Paragraph 3
-Subparagraph (SX 210.6-09(7))
-Publisher FASB
-URI https://asc.fasb.org//1943274/2147483575/946-220-S99-3
Reference 8: http://www.xbrl.org/2009/role/commonPracticeRef
-Topic 235
-SubTopic 10
-Name Accounting Standards Codification
-Section S99
-Paragraph 1
-Subparagraph (SX 210.4-08(g)(1)(ii))
-Publisher FASB
-URI https://asc.fasb.org//1943274/2147480678/235-10-S99-1
Reference 9: http://www.xbrl.org/2009/role/commonPracticeRef
-Topic 323
-SubTopic 10
-Name Accounting Standards Codification
-Section 50
-Paragraph 3
-Subparagraph (c)
-Publisher FASB
-URI https://asc.fasb.org//1943274/2147481687/323-10-50-3
Reference 10: http://www.xbrl.org/2009/role/commonPracticeRef
-Topic 825
-SubTopic 10
-Name Accounting Standards Codification
-Section 50
-Paragraph 28
-Subparagraph (f)
-Publisher FASB
-URI https://asc.fasb.org//1943274/2147482907/825-10-50-28
Reference 11: http://fasb.org/us-gaap/role/ref/legacyRef
-Topic 210
-SubTopic 10
-Name Accounting Standards Codification
-Section S99
-Paragraph 1
-Subparagraph (SX 210.5-02(29))
-Publisher FASB
-URI https://asc.fasb.org//1943274/2147480566/210-10-S99-1
Reference 12: http://fasb.org/us-gaap/role/ref/legacyRef
-Topic 210
-SubTopic 10
-Name Accounting Standards Codification
-Section S99
-Paragraph 1
-Subparagraph (SX 210.5-02(31))
-Publisher FASB
-URI https://asc.fasb.org//1943274/2147480566/210-10-S99-1
Reference 13: http://fasb.org/us-gaap/role/ref/legacyRef
-Topic 210
-SubTopic 10
-Name Accounting Standards Codification
-Section S99
-Paragraph 1
-Subparagraph (SX 210.5-02(30))
-Publisher FASB
-URI https://asc.fasb.org//1943274/2147480566/210-10-S99-1
Reference 14: http://fasb.org/us-gaap/role/ref/legacyRef
-Topic 310
-SubTopic 10
-Name Accounting Standards Codification
-Section S99
-Paragraph 2
-Subparagraph (SAB Topic 4.E)
-Publisher FASB
-URI https://asc.fasb.org//1943274/2147480418/310-10-S99-2
| Name: |
us-gaap_StockholdersEquity |
| Namespace Prefix: |
us-gaap_ |
| Data Type: |
xbrli:monetaryItemType |
| Balance Type: |
credit |
| Period Type: |
instant |
|
| X |
- Details
| Name: |
us-gaap_StatementEquityComponentsAxis=us-gaap_CommonStockMember |
| Namespace Prefix: |
|
| Data Type: |
na |
| Balance Type: |
|
| Period Type: |
|
|
| X |
- Details
| Name: |
us-gaap_StatementEquityComponentsAxis=us-gaap_AdditionalPaidInCapitalMember |
| Namespace Prefix: |
|
| Data Type: |
na |
| Balance Type: |
|
| Period Type: |
|
|
| X |
- Details
| Name: |
us-gaap_StatementEquityComponentsAxis=us-gaap_AccumulatedOtherComprehensiveIncomeMember |
| Namespace Prefix: |
|
| Data Type: |
na |
| Balance Type: |
|
| Period Type: |
|
|
| X |
- Details
| Name: |
us-gaap_StatementEquityComponentsAxis=us-gaap_RetainedEarningsMember |
| Namespace Prefix: |
|
| Data Type: |
na |
| Balance Type: |
|
| Period Type: |
|
|
| X |
- Details
| Name: |
srt_RestatementAxis=srt_ScenarioPreviouslyReportedMember |
| Namespace Prefix: |
|
| Data Type: |
na |
| Balance Type: |
|
| Period Type: |
|
|
| X |
- Details
| Name: |
srt_RestatementAxis=INSE_PreviousRevisionMember |
| Namespace Prefix: |
|
| Data Type: |
na |
| Balance Type: |
|
| Period Type: |
|
|
| X |
- Details
| Name: |
srt_RestatementAxis=srt_RevisionOfPriorPeriodReclassificationAdjustmentMember |
| Namespace Prefix: |
|
| Data Type: |
na |
| Balance Type: |
|
| Period Type: |
|
|
v3.24.0.1
Schedule of Restatement Items on Consolidated Statements of Cashflows (Details) - USD ($)
$ in Millions |
3 Months Ended |
Mar. 31, 2023 |
Mar. 31, 2022 |
| Cash flows from operating activities: |
|
|
| Net income (loss) |
$ (1.4)
|
$ 1.5
|
| Adjustments to reconcile net income (loss) to net cash provided by operating activities: |
|
|
| Depreciation and amortization |
9.4
|
10.7
|
| Amortization of right of use asset |
0.8
|
1.0
|
| Profit on sale of trade and asset |
|
(0.9)
|
| Stock-based compensation expense |
2.9
|
2.8
|
| Contract Cost expense |
(2.6)
|
(1.6)
|
| Reclassification of loss on hedging instrument to comprehensive income |
0.2
|
0.2
|
| Non-cash interest expense relating to senior debt |
0.3
|
0.4
|
| Changes in assets and liabilities: |
|
|
| Accounts receivable |
8.3
|
(2.2)
|
| Inventory |
(3.5)
|
(11.6)
|
| Prepaid expenses and other assets |
1.0
|
|
| Corporate tax and other current taxes payable |
(6.2)
|
(7.2)
|
| Accounts payable |
(2.1)
|
4.2
|
| Deferred revenues and customer prepayment |
(0.2)
|
|
| Accrued expenses |
5.6
|
7.1
|
| Operating lease liabilities |
(0.9)
|
(1.0)
|
| Other long-term liabilities |
|
(0.7)
|
| Net cash provided by operating activities |
11.6
|
2.7
|
| Cash flows from investing activities: |
|
|
| Purchases of property and equipment |
(5.5)
|
(5.6)
|
| Acquisition of subsidiary company assets |
|
(0.6)
|
| Acquisition of third-party company trade and assets |
(0.6)
|
|
| Disposal of trade and assets |
|
1.3
|
| Purchases of capital software |
(2.8)
|
(3.9)
|
| Net cash used in investing activities |
(8.9)
|
(8.8)
|
| Cash flows from financing activities: |
|
|
| Repayments of finance leases |
(0.5)
|
(0.1)
|
| Net cash used in financing activities |
(0.5)
|
(0.1)
|
| Effect of exchange rate changes on cash |
0.6
|
(0.8)
|
| Net increase (decrease) in cash |
2.8
|
(7.0)
|
| Cash, beginning of period |
25.0
|
47.8
|
| Cash, end of period |
27.8
|
40.8
|
| Supplemental cash flow disclosures |
|
|
| Cash paid during the period for interest |
0.1
|
0.2
|
| Cash paid during the period for income taxes |
0.1
|
|
| Cash paid during the period for operating leases |
2.1
|
1.7
|
| Supplemental disclosure of noncash investing and financing activities |
|
|
| Lease liabilities arising from obtaining right of use assets |
(0.1)
|
|
| Property and equipment acquired through finance lease |
|
|
| Property and equipment transferred to inventory |
|
0.6
|
| Previously Reported [Member] |
|
|
| Cash flows from operating activities: |
|
|
| Net income (loss) |
(0.2)
|
1.5
|
| Adjustments to reconcile net income (loss) to net cash provided by operating activities: |
|
|
| Depreciation and amortization |
8.9
|
10.1
|
| Previously Reported [Member] | Accounting Standards Update [Member] |
|
|
| Cash flows from operating activities: |
|
|
| Net income (loss) |
(0.2)
|
1.5
|
| Adjustments to reconcile net income (loss) to net cash provided by operating activities: |
|
|
| Depreciation and amortization |
8.9
|
10.1
|
| Amortization of right of use asset |
0.5
|
0.7
|
| Profit on sale of trade and asset |
|
|
| Stock-based compensation expense |
2.9
|
2.8
|
| Contract Cost expense |
|
|
| Reclassification of loss on hedging instrument to comprehensive income |
0.2
|
0.2
|
| Non-cash interest expense relating to senior debt |
0.3
|
0.4
|
| Changes in assets and liabilities: |
|
|
| Accounts receivable |
8.5
|
(2.1)
|
| Inventory |
(4.6)
|
(11.9)
|
| Prepaid expenses and other assets |
1.6
|
0.9
|
| Corporate tax and other current taxes payable |
(3.8)
|
(7.2)
|
| Accounts payable |
(4.1)
|
4.3
|
| Deferred revenues and customer prepayment |
(0.3)
|
(0.3)
|
| Accrued expenses |
5.5
|
7.1
|
| Operating lease liabilities |
(0.6)
|
(0.7)
|
| Other long-term liabilities |
|
(0.7)
|
| Net cash provided by operating activities |
14.8
|
5.1
|
| Cash flows from investing activities: |
|
|
| Purchases of property and equipment |
(6.1)
|
(5.2)
|
| Acquisition of subsidiary company assets |
|
(0.6)
|
| Acquisition of third-party company trade and assets |
(0.6)
|
|
| Disposal of trade and assets |
|
|
| Purchases of capital software |
(4.8)
|
(5.1)
|
| Net cash used in investing activities |
(11.5)
|
(10.9)
|
| Cash flows from financing activities: |
|
|
| Repayments of finance leases |
(0.5)
|
(0.1)
|
| Net cash used in financing activities |
(0.5)
|
(0.1)
|
| Effect of exchange rate changes on cash |
|
(1.1)
|
| Net increase (decrease) in cash |
2.8
|
(7.0)
|
| Cash, beginning of period |
25.0
|
47.8
|
| Cash, end of period |
27.8
|
40.8
|
| Supplemental cash flow disclosures |
|
|
| Cash paid during the period for interest |
0.1
|
0.2
|
| Cash paid during the period for income taxes |
0.1
|
|
| Cash paid during the period for operating leases |
1.2
|
0.9
|
| Supplemental disclosure of noncash investing and financing activities |
|
|
| Lease liabilities arising from obtaining right of use assets |
(0.1)
|
|
| Property and equipment acquired through finance lease |
|
|
| Property and equipment transferred to inventory |
|
0.6
|
| Previous Revision [Member] | Accounting Standards Update [Member] |
|
|
| Cash flows from operating activities: |
|
|
| Net income (loss) |
|
|
| Adjustments to reconcile net income (loss) to net cash provided by operating activities: |
|
|
| Depreciation and amortization |
|
|
| Amortization of right of use asset |
|
|
| Stock-based compensation expense |
|
|
| Contract Cost expense |
|
|
| Reclassification of loss on hedging instrument to comprehensive income |
|
|
| Non-cash interest expense relating to senior debt |
|
|
| Changes in assets and liabilities: |
|
|
| Accounts receivable |
|
|
| Inventory |
|
|
| Prepaid expenses and other assets |
|
|
| Corporate tax and other current taxes payable |
|
|
| Accounts payable |
|
|
| Deferred revenues and customer prepayment |
|
|
| Accrued expenses |
|
|
| Operating lease liabilities |
|
|
| Other long-term liabilities |
|
|
| Net cash provided by operating activities |
|
|
| Cash flows from investing activities: |
|
|
| Purchases of property and equipment |
|
|
| Acquisition of subsidiary company assets |
|
|
| Acquisition of third-party company trade and assets |
|
|
| Purchases of capital software |
|
|
| Net cash used in investing activities |
|
|
| Cash flows from financing activities: |
|
|
| Repayments of finance leases |
|
|
| Net cash used in financing activities |
|
|
| Effect of exchange rate changes on cash |
|
|
| Net increase (decrease) in cash |
|
|
| Cash, beginning of period |
|
|
| Cash, end of period |
|
|
| Supplemental cash flow disclosures |
|
|
| Cash paid during the period for interest |
|
|
| Cash paid during the period for income taxes |
|
|
| Cash paid during the period for operating leases |
|
|
| Revision of Prior Period, Reclassification, Adjustment [Member] |
|
|
| Cash flows from operating activities: |
|
|
| Net income (loss) |
(1.2)
|
|
| Adjustments to reconcile net income (loss) to net cash provided by operating activities: |
|
|
| Depreciation and amortization |
0.5
|
0.6
|
| Revision of Prior Period, Reclassification, Adjustment [Member] | Accounting Standards Update [Member] |
|
|
| Cash flows from operating activities: |
|
|
| Net income (loss) |
(1.2)
|
|
| Adjustments to reconcile net income (loss) to net cash provided by operating activities: |
|
|
| Depreciation and amortization |
0.5
|
0.6
|
| Amortization of right of use asset |
0.3
|
0.3
|
| Profit on sale of trade and asset |
|
(0.9)
|
| Stock-based compensation expense |
|
|
| Contract Cost expense |
(2.6)
|
(1.6)
|
| Reclassification of loss on hedging instrument to comprehensive income |
|
|
| Non-cash interest expense relating to senior debt |
|
|
| Changes in assets and liabilities: |
|
|
| Accounts receivable |
(0.2)
|
(0.1)
|
| Inventory |
1.1
|
0.3
|
| Prepaid expenses and other assets |
(0.6)
|
(0.9)
|
| Corporate tax and other current taxes payable |
(2.4)
|
|
| Accounts payable |
2.0
|
(0.1)
|
| Deferred revenues and customer prepayment |
0.1
|
0.3
|
| Accrued expenses |
0.1
|
|
| Operating lease liabilities |
(0.3)
|
(0.3)
|
| Other long-term liabilities |
|
|
| Net cash provided by operating activities |
(3.2)
|
(2.4)
|
| Cash flows from investing activities: |
|
|
| Purchases of property and equipment |
0.6
|
(0.4)
|
| Acquisition of subsidiary company assets |
|
|
| Acquisition of third-party company trade and assets |
|
|
| Disposal of trade and assets |
|
1.3
|
| Purchases of capital software |
2.0
|
1.2
|
| Net cash used in investing activities |
2.6
|
2.1
|
| Cash flows from financing activities: |
|
|
| Repayments of finance leases |
|
|
| Net cash used in financing activities |
|
|
| Effect of exchange rate changes on cash |
0.6
|
0.3
|
| Net increase (decrease) in cash |
|
|
| Cash, beginning of period |
0.0
|
|
| Cash, end of period |
0.0
|
|
| Supplemental cash flow disclosures |
|
|
| Cash paid during the period for interest |
|
|
| Cash paid during the period for income taxes |
|
|
| Cash paid during the period for operating leases |
$ 0.9
|
0.8
|
| Supplemental disclosure of noncash investing and financing activities |
|
|
| Property and equipment acquired through finance lease |
|
|
| Property and equipment transferred to inventory |
|
|
| X |
- DefinitionCash paid during the period for operating leases.
| Name: |
INSE_CashPaidDuringPeriodForOperatingLeases |
| Namespace Prefix: |
INSE_ |
| Data Type: |
xbrli:monetaryItemType |
| Balance Type: |
credit |
| Period Type: |
duration |
|
| X |
- DefinitionIncrease decrease in deferred revenues and customer prepayment.
| Name: |
INSE_IncreaseDecreaseInDeferredRevenuesAndCustomerPrepayment |
| Namespace Prefix: |
INSE_ |
| Data Type: |
xbrli:monetaryItemType |
| Balance Type: |
debit |
| Period Type: |
duration |
|
| X |
- DefinitionNon-cash interest expense relating to senior debt.
| Name: |
INSE_NonCashInterestExpenseRelatingToSeniorDebt |
| Namespace Prefix: |
INSE_ |
| Data Type: |
xbrli:monetaryItemType |
| Balance Type: |
debit |
| Period Type: |
duration |
|
| X |
- DefinitionProceeds from sale of other assets.
| Name: |
INSE_ProceedsFromSaleOfOtherAssets |
| Namespace Prefix: |
INSE_ |
| Data Type: |
xbrli:monetaryItemType |
| Balance Type: |
debit |
| Period Type: |
duration |
|
| X |
- DefinitionProperty and equipment acquired through finance lease.
| Name: |
INSE_PropertyAndEquipmentAcquiredThroughFinanceLease |
| Namespace Prefix: |
INSE_ |
| Data Type: |
xbrli:monetaryItemType |
| Balance Type: |
debit |
| Period Type: |
duration |
|
| X |
- DefinitionProperty and equipment transferred to inventory.
| Name: |
INSE_PropertyAndEquipmentTransferredToInventory |
| Namespace Prefix: |
INSE_ |
| Data Type: |
xbrli:monetaryItemType |
| Balance Type: |
debit |
| Period Type: |
duration |
|
| X |
- DefinitionReclassification of gain on hedging instrument to comprehensive income.
| Name: |
INSE_ReclassificationOfGainOnHedgingInstrumentToComprehensiveIncome |
| Namespace Prefix: |
INSE_ |
| Data Type: |
xbrli:monetaryItemType |
| Balance Type: |
debit |
| Period Type: |
duration |
|
| X |
- References
+ Details
| Name: |
us-gaap_AdjustmentsToReconcileNetIncomeLossToCashProvidedByUsedInOperatingActivitiesAbstract |
| Namespace Prefix: |
us-gaap_ |
| Data Type: |
xbrli:stringItemType |
| Balance Type: |
na |
| Period Type: |
duration |
|
| X |
- DefinitionAmount of cash and cash equivalents, and cash and cash equivalents restricted to withdrawal or usage; including, but not limited to, disposal group and discontinued operations. Cash includes, but is not limited to, currency on hand, demand deposits with banks or financial institutions, and other accounts with general characteristics of demand deposits. Cash equivalents include, but are not limited to, short-term, highly liquid investments that are both readily convertible to known amounts of cash and so near their maturity that they present insignificant risk of changes in value because of changes in interest rates. Reference 1: http://www.xbrl.org/2003/role/disclosureRef
-Topic 230
-SubTopic 10
-Name Accounting Standards Codification
-Section 50
-Paragraph 8
-Publisher FASB
-URI https://asc.fasb.org//1943274/2147482913/230-10-50-8
Reference 2: http://fasb.org/us-gaap/role/ref/legacyRef
-Topic 230
-SubTopic 10
-Name Accounting Standards Codification
-Section 45
-Paragraph 24
-Publisher FASB
-URI https://asc.fasb.org//1943274/2147482740/230-10-45-24
Reference 3: http://fasb.org/us-gaap/role/ref/legacyRef
-Name Accounting Standards Codification
-Topic 230
-SubTopic 10
-Section 45
-Paragraph 4
-Publisher FASB
-URI https://asc.fasb.org//1943274/2147482740/230-10-45-4
| Name: |
us-gaap_CashCashEquivalentsRestrictedCashAndRestrictedCashEquivalentsIncludingDisposalGroupAndDiscontinuedOperations |
| Namespace Prefix: |
us-gaap_ |
| Data Type: |
xbrli:monetaryItemType |
| Balance Type: |
debit |
| Period Type: |
instant |
|
| X |
- DefinitionAmount of increase (decrease) in cash, cash equivalents, and cash and cash equivalents restricted to withdrawal or usage; including effect from exchange rate change. Cash includes, but is not limited to, currency on hand, demand deposits with banks or financial institutions, and other accounts with general characteristics of demand deposits. Cash equivalents include, but are not limited to, short-term, highly liquid investments that are both readily convertible to known amounts of cash and so near their maturity that they present insignificant risk of changes in value because of changes in interest rates. Reference 1: http://fasb.org/us-gaap/role/ref/legacyRef
-Topic 230
-SubTopic 10
-Name Accounting Standards Codification
-Section 45
-Paragraph 24
-Publisher FASB
-URI https://asc.fasb.org//1943274/2147482740/230-10-45-24
Reference 2: http://fasb.org/us-gaap/role/ref/legacyRef
-Name Accounting Standards Codification
-Section 45
-Paragraph 1
-SubTopic 230
-Topic 830
-Publisher FASB
-URI https://asc.fasb.org//1943274/2147481877/830-230-45-1
| Name: |
us-gaap_CashCashEquivalentsRestrictedCashAndRestrictedCashEquivalentsPeriodIncreaseDecreaseIncludingExchangeRateEffect |
| Namespace Prefix: |
us-gaap_ |
| Data Type: |
xbrli:monetaryItemType |
| Balance Type: |
debit |
| Period Type: |
duration |
|
| X |
- DefinitionThe current period expense charged against earnings on long-lived, physical assets not used in production, and which are not intended for resale, to allocate or recognize the cost of such assets over their useful lives; or to record the reduction in book value of an intangible asset over the benefit period of such asset; or to reflect consumption during the period of an asset that is not used in production. Reference 1: http://fasb.org/us-gaap/role/ref/legacyRef
-Name Accounting Standards Codification
-Section 45
-Paragraph 28
-Subparagraph (b)
-SubTopic 10
-Topic 230
-Publisher FASB
-URI https://asc.fasb.org//1943274/2147482740/230-10-45-28
Reference 2: http://fasb.org/us-gaap/role/ref/legacyRef
-Name Accounting Standards Codification
-Topic 360
-SubTopic 10
-Section 50
-Paragraph 1
-Subparagraph (a)
-Publisher FASB
-URI https://asc.fasb.org//1943274/2147482099/360-10-50-1
| Name: |
us-gaap_DepreciationAndAmortization |
| Namespace Prefix: |
us-gaap_ |
| Data Type: |
xbrli:monetaryItemType |
| Balance Type: |
debit |
| Period Type: |
duration |
|
| X |
- DefinitionAmount of increase (decrease) from effect of exchange rate changes on cash and cash equivalents, and cash and cash equivalents restricted to withdrawal or usage; held in foreign currencies; including, but not limited to, disposal group and discontinued operations. Cash includes, but is not limited to, currency on hand, demand deposits with banks or financial institutions, and other accounts with general characteristics of demand deposits. Cash equivalents include, but are not limited to, short-term, highly liquid investments that are both readily convertible to known amounts of cash and so near their maturity that they present insignificant risk of changes in value because of changes in interest rates. Reference 1: http://www.xbrl.org/2009/role/commonPracticeRef
-Topic 830
-SubTopic 230
-Name Accounting Standards Codification
-Section 45
-Paragraph 1
-Publisher FASB
-URI https://asc.fasb.org//1943274/2147481877/830-230-45-1
| Name: |
us-gaap_EffectOfExchangeRateOnCashCashEquivalentsRestrictedCashAndRestrictedCashEquivalentsIncludingDisposalGroupAndDiscontinuedOperations |
| Namespace Prefix: |
us-gaap_ |
| Data Type: |
xbrli:monetaryItemType |
| Balance Type: |
debit |
| Period Type: |
duration |
|
| X |
- DefinitionAmount of cash outflow for principal payment on finance lease. Reference 1: http://www.xbrl.org/2003/role/disclosureRef
-Topic 842
-SubTopic 20
-Name Accounting Standards Codification
-Section 50
-Paragraph 4
-Subparagraph (g)(1)
-Publisher FASB
-URI https://asc.fasb.org//1943274/2147478964/842-20-50-4
Reference 2: http://www.xbrl.org/2003/role/disclosureRef
-Topic 842
-SubTopic 20
-Name Accounting Standards Codification
-Section 45
-Paragraph 5
-Subparagraph (a)
-Publisher FASB
-URI https://asc.fasb.org//1943274/2147479041/842-20-45-5
| Name: |
us-gaap_FinanceLeasePrincipalPayments |
| Namespace Prefix: |
us-gaap_ |
| Data Type: |
xbrli:monetaryItemType |
| Balance Type: |
credit |
| Period Type: |
duration |
|
| X |
- DefinitionAmount of gain (loss) on sale or disposal of assets, including but not limited to property plant and equipment, intangible assets and equity in securities of subsidiaries or equity method investee. Reference 1: http://www.xbrl.org/2009/role/commonPracticeRef
-Topic 230
-SubTopic 10
-Name Accounting Standards Codification
-Section 45
-Paragraph 28
-Subparagraph (b)
-Publisher FASB
-URI https://asc.fasb.org//1943274/2147482740/230-10-45-28
| Name: |
us-gaap_GainLossOnDispositionOfAssets1 |
| Namespace Prefix: |
us-gaap_ |
| Data Type: |
xbrli:monetaryItemType |
| Balance Type: |
credit |
| Period Type: |
duration |
|
| X |
- DefinitionThe increase (decrease) during the reporting period in the aggregate amount of liabilities incurred (and for which invoices have typically been received) and payable to vendors for goods and services received that are used in an entity's business. Reference 1: http://fasb.org/us-gaap/role/ref/legacyRef
-Name Accounting Standards Codification
-Section 45
-Paragraph 28
-Subparagraph (a)
-SubTopic 10
-Topic 230
-Publisher FASB
-URI https://asc.fasb.org//1943274/2147482740/230-10-45-28
| Name: |
us-gaap_IncreaseDecreaseInAccountsPayable |
| Namespace Prefix: |
us-gaap_ |
| Data Type: |
xbrli:monetaryItemType |
| Balance Type: |
debit |
| Period Type: |
duration |
|
| X |
- DefinitionThe increase (decrease) during the reporting period in amount due within one year (or one business cycle) from customers for the credit sale of goods and services. Reference 1: http://fasb.org/us-gaap/role/ref/legacyRef
-Name Accounting Standards Codification
-Section 45
-Paragraph 28
-Subparagraph (a)
-SubTopic 10
-Topic 230
-Publisher FASB
-URI https://asc.fasb.org//1943274/2147482740/230-10-45-28
| Name: |
us-gaap_IncreaseDecreaseInAccountsReceivable |
| Namespace Prefix: |
us-gaap_ |
| Data Type: |
xbrli:monetaryItemType |
| Balance Type: |
credit |
| Period Type: |
duration |
|
| X |
- DefinitionThe increase (decrease) during the reporting period in the aggregate amount of expenses incurred but not yet paid. Reference 1: http://fasb.org/us-gaap/role/ref/legacyRef
-Name Accounting Standards Codification
-Section 45
-Paragraph 28
-Subparagraph (a)
-SubTopic 10
-Topic 230
-Publisher FASB
-URI https://asc.fasb.org//1943274/2147482740/230-10-45-28
| Name: |
us-gaap_IncreaseDecreaseInAccruedLiabilities |
| Namespace Prefix: |
us-gaap_ |
| Data Type: |
xbrli:monetaryItemType |
| Balance Type: |
debit |
| Period Type: |
duration |
|
| X |
- DefinitionThe increase (decrease) during the reporting period of all taxes owed but not paid, including income, property and other taxes. Reference 1: http://www.xbrl.org/2009/role/commonPracticeRef
-Topic 230
-SubTopic 10
-Name Accounting Standards Codification
-Section 45
-Paragraph 28
-Subparagraph (a)
-Publisher FASB
-URI https://asc.fasb.org//1943274/2147482740/230-10-45-28
| Name: |
us-gaap_IncreaseDecreaseInAccruedTaxesPayable |
| Namespace Prefix: |
us-gaap_ |
| Data Type: |
xbrli:monetaryItemType |
| Balance Type: |
debit |
| Period Type: |
duration |
|
| X |
- DefinitionThe increase (decrease) during the reporting period in the aggregate value of all inventory held by the reporting entity, associated with underlying transactions that are classified as operating activities. Reference 1: http://fasb.org/us-gaap/role/ref/legacyRef
-Name Accounting Standards Codification
-Section 45
-Paragraph 28
-Subparagraph (a)
-SubTopic 10
-Topic 230
-Publisher FASB
-URI https://asc.fasb.org//1943274/2147482740/230-10-45-28
| Name: |
us-gaap_IncreaseDecreaseInInventories |
| Namespace Prefix: |
us-gaap_ |
| Data Type: |
xbrli:monetaryItemType |
| Balance Type: |
credit |
| Period Type: |
duration |
|
| X |
- References
+ Details
| Name: |
us-gaap_IncreaseDecreaseInOperatingCapitalAbstract |
| Namespace Prefix: |
us-gaap_ |
| Data Type: |
xbrli:stringItemType |
| Balance Type: |
na |
| Period Type: |
duration |
|
| X |
- DefinitionAmount of increase (decrease) in current liabilities classified as other. Reference 1: http://www.xbrl.org/2009/role/commonPracticeRef
-Topic 230
-SubTopic 10
-Name Accounting Standards Codification
-Section 45
-Paragraph 28
-Subparagraph (a)
-Publisher FASB
-URI https://asc.fasb.org//1943274/2147482740/230-10-45-28
| Name: |
us-gaap_IncreaseDecreaseInOtherCurrentLiabilities |
| Namespace Prefix: |
us-gaap_ |
| Data Type: |
xbrli:monetaryItemType |
| Balance Type: |
debit |
| Period Type: |
duration |
|
| X |
- DefinitionAmount of increase (decrease) in noncurrent operating liabilities classified as other.
| Name: |
us-gaap_IncreaseDecreaseInOtherNoncurrentLiabilities |
| Namespace Prefix: |
us-gaap_ |
| Data Type: |
xbrli:monetaryItemType |
| Balance Type: |
debit |
| Period Type: |
duration |
|
| X |
- DefinitionAmount of increase (decrease) in prepaid expenses, and assets classified as other. Reference 1: http://fasb.org/us-gaap/role/ref/legacyRef
-Name Accounting Standards Codification
-Section 45
-Paragraph 28
-Subparagraph (a)
-SubTopic 10
-Topic 230
-Publisher FASB
-URI https://asc.fasb.org//1943274/2147482740/230-10-45-28
| Name: |
us-gaap_IncreaseDecreaseInPrepaidDeferredExpenseAndOtherAssets |
| Namespace Prefix: |
us-gaap_ |
| Data Type: |
xbrli:monetaryItemType |
| Balance Type: |
credit |
| Period Type: |
duration |
|
| X |
- DefinitionAmount of cash paid for interest, excluding capitalized interest, classified as operating activity. Includes, but is not limited to, payment to settle zero-coupon bond for accreted interest of debt discount and debt instrument with insignificant coupon interest rate in relation to effective interest rate of borrowing attributable to accreted interest of debt discount. Reference 1: http://www.xbrl.org/2003/role/disclosureRef
-Topic 230
-SubTopic 10
-Name Accounting Standards Codification
-Section 45
-Paragraph 17
-Subparagraph (d)
-Publisher FASB
-URI https://asc.fasb.org//1943274/2147482740/230-10-45-17
Reference 2: http://www.xbrl.org/2003/role/disclosureRef
-Topic 230
-SubTopic 10
-Name Accounting Standards Codification
-Section 45
-Paragraph 25
-Subparagraph (e)
-Publisher FASB
-URI https://asc.fasb.org//1943274/2147482740/230-10-45-25
Reference 3: http://www.xbrl.org/2003/role/disclosureRef
-Topic 230
-SubTopic 10
-Name Accounting Standards Codification
-Section 50
-Paragraph 2
-Publisher FASB
-URI https://asc.fasb.org//1943274/2147482913/230-10-50-2
| Name: |
us-gaap_InterestPaidNet |
| Namespace Prefix: |
us-gaap_ |
| Data Type: |
xbrli:monetaryItemType |
| Balance Type: |
credit |
| Period Type: |
duration |
|
| X |
- DefinitionAmount of cash inflow (outflow) from financing activities, including discontinued operations. Financing activity cash flows include obtaining resources from owners and providing them with a return on, and a return of, their investment; borrowing money and repaying amounts borrowed, or settling the obligation; and obtaining and paying for other resources obtained from creditors on long-term credit. Reference 1: http://www.xbrl.org/2003/role/disclosureRef
-Topic 230
-SubTopic 10
-Name Accounting Standards Codification
-Section 45
-Paragraph 24
-Publisher FASB
-URI https://asc.fasb.org//1943274/2147482740/230-10-45-24
| Name: |
us-gaap_NetCashProvidedByUsedInFinancingActivities |
| Namespace Prefix: |
us-gaap_ |
| Data Type: |
xbrli:monetaryItemType |
| Balance Type: |
debit |
| Period Type: |
duration |
|
| X |
- References
+ Details
| Name: |
us-gaap_NetCashProvidedByUsedInFinancingActivitiesAbstract |
| Namespace Prefix: |
us-gaap_ |
| Data Type: |
xbrli:stringItemType |
| Balance Type: |
na |
| Period Type: |
duration |
|
| X |
- DefinitionAmount of cash inflow (outflow) from investing activities, including discontinued operations. Investing activity cash flows include making and collecting loans and acquiring and disposing of debt or equity instruments and property, plant, and equipment and other productive assets. Reference 1: http://www.xbrl.org/2003/role/disclosureRef
-Topic 230
-SubTopic 10
-Name Accounting Standards Codification
-Section 45
-Paragraph 24
-Publisher FASB
-URI https://asc.fasb.org//1943274/2147482740/230-10-45-24
| Name: |
us-gaap_NetCashProvidedByUsedInInvestingActivities |
| Namespace Prefix: |
us-gaap_ |
| Data Type: |
xbrli:monetaryItemType |
| Balance Type: |
debit |
| Period Type: |
duration |
|
| X |
- References
+ Details
| Name: |
us-gaap_NetCashProvidedByUsedInInvestingActivitiesAbstract |
| Namespace Prefix: |
us-gaap_ |
| Data Type: |
xbrli:stringItemType |
| Balance Type: |
na |
| Period Type: |
duration |
|
| X |
- DefinitionAmount of cash inflow (outflow) from operating activities, including discontinued operations. Operating activity cash flows include transactions, adjustments, and changes in value not defined as investing or financing activities. Reference 1: http://fasb.org/us-gaap/role/ref/legacyRef
-Topic 230
-SubTopic 10
-Name Accounting Standards Codification
-Section 45
-Paragraph 28
-Publisher FASB
-URI https://asc.fasb.org//1943274/2147482740/230-10-45-28
Reference 2: http://fasb.org/us-gaap/role/ref/legacyRef
-Topic 230
-SubTopic 10
-Name Accounting Standards Codification
-Section 45
-Paragraph 24
-Publisher FASB
-URI https://asc.fasb.org//1943274/2147482740/230-10-45-24
Reference 3: http://fasb.org/us-gaap/role/ref/legacyRef
-Topic 230
-SubTopic 10
-Name Accounting Standards Codification
-Section 45
-Paragraph 25
-Publisher FASB
-URI https://asc.fasb.org//1943274/2147482740/230-10-45-25
| Name: |
us-gaap_NetCashProvidedByUsedInOperatingActivities |
| Namespace Prefix: |
us-gaap_ |
| Data Type: |
xbrli:monetaryItemType |
| Balance Type: |
na |
| Period Type: |
duration |
|
| X |
- References
+ Details
| Name: |
us-gaap_NetCashProvidedByUsedInOperatingActivitiesAbstract |
| Namespace Prefix: |
us-gaap_ |
| Data Type: |
xbrli:stringItemType |
| Balance Type: |
na |
| Period Type: |
duration |
|
| X |
- DefinitionThe portion of profit or loss for the period, net of income taxes, which is attributable to the parent. Reference 1: http://www.xbrl.org/2003/role/disclosureRef
-Topic 235
-SubTopic 10
-Name Accounting Standards Codification
-Section S99
-Paragraph 1
-Subparagraph (SX 210.4-08(g)(1)(ii))
-Publisher FASB
-URI https://asc.fasb.org//1943274/2147480678/235-10-S99-1
Reference 2: http://www.xbrl.org/2003/role/disclosureRef
-Topic 323
-SubTopic 10
-Name Accounting Standards Codification
-Section 50
-Paragraph 3
-Subparagraph (c)
-Publisher FASB
-URI https://asc.fasb.org//1943274/2147481687/323-10-50-3
Reference 3: http://www.xbrl.org/2003/role/disclosureRef
-Topic 825
-SubTopic 10
-Name Accounting Standards Codification
-Section 50
-Paragraph 28
-Subparagraph (f)
-Publisher FASB
-URI https://asc.fasb.org//1943274/2147482907/825-10-50-28
Reference 4: http://www.xbrl.org/2003/role/disclosureRef
-Topic 220
-SubTopic 10
-Name Accounting Standards Codification
-Section 50
-Paragraph 6
-Publisher FASB
-URI https://asc.fasb.org//1943274/2147482765/220-10-50-6
Reference 5: http://www.xbrl.org/2003/role/disclosureRef
-Topic 250
-SubTopic 10
-Name Accounting Standards Codification
-Section 50
-Paragraph 3
-Publisher FASB
-URI https://asc.fasb.org//1943274/2147483443/250-10-50-3
Reference 6: http://www.xbrl.org/2003/role/disclosureRef
-Topic 250
-SubTopic 10
-Name Accounting Standards Codification
-Section 50
-Paragraph 1
-Subparagraph (b)(2)
-Publisher FASB
-URI https://asc.fasb.org//1943274/2147483443/250-10-50-1
Reference 7: http://www.xbrl.org/2003/role/disclosureRef
-Topic 815
-SubTopic 40
-Name Accounting Standards Codification
-Section 65
-Paragraph 1
-Subparagraph (f)
-Publisher FASB
-URI https://asc.fasb.org//1943274/2147480175/815-40-65-1
Reference 8: http://www.xbrl.org/2003/role/disclosureRef
-Topic 250
-SubTopic 10
-Name Accounting Standards Codification
-Section 50
-Paragraph 8
-Publisher FASB
-URI https://asc.fasb.org//1943274/2147483443/250-10-50-8
Reference 9: http://www.xbrl.org/2003/role/disclosureRef
-Topic 250
-SubTopic 10
-Name Accounting Standards Codification
-Section 50
-Paragraph 9
-Publisher FASB
-URI https://asc.fasb.org//1943274/2147483443/250-10-50-9
Reference 10: http://www.xbrl.org/2003/role/disclosureRef
-Topic 250
-SubTopic 10
-Name Accounting Standards Codification
-Section 50
-Paragraph 11
-Subparagraph (a)
-Publisher FASB
-URI https://asc.fasb.org//1943274/2147483443/250-10-50-11
Reference 11: http://www.xbrl.org/2003/role/disclosureRef
-Topic 250
-SubTopic 10
-Name Accounting Standards Codification
-Section 50
-Paragraph 11
-Subparagraph (b)
-Publisher FASB
-URI https://asc.fasb.org//1943274/2147483443/250-10-50-11
Reference 12: http://www.xbrl.org/2003/role/disclosureRef
-Topic 250
-SubTopic 10
-Name Accounting Standards Codification
-Section 50
-Paragraph 4
-Publisher FASB
-URI https://asc.fasb.org//1943274/2147483443/250-10-50-4
Reference 13: http://www.xbrl.org/2003/role/exampleRef
-Topic 946
-SubTopic 830
-Name Accounting Standards Codification
-Section 55
-Paragraph 10
-Publisher FASB
-URI https://asc.fasb.org//1943274/2147480167/946-830-55-10
Reference 14: http://www.xbrl.org/2003/role/disclosureRef
-Topic 946
-SubTopic 220
-Name Accounting Standards Codification
-Section 45
-Paragraph 7
-Publisher FASB
-URI https://asc.fasb.org//1943274/2147483581/946-220-45-7
Reference 15: http://www.xbrl.org/2003/role/disclosureRef
-Topic 944
-SubTopic 220
-Name Accounting Standards Codification
-Section S99
-Paragraph 1
-Subparagraph (SX 210.7-04(18))
-Publisher FASB
-URI https://asc.fasb.org//1943274/2147483586/944-220-S99-1
Reference 16: http://www.xbrl.org/2003/role/disclosureRef
-Topic 280
-SubTopic 10
-Name Accounting Standards Codification
-Section 50
-Paragraph 22
-Publisher FASB
-URI https://asc.fasb.org//1943274/2147482810/280-10-50-22
Reference 17: http://www.xbrl.org/2003/role/disclosureRef
-Topic 946
-SubTopic 220
-Name Accounting Standards Codification
-Section S99
-Paragraph 1
-Subparagraph (SX 210.6-07(9))
-Publisher FASB
-URI https://asc.fasb.org//1943274/2147483575/946-220-S99-1
Reference 18: http://www.xbrl.org/2003/role/disclosureRef
-Topic 946
-SubTopic 220
-Name Accounting Standards Codification
-Section S99
-Paragraph 3
-Subparagraph (SX 210.6-09(1)(d))
-Publisher FASB
-URI https://asc.fasb.org//1943274/2147483575/946-220-S99-3
Reference 19: http://www.xbrl.org/2003/role/disclosureRef
-Topic 470
-SubTopic 10
-Name Accounting Standards Codification
-Section S99
-Paragraph 1A
-Subparagraph (SX 210.13-01(a)(4)(i))
-Publisher FASB
-URI https://asc.fasb.org//1943274/2147480097/470-10-S99-1A
Reference 20: http://www.xbrl.org/2009/role/commonPracticeRef
-Topic 470
-SubTopic 10
-Name Accounting Standards Codification
-Section S99
-Paragraph 1A
-Subparagraph (SX 210.13-01(a)(4)(ii))
-Publisher FASB
-URI https://asc.fasb.org//1943274/2147480097/470-10-S99-1A
Reference 21: http://www.xbrl.org/2003/role/disclosureRef
-Topic 470
-SubTopic 10
-Name Accounting Standards Codification
-Section S99
-Paragraph 1A
-Subparagraph (SX 210.13-01(a)(4)(iii)(A))
-Publisher FASB
-URI https://asc.fasb.org//1943274/2147480097/470-10-S99-1A
Reference 22: http://www.xbrl.org/2003/role/disclosureRef
-Topic 470
-SubTopic 10
-Name Accounting Standards Codification
-Section S99
-Paragraph 1A
-Subparagraph (SX 210.13-01(a)(4)(iv))
-Publisher FASB
-URI https://asc.fasb.org//1943274/2147480097/470-10-S99-1A
Reference 23: http://www.xbrl.org/2003/role/disclosureRef
-Topic 470
-SubTopic 10
-Name Accounting Standards Codification
-Section S99
-Paragraph 1A
-Subparagraph (SX 210.13-01(a)(5))
-Publisher FASB
-URI https://asc.fasb.org//1943274/2147480097/470-10-S99-1A
Reference 24: http://www.xbrl.org/2003/role/disclosureRef
-Topic 470
-SubTopic 10
-Name Accounting Standards Codification
-Section S99
-Paragraph 1B
-Subparagraph (SX 210.13-02(a)(4)(i))
-Publisher FASB
-URI https://asc.fasb.org//1943274/2147480097/470-10-S99-1B
Reference 25: http://www.xbrl.org/2003/role/disclosureRef
-Topic 470
-SubTopic 10
-Name Accounting Standards Codification
-Section S99
-Paragraph 1B
-Subparagraph (SX 210.13-02(a)(4)(iii)(A))
-Publisher FASB
-URI https://asc.fasb.org//1943274/2147480097/470-10-S99-1B
Reference 26: http://www.xbrl.org/2003/role/disclosureRef
-Topic 470
-SubTopic 10
-Name Accounting Standards Codification
-Section S99
-Paragraph 1B
-Subparagraph (SX 210.13-02(a)(4)(iii)(B))
-Publisher FASB
-URI https://asc.fasb.org//1943274/2147480097/470-10-S99-1B
Reference 27: http://www.xbrl.org/2003/role/disclosureRef
-Topic 470
-SubTopic 10
-Name Accounting Standards Codification
-Section S99
-Paragraph 1B
-Subparagraph (SX 210.13-02(a)(4)(iv))
-Publisher FASB
-URI https://asc.fasb.org//1943274/2147480097/470-10-S99-1B
Reference 28: http://www.xbrl.org/2003/role/disclosureRef
-Topic 470
-SubTopic 10
-Name Accounting Standards Codification
-Section S99
-Paragraph 1B
-Subparagraph (SX 210.13-02(a)(5))
-Publisher FASB
-URI https://asc.fasb.org//1943274/2147480097/470-10-S99-1B
Reference 29: http://www.xbrl.org/2003/role/disclosureRef
-Topic 280
-SubTopic 10
-Name Accounting Standards Codification
-Section 50
-Paragraph 30
-Subparagraph (b)
-Publisher FASB
-URI https://asc.fasb.org//1943274/2147482810/280-10-50-30
Reference 30: http://www.xbrl.org/2003/role/disclosureRef
-Topic 280
-SubTopic 10
-Name Accounting Standards Codification
-Section 50
-Paragraph 32
-Subparagraph (f)
-Publisher FASB
-URI https://asc.fasb.org//1943274/2147482810/280-10-50-32
Reference 31: http://www.xbrl.org/2003/role/disclosureRef
-Topic 260
-SubTopic 10
-Name Accounting Standards Codification
-Section 45
-Paragraph 60B
-Subparagraph (a)
-Publisher FASB
-URI https://asc.fasb.org//1943274/2147482689/260-10-45-60B
Reference 32: http://www.xbrl.org/2003/role/exampleRef
-Topic 280
-SubTopic 10
-Name Accounting Standards Codification
-Section 50
-Paragraph 31
-Publisher FASB
-URI https://asc.fasb.org//1943274/2147482810/280-10-50-31
Reference 33: http://www.xbrl.org/2003/role/disclosureRef
-Topic 280
-SubTopic 10
-Name Accounting Standards Codification
-Section 50
-Paragraph 32
-Subparagraph (c)
-Publisher FASB
-URI https://asc.fasb.org//1943274/2147482810/280-10-50-32
Reference 34: http://www.xbrl.org/2003/role/disclosureRef
-Topic 205
-SubTopic 20
-Name Accounting Standards Codification
-Section 50
-Paragraph 7
-Publisher FASB
-URI https://asc.fasb.org//1943274/2147483499/205-20-50-7
Reference 35: http://fasb.org/us-gaap/role/ref/legacyRef
-Topic 230
-SubTopic 10
-Name Accounting Standards Codification
-Section 45
-Paragraph 28
-Publisher FASB
-URI https://asc.fasb.org//1943274/2147482740/230-10-45-28
Reference 36: http://www.xbrl.org/2003/role/disclosureRef
-Topic 220
-SubTopic 10
-Name Accounting Standards Codification
-Section 45
-Paragraph 1A
-Subparagraph (a)
-Publisher FASB
-URI https://asc.fasb.org//1943274/2147482790/220-10-45-1A
Reference 37: http://www.xbrl.org/2003/role/disclosureRef
-Topic 220
-SubTopic 10
-Name Accounting Standards Codification
-Section 45
-Paragraph 1B
-Subparagraph (a)
-Publisher FASB
-URI https://asc.fasb.org//1943274/2147482790/220-10-45-1B
Reference 38: http://fasb.org/us-gaap/role/ref/legacyRef
-Topic 220
-SubTopic 10
-Name Accounting Standards Codification
-Section S99
-Paragraph 2
-Subparagraph (SX 210.5-03(20))
-Publisher FASB
-URI https://asc.fasb.org//1943274/2147483621/220-10-S99-2
Reference 39: http://fasb.org/us-gaap/role/ref/legacyRef
-Topic 942
-SubTopic 220
-Name Accounting Standards Codification
-Section S99
-Paragraph 1
-Subparagraph (SX 210.9-04(22))
-Publisher FASB
-URI https://asc.fasb.org//1943274/2147483589/942-220-S99-1
| Name: |
us-gaap_NetIncomeLoss |
| Namespace Prefix: |
us-gaap_ |
| Data Type: |
xbrli:monetaryItemType |
| Balance Type: |
credit |
| Period Type: |
duration |
|
| X |
- References
+ Details
| Name: |
us-gaap_NoncashInvestingAndFinancingItemsAbstract |
| Namespace Prefix: |
us-gaap_ |
| Data Type: |
xbrli:stringItemType |
| Balance Type: |
na |
| Period Type: |
duration |
|
| X |
- DefinitionAmount of periodic reduction over lease term of carrying amount of right-of-use asset from operating lease. Reference 1: http://www.xbrl.org/2009/role/commonPracticeRef
-Topic 230
-SubTopic 10
-Name Accounting Standards Codification
-Section 45
-Paragraph 28
-Subparagraph (b)
-Publisher FASB
-URI https://asc.fasb.org//1943274/2147482740/230-10-45-28
| Name: |
us-gaap_OperatingLeaseRightOfUseAssetAmortizationExpense |
| Namespace Prefix: |
us-gaap_ |
| Data Type: |
xbrli:monetaryItemType |
| Balance Type: |
debit |
| Period Type: |
duration |
|
| X |
- DefinitionThe cash outflow associated with other payments to acquire businesses including deposit on pending acquisitions and preacquisition costs. Reference 1: http://fasb.org/us-gaap/role/ref/legacyRef
-Name Accounting Standards Codification
-Topic 230
-SubTopic 10
-Section 45
-Paragraph 13
-Subparagraph (b)
-Publisher FASB
-URI https://asc.fasb.org//1943274/2147482740/230-10-45-13
| Name: |
us-gaap_OtherPaymentsToAcquireBusinesses |
| Namespace Prefix: |
us-gaap_ |
| Data Type: |
xbrli:monetaryItemType |
| Balance Type: |
credit |
| Period Type: |
duration |
|
| X |
- DefinitionCash outflow representing an adjustment to the purchase price of a previous acquisition. Reference 1: http://www.xbrl.org/2009/role/commonPracticeRef
-Topic 230
-SubTopic 10
-Name Accounting Standards Codification
-Section 45
-Paragraph 13
-Publisher FASB
-URI https://asc.fasb.org//1943274/2147482740/230-10-45-13
| Name: |
us-gaap_PaymentsForPreviousAcquisition |
| Namespace Prefix: |
us-gaap_ |
| Data Type: |
xbrli:monetaryItemType |
| Balance Type: |
credit |
| Period Type: |
duration |
|
| X |
- DefinitionThe cash outflow associated with the development, modification or acquisition of software programs or applications for internal use (that is, not to be sold, leased or otherwise marketed to others) that qualify for capitalization. Reference 1: http://fasb.org/us-gaap/role/ref/legacyRef
-Topic 230
-SubTopic 10
-Name Accounting Standards Codification
-Section 45
-Paragraph 13
-Subparagraph (c)
-Publisher FASB
-URI https://asc.fasb.org//1943274/2147482740/230-10-45-13
| Name: |
us-gaap_PaymentsForSoftware |
| Namespace Prefix: |
us-gaap_ |
| Data Type: |
xbrli:monetaryItemType |
| Balance Type: |
credit |
| Period Type: |
duration |
|
| X |
- DefinitionThe cash outflow associated with the acquisition of long-lived, physical assets that are used in the normal conduct of business to produce goods and services and not intended for resale; includes cash outflows to pay for construction of self-constructed assets. Reference 1: http://fasb.org/us-gaap/role/ref/legacyRef
-Topic 230
-SubTopic 10
-Name Accounting Standards Codification
-Section 45
-Paragraph 13
-Subparagraph (c)
-Publisher FASB
-URI https://asc.fasb.org//1943274/2147482740/230-10-45-13
| Name: |
us-gaap_PaymentsToAcquirePropertyPlantAndEquipment |
| Namespace Prefix: |
us-gaap_ |
| Data Type: |
xbrli:monetaryItemType |
| Balance Type: |
credit |
| Period Type: |
duration |
|
| X |
- DefinitionAmount of increase in right-of-use asset obtained in exchange for operating lease liability. Reference 1: http://www.xbrl.org/2003/role/exampleRef
-Topic 842
-SubTopic 20
-Name Accounting Standards Codification
-Section 55
-Paragraph 53
-Publisher FASB
-URI https://asc.fasb.org//1943274/2147479589/842-20-55-53
Reference 2: http://www.xbrl.org/2003/role/disclosureRef
-Topic 842
-SubTopic 20
-Name Accounting Standards Codification
-Section 50
-Paragraph 4
-Subparagraph (g)(2)
-Publisher FASB
-URI https://asc.fasb.org//1943274/2147478964/842-20-50-4
| Name: |
us-gaap_RightOfUseAssetObtainedInExchangeForOperatingLeaseLiability |
| Namespace Prefix: |
us-gaap_ |
| Data Type: |
xbrli:monetaryItemType |
| Balance Type: |
debit |
| Period Type: |
duration |
|
| X |
- DefinitionAmount of noncash expense for share-based payment arrangement. Reference 1: http://fasb.org/us-gaap/role/ref/legacyRef
-Name Accounting Standards Codification
-Section 45
-Paragraph 28
-Subparagraph (a)
-SubTopic 10
-Topic 230
-Publisher FASB
-URI https://asc.fasb.org//1943274/2147482740/230-10-45-28
| Name: |
us-gaap_ShareBasedCompensation |
| Namespace Prefix: |
us-gaap_ |
| Data Type: |
xbrli:monetaryItemType |
| Balance Type: |
debit |
| Period Type: |
duration |
|
| X |
- Details
| Name: |
srt_RestatementAxis=srt_ScenarioPreviouslyReportedMember |
| Namespace Prefix: |
|
| Data Type: |
na |
| Balance Type: |
|
| Period Type: |
|
|
| X |
- Details
| Name: |
us-gaap_ErrorCorrectionsAndPriorPeriodAdjustmentsRestatementByRestatementPeriodAndAmountAxis=INSE_AccountingStandardsUpdateMember |
| Namespace Prefix: |
|
| Data Type: |
na |
| Balance Type: |
|
| Period Type: |
|
|
| X |
- Details
| Name: |
srt_RestatementAxis=INSE_PreviousRevisionMember |
| Namespace Prefix: |
|
| Data Type: |
na |
| Balance Type: |
|
| Period Type: |
|
|
| X |
- Details
| Name: |
srt_RestatementAxis=srt_RevisionOfPriorPeriodReclassificationAdjustmentMember |
| Namespace Prefix: |
|
| Data Type: |
na |
| Balance Type: |
|
| Period Type: |
|
|
v3.24.0.1
Restatement of Previously Issued Financial Statements (Details Narrative) - USD ($)
$ in Millions |
3 Months Ended |
|
Mar. 31, 2023 |
Mar. 31, 2022 |
Dec. 31, 2022 |
| New Accounting Pronouncements or Change in Accounting Principle [Line Items] |
|
|
|
|
|
| Selling, general and administrative expenses |
|
$ 26.3
|
|
$ 20.4
|
|
| Depreciation and amortization |
|
9.4
|
|
10.7
|
|
| Revenue |
|
64.9
|
|
60.3
|
|
| Customer contract cost |
|
7.7
|
|
|
$ 7.0
|
| Cost of service |
[1] |
15.0
|
|
16.8
|
|
| Inventory |
|
1.9
|
|
|
|
| Other acquired intangible assets |
|
14.3
|
|
|
14.6
|
| Operating lease right of use asset |
|
15.7
|
|
|
16.0
|
| Current operating lease liabilities |
|
4.0
|
|
|
3.9
|
| Long-term operating lease liabilities |
|
11.9
|
|
|
12.3
|
| Pension amount |
|
(1.8)
|
|
|
$ (2.1)
|
| Service [Member] |
|
|
|
|
|
| New Accounting Pronouncements or Change in Accounting Principle [Line Items] |
|
|
|
|
|
| Revenue |
|
57.5
|
|
56.0
|
|
| Product Sales [Member] |
|
|
|
|
|
| New Accounting Pronouncements or Change in Accounting Principle [Line Items] |
|
|
|
|
|
| Revenue |
|
7.4
|
|
4.3
|
|
| Revision of Prior Period, Adjustment [Member] |
|
|
|
|
|
| New Accounting Pronouncements or Change in Accounting Principle [Line Items] |
|
|
|
|
|
| Depreciation and amortization |
|
1.6
|
|
1.4
|
|
| Revenue |
|
0.3
|
|
|
|
| Decrease in deferred revenue, current |
|
0.2
|
|
|
|
| Decrease in deferred revenue, current |
|
0.9
|
|
|
|
| Customer contract cost |
|
0.8
|
|
|
|
| Cost of service |
|
2.3
|
|
1.9
|
|
| Cost of product sales |
|
|
|
0.2
|
|
| Cost of product sales |
|
|
|
0.5
|
|
| Revision of Prior Period, Adjustment [Member] | Service [Member] |
|
|
|
|
|
| New Accounting Pronouncements or Change in Accounting Principle [Line Items] |
|
|
|
|
|
| Revenue |
|
0.7
|
|
1.0
|
|
| Revision of Prior Period, Adjustment [Member] | Product Sales [Member] |
|
|
|
|
|
| New Accounting Pronouncements or Change in Accounting Principle [Line Items] |
|
|
|
|
|
| Revenue |
|
0.3
|
|
0.7
|
|
| Revision of Prior Period, Adjustment [Member] | Short-Term Contract with Customer [Member] |
|
|
|
|
|
| New Accounting Pronouncements or Change in Accounting Principle [Line Items] |
|
|
|
|
|
| Reseach and development expenses |
|
7.2
|
|
|
|
| Revision of Prior Period, Adjustment [Member] | Software Development [Member] |
|
|
|
|
|
| New Accounting Pronouncements or Change in Accounting Principle [Line Items] |
|
|
|
|
|
| Reseach and development expenses |
|
17.6
|
|
|
|
| Revision of Prior Period, Adjustment [Member] | Capitalized Software [Member] |
|
|
|
|
|
| New Accounting Pronouncements or Change in Accounting Principle [Line Items] |
|
|
|
|
|
| Selling, general and administrative expenses |
|
1.1
|
|
0.5
|
|
| Depreciation and amortization |
|
1.1
|
|
0.7
|
|
| Previous Revision [Member] |
|
|
|
|
|
| New Accounting Pronouncements or Change in Accounting Principle [Line Items] |
|
|
|
|
|
| Customer contract cost |
|
|
|
|
|
| Other acquired intangible assets |
|
|
|
|
|
| Operating lease right of use asset |
|
|
|
|
|
| Current operating lease liabilities |
|
|
|
|
|
| Long-term operating lease liabilities |
|
|
|
|
|
| Previous Revision [Member] | Software Development [Member] |
|
|
|
|
|
| New Accounting Pronouncements or Change in Accounting Principle [Line Items] |
|
|
|
|
|
| Reseach and development expenses |
|
1.0
|
|
|
|
| Revision of Prior Period, Accounting Standards Update, Adjustment [Member] |
|
|
|
|
|
| New Accounting Pronouncements or Change in Accounting Principle [Line Items] |
|
|
|
|
|
| Depreciation and amortization |
|
|
|
0.1
|
|
| Other acquired intangible assets |
|
1.2
|
|
|
|
| Revision of Prior Period, Reclassification, Adjustment [Member] |
|
|
|
|
|
| New Accounting Pronouncements or Change in Accounting Principle [Line Items] |
|
|
|
|
|
| Depreciation and amortization |
|
0.5
|
|
0.6
|
|
| Revenue |
|
(1.1)
|
|
(0.3)
|
|
| Customer contract cost |
|
7.7
|
|
|
|
| Cost of service |
|
4.1
|
[2] |
5.0
|
|
| Other acquired intangible assets |
|
(0.3)
|
|
|
|
| Operating lease right of use asset |
|
7.6
|
|
|
|
| Current operating lease liabilities |
|
1.2
|
|
|
|
| Long-term operating lease liabilities |
|
6.3
|
|
|
|
| Revision of Prior Period, Reclassification, Adjustment [Member] | AOCI Attributable to Parent [Member] |
|
|
|
|
|
| New Accounting Pronouncements or Change in Accounting Principle [Line Items] |
|
|
|
|
|
| Pension amount |
|
1.8
|
|
|
|
| Revision of Prior Period, Reclassification, Adjustment [Member] | Other Noncurrent Liabilities [Member] |
|
|
|
|
|
| New Accounting Pronouncements or Change in Accounting Principle [Line Items] |
|
|
|
|
|
| Pension amount |
|
1.8
|
|
|
|
| Revision of Prior Period, Reclassification, Adjustment [Member] | Service [Member] |
|
|
|
|
|
| New Accounting Pronouncements or Change in Accounting Principle [Line Items] |
|
|
|
|
|
| Revenue |
|
(0.8)
|
|
(1.0)
|
|
| Revision of Prior Period, Reclassification, Adjustment [Member] | Product Sales [Member] |
|
|
|
|
|
| New Accounting Pronouncements or Change in Accounting Principle [Line Items] |
|
|
|
|
|
| Revenue |
|
$ (0.3)
|
|
$ 0.7
|
|
|
|
| X |
- DefinitionDecrease cost of product sales.
| Name: |
INSE_DecreaseCostOfProductSales |
| Namespace Prefix: |
INSE_ |
| Data Type: |
xbrli:monetaryItemType |
| Balance Type: |
debit |
| Period Type: |
duration |
|
| X |
- DefinitionIncrease cost of product sales.
| Name: |
INSE_IncreaseCostOfProductSales |
| Namespace Prefix: |
INSE_ |
| Data Type: |
xbrli:monetaryItemType |
| Balance Type: |
debit |
| Period Type: |
duration |
|
| X |
- DefinitionIncrease decrease reseach and development expenses.
| Name: |
INSE_IncreaseDecreaseReseachAndDevelopmentExpenses |
| Namespace Prefix: |
INSE_ |
| Data Type: |
xbrli:monetaryItemType |
| Balance Type: |
debit |
| Period Type: |
duration |
|
| X |
- DefinitionAmount, after accumulated amortization and accumulated impairment loss, of asset recognized from cost incurred to obtain or fulfill contract with customer. Reference 1: http://www.xbrl.org/2003/role/disclosureRef
-Topic 340
-SubTopic 40
-Name Accounting Standards Codification
-Section 50
-Paragraph 3
-Subparagraph (a)
-Publisher FASB
-URI https://asc.fasb.org//1943274/2147479483/340-40-50-3
| Name: |
us-gaap_CapitalizedContractCostNet |
| Namespace Prefix: |
us-gaap_ |
| Data Type: |
xbrli:monetaryItemType |
| Balance Type: |
debit |
| Period Type: |
instant |
|
| X |
- DefinitionThe aggregate costs related to goods produced and sold and services rendered by an entity during the reporting period. This excludes costs incurred during the reporting period related to financial services rendered and other revenue generating activities. Reference 1: http://www.xbrl.org/2003/role/disclosureRef
-Topic 924
-SubTopic 10
-Name Accounting Standards Codification
-Section S99
-Paragraph 1
-Subparagraph (SAB Topic 11.L)
-Publisher FASB
-URI https://asc.fasb.org//1943274/2147479941/924-10-S99-1
Reference 2: http://fasb.org/us-gaap/role/ref/legacyRef
-Topic 220
-SubTopic 10
-Name Accounting Standards Codification
-Section S99
-Paragraph 2
-Subparagraph (SX 210.5-03.2(a),(d))
-Publisher FASB
-URI https://asc.fasb.org//1943274/2147483621/220-10-S99-2
| Name: |
us-gaap_CostOfGoodsAndServicesSold |
| Namespace Prefix: |
us-gaap_ |
| Data Type: |
xbrli:monetaryItemType |
| Balance Type: |
debit |
| Period Type: |
duration |
|
| X |
- DefinitionAmount of deferred income and obligation to transfer product and service to customer for which consideration has been received or is receivable, classified as current. Reference 1: http://www.xbrl.org/2009/role/commonPracticeRef
-Topic 210
-SubTopic 10
-Name Accounting Standards Codification
-Section S99
-Paragraph 1
-Subparagraph (SX 210.5-02(20))
-Publisher FASB
-URI https://asc.fasb.org//1943274/2147480566/210-10-S99-1
| Name: |
us-gaap_DeferredRevenueCurrent |
| Namespace Prefix: |
us-gaap_ |
| Data Type: |
xbrli:monetaryItemType |
| Balance Type: |
credit |
| Period Type: |
instant |
|
| X |
- DefinitionAmount of asset (liability), recognized in statement of financial position, for defined benefit pension and other postretirement plans. Reference 1: http://fasb.org/us-gaap/role/ref/legacyRef
-Name Accounting Standards Codification
-Topic 715
-SubTopic 20
-Section 45
-Paragraph 2
-Publisher FASB
-URI https://asc.fasb.org//1943274/2147480535/715-20-45-2
Reference 2: http://fasb.org/us-gaap/role/ref/legacyRef
-Name Accounting Standards Codification
-Topic 715
-SubTopic 20
-Section 50
-Paragraph 1
-Subparagraph (c)
-Publisher FASB
-URI https://asc.fasb.org//1943274/2147480506/715-20-50-1
| Name: |
us-gaap_DefinedBenefitPlanAmountsRecognizedInBalanceSheet |
| Namespace Prefix: |
us-gaap_ |
| Data Type: |
xbrli:monetaryItemType |
| Balance Type: |
debit |
| Period Type: |
instant |
|
| X |
- DefinitionThe current period expense charged against earnings on long-lived, physical assets not used in production, and which are not intended for resale, to allocate or recognize the cost of such assets over their useful lives; or to record the reduction in book value of an intangible asset over the benefit period of such asset; or to reflect consumption during the period of an asset that is not used in production. Reference 1: http://fasb.org/us-gaap/role/ref/legacyRef
-Name Accounting Standards Codification
-Section 45
-Paragraph 28
-Subparagraph (b)
-SubTopic 10
-Topic 230
-Publisher FASB
-URI https://asc.fasb.org//1943274/2147482740/230-10-45-28
Reference 2: http://fasb.org/us-gaap/role/ref/legacyRef
-Name Accounting Standards Codification
-Topic 360
-SubTopic 10
-Section 50
-Paragraph 1
-Subparagraph (a)
-Publisher FASB
-URI https://asc.fasb.org//1943274/2147482099/360-10-50-1
| Name: |
us-gaap_DepreciationAndAmortization |
| Namespace Prefix: |
us-gaap_ |
| Data Type: |
xbrli:monetaryItemType |
| Balance Type: |
debit |
| Period Type: |
duration |
|
| X |
- DefinitionGross amount, as of the balance sheet date, of merchandise, goods, commodities, or supplies held for future sale or to be used in manufacturing, servicing or production process. Reference 1: http://www.xbrl.org/2009/role/commonPracticeRef
-Topic 210
-SubTopic 10
-Name Accounting Standards Codification
-Section S99
-Paragraph 1
-Subparagraph (SX 210.5-02(6))
-Publisher FASB
-URI https://asc.fasb.org//1943274/2147480566/210-10-S99-1
| Name: |
us-gaap_InventoryGross |
| Namespace Prefix: |
us-gaap_ |
| Data Type: |
xbrli:monetaryItemType |
| Balance Type: |
debit |
| Period Type: |
instant |
|
| X |
- DefinitionLine items represent financial concepts included in a table. These concepts are used to disclose reportable information associated with domain members defined in one or many axes to the table. Reference 1: http://www.xbrl.org/2003/role/disclosureRef
-Topic 405
-SubTopic 50
-Name Accounting Standards Codification
-Section 65
-Paragraph 1
-Subparagraph (a)
-Publisher FASB
-URI https://asc.fasb.org//1943274/2147477123/405-50-65-1
Reference 2: http://www.xbrl.org/2003/role/disclosureRef
-Topic 820
-SubTopic 10
-Name Accounting Standards Codification
-Section 65
-Paragraph 13
-Subparagraph (a)
-Publisher FASB
-URI https://asc.fasb.org//1943274/2147482477/820-10-65-13
Reference 3: http://www.xbrl.org/2003/role/disclosureRef
-Topic 820
-SubTopic 10
-Name Accounting Standards Codification
-Section 65
-Paragraph 13
-Subparagraph (b)
-Publisher FASB
-URI https://asc.fasb.org//1943274/2147482477/820-10-65-13
Reference 4: http://www.xbrl.org/2003/role/disclosureRef
-Topic 326
-SubTopic 10
-Name Accounting Standards Codification
-Section 65
-Paragraph 5
-Subparagraph (a)
-Publisher FASB
-URI https://asc.fasb.org//1943274/2147479654/326-10-65-5
Reference 5: http://www.xbrl.org/2003/role/disclosureRef
-Topic 326
-SubTopic 10
-Name Accounting Standards Codification
-Section 65
-Paragraph 5
-Subparagraph (b)
-Publisher FASB
-URI https://asc.fasb.org//1943274/2147479654/326-10-65-5
Reference 6: http://www.xbrl.org/2003/role/disclosureRef
-Topic 326
-SubTopic 10
-Name Accounting Standards Codification
-Section 65
-Paragraph 5
-Subparagraph (b)(1)
-Publisher FASB
-URI https://asc.fasb.org//1943274/2147479654/326-10-65-5
Reference 7: http://www.xbrl.org/2003/role/disclosureRef
-Topic 326
-SubTopic 10
-Name Accounting Standards Codification
-Section 65
-Paragraph 5
-Subparagraph (c)(2)
-Publisher FASB
-URI https://asc.fasb.org//1943274/2147479654/326-10-65-5
Reference 8: http://www.xbrl.org/2003/role/disclosureRef
-Topic 815
-SubTopic 20
-Name Accounting Standards Codification
-Section 65
-Paragraph 6
-Subparagraph (a)
-Publisher FASB
-URI https://asc.fasb.org//1943274/2147480528/815-20-65-6
Reference 9: http://www.xbrl.org/2003/role/disclosureRef
-Topic 815
-SubTopic 20
-Name Accounting Standards Codification
-Section 65
-Paragraph 6
-Subparagraph (b)
-Publisher FASB
-URI https://asc.fasb.org//1943274/2147480528/815-20-65-6
Reference 10: http://www.xbrl.org/2003/role/disclosureRef
-Topic 815
-SubTopic 20
-Name Accounting Standards Codification
-Section 65
-Paragraph 6
-Subparagraph (c)
-Publisher FASB
-URI https://asc.fasb.org//1943274/2147480528/815-20-65-6
Reference 11: http://www.xbrl.org/2003/role/disclosureRef
-Topic 815
-SubTopic 20
-Name Accounting Standards Codification
-Section 65
-Paragraph 6
-Subparagraph (e)
-Publisher FASB
-URI https://asc.fasb.org//1943274/2147480528/815-20-65-6
Reference 12: http://www.xbrl.org/2003/role/disclosureRef
-Topic 815
-SubTopic 20
-Name Accounting Standards Codification
-Section 65
-Paragraph 6
-Subparagraph (f)
-Publisher FASB
-URI https://asc.fasb.org//1943274/2147480528/815-20-65-6
Reference 13: http://www.xbrl.org/2003/role/disclosureRef
-Topic 815
-SubTopic 20
-Name Accounting Standards Codification
-Section 65
-Paragraph 6
-Subparagraph (h)(1)
-Publisher FASB
-URI https://asc.fasb.org//1943274/2147480528/815-20-65-6
Reference 14: http://www.xbrl.org/2003/role/disclosureRef
-Topic 815
-SubTopic 20
-Name Accounting Standards Codification
-Section 65
-Paragraph 6
-Subparagraph (h)(1)(i)
-Publisher FASB
-URI https://asc.fasb.org//1943274/2147480528/815-20-65-6
Reference 15: http://www.xbrl.org/2003/role/disclosureRef
-Topic 815
-SubTopic 20
-Name Accounting Standards Codification
-Section 65
-Paragraph 6
-Subparagraph (h)(1)(iii)
-Publisher FASB
-URI https://asc.fasb.org//1943274/2147480528/815-20-65-6
Reference 16: http://www.xbrl.org/2003/role/disclosureRef
-Topic 815
-SubTopic 20
-Name Accounting Standards Codification
-Section 65
-Paragraph 6
-Subparagraph (h)(1)(iv)
-Publisher FASB
-URI https://asc.fasb.org//1943274/2147480528/815-20-65-6
Reference 17: http://www.xbrl.org/2003/role/disclosureRef
-Topic 815
-SubTopic 20
-Name Accounting Standards Codification
-Section 65
-Paragraph 6
-Subparagraph (i)(2)
-Publisher FASB
-URI https://asc.fasb.org//1943274/2147480528/815-20-65-6
Reference 18: http://www.xbrl.org/2003/role/disclosureRef
-Topic 815
-SubTopic 20
-Name Accounting Standards Codification
-Section 65
-Paragraph 6
-Subparagraph (i)(3)
-Publisher FASB
-URI https://asc.fasb.org//1943274/2147480528/815-20-65-6
Reference 19: http://www.xbrl.org/2003/role/disclosureRef
-Topic 832
-SubTopic 10
-Name Accounting Standards Codification
-Section 65
-Paragraph 1
-Subparagraph (a)
-Publisher FASB
-URI https://asc.fasb.org//1943274/2147483482/832-10-65-1
Reference 20: http://www.xbrl.org/2003/role/disclosureRef
-Topic 832
-SubTopic 10
-Name Accounting Standards Codification
-Section 65
-Paragraph 1
-Subparagraph (b)
-Publisher FASB
-URI https://asc.fasb.org//1943274/2147483482/832-10-65-1
Reference 21: http://www.xbrl.org/2003/role/disclosureRef
-Topic 805
-SubTopic 20
-Name Accounting Standards Codification
-Section 65
-Paragraph 3
-Subparagraph (a)
-Publisher FASB
-URI https://asc.fasb.org//1943274/2147479845/805-20-65-3
Reference 22: http://www.xbrl.org/2003/role/disclosureRef
-Topic 805
-SubTopic 20
-Name Accounting Standards Codification
-Section 65
-Paragraph 3
-Subparagraph (b)
-Publisher FASB
-URI https://asc.fasb.org//1943274/2147479845/805-20-65-3
Reference 23: http://www.xbrl.org/2003/role/disclosureRef
-Topic 805
-SubTopic 20
-Name Accounting Standards Codification
-Section 65
-Paragraph 3
-Subparagraph (d)
-Publisher FASB
-URI https://asc.fasb.org//1943274/2147479845/805-20-65-3
Reference 24: http://www.xbrl.org/2003/role/disclosureRef
-Topic 842
-SubTopic 10
-Name Accounting Standards Codification
-Section 65
-Paragraph 5
-Subparagraph (a)
-Publisher FASB
-URI https://asc.fasb.org//1943274/2147479832/842-10-65-5
Reference 25: http://www.xbrl.org/2003/role/disclosureRef
-Topic 842
-SubTopic 10
-Name Accounting Standards Codification
-Section 65
-Paragraph 5
-Subparagraph (b)
-Publisher FASB
-URI https://asc.fasb.org//1943274/2147479832/842-10-65-5
Reference 26: http://www.xbrl.org/2003/role/disclosureRef
-Topic 842
-SubTopic 10
-Name Accounting Standards Codification
-Section 65
-Paragraph 5
-Subparagraph (c)
-Publisher FASB
-URI https://asc.fasb.org//1943274/2147479832/842-10-65-5
Reference 27: http://www.xbrl.org/2003/role/disclosureRef
-Topic 842
-SubTopic 10
-Name Accounting Standards Codification
-Section 65
-Paragraph 5
-Subparagraph (d)(1)
-Publisher FASB
-URI https://asc.fasb.org//1943274/2147479832/842-10-65-5
Reference 28: http://www.xbrl.org/2003/role/disclosureRef
-Topic 815
-SubTopic 40
-Name Accounting Standards Codification
-Section 65
-Paragraph 2
-Subparagraph (a)
-Publisher FASB
-URI https://asc.fasb.org//1943274/2147480175/815-40-65-2
Reference 29: http://www.xbrl.org/2003/role/disclosureRef
-Topic 848
-SubTopic 10
-Name Accounting Standards Codification
-Section 65
-Paragraph 2
-Subparagraph (a)
-Publisher FASB
-URI https://asc.fasb.org//1943274/2147483550/848-10-65-2
Reference 30: http://www.xbrl.org/2003/role/disclosureRef
-Topic 848
-SubTopic 10
-Name Accounting Standards Codification
-Section 65
-Paragraph 2
-Subparagraph (a)(1)
-Publisher FASB
-URI https://asc.fasb.org//1943274/2147483550/848-10-65-2
Reference 31: http://www.xbrl.org/2003/role/disclosureRef
-Topic 848
-SubTopic 10
-Name Accounting Standards Codification
-Section 65
-Paragraph 2
-Subparagraph (a)(2)
-Publisher FASB
-URI https://asc.fasb.org//1943274/2147483550/848-10-65-2
Reference 32: http://www.xbrl.org/2003/role/disclosureRef
-Topic 848
-SubTopic 10
-Name Accounting Standards Codification
-Section 65
-Paragraph 2
-Subparagraph (a)(3)(iii)(01)
-Publisher FASB
-URI https://asc.fasb.org//1943274/2147483550/848-10-65-2
Reference 33: http://www.xbrl.org/2003/role/disclosureRef
-Topic 848
-SubTopic 10
-Name Accounting Standards Codification
-Section 65
-Paragraph 2
-Subparagraph (a)(3)(iii)(03)
-Publisher FASB
-URI https://asc.fasb.org//1943274/2147483550/848-10-65-2
Reference 34: http://www.xbrl.org/2003/role/disclosureRef
-Topic 105
-SubTopic 10
-Name Accounting Standards Codification
-Section 65
-Paragraph 6
-Subparagraph (a)
-Publisher FASB
-URI https://asc.fasb.org//1943274/2147479343/105-10-65-6
Reference 35: http://www.xbrl.org/2003/role/disclosureRef
-Topic 105
-SubTopic 10
-Name Accounting Standards Codification
-Section 65
-Paragraph 6
-Subparagraph (b)
-Publisher FASB
-URI https://asc.fasb.org//1943274/2147479343/105-10-65-6
Reference 36: http://www.xbrl.org/2003/role/disclosureRef
-Topic 105
-SubTopic 10
-Name Accounting Standards Codification
-Section 65
-Paragraph 6
-Subparagraph (c)
-Publisher FASB
-URI https://asc.fasb.org//1943274/2147479343/105-10-65-6
Reference 37: http://www.xbrl.org/2003/role/disclosureRef
-Topic 105
-SubTopic 10
-Name Accounting Standards Codification
-Section 65
-Paragraph 6
-Subparagraph (d)
-Publisher FASB
-URI https://asc.fasb.org//1943274/2147479343/105-10-65-6
Reference 38: http://www.xbrl.org/2003/role/disclosureRef
-Topic 105
-SubTopic 10
-Name Accounting Standards Codification
-Section 65
-Paragraph 6
-Subparagraph (e)
-Publisher FASB
-URI https://asc.fasb.org//1943274/2147479343/105-10-65-6
Reference 39: http://www.xbrl.org/2003/role/disclosureRef
-Topic 944
-SubTopic 40
-Name Accounting Standards Codification
-Section 65
-Paragraph 2
-Subparagraph (a)
-Publisher FASB
-URI https://asc.fasb.org//1943274/2147480016/944-40-65-2
Reference 40: http://www.xbrl.org/2003/role/disclosureRef
-Topic 944
-SubTopic 40
-Name Accounting Standards Codification
-Section 65
-Paragraph 2
-Subparagraph (b)
-Publisher FASB
-URI https://asc.fasb.org//1943274/2147480016/944-40-65-2
Reference 41: http://www.xbrl.org/2003/role/disclosureRef
-Topic 944
-SubTopic 40
-Name Accounting Standards Codification
-Section 65
-Paragraph 2
-Subparagraph (e)
-Publisher FASB
-URI https://asc.fasb.org//1943274/2147480016/944-40-65-2
Reference 42: http://www.xbrl.org/2003/role/disclosureRef
-Topic 944
-SubTopic 40
-Name Accounting Standards Codification
-Section 65
-Paragraph 2
-Subparagraph (f)(1)
-Publisher FASB
-URI https://asc.fasb.org//1943274/2147480016/944-40-65-2
Reference 43: http://www.xbrl.org/2003/role/disclosureRef
-Topic 944
-SubTopic 40
-Name Accounting Standards Codification
-Section 65
-Paragraph 2
-Subparagraph (f)(2)
-Publisher FASB
-URI https://asc.fasb.org//1943274/2147480016/944-40-65-2
Reference 44: http://www.xbrl.org/2003/role/disclosureRef
-Topic 944
-SubTopic 40
-Name Accounting Standards Codification
-Section 65
-Paragraph 2
-Subparagraph (g)(1)
-Publisher FASB
-URI https://asc.fasb.org//1943274/2147480016/944-40-65-2
Reference 45: http://www.xbrl.org/2003/role/disclosureRef
-Topic 944
-SubTopic 40
-Name Accounting Standards Codification
-Section 65
-Paragraph 2
-Subparagraph (g)(2)(i)
-Publisher FASB
-URI https://asc.fasb.org//1943274/2147480016/944-40-65-2
Reference 46: http://www.xbrl.org/2003/role/disclosureRef
-Topic 944
-SubTopic 40
-Name Accounting Standards Codification
-Section 65
-Paragraph 2
-Subparagraph (g)(2)(ii)
-Publisher FASB
-URI https://asc.fasb.org//1943274/2147480016/944-40-65-2
Reference 47: http://www.xbrl.org/2003/role/disclosureRef
-Topic 944
-SubTopic 40
-Name Accounting Standards Codification
-Section 65
-Paragraph 2
-Subparagraph (g)(2)(iii)
-Publisher FASB
-URI https://asc.fasb.org//1943274/2147480016/944-40-65-2
Reference 48: http://www.xbrl.org/2003/role/disclosureRef
-Topic 944
-SubTopic 40
-Name Accounting Standards Codification
-Section 65
-Paragraph 2
-Subparagraph (g)(2)(iv)
-Publisher FASB
-URI https://asc.fasb.org//1943274/2147480016/944-40-65-2
Reference 49: http://www.xbrl.org/2003/role/disclosureRef
-Topic 944
-SubTopic 40
-Name Accounting Standards Codification
-Section 65
-Paragraph 2
-Subparagraph (h)(1)
-Publisher FASB
-URI https://asc.fasb.org//1943274/2147480016/944-40-65-2
Reference 50: http://www.xbrl.org/2003/role/disclosureRef
-Topic 944
-SubTopic 40
-Name Accounting Standards Codification
-Section 65
-Paragraph 2
-Subparagraph (h)(2)
-Publisher FASB
-URI https://asc.fasb.org//1943274/2147480016/944-40-65-2
Reference 51: http://www.xbrl.org/2003/role/disclosureRef
-Topic 250
-SubTopic 10
-Name Accounting Standards Codification
-Section S99
-Paragraph 5
-Subparagraph (SAB Topic 11.M.Q2)
-Publisher FASB
-URI https://asc.fasb.org//1943274/2147480530/250-10-S99-5
Reference 52: http://www.xbrl.org/2003/role/disclosureRef
-Topic 326
-SubTopic 10
-Name Accounting Standards Codification
-Section 65
-Paragraph 4
-Subparagraph (a)
-Publisher FASB
-URI https://asc.fasb.org//1943274/2147479654/326-10-65-4
Reference 53: http://www.xbrl.org/2003/role/disclosureRef
-Topic 326
-SubTopic 10
-Name Accounting Standards Codification
-Section 65
-Paragraph 4
-Subparagraph (b)
-Publisher FASB
-URI https://asc.fasb.org//1943274/2147479654/326-10-65-4
Reference 54: http://www.xbrl.org/2003/role/disclosureRef
-Topic 326
-SubTopic 10
-Name Accounting Standards Codification
-Section 65
-Paragraph 4
-Subparagraph (c)
-Publisher FASB
-URI https://asc.fasb.org//1943274/2147479654/326-10-65-4
Reference 55: http://www.xbrl.org/2003/role/disclosureRef
-Topic 740
-SubTopic 10
-Name Accounting Standards Codification
-Section 65
-Paragraph 8
-Subparagraph (a)
-Publisher FASB
-URI https://asc.fasb.org//1943274/2147482615/740-10-65-8
Reference 56: http://www.xbrl.org/2003/role/disclosureRef
-Topic 740
-SubTopic 10
-Name Accounting Standards Codification
-Section 65
-Paragraph 8
-Subparagraph (b)
-Publisher FASB
-URI https://asc.fasb.org//1943274/2147482615/740-10-65-8
Reference 57: http://www.xbrl.org/2003/role/disclosureRef
-Topic 740
-SubTopic 10
-Name Accounting Standards Codification
-Section 65
-Paragraph 8
-Subparagraph (d)(2)
-Publisher FASB
-URI https://asc.fasb.org//1943274/2147482615/740-10-65-8
Reference 58: http://www.xbrl.org/2003/role/disclosureRef
-Topic 740
-SubTopic 10
-Name Accounting Standards Codification
-Section 65
-Paragraph 8
-Subparagraph (d)(3)
-Publisher FASB
-URI https://asc.fasb.org//1943274/2147482615/740-10-65-8
Reference 59: http://www.xbrl.org/2003/role/disclosureRef
-Topic 326
-SubTopic 10
-Name Accounting Standards Codification
-Section 65
-Paragraph 4
-Subparagraph (d)
-Publisher FASB
-URI https://asc.fasb.org//1943274/2147479654/326-10-65-4
Reference 60: http://www.xbrl.org/2003/role/disclosureRef
-Topic 326
-SubTopic 10
-Name Accounting Standards Codification
-Section 65
-Paragraph 4
-Subparagraph (e)(3)
-Publisher FASB
-URI https://asc.fasb.org//1943274/2147479654/326-10-65-4
Reference 61: http://www.xbrl.org/2003/role/disclosureRef
-Topic 326
-SubTopic 10
-Name Accounting Standards Codification
-Section 65
-Paragraph 4
-Subparagraph (e)(4)
-Publisher FASB
-URI https://asc.fasb.org//1943274/2147479654/326-10-65-4
Reference 62: http://www.xbrl.org/2003/role/disclosureRef
-Topic 718
-SubTopic 10
-Name Accounting Standards Codification
-Section 65
-Paragraph 15
-Subparagraph (e)
-Publisher FASB
-URI https://asc.fasb.org//1943274/2147480336/718-10-65-15
Reference 63: http://www.xbrl.org/2003/role/disclosureRef
-Topic 718
-SubTopic 10
-Name Accounting Standards Codification
-Section 65
-Paragraph 15
-Subparagraph (f)(1)
-Publisher FASB
-URI https://asc.fasb.org//1943274/2147480336/718-10-65-15
Reference 64: http://www.xbrl.org/2003/role/disclosureRef
-Topic 718
-SubTopic 10
-Name Accounting Standards Codification
-Section 65
-Paragraph 15
-Subparagraph (f)(2)
-Publisher FASB
-URI https://asc.fasb.org//1943274/2147480336/718-10-65-15
Reference 65: http://www.xbrl.org/2003/role/disclosureRef
-Topic 926
-SubTopic 20
-Name Accounting Standards Codification
-Section 65
-Paragraph 2
-Subparagraph (a)
-Publisher FASB
-URI https://asc.fasb.org//1943274/2147483194/926-20-65-2
Reference 66: http://www.xbrl.org/2003/role/disclosureRef
-Topic 926
-SubTopic 20
-Name Accounting Standards Codification
-Section 65
-Paragraph 2
-Subparagraph (b)
-Publisher FASB
-URI https://asc.fasb.org//1943274/2147483194/926-20-65-2
Reference 67: http://www.xbrl.org/2003/role/disclosureRef
-Topic 926
-SubTopic 20
-Name Accounting Standards Codification
-Section 65
-Paragraph 2
-Subparagraph (c)
-Publisher FASB
-URI https://asc.fasb.org//1943274/2147483194/926-20-65-2
Reference 68: http://www.xbrl.org/2003/role/disclosureRef
-Topic 250
-SubTopic 10
-Name Accounting Standards Codification
-Section 50
-Paragraph 3
-Publisher FASB
-URI https://asc.fasb.org//1943274/2147483443/250-10-50-3
Reference 69: http://www.xbrl.org/2003/role/disclosureRef
-Topic 250
-SubTopic 10
-Name Accounting Standards Codification
-Section 50
-Paragraph 1
-Subparagraph (b)(2)
-Publisher FASB
-URI https://asc.fasb.org//1943274/2147483443/250-10-50-1
Reference 70: http://www.xbrl.org/2003/role/disclosureRef
-Topic 250
-SubTopic 10
-Name Accounting Standards Codification
-Section 50
-Paragraph 1
-Subparagraph (b)(3)
-Publisher FASB
-URI https://asc.fasb.org//1943274/2147483443/250-10-50-1
Reference 71: http://www.xbrl.org/2003/role/disclosureRef
-Topic 250
-SubTopic 10
-Name Accounting Standards Codification
-Section 50
-Paragraph 1
-Subparagraph (b)(4)
-Publisher FASB
-URI https://asc.fasb.org//1943274/2147483443/250-10-50-1
Reference 72: http://www.xbrl.org/2003/role/disclosureRef
-Topic 250
-SubTopic 10
-Name Accounting Standards Codification
-Section 50
-Paragraph 1
-Subparagraph (c)(2)
-Publisher FASB
-URI https://asc.fasb.org//1943274/2147483443/250-10-50-1
Reference 73: http://www.xbrl.org/2003/role/disclosureRef
-Topic 260
-SubTopic 10
-Name Accounting Standards Codification
-Section 55
-Paragraph 15
-Publisher FASB
-URI https://asc.fasb.org//1943274/2147482635/260-10-55-15
Reference 74: http://www.xbrl.org/2003/role/disclosureRef
-Topic 250
-SubTopic 10
-Name Accounting Standards Codification
-Section 45
-Paragraph 6
-Publisher FASB
-URI https://asc.fasb.org//1943274/2147483421/250-10-45-6
Reference 75: http://www.xbrl.org/2003/role/disclosureRef
-Topic 825
-SubTopic 10
-Name Accounting Standards Codification
-Section 65
-Paragraph 6
-Subparagraph (a)
-Publisher FASB
-URI https://asc.fasb.org//1943274/2147482833/825-10-65-6
Reference 76: http://www.xbrl.org/2003/role/disclosureRef
-Topic 825
-SubTopic 10
-Name Accounting Standards Codification
-Section 65
-Paragraph 6
-Subparagraph (b)
-Publisher FASB
-URI https://asc.fasb.org//1943274/2147482833/825-10-65-6
Reference 77: http://www.xbrl.org/2003/role/disclosureRef
-Topic 825
-SubTopic 10
-Name Accounting Standards Codification
-Section 65
-Paragraph 6
-Subparagraph (c)(1)
-Publisher FASB
-URI https://asc.fasb.org//1943274/2147482833/825-10-65-6
Reference 78: http://www.xbrl.org/2003/role/disclosureRef
-Topic 825
-SubTopic 10
-Name Accounting Standards Codification
-Section 65
-Paragraph 6
-Subparagraph (c)(2)
-Publisher FASB
-URI https://asc.fasb.org//1943274/2147482833/825-10-65-6
Reference 79: http://www.xbrl.org/2003/role/disclosureRef
-Topic 815
-SubTopic 40
-Name Accounting Standards Codification
-Section 65
-Paragraph 1
-Subparagraph (a)(1)
-Publisher FASB
-URI https://asc.fasb.org//1943274/2147480175/815-40-65-1
Reference 80: http://www.xbrl.org/2003/role/disclosureRef
-Topic 815
-SubTopic 40
-Name Accounting Standards Codification
-Section 65
-Paragraph 1
-Subparagraph (a)(2)
-Publisher FASB
-URI https://asc.fasb.org//1943274/2147480175/815-40-65-1
Reference 81: http://www.xbrl.org/2003/role/disclosureRef
-Topic 815
-SubTopic 40
-Name Accounting Standards Codification
-Section 65
-Paragraph 1
-Subparagraph (a)(3)
-Publisher FASB
-URI https://asc.fasb.org//1943274/2147480175/815-40-65-1
Reference 82: http://www.xbrl.org/2003/role/disclosureRef
-Topic 815
-SubTopic 40
-Name Accounting Standards Codification
-Section 65
-Paragraph 1
-Subparagraph (b)(1)
-Publisher FASB
-URI https://asc.fasb.org//1943274/2147480175/815-40-65-1
Reference 83: http://www.xbrl.org/2003/role/disclosureRef
-Topic 815
-SubTopic 40
-Name Accounting Standards Codification
-Section 65
-Paragraph 1
-Subparagraph (b)(2)
-Publisher FASB
-URI https://asc.fasb.org//1943274/2147480175/815-40-65-1
Reference 84: http://www.xbrl.org/2003/role/disclosureRef
-Topic 815
-SubTopic 40
-Name Accounting Standards Codification
-Section 65
-Paragraph 1
-Subparagraph (c)
-Publisher FASB
-URI https://asc.fasb.org//1943274/2147480175/815-40-65-1
Reference 85: http://www.xbrl.org/2003/role/disclosureRef
-Topic 815
-SubTopic 40
-Name Accounting Standards Codification
-Section 65
-Paragraph 1
-Subparagraph (d)
-Publisher FASB
-URI https://asc.fasb.org//1943274/2147480175/815-40-65-1
Reference 86: http://www.xbrl.org/2003/role/disclosureRef
-Topic 815
-SubTopic 40
-Name Accounting Standards Codification
-Section 65
-Paragraph 1
-Subparagraph (e)(2)
-Publisher FASB
-URI https://asc.fasb.org//1943274/2147480175/815-40-65-1
Reference 87: http://www.xbrl.org/2003/role/disclosureRef
-Topic 815
-SubTopic 40
-Name Accounting Standards Codification
-Section 65
-Paragraph 1
-Subparagraph (e)(3)
-Publisher FASB
-URI https://asc.fasb.org//1943274/2147480175/815-40-65-1
Reference 88: http://www.xbrl.org/2003/role/disclosureRef
-Topic 815
-SubTopic 40
-Name Accounting Standards Codification
-Section 65
-Paragraph 1
-Subparagraph (e)(4)
-Publisher FASB
-URI https://asc.fasb.org//1943274/2147480175/815-40-65-1
Reference 89: http://www.xbrl.org/2003/role/disclosureRef
-Topic 815
-SubTopic 40
-Name Accounting Standards Codification
-Section 65
-Paragraph 1
-Subparagraph (f)
-Publisher FASB
-URI https://asc.fasb.org//1943274/2147480175/815-40-65-1
Reference 90: http://www.xbrl.org/2003/role/disclosureRef
-Topic 310
-SubTopic 20
-Name Accounting Standards Codification
-Section 65
-Paragraph 2
-Subparagraph (a)
-Publisher FASB
-URI https://asc.fasb.org//1943274/2147481925/310-20-65-2
Reference 91: http://www.xbrl.org/2003/role/disclosureRef
-Topic 310
-SubTopic 20
-Name Accounting Standards Codification
-Section 65
-Paragraph 2
-Subparagraph (b)
-Publisher FASB
-URI https://asc.fasb.org//1943274/2147481925/310-20-65-2
Reference 92: http://www.xbrl.org/2003/role/disclosureRef
-Topic 946
-SubTopic 10
-Name Accounting Standards Codification
-Section 50
-Paragraph 3
-Publisher FASB
-URI https://asc.fasb.org//1943274/2147480424/946-10-50-3
| Name: |
us-gaap_NewAccountingPronouncementsOrChangeInAccountingPrincipleLineItems |
| Namespace Prefix: |
us-gaap_ |
| Data Type: |
xbrli:stringItemType |
| Balance Type: |
na |
| Period Type: |
duration |
|
| X |
- DefinitionPresent value of lessee's discounted obligation for lease payments from operating lease, classified as current. Reference 1: http://www.xbrl.org/2003/role/disclosureRef
-Topic 842
-SubTopic 20
-Name Accounting Standards Codification
-Section 45
-Paragraph 1
-Subparagraph (b)
-Publisher FASB
-URI https://asc.fasb.org//1943274/2147479041/842-20-45-1
| Name: |
us-gaap_OperatingLeaseLiabilityCurrent |
| Namespace Prefix: |
us-gaap_ |
| Data Type: |
xbrli:monetaryItemType |
| Balance Type: |
credit |
| Period Type: |
instant |
|
| X |
- DefinitionPresent value of lessee's discounted obligation for lease payments from operating lease, classified as noncurrent. Reference 1: http://www.xbrl.org/2003/role/disclosureRef
-Topic 842
-SubTopic 20
-Name Accounting Standards Codification
-Section 45
-Paragraph 1
-Subparagraph (b)
-Publisher FASB
-URI https://asc.fasb.org//1943274/2147479041/842-20-45-1
| Name: |
us-gaap_OperatingLeaseLiabilityNoncurrent |
| Namespace Prefix: |
us-gaap_ |
| Data Type: |
xbrli:monetaryItemType |
| Balance Type: |
credit |
| Period Type: |
instant |
|
| X |
- DefinitionAmount of lessee's right to use underlying asset under operating lease. Reference 1: http://www.xbrl.org/2003/role/disclosureRef
-Topic 842
-SubTopic 20
-Name Accounting Standards Codification
-Section 45
-Paragraph 1
-Subparagraph (a)
-Publisher FASB
-URI https://asc.fasb.org//1943274/2147479041/842-20-45-1
| Name: |
us-gaap_OperatingLeaseRightOfUseAsset |
| Namespace Prefix: |
us-gaap_ |
| Data Type: |
xbrli:monetaryItemType |
| Balance Type: |
debit |
| Period Type: |
instant |
|
| X |
- DefinitionAmount after accumulated amortization of finite-lived and indefinite-lived intangible assets classified as other.
| Name: |
us-gaap_OtherIntangibleAssetsNet |
| Namespace Prefix: |
us-gaap_ |
| Data Type: |
xbrli:monetaryItemType |
| Balance Type: |
debit |
| Period Type: |
instant |
|
| X |
- DefinitionAmount, excluding tax collected from customer, of revenue from satisfaction of performance obligation by transferring promised good or service to customer. Tax collected from customer is tax assessed by governmental authority that is both imposed on and concurrent with specific revenue-producing transaction, including, but not limited to, sales, use, value added and excise. Reference 1: http://www.xbrl.org/2003/role/disclosureRef
-Topic 924
-SubTopic 10
-Name Accounting Standards Codification
-Section S99
-Paragraph 1
-Subparagraph (SAB Topic 11.L)
-Publisher FASB
-URI https://asc.fasb.org//1943274/2147479941/924-10-S99-1
Reference 2: http://www.xbrl.org/2003/role/disclosureRef
-Topic 606
-SubTopic 10
-Name Accounting Standards Codification
-Section 50
-Paragraph 5
-Publisher FASB
-URI https://asc.fasb.org//1943274/2147479806/606-10-50-5
Reference 3: http://www.xbrl.org/2003/role/disclosureRef
-Topic 280
-SubTopic 10
-Name Accounting Standards Codification
-Section 50
-Paragraph 30
-Subparagraph (a)
-Publisher FASB
-URI https://asc.fasb.org//1943274/2147482810/280-10-50-30
Reference 4: http://www.xbrl.org/2003/role/disclosureRef
-Topic 280
-SubTopic 10
-Name Accounting Standards Codification
-Section 50
-Paragraph 42
-Publisher FASB
-URI https://asc.fasb.org//1943274/2147482810/280-10-50-42
Reference 5: http://www.xbrl.org/2003/role/disclosureRef
-Topic 280
-SubTopic 10
-Name Accounting Standards Codification
-Section 50
-Paragraph 22
-Subparagraph (b)
-Publisher FASB
-URI https://asc.fasb.org//1943274/2147482810/280-10-50-22
Reference 6: http://www.xbrl.org/2003/role/disclosureRef
-Topic 280
-SubTopic 10
-Name Accounting Standards Codification
-Section 50
-Paragraph 32
-Subparagraph (b)
-Publisher FASB
-URI https://asc.fasb.org//1943274/2147482810/280-10-50-32
Reference 7: http://www.xbrl.org/2003/role/disclosureRef
-Topic 280
-SubTopic 10
-Name Accounting Standards Codification
-Section 50
-Paragraph 40
-Publisher FASB
-URI https://asc.fasb.org//1943274/2147482810/280-10-50-40
Reference 8: http://www.xbrl.org/2003/role/disclosureRef
-Topic 280
-SubTopic 10
-Name Accounting Standards Codification
-Section 50
-Paragraph 22
-Subparagraph (a)
-Publisher FASB
-URI https://asc.fasb.org//1943274/2147482810/280-10-50-22
Reference 9: http://www.xbrl.org/2003/role/disclosureRef
-Topic 280
-SubTopic 10
-Name Accounting Standards Codification
-Section 50
-Paragraph 32
-Subparagraph (a)
-Publisher FASB
-URI https://asc.fasb.org//1943274/2147482810/280-10-50-32
Reference 10: http://www.xbrl.org/2003/role/disclosureRef
-Topic 280
-SubTopic 10
-Name Accounting Standards Codification
-Section 50
-Paragraph 41
-Subparagraph (a)
-Publisher FASB
-URI https://asc.fasb.org//1943274/2147482810/280-10-50-41
Reference 11: http://www.xbrl.org/2003/role/disclosureRef
-Topic 606
-SubTopic 10
-Name Accounting Standards Codification
-Section 50
-Paragraph 4
-Subparagraph (a)
-Publisher FASB
-URI https://asc.fasb.org//1943274/2147479806/606-10-50-4
| Name: |
us-gaap_RevenueFromContractWithCustomerExcludingAssessedTax |
| Namespace Prefix: |
us-gaap_ |
| Data Type: |
xbrli:monetaryItemType |
| Balance Type: |
credit |
| Period Type: |
duration |
|
| X |
- DefinitionThe aggregate total costs related to selling a firm's product and services, as well as all other general and administrative expenses. Direct selling expenses (for example, credit, warranty, and advertising) are expenses that can be directly linked to the sale of specific products. Indirect selling expenses are expenses that cannot be directly linked to the sale of specific products, for example telephone expenses, Internet, and postal charges. General and administrative expenses include salaries of non-sales personnel, rent, utilities, communication, etc. Reference 1: http://fasb.org/us-gaap/role/ref/legacyRef
-Topic 220
-SubTopic 10
-Name Accounting Standards Codification
-Section S99
-Paragraph 2
-Subparagraph (SX 210.5-03.4)
-Publisher FASB
-URI https://asc.fasb.org//1943274/2147483621/220-10-S99-2
| Name: |
us-gaap_SellingGeneralAndAdministrativeExpense |
| Namespace Prefix: |
us-gaap_ |
| Data Type: |
xbrli:monetaryItemType |
| Balance Type: |
debit |
| Period Type: |
duration |
|
| X |
- Details
| Name: |
srt_ProductOrServiceAxis=us-gaap_ServiceMember |
| Namespace Prefix: |
|
| Data Type: |
na |
| Balance Type: |
|
| Period Type: |
|
|
| X |
- Details
| Name: |
srt_ProductOrServiceAxis=INSE_ProductSalesMember |
| Namespace Prefix: |
|
| Data Type: |
na |
| Balance Type: |
|
| Period Type: |
|
|
| X |
- Details
| Name: |
srt_RestatementAxis=srt_RestatementAdjustmentMember |
| Namespace Prefix: |
|
| Data Type: |
na |
| Balance Type: |
|
| Period Type: |
|
|
| X |
- Details
| Name: |
us-gaap_ContractWithCustomerDurationAxis=us-gaap_ShortTermContractWithCustomerMember |
| Namespace Prefix: |
|
| Data Type: |
na |
| Balance Type: |
|
| Period Type: |
|
|
| X |
- Details
| Name: |
us-gaap_PropertyPlantAndEquipmentByTypeAxis=us-gaap_SoftwareDevelopmentMember |
| Namespace Prefix: |
|
| Data Type: |
na |
| Balance Type: |
|
| Period Type: |
|
|
| X |
- Details
| Name: |
us-gaap_PropertyPlantAndEquipmentByTypeAxis=INSE_CapitalizedSoftwareMember |
| Namespace Prefix: |
|
| Data Type: |
na |
| Balance Type: |
|
| Period Type: |
|
|
| X |
- Details
| Name: |
srt_RestatementAxis=INSE_PreviousRevisionMember |
| Namespace Prefix: |
|
| Data Type: |
na |
| Balance Type: |
|
| Period Type: |
|
|
| X |
- Details
| Name: |
srt_RestatementAxis=srt_RevisionOfPriorPeriodAccountingStandardsUpdateAdjustmentMember |
| Namespace Prefix: |
|
| Data Type: |
na |
| Balance Type: |
|
| Period Type: |
|
|
| X |
- Details
| Name: |
srt_RestatementAxis=srt_RevisionOfPriorPeriodReclassificationAdjustmentMember |
| Namespace Prefix: |
|
| Data Type: |
na |
| Balance Type: |
|
| Period Type: |
|
|
| X |
- Details
| Name: |
us-gaap_BalanceSheetLocationAxis=us-gaap_AccumulatedOtherComprehensiveIncomeMember |
| Namespace Prefix: |
|
| Data Type: |
na |
| Balance Type: |
|
| Period Type: |
|
|
| X |
- Details
| Name: |
us-gaap_BalanceSheetLocationAxis=us-gaap_OtherNoncurrentLiabilitiesMember |
| Namespace Prefix: |
|
| Data Type: |
na |
| Balance Type: |
|
| Period Type: |
|
|
v3.24.0.1
| X |
- References
+ Details
| Name: |
us-gaap_BusinessCombinationAndAssetAcquisitionAbstract |
| Namespace Prefix: |
us-gaap_ |
| Data Type: |
xbrli:stringItemType |
| Balance Type: |
na |
| Period Type: |
duration |
|
| X |
- DefinitionAmount of gain (loss) on sale or disposal of property, plant and equipment assets, excluding oil and gas property and timber property. Reference 1: http://www.xbrl.org/2009/role/commonPracticeRef
-Topic 230
-SubTopic 10
-Name Accounting Standards Codification
-Section 45
-Paragraph 28
-Subparagraph (b)
-Publisher FASB
-URI https://asc.fasb.org//1943274/2147482740/230-10-45-28
Reference 2: http://www.xbrl.org/2009/role/commonPracticeRef
-Topic 360
-SubTopic 10
-Name Accounting Standards Codification
-Section 45
-Paragraph 5
-Publisher FASB
-URI https://asc.fasb.org//1943274/2147482130/360-10-45-5
Reference 3: http://www.xbrl.org/2009/role/commonPracticeRef
-Topic 360
-SubTopic 10
-Name Accounting Standards Codification
-Section 50
-Paragraph 3
-Subparagraph (c)
-Publisher FASB
-URI https://asc.fasb.org//1943274/2147482099/360-10-50-3
| Name: |
us-gaap_GainLossOnDispositionOfAssets |
| Namespace Prefix: |
us-gaap_ |
| Data Type: |
xbrli:monetaryItemType |
| Balance Type: |
credit |
| Period Type: |
duration |
|
| X |
- DefinitionThe cash inflow from the issuance of common stock, preferred stock, treasury stock, stock options, and other types of equity. Reference 1: http://fasb.org/us-gaap/role/ref/legacyRef
-Name Accounting Standards Codification
-Section 45
-Paragraph 14
-Subparagraph (a)
-SubTopic 10
-Topic 230
-Publisher FASB
-URI https://asc.fasb.org//1943274/2147482740/230-10-45-14
Reference 2: http://www.xbrl.org/2003/role/disclosureRef
-Topic 946
-SubTopic 10
-Name Accounting Standards Codification
-Section S99
-Paragraph 3
-Subparagraph (SX 210.6-03(i)(1))
-Publisher FASB
-URI https://asc.fasb.org//1943274/2147479886/946-10-S99-3
| Name: |
us-gaap_ProceedsFromIssuanceOrSaleOfEquity |
| Namespace Prefix: |
us-gaap_ |
| Data Type: |
xbrli:monetaryItemType |
| Balance Type: |
debit |
| Period Type: |
duration |
|
v3.24.0.1
| X |
- DefinitionAllowance for doubtful accounts foreign currency translation adjustments.
| Name: |
INSE_AllowanceForDoubtfulAccountsForeignCurrencyTranslationAdjustments |
| Namespace Prefix: |
INSE_ |
| Data Type: |
xbrli:monetaryItemType |
| Balance Type: |
credit |
| Period Type: |
duration |
|
| X |
- DefinitionAmount of allowance for credit loss on accounts receivable. Reference 1: http://www.xbrl.org/2009/role/commonPracticeRef
-Topic 944
-SubTopic 210
-Name Accounting Standards Codification
-Section S99
-Paragraph 1
-Subparagraph (SX 210.7-03(a)(5))
-Publisher FASB
-URI https://asc.fasb.org//1943274/2147479440/944-210-S99-1
Reference 2: http://www.xbrl.org/2003/role/disclosureRef
-Topic 210
-SubTopic 10
-Name Accounting Standards Codification
-Section S99
-Paragraph 1
-Subparagraph (SX 210.5-02(4))
-Publisher FASB
-URI https://asc.fasb.org//1943274/2147480566/210-10-S99-1
Reference 3: http://www.xbrl.org/2003/role/disclosureRef
-Topic 326
-SubTopic 20
-Name Accounting Standards Codification
-Section 45
-Paragraph 1
-Publisher FASB
-URI https://asc.fasb.org//1943274/2147479344/326-20-45-1
Reference 4: http://www.xbrl.org/2003/role/disclosureRef
-Topic 310
-SubTopic 10
-Name Accounting Standards Codification
-Section 50
-Paragraph 4
-Publisher FASB
-URI https://asc.fasb.org//1943274/2147481962/310-10-50-4
Reference 5: http://www.xbrl.org/2003/role/disclosureRef
-Topic 326
-SubTopic 20
-Name Accounting Standards Codification
-Section 50
-Paragraph 13
-Subparagraph (a)
-Publisher FASB
-URI https://asc.fasb.org//1943274/2147479319/326-20-50-13
Reference 6: http://www.xbrl.org/2003/role/disclosureRef
-Topic 326
-SubTopic 20
-Name Accounting Standards Codification
-Section 50
-Paragraph 13
-Subparagraph (f)
-Publisher FASB
-URI https://asc.fasb.org//1943274/2147479319/326-20-50-13
| Name: |
us-gaap_AllowanceForDoubtfulAccountsReceivable |
| Namespace Prefix: |
us-gaap_ |
| Data Type: |
xbrli:monetaryItemType |
| Balance Type: |
credit |
| Period Type: |
instant |
|
| X |
- DefinitionAmount of increase in allowance for credit loss on accounts receivable, from recovery. Reference 1: http://www.xbrl.org/2003/role/disclosureRef
-Topic 326
-SubTopic 20
-Name Accounting Standards Codification
-Section 50
-Paragraph 13
-Subparagraph (e)
-Publisher FASB
-URI https://asc.fasb.org//1943274/2147479319/326-20-50-13
| Name: |
us-gaap_AllowanceForDoubtfulAccountsReceivableRecoveries |
| Namespace Prefix: |
us-gaap_ |
| Data Type: |
xbrli:monetaryItemType |
| Balance Type: |
credit |
| Period Type: |
duration |
|
| X |
- DefinitionAmount of direct write-downs of accounts receivable charged against the allowance. Reference 1: http://www.xbrl.org/2003/role/disclosureRef
-Topic 326
-SubTopic 20
-Name Accounting Standards Codification
-Section 50
-Paragraph 13
-Subparagraph (d)
-Publisher FASB
-URI https://asc.fasb.org//1943274/2147479319/326-20-50-13
| Name: |
us-gaap_AllowanceForDoubtfulAccountsReceivableWriteOffs |
| Namespace Prefix: |
us-gaap_ |
| Data Type: |
xbrli:monetaryItemType |
| Balance Type: |
debit |
| Period Type: |
duration |
|
| X |
- DefinitionAmount of expense (reversal of expense) for expected credit loss on accounts receivable. Reference 1: http://www.xbrl.org/2003/role/disclosureRef
-Topic 326
-SubTopic 20
-Name Accounting Standards Codification
-Section 50
-Paragraph 13
-Subparagraph (b)
-Publisher FASB
-URI https://asc.fasb.org//1943274/2147479319/326-20-50-13
Reference 2: http://www.xbrl.org/2003/role/disclosureRef
-Topic 220
-SubTopic 10
-Name Accounting Standards Codification
-Section S99
-Paragraph 2
-Subparagraph (SX 210.5-03(5))
-Publisher FASB
-URI https://asc.fasb.org//1943274/2147483621/220-10-S99-2
| Name: |
us-gaap_ProvisionForDoubtfulAccounts |
| Namespace Prefix: |
us-gaap_ |
| Data Type: |
xbrli:monetaryItemType |
| Balance Type: |
debit |
| Period Type: |
duration |
|
| X |
- References
+ Details
| Name: |
us-gaap_ReceivablesAbstract |
| Namespace Prefix: |
us-gaap_ |
| Data Type: |
xbrli:stringItemType |
| Balance Type: |
na |
| Period Type: |
duration |
|
v3.24.0.1
| X |
- References
+ Details
| Name: |
us-gaap_InventoryDisclosureAbstract |
| Namespace Prefix: |
us-gaap_ |
| Data Type: |
xbrli:stringItemType |
| Balance Type: |
na |
| Period Type: |
duration |
|
| X |
- DefinitionAmount before valuation and LIFO reserves of completed merchandise or goods expected to be sold within one year or operating cycle, if longer. Reference 1: http://www.xbrl.org/2009/role/commonPracticeRef
-Topic 210
-SubTopic 10
-Name Accounting Standards Codification
-Section S99
-Paragraph 1
-Subparagraph (SX 210.5-02(6)(a)(1))
-Publisher FASB
-URI https://asc.fasb.org//1943274/2147480566/210-10-S99-1
| Name: |
us-gaap_InventoryFinishedGoods |
| Namespace Prefix: |
us-gaap_ |
| Data Type: |
xbrli:monetaryItemType |
| Balance Type: |
debit |
| Period Type: |
instant |
|
| X |
- DefinitionAmount after valuation and LIFO reserves of inventory expected to be sold, or consumed within one year or operating cycle, if longer. Reference 1: http://www.xbrl.org/2003/role/exampleRef
-Topic 852
-SubTopic 10
-Name Accounting Standards Codification
-Section 55
-Paragraph 10
-Publisher FASB
-URI https://asc.fasb.org//1943274/2147481372/852-10-55-10
Reference 2: http://www.xbrl.org/2003/role/exampleRef
-Topic 210
-SubTopic 10
-Name Accounting Standards Codification
-Section 45
-Paragraph 1
-Subparagraph (b)
-Publisher FASB
-URI https://asc.fasb.org//1943274/2147483467/210-10-45-1
Reference 3: http://www.xbrl.org/2003/role/disclosureRef
-Topic 210
-SubTopic 10
-Name Accounting Standards Codification
-Section S99
-Paragraph 1
-Subparagraph (SX 210.5-02(6))
-Publisher FASB
-URI https://asc.fasb.org//1943274/2147480566/210-10-S99-1
| Name: |
us-gaap_InventoryNet |
| Namespace Prefix: |
us-gaap_ |
| Data Type: |
xbrli:monetaryItemType |
| Balance Type: |
debit |
| Period Type: |
instant |
|
| X |
- DefinitionCarrying amount, net of valuation reserves and adjustments, as of the balance sheet date for elements of machinery or equipment held for the purpose of replacing similar parts in the course of repair or maintenance. Reference 1: http://www.xbrl.org/2009/role/commonPracticeRef
-Topic 210
-SubTopic 10
-Name Accounting Standards Codification
-Section S99
-Paragraph 1
-Subparagraph (SX 210.5-02(6)(a))
-Publisher FASB
-URI https://asc.fasb.org//1943274/2147480566/210-10-S99-1
Reference 2: http://fasb.org/us-gaap/role/ref/legacyRef
-Name Accounting Standards Codification
-Topic 330
-SubTopic 10
-Section S99
-Paragraph 2
-Subparagraph (SAB TOPIC 5.BB)
-Publisher FASB
-URI https://asc.fasb.org//1943274/2147480581/330-10-S99-2
| Name: |
us-gaap_InventoryPartsAndComponentsNetOfReserves |
| Namespace Prefix: |
us-gaap_ |
| Data Type: |
xbrli:monetaryItemType |
| Balance Type: |
debit |
| Period Type: |
instant |
|
| X |
- DefinitionAmount before valuation and LIFO reserves of merchandise or goods in the production process expected to be completed within one year or operating cycle, if longer. Reference 1: http://www.xbrl.org/2009/role/commonPracticeRef
-Topic 210
-SubTopic 10
-Name Accounting Standards Codification
-Section S99
-Paragraph 1
-Subparagraph (SX 210.5-02(6)(a)(3))
-Publisher FASB
-URI https://asc.fasb.org//1943274/2147480566/210-10-S99-1
| Name: |
us-gaap_InventoryWorkInProcess |
| Namespace Prefix: |
us-gaap_ |
| Data Type: |
xbrli:monetaryItemType |
| Balance Type: |
debit |
| Period Type: |
instant |
|
v3.24.0.1
| X |
- DefinitionContract liabilities and other disclosures customer prepayments and deposits.
| Name: |
INSE_CustomerPrepaymentsAndDeposits |
| Namespace Prefix: |
INSE_ |
| Data Type: |
xbrli:monetaryItemType |
| Balance Type: |
credit |
| Period Type: |
instant |
|
| X |
- References
+ Details
| Name: |
INSE_DisclosureContractLiabilitiesAndOtherDisclosuresAsRestatedAbstract |
| Namespace Prefix: |
INSE_ |
| Data Type: |
xbrli:stringItemType |
| Balance Type: |
na |
| Period Type: |
duration |
|
| X |
- DefinitionAmount, after allowance for credit loss, of right to consideration in exchange for good or service transferred to customer when right to consideration is unconditional, classified as current. Reference 1: http://www.xbrl.org/2003/role/disclosureRef
-Topic 606
-SubTopic 10
-Name Accounting Standards Codification
-Section 45
-Paragraph 4
-Publisher FASB
-URI https://asc.fasb.org//1943274/2147479837/606-10-45-4
Reference 2: http://www.xbrl.org/2003/role/disclosureRef
-Topic 606
-SubTopic 10
-Name Accounting Standards Codification
-Section 45
-Paragraph 1
-Publisher FASB
-URI https://asc.fasb.org//1943274/2147479837/606-10-45-1
Reference 3: http://www.xbrl.org/2003/role/disclosureRef
-Topic 606
-SubTopic 10
-Name Accounting Standards Codification
-Section 50
-Paragraph 8
-Subparagraph (a)
-Publisher FASB
-URI https://asc.fasb.org//1943274/2147479806/606-10-50-8
| Name: |
us-gaap_ContractWithCustomerReceivableAfterAllowanceForCreditLossCurrent |
| Namespace Prefix: |
us-gaap_ |
| Data Type: |
xbrli:monetaryItemType |
| Balance Type: |
debit |
| Period Type: |
instant |
|
| X |
- DefinitionAmount of deferred income excluding obligation to transfer product and service to customer for which consideration has been received or is receivable, classified as current. Reference 1: http://www.xbrl.org/2009/role/commonPracticeRef
-Name Accounting Standards Codification
-Section 25
-Paragraph 2
-SubTopic 10
-Topic 470
-Publisher FASB
-URI https://asc.fasb.org//1943274/2147481174/470-10-25-2
| Name: |
us-gaap_DeferredIncomeCurrent |
| Namespace Prefix: |
us-gaap_ |
| Data Type: |
xbrli:monetaryItemType |
| Balance Type: |
credit |
| Period Type: |
instant |
|
| X |
- DefinitionUnbilled amounts due for services rendered or to be rendered, actions taken or to be taken, or a promise to refrain from taking certain actions in accordance with the terms of a legally binding agreement between the entity and, at a minimum, one other party. An example would be amounts associated with contracts or programs where the recognized revenue for performance thereunder exceeds the amounts billed under the terms thereof as of the date of the balance sheet. Reference 1: http://www.xbrl.org/2003/role/disclosureRef
-Topic 912
-SubTopic 310
-Name Accounting Standards Codification
-Section 45
-Paragraph 2
-Publisher FASB
-URI https://asc.fasb.org//1943274/2147482312/912-310-45-2
| Name: |
us-gaap_UnbilledContractsReceivable |
| Namespace Prefix: |
us-gaap_ |
| Data Type: |
xbrli:monetaryItemType |
| Balance Type: |
debit |
| Period Type: |
instant |
|
v3.24.0.1
| X |
- References
+ Details
| Name: |
INSE_DisclosureContractLiabilitiesAndOtherDisclosuresAsRestatedAbstract |
| Namespace Prefix: |
INSE_ |
| Data Type: |
xbrli:stringItemType |
| Balance Type: |
na |
| Period Type: |
duration |
|
| X |
- DefinitionAmount of revenue recognized that was previously included in balance of obligation to transfer good or service to customer for which consideration from customer has been received or is due. Reference 1: http://www.xbrl.org/2003/role/disclosureRef
-Topic 606
-SubTopic 10
-Name Accounting Standards Codification
-Section 50
-Paragraph 8
-Subparagraph (b)
-Publisher FASB
-URI https://asc.fasb.org//1943274/2147479806/606-10-50-8
| Name: |
us-gaap_ContractWithCustomerLiabilityRevenueRecognized |
| Namespace Prefix: |
us-gaap_ |
| Data Type: |
xbrli:monetaryItemType |
| Balance Type: |
credit |
| Period Type: |
duration |
|
v3.24.0.1
Schedule of Restricted Stock Unit Activity (Details) - Incentive Plan [Member] - Restricted Stock Units (RSUs) [Member]
|
3 Months Ended |
|
Mar. 31, 2023
shares
|
|---|
| Share-Based Compensation Arrangement by Share-Based Payment Award [Line Items] |
|
|
| Number of Shares, Unvested Outstanding |
1,647,544
|
|
| Number of Shares, Granted |
495,225
|
[1] |
| Number of Shares, Forfeited |
(6,266)
|
|
| Number of Shares, Vested |
(219,272)
|
|
| Number of Shares, Unvested Outstanding |
1,917,231
|
|
|
|
| X |
- DefinitionThe number of equity-based payment instruments, excluding stock (or unit) options, that were forfeited during the reporting period. Reference 1: http://www.xbrl.org/2003/role/disclosureRef
-Topic 718
-SubTopic 10
-Name Accounting Standards Codification
-Section 50
-Paragraph 2
-Subparagraph (c)(2)(iii)(03)
-Publisher FASB
-URI https://asc.fasb.org//1943274/2147480429/718-10-50-2
| Name: |
us-gaap_ShareBasedCompensationArrangementByShareBasedPaymentAwardEquityInstrumentsOtherThanOptionsForfeitedInPeriod |
| Namespace Prefix: |
us-gaap_ |
| Data Type: |
xbrli:sharesItemType |
| Balance Type: |
na |
| Period Type: |
duration |
|
| X |
- DefinitionThe number of grants made during the period on other than stock (or unit) option plans (for example, phantom stock or unit plan, stock or unit appreciation rights plan, performance target plan). Reference 1: http://www.xbrl.org/2003/role/disclosureRef
-Topic 718
-SubTopic 10
-Name Accounting Standards Codification
-Section 50
-Paragraph 2
-Subparagraph (c)(2)(iii)(01)
-Publisher FASB
-URI https://asc.fasb.org//1943274/2147480429/718-10-50-2
| Name: |
us-gaap_ShareBasedCompensationArrangementByShareBasedPaymentAwardEquityInstrumentsOtherThanOptionsGrantsInPeriod |
| Namespace Prefix: |
us-gaap_ |
| Data Type: |
xbrli:sharesItemType |
| Balance Type: |
na |
| Period Type: |
duration |
|
| X |
- DefinitionThe number of non-vested equity-based payment instruments, excluding stock (or unit) options, that validly exist and are outstanding as of the balance sheet date. Reference 1: http://www.xbrl.org/2003/role/disclosureRef
-Topic 718
-SubTopic 10
-Name Accounting Standards Codification
-Section 50
-Paragraph 2
-Subparagraph (c)(2)(i)
-Publisher FASB
-URI https://asc.fasb.org//1943274/2147480429/718-10-50-2
Reference 2: http://www.xbrl.org/2003/role/disclosureRef
-Topic 718
-SubTopic 10
-Name Accounting Standards Codification
-Section 50
-Paragraph 2
-Subparagraph (c)(2)(ii)
-Publisher FASB
-URI https://asc.fasb.org//1943274/2147480429/718-10-50-2
| Name: |
us-gaap_ShareBasedCompensationArrangementByShareBasedPaymentAwardEquityInstrumentsOtherThanOptionsNonvestedNumber |
| Namespace Prefix: |
us-gaap_ |
| Data Type: |
xbrli:sharesItemType |
| Balance Type: |
na |
| Period Type: |
instant |
|
| X |
- DefinitionThe number of equity-based payment instruments, excluding stock (or unit) options, that vested during the reporting period. Reference 1: http://www.xbrl.org/2003/role/disclosureRef
-Topic 718
-SubTopic 10
-Name Accounting Standards Codification
-Section 50
-Paragraph 2
-Subparagraph (c)(2)(iii)(02)
-Publisher FASB
-URI https://asc.fasb.org//1943274/2147480429/718-10-50-2
| Name: |
us-gaap_ShareBasedCompensationArrangementByShareBasedPaymentAwardEquityInstrumentsOtherThanOptionsVestedInPeriod |
| Namespace Prefix: |
us-gaap_ |
| Data Type: |
xbrli:sharesItemType |
| Balance Type: |
na |
| Period Type: |
duration |
|
| X |
- DefinitionLine items represent financial concepts included in a table. These concepts are used to disclose reportable information associated with domain members defined in one or many axes to the table. Reference 1: http://www.xbrl.org/2003/role/disclosureRef
-Topic 718
-SubTopic 10
-Name Accounting Standards Codification
-Section 35
-Paragraph 1D
-Publisher FASB
-URI https://asc.fasb.org//1943274/2147480483/718-10-35-1D
Reference 2: http://www.xbrl.org/2003/role/disclosureRef
-Topic 718
-SubTopic 10
-Name Accounting Standards Codification
-Section 35
-Paragraph 3
-Publisher FASB
-URI https://asc.fasb.org//1943274/2147480483/718-10-35-3
Reference 3: http://www.xbrl.org/2003/role/disclosureRef
-Topic 718
-SubTopic 10
-Name Accounting Standards Codification
-Section 50
-Paragraph 2
-Subparagraph (a)(1)
-Publisher FASB
-URI https://asc.fasb.org//1943274/2147480429/718-10-50-2
Reference 4: http://www.xbrl.org/2003/role/disclosureRef
-Topic 718
-SubTopic 10
-Name Accounting Standards Codification
-Section 50
-Paragraph 2
-Subparagraph (a)(2)
-Publisher FASB
-URI https://asc.fasb.org//1943274/2147480429/718-10-50-2
Reference 5: http://www.xbrl.org/2003/role/disclosureRef
-Topic 718
-SubTopic 10
-Name Accounting Standards Codification
-Section 50
-Paragraph 2
-Subparagraph (a)(3)
-Publisher FASB
-URI https://asc.fasb.org//1943274/2147480429/718-10-50-2
Reference 6: http://www.xbrl.org/2003/role/disclosureRef
-Topic 718
-SubTopic 10
-Name Accounting Standards Codification
-Section 50
-Paragraph 2
-Subparagraph (c)(1)(i)
-Publisher FASB
-URI https://asc.fasb.org//1943274/2147480429/718-10-50-2
Reference 7: http://www.xbrl.org/2003/role/disclosureRef
-Topic 718
-SubTopic 10
-Name Accounting Standards Codification
-Section 50
-Paragraph 2
-Subparagraph (c)(1)(ii)
-Publisher FASB
-URI https://asc.fasb.org//1943274/2147480429/718-10-50-2
Reference 8: http://www.xbrl.org/2003/role/disclosureRef
-Topic 718
-SubTopic 10
-Name Accounting Standards Codification
-Section 50
-Paragraph 2
-Subparagraph (c)(1)(iii)
-Publisher FASB
-URI https://asc.fasb.org//1943274/2147480429/718-10-50-2
Reference 9: http://www.xbrl.org/2003/role/disclosureRef
-Topic 718
-SubTopic 10
-Name Accounting Standards Codification
-Section 50
-Paragraph 2
-Subparagraph (c)(1)(iv)
-Publisher FASB
-URI https://asc.fasb.org//1943274/2147480429/718-10-50-2
Reference 10: http://www.xbrl.org/2003/role/disclosureRef
-Topic 718
-SubTopic 10
-Name Accounting Standards Codification
-Section 50
-Paragraph 2
-Subparagraph (c)(1)(iv)(01)
-Publisher FASB
-URI https://asc.fasb.org//1943274/2147480429/718-10-50-2
Reference 11: http://www.xbrl.org/2003/role/disclosureRef
-Topic 718
-SubTopic 10
-Name Accounting Standards Codification
-Section 50
-Paragraph 2
-Subparagraph (c)(1)(iv)(02)
-Publisher FASB
-URI https://asc.fasb.org//1943274/2147480429/718-10-50-2
Reference 12: http://www.xbrl.org/2003/role/disclosureRef
-Topic 718
-SubTopic 10
-Name Accounting Standards Codification
-Section 50
-Paragraph 2
-Subparagraph (c)(1)(iv)(03)
-Publisher FASB
-URI https://asc.fasb.org//1943274/2147480429/718-10-50-2
Reference 13: http://www.xbrl.org/2003/role/disclosureRef
-Topic 718
-SubTopic 10
-Name Accounting Standards Codification
-Section 50
-Paragraph 2
-Subparagraph (c)(1)(iv)(04)
-Publisher FASB
-URI https://asc.fasb.org//1943274/2147480429/718-10-50-2
Reference 14: http://www.xbrl.org/2003/role/disclosureRef
-Topic 718
-SubTopic 10
-Name Accounting Standards Codification
-Section 50
-Paragraph 2
-Subparagraph (c)(2)(i)
-Publisher FASB
-URI https://asc.fasb.org//1943274/2147480429/718-10-50-2
Reference 15: http://www.xbrl.org/2003/role/disclosureRef
-Topic 718
-SubTopic 10
-Name Accounting Standards Codification
-Section 50
-Paragraph 2
-Subparagraph (c)(2)(ii)
-Publisher FASB
-URI https://asc.fasb.org//1943274/2147480429/718-10-50-2
Reference 16: http://www.xbrl.org/2003/role/disclosureRef
-Topic 718
-SubTopic 10
-Name Accounting Standards Codification
-Section 50
-Paragraph 2
-Subparagraph (c)(2)(iii)
-Publisher FASB
-URI https://asc.fasb.org//1943274/2147480429/718-10-50-2
Reference 17: http://www.xbrl.org/2003/role/disclosureRef
-Topic 718
-SubTopic 10
-Name Accounting Standards Codification
-Section 50
-Paragraph 2
-Subparagraph (c)(2)(iii)(01)
-Publisher FASB
-URI https://asc.fasb.org//1943274/2147480429/718-10-50-2
Reference 18: http://www.xbrl.org/2003/role/disclosureRef
-Topic 718
-SubTopic 10
-Name Accounting Standards Codification
-Section 50
-Paragraph 2
-Subparagraph (c)(2)(iii)(02)
-Publisher FASB
-URI https://asc.fasb.org//1943274/2147480429/718-10-50-2
Reference 19: http://www.xbrl.org/2003/role/disclosureRef
-Topic 718
-SubTopic 10
-Name Accounting Standards Codification
-Section 50
-Paragraph 2
-Subparagraph (c)(2)(iii)(03)
-Publisher FASB
-URI https://asc.fasb.org//1943274/2147480429/718-10-50-2
Reference 20: http://www.xbrl.org/2003/role/disclosureRef
-Topic 718
-SubTopic 10
-Name Accounting Standards Codification
-Section 50
-Paragraph 2
-Subparagraph (d)(1)
-Publisher FASB
-URI https://asc.fasb.org//1943274/2147480429/718-10-50-2
Reference 21: http://www.xbrl.org/2003/role/disclosureRef
-Topic 718
-SubTopic 10
-Name Accounting Standards Codification
-Section 50
-Paragraph 2
-Subparagraph (d)(2)
-Publisher FASB
-URI https://asc.fasb.org//1943274/2147480429/718-10-50-2
Reference 22: http://www.xbrl.org/2003/role/disclosureRef
-Topic 718
-SubTopic 10
-Name Accounting Standards Codification
-Section 50
-Paragraph 2
-Subparagraph (e)(1)
-Publisher FASB
-URI https://asc.fasb.org//1943274/2147480429/718-10-50-2
Reference 23: http://www.xbrl.org/2003/role/disclosureRef
-Topic 718
-SubTopic 10
-Name Accounting Standards Codification
-Section 50
-Paragraph 2
-Subparagraph (e)(2)
-Publisher FASB
-URI https://asc.fasb.org//1943274/2147480429/718-10-50-2
Reference 24: http://www.xbrl.org/2003/role/disclosureRef
-Topic 718
-SubTopic 10
-Name Accounting Standards Codification
-Section 50
-Paragraph 2
-Subparagraph (f)(2)(i)
-Publisher FASB
-URI https://asc.fasb.org//1943274/2147480429/718-10-50-2
Reference 25: http://www.xbrl.org/2003/role/disclosureRef
-Topic 718
-SubTopic 10
-Name Accounting Standards Codification
-Section 50
-Paragraph 2
-Subparagraph (f)(2)(ii)
-Publisher FASB
-URI https://asc.fasb.org//1943274/2147480429/718-10-50-2
Reference 26: http://www.xbrl.org/2003/role/disclosureRef
-Topic 718
-SubTopic 10
-Name Accounting Standards Codification
-Section 50
-Paragraph 2
-Subparagraph (f)(2)(iii)
-Publisher FASB
-URI https://asc.fasb.org//1943274/2147480429/718-10-50-2
Reference 27: http://www.xbrl.org/2003/role/disclosureRef
-Topic 718
-SubTopic 10
-Name Accounting Standards Codification
-Section 50
-Paragraph 2
-Subparagraph (f)(2)(iv)
-Publisher FASB
-URI https://asc.fasb.org//1943274/2147480429/718-10-50-2
Reference 28: http://www.xbrl.org/2003/role/disclosureRef
-Topic 718
-SubTopic 10
-Name Accounting Standards Codification
-Section 50
-Paragraph 2
-Subparagraph (f)(2)(v)
-Publisher FASB
-URI https://asc.fasb.org//1943274/2147480429/718-10-50-2
| Name: |
us-gaap_ShareBasedCompensationArrangementByShareBasedPaymentAwardLineItems |
| Namespace Prefix: |
us-gaap_ |
| Data Type: |
xbrli:stringItemType |
| Balance Type: |
na |
| Period Type: |
duration |
|
| X |
- Details
| Name: |
us-gaap_PlanNameAxis=INSE_IncentivePlanMember |
| Namespace Prefix: |
|
| Data Type: |
na |
| Balance Type: |
|
| Period Type: |
|
|
| X |
- Details
| Name: |
us-gaap_AwardTypeAxis=us-gaap_RestrictedStockUnitsRSUMember |
| Namespace Prefix: |
|
| Data Type: |
na |
| Balance Type: |
|
| Period Type: |
|
|
v3.24.0.1
| X |
- DefinitionThe number of grants made during the period on other than stock (or unit) option plans (for example, phantom stock or unit plan, stock or unit appreciation rights plan, performance target plan). Reference 1: http://www.xbrl.org/2003/role/disclosureRef
-Topic 718
-SubTopic 10
-Name Accounting Standards Codification
-Section 50
-Paragraph 2
-Subparagraph (c)(2)(iii)(01)
-Publisher FASB
-URI https://asc.fasb.org//1943274/2147480429/718-10-50-2
| Name: |
us-gaap_ShareBasedCompensationArrangementByShareBasedPaymentAwardEquityInstrumentsOtherThanOptionsGrantsInPeriod |
| Namespace Prefix: |
us-gaap_ |
| Data Type: |
xbrli:sharesItemType |
| Balance Type: |
na |
| Period Type: |
duration |
|
| X |
- DefinitionLine items represent financial concepts included in a table. These concepts are used to disclose reportable information associated with domain members defined in one or many axes to the table. Reference 1: http://www.xbrl.org/2003/role/disclosureRef
-Topic 718
-SubTopic 10
-Name Accounting Standards Codification
-Section 35
-Paragraph 1D
-Publisher FASB
-URI https://asc.fasb.org//1943274/2147480483/718-10-35-1D
Reference 2: http://www.xbrl.org/2003/role/disclosureRef
-Topic 718
-SubTopic 10
-Name Accounting Standards Codification
-Section 35
-Paragraph 3
-Publisher FASB
-URI https://asc.fasb.org//1943274/2147480483/718-10-35-3
Reference 3: http://www.xbrl.org/2003/role/disclosureRef
-Topic 718
-SubTopic 10
-Name Accounting Standards Codification
-Section 50
-Paragraph 2
-Subparagraph (a)(1)
-Publisher FASB
-URI https://asc.fasb.org//1943274/2147480429/718-10-50-2
Reference 4: http://www.xbrl.org/2003/role/disclosureRef
-Topic 718
-SubTopic 10
-Name Accounting Standards Codification
-Section 50
-Paragraph 2
-Subparagraph (a)(2)
-Publisher FASB
-URI https://asc.fasb.org//1943274/2147480429/718-10-50-2
Reference 5: http://www.xbrl.org/2003/role/disclosureRef
-Topic 718
-SubTopic 10
-Name Accounting Standards Codification
-Section 50
-Paragraph 2
-Subparagraph (a)(3)
-Publisher FASB
-URI https://asc.fasb.org//1943274/2147480429/718-10-50-2
Reference 6: http://www.xbrl.org/2003/role/disclosureRef
-Topic 718
-SubTopic 10
-Name Accounting Standards Codification
-Section 50
-Paragraph 2
-Subparagraph (c)(1)(i)
-Publisher FASB
-URI https://asc.fasb.org//1943274/2147480429/718-10-50-2
Reference 7: http://www.xbrl.org/2003/role/disclosureRef
-Topic 718
-SubTopic 10
-Name Accounting Standards Codification
-Section 50
-Paragraph 2
-Subparagraph (c)(1)(ii)
-Publisher FASB
-URI https://asc.fasb.org//1943274/2147480429/718-10-50-2
Reference 8: http://www.xbrl.org/2003/role/disclosureRef
-Topic 718
-SubTopic 10
-Name Accounting Standards Codification
-Section 50
-Paragraph 2
-Subparagraph (c)(1)(iii)
-Publisher FASB
-URI https://asc.fasb.org//1943274/2147480429/718-10-50-2
Reference 9: http://www.xbrl.org/2003/role/disclosureRef
-Topic 718
-SubTopic 10
-Name Accounting Standards Codification
-Section 50
-Paragraph 2
-Subparagraph (c)(1)(iv)
-Publisher FASB
-URI https://asc.fasb.org//1943274/2147480429/718-10-50-2
Reference 10: http://www.xbrl.org/2003/role/disclosureRef
-Topic 718
-SubTopic 10
-Name Accounting Standards Codification
-Section 50
-Paragraph 2
-Subparagraph (c)(1)(iv)(01)
-Publisher FASB
-URI https://asc.fasb.org//1943274/2147480429/718-10-50-2
Reference 11: http://www.xbrl.org/2003/role/disclosureRef
-Topic 718
-SubTopic 10
-Name Accounting Standards Codification
-Section 50
-Paragraph 2
-Subparagraph (c)(1)(iv)(02)
-Publisher FASB
-URI https://asc.fasb.org//1943274/2147480429/718-10-50-2
Reference 12: http://www.xbrl.org/2003/role/disclosureRef
-Topic 718
-SubTopic 10
-Name Accounting Standards Codification
-Section 50
-Paragraph 2
-Subparagraph (c)(1)(iv)(03)
-Publisher FASB
-URI https://asc.fasb.org//1943274/2147480429/718-10-50-2
Reference 13: http://www.xbrl.org/2003/role/disclosureRef
-Topic 718
-SubTopic 10
-Name Accounting Standards Codification
-Section 50
-Paragraph 2
-Subparagraph (c)(1)(iv)(04)
-Publisher FASB
-URI https://asc.fasb.org//1943274/2147480429/718-10-50-2
Reference 14: http://www.xbrl.org/2003/role/disclosureRef
-Topic 718
-SubTopic 10
-Name Accounting Standards Codification
-Section 50
-Paragraph 2
-Subparagraph (c)(2)(i)
-Publisher FASB
-URI https://asc.fasb.org//1943274/2147480429/718-10-50-2
Reference 15: http://www.xbrl.org/2003/role/disclosureRef
-Topic 718
-SubTopic 10
-Name Accounting Standards Codification
-Section 50
-Paragraph 2
-Subparagraph (c)(2)(ii)
-Publisher FASB
-URI https://asc.fasb.org//1943274/2147480429/718-10-50-2
Reference 16: http://www.xbrl.org/2003/role/disclosureRef
-Topic 718
-SubTopic 10
-Name Accounting Standards Codification
-Section 50
-Paragraph 2
-Subparagraph (c)(2)(iii)
-Publisher FASB
-URI https://asc.fasb.org//1943274/2147480429/718-10-50-2
Reference 17: http://www.xbrl.org/2003/role/disclosureRef
-Topic 718
-SubTopic 10
-Name Accounting Standards Codification
-Section 50
-Paragraph 2
-Subparagraph (c)(2)(iii)(01)
-Publisher FASB
-URI https://asc.fasb.org//1943274/2147480429/718-10-50-2
Reference 18: http://www.xbrl.org/2003/role/disclosureRef
-Topic 718
-SubTopic 10
-Name Accounting Standards Codification
-Section 50
-Paragraph 2
-Subparagraph (c)(2)(iii)(02)
-Publisher FASB
-URI https://asc.fasb.org//1943274/2147480429/718-10-50-2
Reference 19: http://www.xbrl.org/2003/role/disclosureRef
-Topic 718
-SubTopic 10
-Name Accounting Standards Codification
-Section 50
-Paragraph 2
-Subparagraph (c)(2)(iii)(03)
-Publisher FASB
-URI https://asc.fasb.org//1943274/2147480429/718-10-50-2
Reference 20: http://www.xbrl.org/2003/role/disclosureRef
-Topic 718
-SubTopic 10
-Name Accounting Standards Codification
-Section 50
-Paragraph 2
-Subparagraph (d)(1)
-Publisher FASB
-URI https://asc.fasb.org//1943274/2147480429/718-10-50-2
Reference 21: http://www.xbrl.org/2003/role/disclosureRef
-Topic 718
-SubTopic 10
-Name Accounting Standards Codification
-Section 50
-Paragraph 2
-Subparagraph (d)(2)
-Publisher FASB
-URI https://asc.fasb.org//1943274/2147480429/718-10-50-2
Reference 22: http://www.xbrl.org/2003/role/disclosureRef
-Topic 718
-SubTopic 10
-Name Accounting Standards Codification
-Section 50
-Paragraph 2
-Subparagraph (e)(1)
-Publisher FASB
-URI https://asc.fasb.org//1943274/2147480429/718-10-50-2
Reference 23: http://www.xbrl.org/2003/role/disclosureRef
-Topic 718
-SubTopic 10
-Name Accounting Standards Codification
-Section 50
-Paragraph 2
-Subparagraph (e)(2)
-Publisher FASB
-URI https://asc.fasb.org//1943274/2147480429/718-10-50-2
Reference 24: http://www.xbrl.org/2003/role/disclosureRef
-Topic 718
-SubTopic 10
-Name Accounting Standards Codification
-Section 50
-Paragraph 2
-Subparagraph (f)(2)(i)
-Publisher FASB
-URI https://asc.fasb.org//1943274/2147480429/718-10-50-2
Reference 25: http://www.xbrl.org/2003/role/disclosureRef
-Topic 718
-SubTopic 10
-Name Accounting Standards Codification
-Section 50
-Paragraph 2
-Subparagraph (f)(2)(ii)
-Publisher FASB
-URI https://asc.fasb.org//1943274/2147480429/718-10-50-2
Reference 26: http://www.xbrl.org/2003/role/disclosureRef
-Topic 718
-SubTopic 10
-Name Accounting Standards Codification
-Section 50
-Paragraph 2
-Subparagraph (f)(2)(iii)
-Publisher FASB
-URI https://asc.fasb.org//1943274/2147480429/718-10-50-2
Reference 27: http://www.xbrl.org/2003/role/disclosureRef
-Topic 718
-SubTopic 10
-Name Accounting Standards Codification
-Section 50
-Paragraph 2
-Subparagraph (f)(2)(iv)
-Publisher FASB
-URI https://asc.fasb.org//1943274/2147480429/718-10-50-2
Reference 28: http://www.xbrl.org/2003/role/disclosureRef
-Topic 718
-SubTopic 10
-Name Accounting Standards Codification
-Section 50
-Paragraph 2
-Subparagraph (f)(2)(v)
-Publisher FASB
-URI https://asc.fasb.org//1943274/2147480429/718-10-50-2
| Name: |
us-gaap_ShareBasedCompensationArrangementByShareBasedPaymentAwardLineItems |
| Namespace Prefix: |
us-gaap_ |
| Data Type: |
xbrli:stringItemType |
| Balance Type: |
na |
| Period Type: |
duration |
|
| X |
- DefinitionPercentage of vesting of award under share-based payment arrangement. Reference 1: http://www.xbrl.org/2009/role/commonPracticeRef
-Topic 718
-SubTopic 10
-Name Accounting Standards Codification
-Section 50
-Paragraph 2
-Subparagraph (a)(1)
-Publisher FASB
-URI https://asc.fasb.org//1943274/2147480429/718-10-50-2
| Name: |
us-gaap_SharebasedCompensationArrangementBySharebasedPaymentAwardAwardVestingRightsPercentage |
| Namespace Prefix: |
us-gaap_ |
| Data Type: |
dtr-types:percentItemType |
| Balance Type: |
na |
| Period Type: |
duration |
|
| X |
- Details
| Name: |
srt_RangeAxis=srt_MinimumMember |
| Namespace Prefix: |
|
| Data Type: |
na |
| Balance Type: |
|
| Period Type: |
|
|
| X |
- Details
| Name: |
srt_RangeAxis=srt_MaximumMember |
| Namespace Prefix: |
|
| Data Type: |
na |
| Balance Type: |
|
| Period Type: |
|
|
| X |
- Details
| Name: |
us-gaap_AwardTypeAxis=us-gaap_RestrictedStockUnitsRSUMember |
| Namespace Prefix: |
|
| Data Type: |
na |
| Balance Type: |
|
| Period Type: |
|
|
v3.24.0.1
| X |
- DefinitionLine items represent financial concepts included in a table. These concepts are used to disclose reportable information associated with domain members defined in one or many axes to the table. Reference 1: http://www.xbrl.org/2003/role/disclosureRef
-Topic 718
-SubTopic 10
-Name Accounting Standards Codification
-Section 35
-Paragraph 1D
-Publisher FASB
-URI https://asc.fasb.org//1943274/2147480483/718-10-35-1D
Reference 2: http://www.xbrl.org/2003/role/disclosureRef
-Topic 718
-SubTopic 10
-Name Accounting Standards Codification
-Section 35
-Paragraph 3
-Publisher FASB
-URI https://asc.fasb.org//1943274/2147480483/718-10-35-3
Reference 3: http://www.xbrl.org/2003/role/disclosureRef
-Topic 718
-SubTopic 10
-Name Accounting Standards Codification
-Section 50
-Paragraph 2
-Subparagraph (a)(1)
-Publisher FASB
-URI https://asc.fasb.org//1943274/2147480429/718-10-50-2
Reference 4: http://www.xbrl.org/2003/role/disclosureRef
-Topic 718
-SubTopic 10
-Name Accounting Standards Codification
-Section 50
-Paragraph 2
-Subparagraph (a)(2)
-Publisher FASB
-URI https://asc.fasb.org//1943274/2147480429/718-10-50-2
Reference 5: http://www.xbrl.org/2003/role/disclosureRef
-Topic 718
-SubTopic 10
-Name Accounting Standards Codification
-Section 50
-Paragraph 2
-Subparagraph (a)(3)
-Publisher FASB
-URI https://asc.fasb.org//1943274/2147480429/718-10-50-2
Reference 6: http://www.xbrl.org/2003/role/disclosureRef
-Topic 718
-SubTopic 10
-Name Accounting Standards Codification
-Section 50
-Paragraph 2
-Subparagraph (c)(1)(i)
-Publisher FASB
-URI https://asc.fasb.org//1943274/2147480429/718-10-50-2
Reference 7: http://www.xbrl.org/2003/role/disclosureRef
-Topic 718
-SubTopic 10
-Name Accounting Standards Codification
-Section 50
-Paragraph 2
-Subparagraph (c)(1)(ii)
-Publisher FASB
-URI https://asc.fasb.org//1943274/2147480429/718-10-50-2
Reference 8: http://www.xbrl.org/2003/role/disclosureRef
-Topic 718
-SubTopic 10
-Name Accounting Standards Codification
-Section 50
-Paragraph 2
-Subparagraph (c)(1)(iii)
-Publisher FASB
-URI https://asc.fasb.org//1943274/2147480429/718-10-50-2
Reference 9: http://www.xbrl.org/2003/role/disclosureRef
-Topic 718
-SubTopic 10
-Name Accounting Standards Codification
-Section 50
-Paragraph 2
-Subparagraph (c)(1)(iv)
-Publisher FASB
-URI https://asc.fasb.org//1943274/2147480429/718-10-50-2
Reference 10: http://www.xbrl.org/2003/role/disclosureRef
-Topic 718
-SubTopic 10
-Name Accounting Standards Codification
-Section 50
-Paragraph 2
-Subparagraph (c)(1)(iv)(01)
-Publisher FASB
-URI https://asc.fasb.org//1943274/2147480429/718-10-50-2
Reference 11: http://www.xbrl.org/2003/role/disclosureRef
-Topic 718
-SubTopic 10
-Name Accounting Standards Codification
-Section 50
-Paragraph 2
-Subparagraph (c)(1)(iv)(02)
-Publisher FASB
-URI https://asc.fasb.org//1943274/2147480429/718-10-50-2
Reference 12: http://www.xbrl.org/2003/role/disclosureRef
-Topic 718
-SubTopic 10
-Name Accounting Standards Codification
-Section 50
-Paragraph 2
-Subparagraph (c)(1)(iv)(03)
-Publisher FASB
-URI https://asc.fasb.org//1943274/2147480429/718-10-50-2
Reference 13: http://www.xbrl.org/2003/role/disclosureRef
-Topic 718
-SubTopic 10
-Name Accounting Standards Codification
-Section 50
-Paragraph 2
-Subparagraph (c)(1)(iv)(04)
-Publisher FASB
-URI https://asc.fasb.org//1943274/2147480429/718-10-50-2
Reference 14: http://www.xbrl.org/2003/role/disclosureRef
-Topic 718
-SubTopic 10
-Name Accounting Standards Codification
-Section 50
-Paragraph 2
-Subparagraph (c)(2)(i)
-Publisher FASB
-URI https://asc.fasb.org//1943274/2147480429/718-10-50-2
Reference 15: http://www.xbrl.org/2003/role/disclosureRef
-Topic 718
-SubTopic 10
-Name Accounting Standards Codification
-Section 50
-Paragraph 2
-Subparagraph (c)(2)(ii)
-Publisher FASB
-URI https://asc.fasb.org//1943274/2147480429/718-10-50-2
Reference 16: http://www.xbrl.org/2003/role/disclosureRef
-Topic 718
-SubTopic 10
-Name Accounting Standards Codification
-Section 50
-Paragraph 2
-Subparagraph (c)(2)(iii)
-Publisher FASB
-URI https://asc.fasb.org//1943274/2147480429/718-10-50-2
Reference 17: http://www.xbrl.org/2003/role/disclosureRef
-Topic 718
-SubTopic 10
-Name Accounting Standards Codification
-Section 50
-Paragraph 2
-Subparagraph (c)(2)(iii)(01)
-Publisher FASB
-URI https://asc.fasb.org//1943274/2147480429/718-10-50-2
Reference 18: http://www.xbrl.org/2003/role/disclosureRef
-Topic 718
-SubTopic 10
-Name Accounting Standards Codification
-Section 50
-Paragraph 2
-Subparagraph (c)(2)(iii)(02)
-Publisher FASB
-URI https://asc.fasb.org//1943274/2147480429/718-10-50-2
Reference 19: http://www.xbrl.org/2003/role/disclosureRef
-Topic 718
-SubTopic 10
-Name Accounting Standards Codification
-Section 50
-Paragraph 2
-Subparagraph (c)(2)(iii)(03)
-Publisher FASB
-URI https://asc.fasb.org//1943274/2147480429/718-10-50-2
Reference 20: http://www.xbrl.org/2003/role/disclosureRef
-Topic 718
-SubTopic 10
-Name Accounting Standards Codification
-Section 50
-Paragraph 2
-Subparagraph (d)(1)
-Publisher FASB
-URI https://asc.fasb.org//1943274/2147480429/718-10-50-2
Reference 21: http://www.xbrl.org/2003/role/disclosureRef
-Topic 718
-SubTopic 10
-Name Accounting Standards Codification
-Section 50
-Paragraph 2
-Subparagraph (d)(2)
-Publisher FASB
-URI https://asc.fasb.org//1943274/2147480429/718-10-50-2
Reference 22: http://www.xbrl.org/2003/role/disclosureRef
-Topic 718
-SubTopic 10
-Name Accounting Standards Codification
-Section 50
-Paragraph 2
-Subparagraph (e)(1)
-Publisher FASB
-URI https://asc.fasb.org//1943274/2147480429/718-10-50-2
Reference 23: http://www.xbrl.org/2003/role/disclosureRef
-Topic 718
-SubTopic 10
-Name Accounting Standards Codification
-Section 50
-Paragraph 2
-Subparagraph (e)(2)
-Publisher FASB
-URI https://asc.fasb.org//1943274/2147480429/718-10-50-2
Reference 24: http://www.xbrl.org/2003/role/disclosureRef
-Topic 718
-SubTopic 10
-Name Accounting Standards Codification
-Section 50
-Paragraph 2
-Subparagraph (f)(2)(i)
-Publisher FASB
-URI https://asc.fasb.org//1943274/2147480429/718-10-50-2
Reference 25: http://www.xbrl.org/2003/role/disclosureRef
-Topic 718
-SubTopic 10
-Name Accounting Standards Codification
-Section 50
-Paragraph 2
-Subparagraph (f)(2)(ii)
-Publisher FASB
-URI https://asc.fasb.org//1943274/2147480429/718-10-50-2
Reference 26: http://www.xbrl.org/2003/role/disclosureRef
-Topic 718
-SubTopic 10
-Name Accounting Standards Codification
-Section 50
-Paragraph 2
-Subparagraph (f)(2)(iii)
-Publisher FASB
-URI https://asc.fasb.org//1943274/2147480429/718-10-50-2
Reference 27: http://www.xbrl.org/2003/role/disclosureRef
-Topic 718
-SubTopic 10
-Name Accounting Standards Codification
-Section 50
-Paragraph 2
-Subparagraph (f)(2)(iv)
-Publisher FASB
-URI https://asc.fasb.org//1943274/2147480429/718-10-50-2
Reference 28: http://www.xbrl.org/2003/role/disclosureRef
-Topic 718
-SubTopic 10
-Name Accounting Standards Codification
-Section 50
-Paragraph 2
-Subparagraph (f)(2)(v)
-Publisher FASB
-URI https://asc.fasb.org//1943274/2147480429/718-10-50-2
| Name: |
us-gaap_ShareBasedCompensationArrangementByShareBasedPaymentAwardLineItems |
| Namespace Prefix: |
us-gaap_ |
| Data Type: |
xbrli:stringItemType |
| Balance Type: |
na |
| Period Type: |
duration |
|
| X |
- DefinitionNumber of shares issued under share-based payment arrangement. Reference 1: http://fasb.org/us-gaap/role/ref/legacyRef
-Name Accounting Standards Codification
-Topic 718
-SubTopic 10
-Section 50
-Paragraph 2
-Publisher FASB
-URI https://asc.fasb.org//1943274/2147480429/718-10-50-2
| Name: |
us-gaap_ShareBasedCompensationArrangementByShareBasedPaymentAwardSharesIssuedInPeriod |
| Namespace Prefix: |
us-gaap_ |
| Data Type: |
xbrli:sharesItemType |
| Balance Type: |
na |
| Period Type: |
duration |
|
| X |
- DefinitionTotal number of shares issued during the period, including shares forfeited, as a result of Restricted Stock Awards. Reference 1: http://fasb.org/us-gaap/role/ref/legacyRef
-Name Accounting Standards Codification
-Section 50
-Paragraph 2
-SubTopic 10
-Topic 505
-Publisher FASB
-URI https://asc.fasb.org//1943274/2147481112/505-10-50-2
Reference 2: http://fasb.org/us-gaap/role/ref/legacyRef
-Topic 505
-SubTopic 10
-Name Accounting Standards Codification
-Section S99
-Paragraph 1
-Subparagraph (SX 210.3-04)
-Publisher FASB
-URI https://asc.fasb.org//1943274/2147480008/505-10-S99-1
| Name: |
us-gaap_StockIssuedDuringPeriodSharesRestrictedStockAwardGross |
| Namespace Prefix: |
us-gaap_ |
| Data Type: |
xbrli:sharesItemType |
| Balance Type: |
na |
| Period Type: |
duration |
|
| X |
- Details
| Name: |
us-gaap_AwardTypeAxis=us-gaap_RestrictedStockUnitsRSUMember |
| Namespace Prefix: |
|
| Data Type: |
na |
| Balance Type: |
|
| Period Type: |
|
|
| X |
- Details
| Name: |
us-gaap_VestingAxis=us-gaap_ShareBasedCompensationAwardTrancheThreeMember |
| Namespace Prefix: |
|
| Data Type: |
na |
| Balance Type: |
|
| Period Type: |
|
|
v3.24.0.1
Schedule of Accumulated Other Comprehensive Loss (Income) (Details) - USD ($)
$ in Millions |
3 Months Ended |
Mar. 31, 2023 |
Mar. 31, 2022 |
| Equity [Abstract] |
|
|
| Foreign Currency Translation Adjustments, Balance |
$ (84.2)
|
$ (71.5)
|
| Change in Fair Value of Hedging Instrument, Balance |
0.3
|
1.0
|
| Unrecognized Pension Benefit Costs, Balance |
33.1
|
26.7
|
| Accumulated Other Comprehensive (Income), Balance |
(50.8)
|
(43.8)
|
| Foreign Currency Translation Adjustments, Change during the period |
2.9
|
(3.5)
|
| Change in Fair Value of Hedging Instrument, Change during the period |
(0.2)
|
(0.2)
|
| Unrecognized Pension Benefit Costs, Change during the period |
(0.2)
|
(0.1)
|
| Accumulated Other Comprehensive (Income), Change during the period |
2.5
|
(3.8)
|
| Foreign Currency Translation Adjustments, Balance |
(81.3)
|
(75.0)
|
| Change in Fair Value of Hedging Instrument, Balance |
0.1
|
0.8
|
| Unrecognized Pension Benefit Costs, Balance |
32.9
|
26.6
|
| Accumulated Other Comprehensive (Income), Balance |
$ (48.3)
|
$ (47.6)
|
| X |
- DefinitionAmount, before tax and after reclassification, of gain (loss) from derivative instrument designated and qualifying cash flow hedge included in assessment of hedge effectiveness, attributable to parent.
| Name: |
INSE_OtherComprehensiveIncomeLossCashFlowHedgeGainLossAfterReclassification |
| Namespace Prefix: |
INSE_ |
| Data Type: |
xbrli:monetaryItemType |
| Balance Type: |
credit |
| Period Type: |
duration |
|
| X |
- DefinitionAmount, after tax, of accumulated other comprehensive (income) loss for defined benefit plan, that has not been recognized in net periodic benefit cost (credit). Reference 1: http://fasb.org/us-gaap/role/ref/legacyRef
-Name Accounting Standards Codification
-Topic 220
-SubTopic 10
-Section 45
-Paragraph 14A
-Publisher FASB
-URI https://asc.fasb.org//1943274/2147482790/220-10-45-14A
Reference 2: http://fasb.org/us-gaap/role/ref/legacyRef
-Name Accounting Standards Codification
-Section 45
-Paragraph 10A
-Subparagraph (i-k)
-SubTopic 10
-Topic 220
-Publisher FASB
-URI https://asc.fasb.org//1943274/2147482790/220-10-45-10A
Reference 3: http://www.xbrl.org/2009/role/commonPracticeRef
-Topic 715
-SubTopic 20
-Name Accounting Standards Codification
-Section 50
-Paragraph 1
-Subparagraph (j)
-Publisher FASB
-URI https://asc.fasb.org//1943274/2147480506/715-20-50-1
| Name: |
us-gaap_AccumulatedOtherComprehensiveIncomeLossDefinedBenefitPensionAndOtherPostretirementPlansNetOfTax |
| Namespace Prefix: |
us-gaap_ |
| Data Type: |
xbrli:monetaryItemType |
| Balance Type: |
debit |
| Period Type: |
instant |
|
| X |
- DefinitionAccumulated adjustment, net of tax, that results from the process of translating subsidiary financial statements and foreign equity investments into the reporting currency from the functional currency of the reporting entity, net of reclassification of realized foreign currency translation gains or losses. Reference 1: http://www.xbrl.org/2003/role/disclosureRef
-Topic 220
-SubTopic 10
-Name Accounting Standards Codification
-Section 45
-Paragraph 11
-Publisher FASB
-URI https://asc.fasb.org//1943274/2147482790/220-10-45-11
Reference 2: http://www.xbrl.org/2003/role/disclosureRef
-Topic 220
-SubTopic 10
-Name Accounting Standards Codification
-Section 45
-Paragraph 14A
-Publisher FASB
-URI https://asc.fasb.org//1943274/2147482790/220-10-45-14A
Reference 3: http://www.xbrl.org/2003/role/disclosureRef
-Topic 825
-SubTopic 10
-Name Accounting Standards Codification
-Section 45
-Paragraph 5A
-Publisher FASB
-URI https://asc.fasb.org//1943274/2147482736/825-10-45-5A
Reference 4: http://www.xbrl.org/2003/role/disclosureRef
-Topic 220
-SubTopic 10
-Name Accounting Standards Codification
-Section 45
-Paragraph 10A
-Subparagraph (a)
-Publisher FASB
-URI https://asc.fasb.org//1943274/2147482790/220-10-45-10A
Reference 5: http://www.xbrl.org/2003/role/disclosureRef
-Topic 220
-SubTopic 10
-Name Accounting Standards Codification
-Section 45
-Paragraph 14
-Publisher FASB
-URI https://asc.fasb.org//1943274/2147482790/220-10-45-14
| Name: |
us-gaap_AccumulatedOtherComprehensiveIncomeLossForeignCurrencyTranslationAdjustmentNetOfTax |
| Namespace Prefix: |
us-gaap_ |
| Data Type: |
xbrli:monetaryItemType |
| Balance Type: |
credit |
| Period Type: |
instant |
|
| X |
- DefinitionAmount, after tax, of accumulated increase (decrease) in equity from transaction and other event and circumstance from nonowner source. Reference 1: http://fasb.org/us-gaap/role/ref/legacyRef
-Name Accounting Standards Codification
-Topic 220
-SubTopic 10
-Section 45
-Paragraph 14A
-Publisher FASB
-URI https://asc.fasb.org//1943274/2147482790/220-10-45-14A
Reference 2: http://fasb.org/us-gaap/role/ref/legacyRef
-Topic 220
-SubTopic 10
-Name Accounting Standards Codification
-Section 45
-Paragraph 11
-Publisher FASB
-URI https://asc.fasb.org//1943274/2147482790/220-10-45-11
Reference 3: http://www.xbrl.org/2003/role/disclosureRef
-Topic 944
-SubTopic 40
-Name Accounting Standards Codification
-Section 65
-Paragraph 2
-Subparagraph (g)(2)(ii)
-Publisher FASB
-URI https://asc.fasb.org//1943274/2147480016/944-40-65-2
Reference 4: http://www.xbrl.org/2003/role/disclosureRef
-Topic 944
-SubTopic 40
-Name Accounting Standards Codification
-Section 65
-Paragraph 2
-Subparagraph (h)(2)
-Publisher FASB
-URI https://asc.fasb.org//1943274/2147480016/944-40-65-2
Reference 5: http://www.xbrl.org/2003/role/disclosureRef
-Topic 210
-SubTopic 10
-Name Accounting Standards Codification
-Section S99
-Paragraph 1
-Subparagraph (SX 210.5-02(30)(a)(4))
-Publisher FASB
-URI https://asc.fasb.org//1943274/2147480566/210-10-S99-1
Reference 6: http://www.xbrl.org/2003/role/disclosureRef
-Topic 944
-SubTopic 210
-Name Accounting Standards Codification
-Section S99
-Paragraph 1
-Subparagraph (SX 210.7-03(a)(23)(a)(3))
-Publisher FASB
-URI https://asc.fasb.org//1943274/2147479440/944-210-S99-1
Reference 7: http://fasb.org/us-gaap/role/ref/legacyRef
-Name Accounting Standards Codification
-Topic 220
-SubTopic 10
-Section 45
-Paragraph 14
-Publisher FASB
-URI https://asc.fasb.org//1943274/2147482790/220-10-45-14
| Name: |
us-gaap_AccumulatedOtherComprehensiveIncomeLossNetOfTax |
| Namespace Prefix: |
us-gaap_ |
| Data Type: |
xbrli:monetaryItemType |
| Balance Type: |
credit |
| Period Type: |
instant |
|
| X |
- DefinitionAmount, after tax, of accumulated gain (loss) on derivative instrument designated and qualifying as cash flow hedge included in assessment of hedge effectiveness. Reference 1: http://www.xbrl.org/2003/role/disclosureRef
-Topic 220
-SubTopic 10
-Name Accounting Standards Codification
-Section 45
-Paragraph 11
-Publisher FASB
-URI https://asc.fasb.org//1943274/2147482790/220-10-45-11
| Name: |
us-gaap_AociLossCashFlowHedgeCumulativeGainLossAfterTax |
| Namespace Prefix: |
us-gaap_ |
| Data Type: |
xbrli:monetaryItemType |
| Balance Type: |
credit |
| Period Type: |
instant |
|
| X |
- References
+ Details
| Name: |
us-gaap_EquityAbstract |
| Namespace Prefix: |
us-gaap_ |
| Data Type: |
xbrli:stringItemType |
| Balance Type: |
na |
| Period Type: |
duration |
|
| X |
- DefinitionAmount of tax expense (benefit), after reclassification adjustments of gain (loss) on foreign currency translation adjustments, foreign currency transactions designated and effective as economic hedges of a net investment in a foreign entity and intra-entity foreign currency transactions that are of a long-term-investment nature, attributable to parent entity. Reference 1: http://fasb.org/us-gaap/role/ref/legacyRef
-Topic 810
-SubTopic 10
-Name Accounting Standards Codification
-Section 45
-Paragraph 19
-Publisher FASB
-URI https://asc.fasb.org//1943274/2147481231/810-10-45-19
Reference 2: http://fasb.org/us-gaap/role/ref/legacyRef
-Name Accounting Standards Codification
-Section 45
-Paragraph 20
-SubTopic 10
-Topic 810
-Publisher FASB
-URI https://asc.fasb.org//1943274/2147481231/810-10-45-20
Reference 3: http://fasb.org/us-gaap/role/ref/legacyRef
-Name Accounting Standards Codification
-Section 50
-Paragraph 1A
-Subparagraph (c)(3)
-SubTopic 10
-Topic 810
-Publisher FASB
-URI https://asc.fasb.org//1943274/2147481203/810-10-50-1A
| Name: |
us-gaap_OtherComprehensiveIncomeForeignCurrencyTranslationAdjustmentTaxPortionAttributableToParent |
| Namespace Prefix: |
us-gaap_ |
| Data Type: |
xbrli:monetaryItemType |
| Balance Type: |
debit |
| Period Type: |
duration |
|
| X |
- DefinitionAmount of tax expense (benefit) for adjustments from accumulated other comprehensive income (AOCI) for gain (loss) from increase (decrease) in value of excluded component of derivative designated and qualifying as hedge. Adjustments include, but are not limited to, reclassifications for sale and settlement, and amounts recognized under systematic and rational method. Reference 1: http://www.xbrl.org/2003/role/disclosureRef
-Topic 220
-SubTopic 10
-Name Accounting Standards Codification
-Section 45
-Paragraph 11
-Publisher FASB
-URI https://asc.fasb.org//1943274/2147482790/220-10-45-11
Reference 2: http://www.xbrl.org/2003/role/disclosureRef
-Topic 220
-SubTopic 10
-Name Accounting Standards Codification
-Section 45
-Paragraph 15
-Publisher FASB
-URI https://asc.fasb.org//1943274/2147482790/220-10-45-15
Reference 3: http://www.xbrl.org/2003/role/disclosureRef
-Topic 220
-SubTopic 10
-Name Accounting Standards Codification
-Section 45
-Paragraph 10A
-Subparagraph (dd)
-Publisher FASB
-URI https://asc.fasb.org//1943274/2147482790/220-10-45-10A
| Name: |
us-gaap_OtherComprehensiveIncomeLossDerivativeExcludedComponentIncreaseDecreaseAdjustmentsTax |
| Namespace Prefix: |
us-gaap_ |
| Data Type: |
xbrli:monetaryItemType |
| Balance Type: |
credit |
| Period Type: |
duration |
|
| X |
- DefinitionAmount, after tax and reclassification adjustment, of (increase) decrease in accumulated other comprehensive income for defined benefit plan. Reference 1: http://fasb.org/us-gaap/role/ref/legacyRef
-Name Accounting Standards Codification
-Section 45
-Paragraph 10A
-Subparagraph (i-k)
-SubTopic 10
-Topic 220
-Publisher FASB
-URI https://asc.fasb.org//1943274/2147482790/220-10-45-10A
Reference 2: http://fasb.org/us-gaap/role/ref/legacyRef
-Topic 220
-SubTopic 10
-Name Accounting Standards Codification
-Section 45
-Paragraph 11
-Publisher FASB
-URI https://asc.fasb.org//1943274/2147482790/220-10-45-11
| Name: |
us-gaap_OtherComprehensiveIncomeLossPensionAndOtherPostretirementBenefitPlansAdjustmentNetOfTax |
| Namespace Prefix: |
us-gaap_ |
| Data Type: |
xbrli:monetaryItemType |
| Balance Type: |
debit |
| Period Type: |
duration |
|
v3.24.0.1
Accumulated Other Comprehensive Loss (Income), as restated (Details Narrative) - USD ($)
$ in Millions |
3 Months Ended |
Mar. 31, 2023 |
Mar. 31, 2022 |
| Equity [Abstract] |
|
|
| Interest expenses |
$ 0.2
|
$ 0.2
|
| X |
- References
+ Details
| Name: |
us-gaap_EquityAbstract |
| Namespace Prefix: |
us-gaap_ |
| Data Type: |
xbrli:stringItemType |
| Balance Type: |
na |
| Period Type: |
duration |
|
| X |
- DefinitionAmount of the cost of borrowed funds accounted for as interest expense for debt. Reference 1: http://www.xbrl.org/2003/role/exampleRef
-Topic 470
-SubTopic 20
-Name Accounting Standards Codification
-Section 55
-Paragraph 69E
-Publisher FASB
-URI https://asc.fasb.org//1943274/2147481568/470-20-55-69E
Reference 2: http://www.xbrl.org/2003/role/exampleRef
-Topic 470
-SubTopic 20
-Name Accounting Standards Codification
-Section 55
-Paragraph 69F
-Publisher FASB
-URI https://asc.fasb.org//1943274/2147481568/470-20-55-69F
Reference 3: http://www.xbrl.org/2003/role/disclosureRef
-Topic 470
-SubTopic 20
-Name Accounting Standards Codification
-Section 50
-Paragraph 1F
-Subparagraph (b)
-Publisher FASB
-URI https://asc.fasb.org//1943274/2147481139/470-20-50-1F
Reference 4: http://fasb.org/us-gaap/role/ref/legacyRef
-Topic 220
-SubTopic 10
-Name Accounting Standards Codification
-Section S99
-Paragraph 2
-Subparagraph (SX 210.5-03.8)
-Publisher FASB
-URI https://asc.fasb.org//1943274/2147483621/220-10-S99-2
Reference 5: http://www.xbrl.org/2003/role/disclosureRef
-Topic 470
-SubTopic 20
-Name Accounting Standards Codification
-Section 50
-Paragraph 6
-Subparagraph (b)
-Publisher FASB
-URI https://asc.fasb.org//1943274/2147481139/470-20-50-6
| Name: |
us-gaap_InterestExpenseDebt |
| Namespace Prefix: |
us-gaap_ |
| Data Type: |
xbrli:monetaryItemType |
| Balance Type: |
debit |
| Period Type: |
duration |
|
v3.24.0.1
| X |
- DefinitionSecurities (including those issuable pursuant to contingent stock agreements) that could potentially dilute basic earnings per share (EPS) or earnings per unit (EPU) in the future that were not included in the computation of diluted EPS or EPU because to do so would increase EPS or EPU amounts or decrease loss per share or unit amounts for the period presented. Reference 1: http://www.xbrl.org/2003/role/disclosureRef
-Topic 260
-SubTopic 10
-Name Accounting Standards Codification
-Section 50
-Paragraph 1
-Subparagraph (c)
-Publisher FASB
-URI https://asc.fasb.org//1943274/2147482662/260-10-50-1
| Name: |
us-gaap_AntidilutiveSecuritiesExcludedFromComputationOfEarningsPerShareAmount |
| Namespace Prefix: |
us-gaap_ |
| Data Type: |
xbrli:sharesItemType |
| Balance Type: |
na |
| Period Type: |
duration |
|
| X |
- DefinitionLine items represent financial concepts included in a table. These concepts are used to disclose reportable information associated with domain members defined in one or many axes to the table.
| Name: |
us-gaap_AntidilutiveSecuritiesExcludedFromComputationOfEarningsPerShareLineItems |
| Namespace Prefix: |
us-gaap_ |
| Data Type: |
xbrli:stringItemType |
| Balance Type: |
na |
| Period Type: |
duration |
|
| X |
- Details
| Name: |
us-gaap_AntidilutiveSecuritiesExcludedFromComputationOfEarningsPerShareByAntidilutiveSecuritiesAxis=us-gaap_RestrictedStockUnitsRSUMember |
| Namespace Prefix: |
|
| Data Type: |
na |
| Balance Type: |
|
| Period Type: |
|
|
v3.24.0.1
Schedule of Numerators and Denominators of the Basic and Diluted EPS Computations (Details) - USD ($)
$ / shares in Units, $ in Millions |
3 Months Ended |
Mar. 31, 2023 |
Mar. 31, 2022 |
| Earnings Per Share [Abstract] |
|
|
| Net income loss basic |
|
$ 1.5
|
| Weighted average, shares |
27,974,182
|
28,437,052
|
| Earnings per share basic |
$ (0.05)
|
$ 0.05
|
| Restricted stock units |
|
|
| Restricted stock units |
|
925,330
|
| RSU, per share amount |
|
|
| Net income loss diluted |
|
$ 1.5
|
| Weighted average, shares |
27,974,182
|
29,362,382
|
| Earnings per share diluted |
$ (0.05)
|
$ 0.05
|
| X |
- DefinitionEffect of dilutive securities per share amount.
| Name: |
INSE_EffectOfDilutiveSecuritiesPerShareAmount |
| Namespace Prefix: |
INSE_ |
| Data Type: |
dtr-types:perShareItemType |
| Balance Type: |
na |
| Period Type: |
duration |
|
| X |
- DefinitionAmount of increase (decrease) to net income used for calculating diluted earnings per share (EPS), resulting from the assumed exercise of stock options or restrictive stock units (RSUs). Reference 1: http://www.xbrl.org/2009/role/commonPracticeRef
-Topic 260
-SubTopic 10
-Name Accounting Standards Codification
-Section 50
-Paragraph 1
-Subparagraph (a)
-Publisher FASB
-URI https://asc.fasb.org//1943274/2147482662/260-10-50-1
| Name: |
us-gaap_AmountOfDilutiveSecuritiesStockOptionsAndRestrictiveStockUnits |
| Namespace Prefix: |
us-gaap_ |
| Data Type: |
xbrli:monetaryItemType |
| Balance Type: |
credit |
| Period Type: |
duration |
|
| X |
- References
+ Details
| Name: |
us-gaap_EarningsPerShareAbstract |
| Namespace Prefix: |
us-gaap_ |
| Data Type: |
xbrli:stringItemType |
| Balance Type: |
na |
| Period Type: |
duration |
|
| X |
- DefinitionThe amount of net income (loss) for the period per each share of common stock or unit outstanding during the reporting period. Reference 1: http://www.xbrl.org/2003/role/disclosureRef
-Topic 250
-SubTopic 10
-Name Accounting Standards Codification
-Section 50
-Paragraph 3
-Publisher FASB
-URI https://asc.fasb.org//1943274/2147483443/250-10-50-3
Reference 2: http://www.xbrl.org/2003/role/disclosureRef
-Topic 260
-SubTopic 10
-Name Accounting Standards Codification
-Section 55
-Paragraph 15
-Publisher FASB
-URI https://asc.fasb.org//1943274/2147482635/260-10-55-15
Reference 3: http://www.xbrl.org/2003/role/disclosureRef
-Topic 815
-SubTopic 40
-Name Accounting Standards Codification
-Section 65
-Paragraph 1
-Subparagraph (e)(4)
-Publisher FASB
-URI https://asc.fasb.org//1943274/2147480175/815-40-65-1
Reference 4: http://www.xbrl.org/2003/role/disclosureRef
-Topic 815
-SubTopic 40
-Name Accounting Standards Codification
-Section 65
-Paragraph 1
-Subparagraph (f)
-Publisher FASB
-URI https://asc.fasb.org//1943274/2147480175/815-40-65-1
Reference 5: http://www.xbrl.org/2003/role/disclosureRef
-Topic 250
-SubTopic 10
-Name Accounting Standards Codification
-Section 50
-Paragraph 11
-Subparagraph (a)
-Publisher FASB
-URI https://asc.fasb.org//1943274/2147483443/250-10-50-11
Reference 6: http://www.xbrl.org/2003/role/disclosureRef
-Topic 250
-SubTopic 10
-Name Accounting Standards Codification
-Section 50
-Paragraph 11
-Subparagraph (b)
-Publisher FASB
-URI https://asc.fasb.org//1943274/2147483443/250-10-50-11
Reference 7: http://www.xbrl.org/2003/role/disclosureRef
-Topic 250
-SubTopic 10
-Name Accounting Standards Codification
-Section 50
-Paragraph 7
-Subparagraph (a)
-Publisher FASB
-URI https://asc.fasb.org//1943274/2147483443/250-10-50-7
Reference 8: http://www.xbrl.org/2003/role/disclosureRef
-Topic 260
-SubTopic 10
-Name Accounting Standards Codification
-Section 45
-Paragraph 2
-Publisher FASB
-URI https://asc.fasb.org//1943274/2147482689/260-10-45-2
Reference 9: http://www.xbrl.org/2003/role/disclosureRef
-Topic 260
-SubTopic 10
-Name Accounting Standards Codification
-Section 45
-Paragraph 60B
-Subparagraph (d)
-Publisher FASB
-URI https://asc.fasb.org//1943274/2147482689/260-10-45-60B
Reference 10: http://www.xbrl.org/2003/role/disclosureRef
-Topic 250
-SubTopic 10
-Name Accounting Standards Codification
-Section 50
-Paragraph 4
-Publisher FASB
-URI https://asc.fasb.org//1943274/2147483443/250-10-50-4
Reference 11: http://www.xbrl.org/2003/role/disclosureRef
-Topic 260
-SubTopic 10
-Name Accounting Standards Codification
-Section 50
-Paragraph 1
-Subparagraph (a)
-Publisher FASB
-URI https://asc.fasb.org//1943274/2147482662/260-10-50-1
Reference 12: http://www.xbrl.org/2003/role/disclosureRef
-Topic 260
-SubTopic 10
-Name Accounting Standards Codification
-Section 45
-Paragraph 10
-Publisher FASB
-URI https://asc.fasb.org//1943274/2147482689/260-10-45-10
Reference 13: http://www.xbrl.org/2003/role/disclosureRef
-Topic 220
-SubTopic 10
-Name Accounting Standards Codification
-Section S99
-Paragraph 2
-Subparagraph (SX 210.5-03(25))
-Publisher FASB
-URI https://asc.fasb.org//1943274/2147483621/220-10-S99-2
Reference 14: http://www.xbrl.org/2003/role/disclosureRef
-Topic 942
-SubTopic 220
-Name Accounting Standards Codification
-Section S99
-Paragraph 1
-Subparagraph (SX 210.9-04(27))
-Publisher FASB
-URI https://asc.fasb.org//1943274/2147483589/942-220-S99-1
Reference 15: http://www.xbrl.org/2003/role/disclosureRef
-Topic 944
-SubTopic 220
-Name Accounting Standards Codification
-Section S99
-Paragraph 1
-Subparagraph (SX 210.7-04(23))
-Publisher FASB
-URI https://asc.fasb.org//1943274/2147483586/944-220-S99-1
Reference 16: http://www.xbrl.org/2003/role/exampleRef
-Topic 260
-SubTopic 10
-Name Accounting Standards Codification
-Section 55
-Paragraph 52
-Publisher FASB
-URI https://asc.fasb.org//1943274/2147482635/260-10-55-52
Reference 17: http://www.xbrl.org/2003/role/disclosureRef
-Topic 260
-SubTopic 10
-Name Accounting Standards Codification
-Section 45
-Paragraph 7
-Publisher FASB
-URI https://asc.fasb.org//1943274/2147482689/260-10-45-7
| Name: |
us-gaap_EarningsPerShareBasic |
| Namespace Prefix: |
us-gaap_ |
| Data Type: |
dtr-types:perShareItemType |
| Balance Type: |
na |
| Period Type: |
duration |
|
| X |
- DefinitionThe amount of net income (loss) for the period available to each share of common stock or common unit outstanding during the reporting period and to each share or unit that would have been outstanding assuming the issuance of common shares or units for all dilutive potential common shares or units outstanding during the reporting period. Reference 1: http://www.xbrl.org/2003/role/disclosureRef
-Topic 250
-SubTopic 10
-Name Accounting Standards Codification
-Section 50
-Paragraph 3
-Publisher FASB
-URI https://asc.fasb.org//1943274/2147483443/250-10-50-3
Reference 2: http://www.xbrl.org/2003/role/disclosureRef
-Topic 260
-SubTopic 10
-Name Accounting Standards Codification
-Section 55
-Paragraph 15
-Publisher FASB
-URI https://asc.fasb.org//1943274/2147482635/260-10-55-15
Reference 3: http://www.xbrl.org/2003/role/disclosureRef
-Topic 815
-SubTopic 40
-Name Accounting Standards Codification
-Section 65
-Paragraph 1
-Subparagraph (e)(4)
-Publisher FASB
-URI https://asc.fasb.org//1943274/2147480175/815-40-65-1
Reference 4: http://www.xbrl.org/2003/role/disclosureRef
-Topic 815
-SubTopic 40
-Name Accounting Standards Codification
-Section 65
-Paragraph 1
-Subparagraph (f)
-Publisher FASB
-URI https://asc.fasb.org//1943274/2147480175/815-40-65-1
Reference 5: http://www.xbrl.org/2003/role/disclosureRef
-Topic 250
-SubTopic 10
-Name Accounting Standards Codification
-Section 50
-Paragraph 11
-Subparagraph (a)
-Publisher FASB
-URI https://asc.fasb.org//1943274/2147483443/250-10-50-11
Reference 6: http://www.xbrl.org/2003/role/disclosureRef
-Topic 250
-SubTopic 10
-Name Accounting Standards Codification
-Section 50
-Paragraph 11
-Subparagraph (b)
-Publisher FASB
-URI https://asc.fasb.org//1943274/2147483443/250-10-50-11
Reference 7: http://www.xbrl.org/2003/role/disclosureRef
-Topic 250
-SubTopic 10
-Name Accounting Standards Codification
-Section 50
-Paragraph 7
-Subparagraph (a)
-Publisher FASB
-URI https://asc.fasb.org//1943274/2147483443/250-10-50-7
Reference 8: http://www.xbrl.org/2003/role/disclosureRef
-Topic 260
-SubTopic 10
-Name Accounting Standards Codification
-Section 45
-Paragraph 2
-Publisher FASB
-URI https://asc.fasb.org//1943274/2147482689/260-10-45-2
Reference 9: http://www.xbrl.org/2003/role/disclosureRef
-Topic 260
-SubTopic 10
-Name Accounting Standards Codification
-Section 45
-Paragraph 60B
-Subparagraph (d)
-Publisher FASB
-URI https://asc.fasb.org//1943274/2147482689/260-10-45-60B
Reference 10: http://www.xbrl.org/2003/role/disclosureRef
-Topic 250
-SubTopic 10
-Name Accounting Standards Codification
-Section 50
-Paragraph 4
-Publisher FASB
-URI https://asc.fasb.org//1943274/2147483443/250-10-50-4
Reference 11: http://www.xbrl.org/2003/role/disclosureRef
-Topic 260
-SubTopic 10
-Name Accounting Standards Codification
-Section 50
-Paragraph 1
-Subparagraph (a)
-Publisher FASB
-URI https://asc.fasb.org//1943274/2147482662/260-10-50-1
Reference 12: http://www.xbrl.org/2003/role/disclosureRef
-Topic 220
-SubTopic 10
-Name Accounting Standards Codification
-Section S99
-Paragraph 2
-Subparagraph (SX 210.5-03(25))
-Publisher FASB
-URI https://asc.fasb.org//1943274/2147483621/220-10-S99-2
Reference 13: http://www.xbrl.org/2003/role/disclosureRef
-Topic 942
-SubTopic 220
-Name Accounting Standards Codification
-Section S99
-Paragraph 1
-Subparagraph (SX 210.9-04(27))
-Publisher FASB
-URI https://asc.fasb.org//1943274/2147483589/942-220-S99-1
Reference 14: http://www.xbrl.org/2003/role/disclosureRef
-Topic 944
-SubTopic 220
-Name Accounting Standards Codification
-Section S99
-Paragraph 1
-Subparagraph (SX 210.7-04(23))
-Publisher FASB
-URI https://asc.fasb.org//1943274/2147483586/944-220-S99-1
Reference 15: http://www.xbrl.org/2003/role/exampleRef
-Topic 260
-SubTopic 10
-Name Accounting Standards Codification
-Section 55
-Paragraph 52
-Publisher FASB
-URI https://asc.fasb.org//1943274/2147482635/260-10-55-52
Reference 16: http://www.xbrl.org/2003/role/disclosureRef
-Topic 260
-SubTopic 10
-Name Accounting Standards Codification
-Section 45
-Paragraph 7
-Publisher FASB
-URI https://asc.fasb.org//1943274/2147482689/260-10-45-7
| Name: |
us-gaap_EarningsPerShareDiluted |
| Namespace Prefix: |
us-gaap_ |
| Data Type: |
dtr-types:perShareItemType |
| Balance Type: |
na |
| Period Type: |
duration |
|
| X |
- DefinitionAmount, after deduction of tax, noncontrolling interests, dividends on preferred stock and participating securities; of income (loss) available to common shareholders. Reference 1: http://www.xbrl.org/2003/role/disclosureRef
-Topic 250
-SubTopic 10
-Name Accounting Standards Codification
-Section 50
-Paragraph 3
-Publisher FASB
-URI https://asc.fasb.org//1943274/2147483443/250-10-50-3
Reference 2: http://www.xbrl.org/2003/role/disclosureRef
-Topic 250
-SubTopic 10
-Name Accounting Standards Codification
-Section 50
-Paragraph 11
-Subparagraph (a)
-Publisher FASB
-URI https://asc.fasb.org//1943274/2147483443/250-10-50-11
Reference 3: http://www.xbrl.org/2003/role/disclosureRef
-Topic 250
-SubTopic 10
-Name Accounting Standards Codification
-Section 50
-Paragraph 11
-Subparagraph (b)
-Publisher FASB
-URI https://asc.fasb.org//1943274/2147483443/250-10-50-11
Reference 4: http://www.xbrl.org/2003/role/disclosureRef
-Topic 250
-SubTopic 10
-Name Accounting Standards Codification
-Section 50
-Paragraph 4
-Publisher FASB
-URI https://asc.fasb.org//1943274/2147483443/250-10-50-4
Reference 5: http://www.xbrl.org/2003/role/disclosureRef
-Topic 220
-SubTopic 10
-Name Accounting Standards Codification
-Section S99
-Paragraph 5
-Subparagraph (SAB Topic 6.B)
-Publisher FASB
-URI https://asc.fasb.org//1943274/2147483621/220-10-S99-5
Reference 6: http://www.xbrl.org/2003/role/disclosureRef
-Topic 280
-SubTopic 10
-Name Accounting Standards Codification
-Section 50
-Paragraph 22
-Publisher FASB
-URI https://asc.fasb.org//1943274/2147482810/280-10-50-22
Reference 7: http://www.xbrl.org/2003/role/disclosureRef
-Topic 260
-SubTopic 10
-Name Accounting Standards Codification
-Section 50
-Paragraph 1
-Subparagraph (a)
-Publisher FASB
-URI https://asc.fasb.org//1943274/2147482662/260-10-50-1
Reference 8: http://www.xbrl.org/2003/role/disclosureRef
-Topic 280
-SubTopic 10
-Name Accounting Standards Codification
-Section 50
-Paragraph 30
-Subparagraph (b)
-Publisher FASB
-URI https://asc.fasb.org//1943274/2147482810/280-10-50-30
Reference 9: http://www.xbrl.org/2003/role/disclosureRef
-Topic 280
-SubTopic 10
-Name Accounting Standards Codification
-Section 50
-Paragraph 32
-Subparagraph (f)
-Publisher FASB
-URI https://asc.fasb.org//1943274/2147482810/280-10-50-32
Reference 10: http://www.xbrl.org/2003/role/disclosureRef
-Topic 260
-SubTopic 10
-Name Accounting Standards Codification
-Section 45
-Paragraph 10
-Publisher FASB
-URI https://asc.fasb.org//1943274/2147482689/260-10-45-10
Reference 11: http://www.xbrl.org/2003/role/exampleRef
-Topic 280
-SubTopic 10
-Name Accounting Standards Codification
-Section 50
-Paragraph 31
-Publisher FASB
-URI https://asc.fasb.org//1943274/2147482810/280-10-50-31
Reference 12: http://www.xbrl.org/2003/role/disclosureRef
-Topic 280
-SubTopic 10
-Name Accounting Standards Codification
-Section 50
-Paragraph 32
-Subparagraph (c)
-Publisher FASB
-URI https://asc.fasb.org//1943274/2147482810/280-10-50-32
Reference 13: http://www.xbrl.org/2003/role/disclosureRef
-Topic 260
-SubTopic 10
-Name Accounting Standards Codification
-Section 45
-Paragraph 11
-Publisher FASB
-URI https://asc.fasb.org//1943274/2147482689/260-10-45-11
Reference 14: http://www.xbrl.org/2003/role/disclosureRef
-Topic 260
-SubTopic 10
-Name Accounting Standards Codification
-Section 45
-Paragraph 60B
-Subparagraph (c)
-Publisher FASB
-URI https://asc.fasb.org//1943274/2147482689/260-10-45-60B
| Name: |
us-gaap_NetIncomeLossAvailableToCommonStockholdersBasic |
| Namespace Prefix: |
us-gaap_ |
| Data Type: |
xbrli:monetaryItemType |
| Balance Type: |
credit |
| Period Type: |
duration |
|
| X |
- DefinitionAmount, after deduction of tax, noncontrolling interests, dividends on preferred stock and participating securities, and addition from assumption of issuance of common shares for dilutive potential common shares; of income (loss) available to common shareholders. Reference 1: http://www.xbrl.org/2003/role/disclosureRef
-Topic 220
-SubTopic 10
-Name Accounting Standards Codification
-Section S99
-Paragraph 5
-Subparagraph (SAB Topic 6.B)
-Publisher FASB
-URI https://asc.fasb.org//1943274/2147483621/220-10-S99-5
Reference 2: http://www.xbrl.org/2003/role/disclosureRef
-Topic 260
-SubTopic 10
-Name Accounting Standards Codification
-Section 50
-Paragraph 1
-Subparagraph (a)
-Publisher FASB
-URI https://asc.fasb.org//1943274/2147482662/260-10-50-1
Reference 3: http://www.xbrl.org/2003/role/disclosureRef
-Topic 260
-SubTopic 10
-Name Accounting Standards Codification
-Section 45
-Paragraph 16
-Publisher FASB
-URI https://asc.fasb.org//1943274/2147482689/260-10-45-16
Reference 4: http://www.xbrl.org/2003/role/disclosureRef
-Topic 260
-SubTopic 10
-Name Accounting Standards Codification
-Section 45
-Paragraph 40
-Subparagraph (b)(1)
-Publisher FASB
-URI https://asc.fasb.org//1943274/2147482689/260-10-45-40
Reference 5: http://www.xbrl.org/2003/role/disclosureRef
-Topic 260
-SubTopic 10
-Name Accounting Standards Codification
-Section 45
-Paragraph 60B
-Subparagraph (c)
-Publisher FASB
-URI https://asc.fasb.org//1943274/2147482689/260-10-45-60B
Reference 6: http://www.xbrl.org/2003/role/disclosureRef
-Topic 260
-SubTopic 10
-Name Accounting Standards Codification
-Section 45
-Paragraph 40
-Subparagraph (a)
-Publisher FASB
-URI https://asc.fasb.org//1943274/2147482689/260-10-45-40
Reference 7: http://www.xbrl.org/2003/role/disclosureRef
-Topic 260
-SubTopic 10
-Name Accounting Standards Codification
-Section 45
-Paragraph 40
-Subparagraph (b)(2)
-Publisher FASB
-URI https://asc.fasb.org//1943274/2147482689/260-10-45-40
Reference 8: http://www.xbrl.org/2003/role/disclosureRef
-Topic 260
-SubTopic 10
-Name Accounting Standards Codification
-Section 45
-Paragraph 40
-Subparagraph (b)(3)
-Publisher FASB
-URI https://asc.fasb.org//1943274/2147482689/260-10-45-40
| Name: |
us-gaap_NetIncomeLossAvailableToCommonStockholdersDiluted |
| Namespace Prefix: |
us-gaap_ |
| Data Type: |
xbrli:monetaryItemType |
| Balance Type: |
credit |
| Period Type: |
duration |
|
| X |
- DefinitionThe sum of dilutive potential common shares or units used in the calculation of the diluted per-share or per-unit computation. Reference 1: http://www.xbrl.org/2009/role/commonPracticeRef
-Topic 260
-SubTopic 10
-Name Accounting Standards Codification
-Section 50
-Paragraph 1
-Subparagraph (a)
-Publisher FASB
-URI https://asc.fasb.org//1943274/2147482662/260-10-50-1
| Name: |
us-gaap_WeightedAverageNumberDilutedSharesOutstandingAdjustment |
| Namespace Prefix: |
us-gaap_ |
| Data Type: |
xbrli:sharesItemType |
| Balance Type: |
na |
| Period Type: |
duration |
|
| X |
- DefinitionThe average number of shares or units issued and outstanding that are used in calculating diluted EPS or earnings per unit (EPU), determined based on the timing of issuance of shares or units in the period. Reference 1: http://www.xbrl.org/2003/role/disclosureRef
-Topic 260
-SubTopic 10
-Name Accounting Standards Codification
-Section 50
-Paragraph 1
-Subparagraph (a)
-Publisher FASB
-URI https://asc.fasb.org//1943274/2147482662/260-10-50-1
Reference 2: http://www.xbrl.org/2003/role/disclosureRef
-Topic 260
-SubTopic 10
-Name Accounting Standards Codification
-Section 45
-Paragraph 16
-Publisher FASB
-URI https://asc.fasb.org//1943274/2147482689/260-10-45-16
| Name: |
us-gaap_WeightedAverageNumberOfDilutedSharesOutstanding |
| Namespace Prefix: |
us-gaap_ |
| Data Type: |
xbrli:sharesItemType |
| Balance Type: |
na |
| Period Type: |
duration |
|
| X |
- DefinitionNumber of [basic] shares or units, after adjustment for contingently issuable shares or units and other shares or units not deemed outstanding, determined by relating the portion of time within a reporting period that common shares or units have been outstanding to the total time in that period. Reference 1: http://www.xbrl.org/2003/role/disclosureRef
-Topic 260
-SubTopic 10
-Name Accounting Standards Codification
-Section 50
-Paragraph 1
-Subparagraph (a)
-Publisher FASB
-URI https://asc.fasb.org//1943274/2147482662/260-10-50-1
Reference 2: http://www.xbrl.org/2003/role/disclosureRef
-Topic 260
-SubTopic 10
-Name Accounting Standards Codification
-Section 45
-Paragraph 10
-Publisher FASB
-URI https://asc.fasb.org//1943274/2147482689/260-10-45-10
| Name: |
us-gaap_WeightedAverageNumberOfSharesOutstandingBasic |
| Namespace Prefix: |
us-gaap_ |
| Data Type: |
xbrli:sharesItemType |
| Balance Type: |
na |
| Period Type: |
duration |
|
v3.24.0.1
| X |
- DefinitionLine items represent financial concepts included in a table. These concepts are used to disclose reportable information associated with domain members defined in one or many axes to the table.
| Name: |
us-gaap_AntidilutiveSecuritiesExcludedFromComputationOfEarningsPerShareLineItems |
| Namespace Prefix: |
us-gaap_ |
| Data Type: |
xbrli:stringItemType |
| Balance Type: |
na |
| Period Type: |
duration |
|
| X |
- DefinitionThe number of equity-based payment instruments, excluding stock (or unit) options, that vested during the reporting period. Reference 1: http://www.xbrl.org/2003/role/disclosureRef
-Topic 718
-SubTopic 10
-Name Accounting Standards Codification
-Section 50
-Paragraph 2
-Subparagraph (c)(2)(iii)(02)
-Publisher FASB
-URI https://asc.fasb.org//1943274/2147480429/718-10-50-2
| Name: |
us-gaap_ShareBasedCompensationArrangementByShareBasedPaymentAwardEquityInstrumentsOtherThanOptionsVestedInPeriod |
| Namespace Prefix: |
us-gaap_ |
| Data Type: |
xbrli:sharesItemType |
| Balance Type: |
na |
| Period Type: |
duration |
|
| X |
- Details
| Name: |
us-gaap_AntidilutiveSecuritiesExcludedFromComputationOfEarningsPerShareByAntidilutiveSecuritiesAxis=us-gaap_RestrictedStockUnitsRSUMember |
| Namespace Prefix: |
|
| Data Type: |
na |
| Balance Type: |
|
| Period Type: |
|
|
v3.24.0.1
| X |
- DefinitionAmount of expected return (loss) recognized in net periodic benefit (cost) credit, calculated based on expected long-term rate of return and market-related value of plan assets of defined benefit plan. Reference 1: http://www.xbrl.org/2003/role/exampleRef
-Topic 715
-SubTopic 20
-Name Accounting Standards Codification
-Section 55
-Paragraph 17
-Publisher FASB
-URI https://asc.fasb.org//1943274/2147480482/715-20-55-17
Reference 2: http://www.xbrl.org/2003/role/disclosureRef
-Topic 715
-SubTopic 20
-Name Accounting Standards Codification
-Section 45
-Paragraph 3A
-Subparagraph (b)
-Publisher FASB
-URI https://asc.fasb.org//1943274/2147480535/715-20-45-3A
Reference 3: http://www.xbrl.org/2003/role/exampleRef
-Topic 715
-SubTopic 20
-Name Accounting Standards Codification
-Section 55
-Paragraph 18
-Publisher FASB
-URI https://asc.fasb.org//1943274/2147480482/715-20-55-18
Reference 4: http://www.xbrl.org/2003/role/disclosureRef
-Topic 715
-SubTopic 20
-Name Accounting Standards Codification
-Section 50
-Paragraph 1
-Subparagraph (h)(3)
-Publisher FASB
-URI https://asc.fasb.org//1943274/2147480506/715-20-50-1
Reference 5: http://www.xbrl.org/2003/role/disclosureRef
-Topic 715
-SubTopic 20
-Name Accounting Standards Codification
-Section 50
-Paragraph 6
-Subparagraph (a)(3)
-Publisher FASB
-URI https://asc.fasb.org//1943274/2147480506/715-20-50-6
| Name: |
us-gaap_DefinedBenefitPlanExpectedReturnOnPlanAssets |
| Namespace Prefix: |
us-gaap_ |
| Data Type: |
xbrli:monetaryItemType |
| Balance Type: |
credit |
| Period Type: |
duration |
|
| X |
- DefinitionAmount of cost recognized for passage of time related to defined benefit plan. Reference 1: http://www.xbrl.org/2003/role/exampleRef
-Topic 715
-SubTopic 20
-Name Accounting Standards Codification
-Section 55
-Paragraph 17
-Publisher FASB
-URI https://asc.fasb.org//1943274/2147480482/715-20-55-17
Reference 2: http://www.xbrl.org/2003/role/disclosureRef
-Topic 715
-SubTopic 20
-Name Accounting Standards Codification
-Section 45
-Paragraph 3A
-Subparagraph (b)
-Publisher FASB
-URI https://asc.fasb.org//1943274/2147480535/715-20-45-3A
Reference 3: http://www.xbrl.org/2003/role/exampleRef
-Topic 715
-SubTopic 20
-Name Accounting Standards Codification
-Section 55
-Paragraph 18
-Publisher FASB
-URI https://asc.fasb.org//1943274/2147480482/715-20-55-18
Reference 4: http://www.xbrl.org/2003/role/disclosureRef
-Topic 715
-SubTopic 20
-Name Accounting Standards Codification
-Section 50
-Paragraph 1
-Subparagraph (a)(2)
-Publisher FASB
-URI https://asc.fasb.org//1943274/2147480506/715-20-50-1
Reference 5: http://www.xbrl.org/2003/role/disclosureRef
-Topic 715
-SubTopic 20
-Name Accounting Standards Codification
-Section 50
-Paragraph 1
-Subparagraph (h)(2)
-Publisher FASB
-URI https://asc.fasb.org//1943274/2147480506/715-20-50-1
Reference 6: http://www.xbrl.org/2003/role/disclosureRef
-Topic 715
-SubTopic 20
-Name Accounting Standards Codification
-Section 50
-Paragraph 6
-Subparagraph (a)(2)
-Publisher FASB
-URI https://asc.fasb.org//1943274/2147480506/715-20-50-6
| Name: |
us-gaap_DefinedBenefitPlanInterestCost |
| Namespace Prefix: |
us-gaap_ |
| Data Type: |
xbrli:monetaryItemType |
| Balance Type: |
debit |
| Period Type: |
duration |
|
| X |
- References
+ Details
| Name: |
us-gaap_OtherIncomeAndExpensesAbstract |
| Namespace Prefix: |
us-gaap_ |
| Data Type: |
xbrli:stringItemType |
| Balance Type: |
na |
| Period Type: |
duration |
|
| X |
- DefinitionAmount of income (expense) related to nonoperating activities, classified as other. Reference 1: http://fasb.org/us-gaap/role/ref/legacyRef
-Topic 220
-SubTopic 10
-Name Accounting Standards Codification
-Section S99
-Paragraph 2
-Subparagraph (SX 210.5-03.9)
-Publisher FASB
-URI https://asc.fasb.org//1943274/2147483621/220-10-S99-2
| Name: |
us-gaap_OtherNonoperatingIncomeExpense |
| Namespace Prefix: |
us-gaap_ |
| Data Type: |
xbrli:monetaryItemType |
| Balance Type: |
credit |
| Period Type: |
duration |
|
v3.24.0.1
v3.24.0.1
| X |
- DefinitionOutstanding shares percentage.
| Name: |
INSE_OutstandingSharesPercentage |
| Namespace Prefix: |
INSE_ |
| Data Type: |
dtr-types:percentItemType |
| Balance Type: |
na |
| Period Type: |
duration |
|
| X |
- DefinitionInterest and debt related expenses associated with nonoperating financing activities of the entity. Reference 1: http://fasb.org/us-gaap/role/ref/legacyRef
-Name Accounting Standards Codification
-Section 50
-Paragraph 1
-SubTopic 20
-Topic 835
-Publisher FASB
-URI https://asc.fasb.org//1943274/2147483013/835-20-50-1
| Name: |
us-gaap_InterestAndDebtExpense |
| Namespace Prefix: |
us-gaap_ |
| Data Type: |
xbrli:monetaryItemType |
| Balance Type: |
debit |
| Period Type: |
duration |
|
| X |
- DefinitionPercentage of investment owned to net assets. Reference 1: http://www.xbrl.org/2003/role/exampleRef
-Topic 946
-SubTopic 210
-Name Accounting Standards Codification
-Section 55
-Paragraph 1
-Publisher FASB
-URI https://asc.fasb.org//1943274/2147480493/946-210-55-1
Reference 2: http://www.xbrl.org/2003/role/disclosureRef
-Topic 946
-SubTopic 210
-Name Accounting Standards Codification
-Section 50
-Paragraph 6
-Subparagraph (a)(1)
-Publisher FASB
-URI https://asc.fasb.org//1943274/2147480524/946-210-50-6
Reference 3: http://www.xbrl.org/2003/role/disclosureRef
-Topic 946
-SubTopic 210
-Name Accounting Standards Codification
-Section 50
-Paragraph 6
-Subparagraph (a)(2)
-Publisher FASB
-URI https://asc.fasb.org//1943274/2147480524/946-210-50-6
Reference 4: http://www.xbrl.org/2003/role/disclosureRef
-Topic 946
-SubTopic 210
-Name Accounting Standards Codification
-Section 50
-Paragraph 1
-Subparagraph (c)(1)
-Publisher FASB
-URI https://asc.fasb.org//1943274/2147480524/946-210-50-1
Reference 5: http://www.xbrl.org/2009/role/commonPracticeRef
-Topic 946
-SubTopic 210
-Name Accounting Standards Codification
-Section 50
-Paragraph 6
-Subparagraph (a)(3)
-Publisher FASB
-URI https://asc.fasb.org//1943274/2147480524/946-210-50-6
Reference 6: http://www.xbrl.org/2003/role/disclosureRef
-Topic 946
-SubTopic 320
-Name Accounting Standards Codification
-Section S99
-Paragraph 1
-Subparagraph (SX 210.12-12(Column C)(Footnote 5))
-Publisher FASB
-URI https://asc.fasb.org//1943274/2147480032/946-320-S99-1
Reference 7: http://www.xbrl.org/2003/role/disclosureRef
-Topic 946
-SubTopic 320
-Name Accounting Standards Codification
-Section S99
-Paragraph 3
-Subparagraph (SX 210.12-12B(Column D))
-Publisher FASB
-URI https://asc.fasb.org//1943274/2147480032/946-320-S99-3
Reference 8: http://www.xbrl.org/2003/role/disclosureRef
-Topic 946
-SubTopic 320
-Name Accounting Standards Codification
-Section S99
-Paragraph 3
-Subparagraph (SX 210.12-12B(Column C)(Footnote 2))
-Publisher FASB
-URI https://asc.fasb.org//1943274/2147480032/946-320-S99-3
Reference 9: http://www.xbrl.org/2003/role/disclosureRef
-Topic 946
-SubTopic 320
-Name Accounting Standards Codification
-Section S99
-Paragraph 3
-Subparagraph (SX 210.12-12B(Column A)(Footnote 6))
-Publisher FASB
-URI https://asc.fasb.org//1943274/2147480032/946-320-S99-3
Reference 10: http://www.xbrl.org/2003/role/disclosureRef
-Topic 946
-SubTopic 320
-Name Accounting Standards Codification
-Section S99
-Paragraph 6
-Subparagraph (SX 210.12-14(Column F)(Footnote 7))
-Publisher FASB
-URI https://asc.fasb.org//1943274/2147480032/946-320-S99-6
| Name: |
us-gaap_InvestmentOwnedPercentOfNetAssets |
| Namespace Prefix: |
us-gaap_ |
| Data Type: |
dtr-types:percentItemType |
| Balance Type: |
na |
| Period Type: |
instant |
|
| X |
- DefinitionA fee charged for services from professionals such as doctors, lawyers and accountants. The term is often expanded to include other professions, for example, pharmacists charging to maintain a medicinal profile of a client or customer. Reference 1: http://www.xbrl.org/2003/role/exampleRef
-Topic 946
-SubTopic 830
-Name Accounting Standards Codification
-Section 55
-Paragraph 10
-Publisher FASB
-URI https://asc.fasb.org//1943274/2147480167/946-830-55-10
Reference 2: http://www.xbrl.org/2009/role/commonPracticeRef
-Topic 946
-SubTopic 220
-Name Accounting Standards Codification
-Section 45
-Paragraph 3
-Subparagraph (k)
-Publisher FASB
-URI https://asc.fasb.org//1943274/2147483581/946-220-45-3
Reference 3: http://www.xbrl.org/2009/role/commonPracticeRef
-Topic 946
-SubTopic 220
-Name Accounting Standards Codification
-Section S99
-Paragraph 1
-Subparagraph (SX 210.6-07(2)(b))
-Publisher FASB
-URI https://asc.fasb.org//1943274/2147483575/946-220-S99-1
| Name: |
us-gaap_ProfessionalFees |
| Namespace Prefix: |
us-gaap_ |
| Data Type: |
xbrli:monetaryItemType |
| Balance Type: |
debit |
| Period Type: |
duration |
|
| X |
- Details
| Name: |
us-gaap_TypeOfArrangementAxis=INSE_ConsultancyAgreementMember |
| Namespace Prefix: |
|
| Data Type: |
na |
| Balance Type: |
|
| Period Type: |
|
|
| X |
- Details
| Name: |
us-gaap_SubsequentEventTypeAxis=us-gaap_SubsequentEventMember |
| Namespace Prefix: |
|
| Data Type: |
na |
| Balance Type: |
|
| Period Type: |
|
|
v3.24.0.1
| X |
- DefinitionTarget annual bonus percentage.
| Name: |
INSE_TargetAnnualBonusPercentage |
| Namespace Prefix: |
INSE_ |
| Data Type: |
dtr-types:percentItemType |
| Balance Type: |
na |
| Period Type: |
duration |
|
| X |
- DefinitionLine items represent financial concepts included in a table. These concepts are used to disclose reportable information associated with domain members defined in one or many axes to the table. Reference 1: http://www.xbrl.org/2003/role/disclosureRef
-Topic 460
-SubTopic 10
-Name Accounting Standards Codification
-Section 50
-Paragraph 3
-Publisher FASB
-URI https://asc.fasb.org//1943274/2147482425/460-10-50-3
Reference 2: http://www.xbrl.org/2003/role/disclosureRef
-Topic 450
-SubTopic 20
-Name Accounting Standards Codification
-Section 50
-Paragraph 1
-Publisher FASB
-URI https://asc.fasb.org//1943274/2147483076/450-20-50-1
Reference 3: http://www.xbrl.org/2009/role/commonPracticeRef
-Topic 450
-SubTopic 20
-Name Accounting Standards Codification
-Section 50
-Paragraph 4
-Subparagraph (a)
-Publisher FASB
-URI https://asc.fasb.org//1943274/2147483076/450-20-50-4
Reference 4: http://www.xbrl.org/2003/role/disclosureRef
-Topic 450
-SubTopic 20
-Name Accounting Standards Codification
-Section 50
-Paragraph 4
-Subparagraph (b)
-Publisher FASB
-URI https://asc.fasb.org//1943274/2147483076/450-20-50-4
Reference 5: http://www.xbrl.org/2009/role/commonPracticeRef
-Topic 450
-SubTopic 20
-Name Accounting Standards Codification
-Section 50
-Paragraph 9
-Subparagraph (a)
-Publisher FASB
-URI https://asc.fasb.org//1943274/2147483076/450-20-50-9
Reference 6: http://www.xbrl.org/2003/role/disclosureRef
-Topic 450
-SubTopic 20
-Name Accounting Standards Codification
-Section 50
-Paragraph 9
-Subparagraph (b)
-Publisher FASB
-URI https://asc.fasb.org//1943274/2147483076/450-20-50-9
| Name: |
us-gaap_LossContingenciesLineItems |
| Namespace Prefix: |
us-gaap_ |
| Data Type: |
xbrli:stringItemType |
| Balance Type: |
na |
| Period Type: |
duration |
|
| X |
- DefinitionAmount of expense for salary and wage arising from service rendered by officer. Excludes allocated cost, labor-related nonsalary expense, and direct and overhead labor cost included in cost of good and service sold. Reference 1: http://www.xbrl.org/2009/role/commonPracticeRef
-Topic 220
-SubTopic 10
-Name Accounting Standards Codification
-Section S99
-Paragraph 2
-Subparagraph (SX 210.5-03(4))
-Publisher FASB
-URI https://asc.fasb.org//1943274/2147483621/220-10-S99-2
| Name: |
us-gaap_OfficersCompensation |
| Namespace Prefix: |
us-gaap_ |
| Data Type: |
xbrli:monetaryItemType |
| Balance Type: |
debit |
| Period Type: |
duration |
|
| X |
- Details
| Name: |
us-gaap_TypeOfArrangementAxis=INSE_AmendedEmploymentAgreementMember |
| Namespace Prefix: |
|
| Data Type: |
na |
| Balance Type: |
|
| Period Type: |
|
|
| X |
- Details
| Name: |
srt_RangeAxis=srt_MinimumMember |
| Namespace Prefix: |
|
| Data Type: |
na |
| Balance Type: |
|
| Period Type: |
|
|
| X |
- Details
| Name: |
srt_RangeAxis=srt_MaximumMember |
| Namespace Prefix: |
|
| Data Type: |
na |
| Balance Type: |
|
| Period Type: |
|
|
v3.24.0.1
| X |
- References
+ Details
| Name: |
us-gaap_CompensationAndRetirementDisclosureAbstract |
| Namespace Prefix: |
us-gaap_ |
| Data Type: |
xbrli:stringItemType |
| Balance Type: |
na |
| Period Type: |
duration |
|
| X |
- DefinitionAmount of gain (loss) recognized in net periodic benefit (cost) credit of defined benefit plan. Reference 1: http://www.xbrl.org/2003/role/exampleRef
-Topic 715
-SubTopic 20
-Name Accounting Standards Codification
-Section 55
-Paragraph 17
-Publisher FASB
-URI https://asc.fasb.org//1943274/2147480482/715-20-55-17
Reference 2: http://www.xbrl.org/2003/role/disclosureRef
-Topic 715
-SubTopic 20
-Name Accounting Standards Codification
-Section 45
-Paragraph 3A
-Subparagraph (b)
-Publisher FASB
-URI https://asc.fasb.org//1943274/2147480535/715-20-45-3A
Reference 3: http://www.xbrl.org/2003/role/exampleRef
-Topic 715
-SubTopic 20
-Name Accounting Standards Codification
-Section 55
-Paragraph 18
-Publisher FASB
-URI https://asc.fasb.org//1943274/2147480482/715-20-55-18
Reference 4: http://www.xbrl.org/2003/role/disclosureRef
-Topic 715
-SubTopic 20
-Name Accounting Standards Codification
-Section 50
-Paragraph 1
-Subparagraph (h)(4)
-Publisher FASB
-URI https://asc.fasb.org//1943274/2147480506/715-20-50-1
Reference 5: http://www.xbrl.org/2003/role/disclosureRef
-Topic 715
-SubTopic 20
-Name Accounting Standards Codification
-Section 50
-Paragraph 6
-Subparagraph (a)(4)
-Publisher FASB
-URI https://asc.fasb.org//1943274/2147480506/715-20-50-6
| Name: |
us-gaap_DefinedBenefitPlanAmortizationOfGainsLosses |
| Namespace Prefix: |
us-gaap_ |
| Data Type: |
xbrli:monetaryItemType |
| Balance Type: |
credit |
| Period Type: |
duration |
|
| X |
- DefinitionAmount of expected return (loss) recognized in net periodic benefit (cost) credit, calculated based on expected long-term rate of return and market-related value of plan assets of defined benefit plan. Reference 1: http://www.xbrl.org/2003/role/exampleRef
-Topic 715
-SubTopic 20
-Name Accounting Standards Codification
-Section 55
-Paragraph 17
-Publisher FASB
-URI https://asc.fasb.org//1943274/2147480482/715-20-55-17
Reference 2: http://www.xbrl.org/2003/role/disclosureRef
-Topic 715
-SubTopic 20
-Name Accounting Standards Codification
-Section 45
-Paragraph 3A
-Subparagraph (b)
-Publisher FASB
-URI https://asc.fasb.org//1943274/2147480535/715-20-45-3A
Reference 3: http://www.xbrl.org/2003/role/exampleRef
-Topic 715
-SubTopic 20
-Name Accounting Standards Codification
-Section 55
-Paragraph 18
-Publisher FASB
-URI https://asc.fasb.org//1943274/2147480482/715-20-55-18
Reference 4: http://www.xbrl.org/2003/role/disclosureRef
-Topic 715
-SubTopic 20
-Name Accounting Standards Codification
-Section 50
-Paragraph 1
-Subparagraph (h)(3)
-Publisher FASB
-URI https://asc.fasb.org//1943274/2147480506/715-20-50-1
Reference 5: http://www.xbrl.org/2003/role/disclosureRef
-Topic 715
-SubTopic 20
-Name Accounting Standards Codification
-Section 50
-Paragraph 6
-Subparagraph (a)(3)
-Publisher FASB
-URI https://asc.fasb.org//1943274/2147480506/715-20-50-6
| Name: |
us-gaap_DefinedBenefitPlanExpectedReturnOnPlanAssets |
| Namespace Prefix: |
us-gaap_ |
| Data Type: |
xbrli:monetaryItemType |
| Balance Type: |
credit |
| Period Type: |
duration |
|
| X |
- DefinitionAmount of cost recognized for passage of time related to defined benefit plan. Reference 1: http://www.xbrl.org/2003/role/exampleRef
-Topic 715
-SubTopic 20
-Name Accounting Standards Codification
-Section 55
-Paragraph 17
-Publisher FASB
-URI https://asc.fasb.org//1943274/2147480482/715-20-55-17
Reference 2: http://www.xbrl.org/2003/role/disclosureRef
-Topic 715
-SubTopic 20
-Name Accounting Standards Codification
-Section 45
-Paragraph 3A
-Subparagraph (b)
-Publisher FASB
-URI https://asc.fasb.org//1943274/2147480535/715-20-45-3A
Reference 3: http://www.xbrl.org/2003/role/exampleRef
-Topic 715
-SubTopic 20
-Name Accounting Standards Codification
-Section 55
-Paragraph 18
-Publisher FASB
-URI https://asc.fasb.org//1943274/2147480482/715-20-55-18
Reference 4: http://www.xbrl.org/2003/role/disclosureRef
-Topic 715
-SubTopic 20
-Name Accounting Standards Codification
-Section 50
-Paragraph 1
-Subparagraph (a)(2)
-Publisher FASB
-URI https://asc.fasb.org//1943274/2147480506/715-20-50-1
Reference 5: http://www.xbrl.org/2003/role/disclosureRef
-Topic 715
-SubTopic 20
-Name Accounting Standards Codification
-Section 50
-Paragraph 1
-Subparagraph (h)(2)
-Publisher FASB
-URI https://asc.fasb.org//1943274/2147480506/715-20-50-1
Reference 6: http://www.xbrl.org/2003/role/disclosureRef
-Topic 715
-SubTopic 20
-Name Accounting Standards Codification
-Section 50
-Paragraph 6
-Subparagraph (a)(2)
-Publisher FASB
-URI https://asc.fasb.org//1943274/2147480506/715-20-50-6
| Name: |
us-gaap_DefinedBenefitPlanInterestCost |
| Namespace Prefix: |
us-gaap_ |
| Data Type: |
xbrli:monetaryItemType |
| Balance Type: |
debit |
| Period Type: |
duration |
|
| X |
- DefinitionAmount of net periodic benefit cost (credit) for defined benefit plan. Reference 1: http://www.xbrl.org/2003/role/exampleRef
-Topic 715
-SubTopic 20
-Name Accounting Standards Codification
-Section 55
-Paragraph 17
-Publisher FASB
-URI https://asc.fasb.org//1943274/2147480482/715-20-55-17
Reference 2: http://www.xbrl.org/2003/role/exampleRef
-Topic 715
-SubTopic 20
-Name Accounting Standards Codification
-Section 55
-Paragraph 18
-Publisher FASB
-URI https://asc.fasb.org//1943274/2147480482/715-20-55-18
Reference 3: http://www.xbrl.org/2003/role/disclosureRef
-Topic 715
-SubTopic 20
-Name Accounting Standards Codification
-Section 50
-Paragraph 1
-Subparagraph (h)
-Publisher FASB
-URI https://asc.fasb.org//1943274/2147480506/715-20-50-1
Reference 4: http://www.xbrl.org/2003/role/disclosureRef
-Topic 715
-SubTopic 20
-Name Accounting Standards Codification
-Section 50
-Paragraph 6
-Subparagraph (a)
-Publisher FASB
-URI https://asc.fasb.org//1943274/2147480506/715-20-50-6
| Name: |
us-gaap_DefinedBenefitPlanNetPeriodicBenefitCost |
| Namespace Prefix: |
us-gaap_ |
| Data Type: |
xbrli:monetaryItemType |
| Balance Type: |
debit |
| Period Type: |
duration |
|
v3.24.0.1
| X |
- DefinitionDefined benefit plans interest cost.
| Name: |
INSE_DefinedBenefitPlansInterestCost |
| Namespace Prefix: |
INSE_ |
| Data Type: |
xbrli:monetaryItemType |
| Balance Type: |
debit |
| Period Type: |
duration |
|
| X |
- DefinitionUnfunded status, non-current.
| Name: |
INSE_PensionAndOtherPostretirementDefinedBenefitPlansLiabilities |
| Namespace Prefix: |
INSE_ |
| Data Type: |
xbrli:monetaryItemType |
| Balance Type: |
credit |
| Period Type: |
instant |
|
| X |
- References
+ Details
| Name: |
us-gaap_CompensationAndRetirementDisclosureAbstract |
| Namespace Prefix: |
us-gaap_ |
| Data Type: |
xbrli:stringItemType |
| Balance Type: |
na |
| Period Type: |
duration |
|
| X |
- DefinitionAmount of increase (decrease) in plan assets of defined benefit plan from actual return (loss) determined by change in fair value of plan assets adjusted for contributions, benefit payments, and other expenses. Reference 1: http://www.xbrl.org/2003/role/exampleRef
-Topic 715
-SubTopic 20
-Name Accounting Standards Codification
-Section 55
-Paragraph 17
-Publisher FASB
-URI https://asc.fasb.org//1943274/2147480482/715-20-55-17
Reference 2: http://www.xbrl.org/2003/role/disclosureRef
-Topic 715
-SubTopic 20
-Name Accounting Standards Codification
-Section 50
-Paragraph 1
-Subparagraph (b)(1)
-Publisher FASB
-URI https://asc.fasb.org//1943274/2147480506/715-20-50-1
| Name: |
us-gaap_DefinedBenefitPlanActualReturnOnPlanAssets |
| Namespace Prefix: |
us-gaap_ |
| Data Type: |
xbrli:monetaryItemType |
| Balance Type: |
debit |
| Period Type: |
duration |
|
| X |
- DefinitionAmount of gain (loss) from change in actuarial assumptions which (increases) decreases benefit obligation of defined benefit plan. Assumptions include, but are not limited to, interest, mortality, employee turnover, salary, and temporary deviation from substantive plan. Reference 1: http://www.xbrl.org/2003/role/disclosureRef
-Topic 715
-SubTopic 20
-Name Accounting Standards Codification
-Section 50
-Paragraph 1
-Subparagraph (a)(4)
-Publisher FASB
-URI https://asc.fasb.org//1943274/2147480506/715-20-50-1
| Name: |
us-gaap_DefinedBenefitPlanActuarialGainLoss |
| Namespace Prefix: |
us-gaap_ |
| Data Type: |
xbrli:monetaryItemType |
| Balance Type: |
credit |
| Period Type: |
duration |
|
| X |
- DefinitionAmount of asset (liability), recognized in statement of financial position, for defined benefit pension and other postretirement plans. Reference 1: http://fasb.org/us-gaap/role/ref/legacyRef
-Name Accounting Standards Codification
-Topic 715
-SubTopic 20
-Section 45
-Paragraph 2
-Publisher FASB
-URI https://asc.fasb.org//1943274/2147480535/715-20-45-2
Reference 2: http://fasb.org/us-gaap/role/ref/legacyRef
-Name Accounting Standards Codification
-Topic 715
-SubTopic 20
-Section 50
-Paragraph 1
-Subparagraph (c)
-Publisher FASB
-URI https://asc.fasb.org//1943274/2147480506/715-20-50-1
| Name: |
us-gaap_DefinedBenefitPlanAmountsRecognizedInBalanceSheet |
| Namespace Prefix: |
us-gaap_ |
| Data Type: |
xbrli:monetaryItemType |
| Balance Type: |
debit |
| Period Type: |
instant |
|
| X |
- DefinitionAmount of actuarial present value of benefits attributed to service rendered by employee for defined benefit plan. Reference 1: http://www.xbrl.org/2003/role/disclosureRef
-Topic 715
-SubTopic 20
-Name Accounting Standards Codification
-Section 50
-Paragraph 1
-Subparagraph (a)
-Publisher FASB
-URI https://asc.fasb.org//1943274/2147480506/715-20-50-1
| Name: |
us-gaap_DefinedBenefitPlanBenefitObligation |
| Namespace Prefix: |
us-gaap_ |
| Data Type: |
xbrli:monetaryItemType |
| Balance Type: |
credit |
| Period Type: |
instant |
|
| X |
- DefinitionAmount of payment to participant of defined benefit plan which decreases benefit obligation. For pension plan, payment includes, but is not limited to, pension benefits and death benefits. For other postretirement plan, payment includes, but is not limited to, prescription drug benefits, health care benefits, life insurance benefits, and legal, educational and advisory services. Reference 1: http://www.xbrl.org/2003/role/disclosureRef
-Topic 715
-SubTopic 60
-Name Accounting Standards Codification
-Section 50
-Paragraph 4
-Publisher FASB
-URI https://asc.fasb.org//1943274/2147480266/715-60-50-4
Reference 2: http://www.xbrl.org/2003/role/disclosureRef
-Topic 715
-SubTopic 20
-Name Accounting Standards Codification
-Section 50
-Paragraph 1
-Subparagraph (a)(6)
-Publisher FASB
-URI https://asc.fasb.org//1943274/2147480506/715-20-50-1
| Name: |
us-gaap_DefinedBenefitPlanBenefitObligationBenefitsPaid |
| Namespace Prefix: |
us-gaap_ |
| Data Type: |
xbrli:monetaryItemType |
| Balance Type: |
credit |
| Period Type: |
duration |
|
| X |
- DefinitionAmount of contribution received by defined benefit plan from employer which increases plan assets. Reference 1: http://www.xbrl.org/2003/role/exampleRef
-Topic 715
-SubTopic 20
-Name Accounting Standards Codification
-Section 55
-Paragraph 17
-Publisher FASB
-URI https://asc.fasb.org//1943274/2147480482/715-20-55-17
Reference 2: http://www.xbrl.org/2003/role/disclosureRef
-Topic 715
-SubTopic 20
-Name Accounting Standards Codification
-Section 50
-Paragraph 1
-Subparagraph (d)(iv)(01)
-Publisher FASB
-URI https://asc.fasb.org//1943274/2147480506/715-20-50-1
Reference 3: http://www.xbrl.org/2003/role/exampleRef
-Topic 715
-SubTopic 20
-Name Accounting Standards Codification
-Section 55
-Paragraph 18
-Publisher FASB
-URI https://asc.fasb.org//1943274/2147480482/715-20-55-18
Reference 4: http://www.xbrl.org/2003/role/disclosureRef
-Topic 715
-SubTopic 20
-Name Accounting Standards Codification
-Section 50
-Paragraph 6
-Subparagraph (b)
-Publisher FASB
-URI https://asc.fasb.org//1943274/2147480506/715-20-50-6
Reference 5: http://www.xbrl.org/2003/role/disclosureRef
-Topic 715
-SubTopic 20
-Name Accounting Standards Codification
-Section 50
-Paragraph 1
-Subparagraph (b)(3)
-Publisher FASB
-URI https://asc.fasb.org//1943274/2147480506/715-20-50-1
Reference 6: http://www.xbrl.org/2003/role/exampleRef
-Topic 715
-SubTopic 20
-Name Accounting Standards Codification
-Section 50
-Paragraph 1
-Subparagraph (d)(ii)
-Publisher FASB
-URI https://asc.fasb.org//1943274/2147480506/715-20-50-1
Reference 7: http://www.xbrl.org/2003/role/exampleRef
-Topic 715
-SubTopic 20
-Name Accounting Standards Codification
-Section 50
-Paragraph 1
-Subparagraph (d)(iv)(01)
-Publisher FASB
-URI https://asc.fasb.org//1943274/2147480506/715-20-50-1
| Name: |
us-gaap_DefinedBenefitPlanContributionsByEmployer |
| Namespace Prefix: |
us-gaap_ |
| Data Type: |
xbrli:monetaryItemType |
| Balance Type: |
debit |
| Period Type: |
duration |
|
| X |
- DefinitionAmount of asset segregated and restricted to provide benefit under defined benefit plan. Asset includes, but is not limited to, stock, bond, other investment, earning from investment, and contribution by employer and employee. Reference 1: http://www.xbrl.org/2003/role/exampleRef
-Topic 715
-SubTopic 20
-Name Accounting Standards Codification
-Section 55
-Paragraph 17
-Publisher FASB
-URI https://asc.fasb.org//1943274/2147480482/715-20-55-17
Reference 2: http://www.xbrl.org/2003/role/disclosureRef
-Topic 715
-SubTopic 20
-Name Accounting Standards Codification
-Section 50
-Paragraph 1
-Subparagraph (d)(iv)(02)
-Publisher FASB
-URI https://asc.fasb.org//1943274/2147480506/715-20-50-1
Reference 3: http://www.xbrl.org/2003/role/disclosureRef
-Topic 715
-SubTopic 20
-Name Accounting Standards Codification
-Section 50
-Paragraph 1
-Subparagraph (d)(ii)
-Publisher FASB
-URI https://asc.fasb.org//1943274/2147480506/715-20-50-1
Reference 4: http://www.xbrl.org/2003/role/disclosureRef
-Topic 715
-SubTopic 20
-Name Accounting Standards Codification
-Section 50
-Paragraph 1
-Subparagraph (d)(iv)(01)
-Publisher FASB
-URI https://asc.fasb.org//1943274/2147480506/715-20-50-1
Reference 5: http://www.xbrl.org/2003/role/disclosureRef
-Topic 715
-SubTopic 20
-Name Accounting Standards Codification
-Section 50
-Paragraph 1
-Subparagraph (b)
-Publisher FASB
-URI https://asc.fasb.org//1943274/2147480506/715-20-50-1
Reference 6: http://www.xbrl.org/2003/role/exampleRef
-Topic 715
-SubTopic 20
-Name Accounting Standards Codification
-Section 50
-Paragraph 1
-Subparagraph (d)(ii)
-Publisher FASB
-URI https://asc.fasb.org//1943274/2147480506/715-20-50-1
Reference 7: http://www.xbrl.org/2003/role/exampleRef
-Topic 715
-SubTopic 20
-Name Accounting Standards Codification
-Section 50
-Paragraph 1
-Subparagraph (d)(iv)(01)
-Publisher FASB
-URI https://asc.fasb.org//1943274/2147480506/715-20-50-1
| Name: |
us-gaap_DefinedBenefitPlanFairValueOfPlanAssets |
| Namespace Prefix: |
us-gaap_ |
| Data Type: |
xbrli:monetaryItemType |
| Balance Type: |
debit |
| Period Type: |
instant |
|
| X |
- DefinitionAmount of foreign currency translation gain (loss) which (increases) decreases benefit obligation of defined benefit plan. Reference 1: http://www.xbrl.org/2003/role/disclosureRef
-Topic 715
-SubTopic 20
-Name Accounting Standards Codification
-Section 50
-Paragraph 1
-Subparagraph (a)(5)
-Publisher FASB
-URI https://asc.fasb.org//1943274/2147480506/715-20-50-1
| Name: |
us-gaap_DefinedBenefitPlanForeignCurrencyExchangeRateChangesBenefitObligation |
| Namespace Prefix: |
us-gaap_ |
| Data Type: |
xbrli:monetaryItemType |
| Balance Type: |
credit |
| Period Type: |
duration |
|
| X |
- DefinitionAmount of payment to participant under defined benefit plan which decreases plan assets. For pension plan, payment includes, but is not limited to, pension benefits and death benefits. For other postretirement plan, payment includes, but is not limited to, prescription drug benefits, health care benefits, life insurance benefits, and legal, educational and advisory services. Reference 1: http://www.xbrl.org/2009/role/commonPracticeRef
-Topic 715
-SubTopic 60
-Name Accounting Standards Codification
-Section 50
-Paragraph 4
-Publisher FASB
-URI https://asc.fasb.org//1943274/2147480266/715-60-50-4
Reference 2: http://www.xbrl.org/2003/role/disclosureRef
-Topic 715
-SubTopic 20
-Name Accounting Standards Codification
-Section 50
-Paragraph 1
-Subparagraph (b)(5)
-Publisher FASB
-URI https://asc.fasb.org//1943274/2147480506/715-20-50-1
| Name: |
us-gaap_DefinedBenefitPlanPlanAssetsBenefitsPaid |
| Namespace Prefix: |
us-gaap_ |
| Data Type: |
xbrli:monetaryItemType |
| Balance Type: |
credit |
| Period Type: |
duration |
|
| X |
- DefinitionAmount of foreign currency translation gain (loss) which increases (decreases) plan assets of defined benefit plan. Reference 1: http://www.xbrl.org/2003/role/disclosureRef
-Topic 715
-SubTopic 20
-Name Accounting Standards Codification
-Section 50
-Paragraph 1
-Subparagraph (b)(2)
-Publisher FASB
-URI https://asc.fasb.org//1943274/2147480506/715-20-50-1
| Name: |
us-gaap_DefinedBenefitPlanPlanAssetsForeignCurrencyTranslationGainLoss |
| Namespace Prefix: |
us-gaap_ |
| Data Type: |
xbrli:monetaryItemType |
| Balance Type: |
credit |
| Period Type: |
duration |
|
v3.24.0.1
| X |
- DefinitionPension contingent contributions.
| Name: |
INSE_PensionContingentContributions |
| Namespace Prefix: |
INSE_ |
| Data Type: |
xbrli:monetaryItemType |
| Balance Type: |
credit |
| Period Type: |
instant |
|
| X |
- DefinitionPension expense contributions.
| Name: |
INSE_PensionExpenseContributions |
| Namespace Prefix: |
INSE_ |
| Data Type: |
xbrli:monetaryItemType |
| Balance Type: |
credit |
| Period Type: |
instant |
|
| X |
- DefinitionAmount of contribution received by defined benefit plan from employer which increases plan assets. Reference 1: http://www.xbrl.org/2003/role/exampleRef
-Topic 715
-SubTopic 20
-Name Accounting Standards Codification
-Section 55
-Paragraph 17
-Publisher FASB
-URI https://asc.fasb.org//1943274/2147480482/715-20-55-17
Reference 2: http://www.xbrl.org/2003/role/disclosureRef
-Topic 715
-SubTopic 20
-Name Accounting Standards Codification
-Section 50
-Paragraph 1
-Subparagraph (d)(iv)(01)
-Publisher FASB
-URI https://asc.fasb.org//1943274/2147480506/715-20-50-1
Reference 3: http://www.xbrl.org/2003/role/exampleRef
-Topic 715
-SubTopic 20
-Name Accounting Standards Codification
-Section 55
-Paragraph 18
-Publisher FASB
-URI https://asc.fasb.org//1943274/2147480482/715-20-55-18
Reference 4: http://www.xbrl.org/2003/role/disclosureRef
-Topic 715
-SubTopic 20
-Name Accounting Standards Codification
-Section 50
-Paragraph 6
-Subparagraph (b)
-Publisher FASB
-URI https://asc.fasb.org//1943274/2147480506/715-20-50-6
Reference 5: http://www.xbrl.org/2003/role/disclosureRef
-Topic 715
-SubTopic 20
-Name Accounting Standards Codification
-Section 50
-Paragraph 1
-Subparagraph (b)(3)
-Publisher FASB
-URI https://asc.fasb.org//1943274/2147480506/715-20-50-1
Reference 6: http://www.xbrl.org/2003/role/exampleRef
-Topic 715
-SubTopic 20
-Name Accounting Standards Codification
-Section 50
-Paragraph 1
-Subparagraph (d)(ii)
-Publisher FASB
-URI https://asc.fasb.org//1943274/2147480506/715-20-50-1
Reference 7: http://www.xbrl.org/2003/role/exampleRef
-Topic 715
-SubTopic 20
-Name Accounting Standards Codification
-Section 50
-Paragraph 1
-Subparagraph (d)(iv)(01)
-Publisher FASB
-URI https://asc.fasb.org//1943274/2147480506/715-20-50-1
| Name: |
us-gaap_DefinedBenefitPlanContributionsByEmployer |
| Namespace Prefix: |
us-gaap_ |
| Data Type: |
xbrli:monetaryItemType |
| Balance Type: |
debit |
| Period Type: |
duration |
|
| X |
- DefinitionDetail information of subsequent event by type. User is expected to use existing line items from elsewhere in the taxonomy as the primary line items for this disclosure, which is further associated with dimension and member elements pertaining to a subsequent event. Reference 1: http://www.xbrl.org/2003/role/disclosureRef
-Topic 830
-SubTopic 30
-Name Accounting Standards Codification
-Section 50
-Paragraph 2
-Publisher FASB
-URI https://asc.fasb.org//1943274/2147481674/830-30-50-2
Reference 2: http://www.xbrl.org/2003/role/disclosureRef
-Topic 855
-SubTopic 10
-Name Accounting Standards Codification
-Section 50
-Paragraph 2
-Publisher FASB
-URI https://asc.fasb.org//1943274/2147483399/855-10-50-2
| Name: |
us-gaap_SubsequentEventLineItems |
| Namespace Prefix: |
us-gaap_ |
| Data Type: |
xbrli:stringItemType |
| Balance Type: |
na |
| Period Type: |
duration |
|
| X |
- Details
| Name: |
us-gaap_SubsequentEventTypeAxis=us-gaap_SubsequentEventMember |
| Namespace Prefix: |
|
| Data Type: |
na |
| Balance Type: |
|
| Period Type: |
|
|
v3.24.0.1
| X |
- DefinitionAmount after tax of income (loss) from continuing operations attributable to the parent.
| Name: |
INSE_SegmentOperatingIncomeLossFromContinuingOperations |
| Namespace Prefix: |
INSE_ |
| Data Type: |
xbrli:monetaryItemType |
| Balance Type: |
credit |
| Period Type: |
duration |
|
| X |
- DefinitionAmount of capital expenditure attributable to discontinued operations. Reference 1: http://fasb.org/us-gaap/role/ref/legacyRef
-Topic 205
-SubTopic 20
-Name Accounting Standards Codification
-Section 50
-Paragraph 5B
-Subparagraph (c)(2)
-Publisher FASB
-URI https://asc.fasb.org//1943274/2147483499/205-20-50-5B
| Name: |
us-gaap_CapitalExpenditureDiscontinuedOperations |
| Namespace Prefix: |
us-gaap_ |
| Data Type: |
xbrli:monetaryItemType |
| Balance Type: |
debit |
| Period Type: |
duration |
|
| X |
- DefinitionThe aggregate costs related to goods produced and sold and services rendered by an entity during the reporting period. This excludes costs incurred during the reporting period related to financial services rendered and other revenue generating activities. Reference 1: http://www.xbrl.org/2003/role/disclosureRef
-Topic 924
-SubTopic 10
-Name Accounting Standards Codification
-Section S99
-Paragraph 1
-Subparagraph (SAB Topic 11.L)
-Publisher FASB
-URI https://asc.fasb.org//1943274/2147479941/924-10-S99-1
Reference 2: http://fasb.org/us-gaap/role/ref/legacyRef
-Topic 220
-SubTopic 10
-Name Accounting Standards Codification
-Section S99
-Paragraph 2
-Subparagraph (SX 210.5-03.2(a),(d))
-Publisher FASB
-URI https://asc.fasb.org//1943274/2147483621/220-10-S99-2
| Name: |
us-gaap_CostOfGoodsAndServicesSold |
| Namespace Prefix: |
us-gaap_ |
| Data Type: |
xbrli:monetaryItemType |
| Balance Type: |
debit |
| Period Type: |
duration |
|
| X |
- DefinitionThe current period expense charged against earnings on long-lived, physical assets not used in production, and which are not intended for resale, to allocate or recognize the cost of such assets over their useful lives; or to record the reduction in book value of an intangible asset over the benefit period of such asset; or to reflect consumption during the period of an asset that is not used in production. Reference 1: http://fasb.org/us-gaap/role/ref/legacyRef
-Name Accounting Standards Codification
-Section 45
-Paragraph 28
-Subparagraph (b)
-SubTopic 10
-Topic 230
-Publisher FASB
-URI https://asc.fasb.org//1943274/2147482740/230-10-45-28
Reference 2: http://fasb.org/us-gaap/role/ref/legacyRef
-Name Accounting Standards Codification
-Topic 360
-SubTopic 10
-Section 50
-Paragraph 1
-Subparagraph (a)
-Publisher FASB
-URI https://asc.fasb.org//1943274/2147482099/360-10-50-1
| Name: |
us-gaap_DepreciationAndAmortization |
| Namespace Prefix: |
us-gaap_ |
| Data Type: |
xbrli:monetaryItemType |
| Balance Type: |
debit |
| Period Type: |
duration |
|
| X |
- DefinitionThe net result for the period of deducting operating expenses from operating revenues. Reference 1: http://www.xbrl.org/2003/role/disclosureRef
-Topic 280
-SubTopic 10
-Name Accounting Standards Codification
-Section 50
-Paragraph 22
-Publisher FASB
-URI https://asc.fasb.org//1943274/2147482810/280-10-50-22
Reference 2: http://www.xbrl.org/2003/role/disclosureRef
-Topic 280
-SubTopic 10
-Name Accounting Standards Codification
-Section 50
-Paragraph 30
-Subparagraph (b)
-Publisher FASB
-URI https://asc.fasb.org//1943274/2147482810/280-10-50-30
Reference 3: http://www.xbrl.org/2003/role/disclosureRef
-Topic 280
-SubTopic 10
-Name Accounting Standards Codification
-Section 50
-Paragraph 32
-Subparagraph (f)
-Publisher FASB
-URI https://asc.fasb.org//1943274/2147482810/280-10-50-32
Reference 4: http://www.xbrl.org/2003/role/exampleRef
-Topic 280
-SubTopic 10
-Name Accounting Standards Codification
-Section 50
-Paragraph 31
-Publisher FASB
-URI https://asc.fasb.org//1943274/2147482810/280-10-50-31
Reference 5: http://www.xbrl.org/2003/role/disclosureRef
-Topic 280
-SubTopic 10
-Name Accounting Standards Codification
-Section 50
-Paragraph 32
-Subparagraph (c)
-Publisher FASB
-URI https://asc.fasb.org//1943274/2147482810/280-10-50-32
| Name: |
us-gaap_OperatingIncomeLoss |
| Namespace Prefix: |
us-gaap_ |
| Data Type: |
xbrli:monetaryItemType |
| Balance Type: |
credit |
| Period Type: |
duration |
|
| X |
- DefinitionAmount, excluding tax collected from customer, of revenue from satisfaction of performance obligation by transferring promised good or service to customer. Tax collected from customer is tax assessed by governmental authority that is both imposed on and concurrent with specific revenue-producing transaction, including, but not limited to, sales, use, value added and excise. Reference 1: http://www.xbrl.org/2003/role/disclosureRef
-Topic 924
-SubTopic 10
-Name Accounting Standards Codification
-Section S99
-Paragraph 1
-Subparagraph (SAB Topic 11.L)
-Publisher FASB
-URI https://asc.fasb.org//1943274/2147479941/924-10-S99-1
Reference 2: http://www.xbrl.org/2003/role/disclosureRef
-Topic 606
-SubTopic 10
-Name Accounting Standards Codification
-Section 50
-Paragraph 5
-Publisher FASB
-URI https://asc.fasb.org//1943274/2147479806/606-10-50-5
Reference 3: http://www.xbrl.org/2003/role/disclosureRef
-Topic 280
-SubTopic 10
-Name Accounting Standards Codification
-Section 50
-Paragraph 30
-Subparagraph (a)
-Publisher FASB
-URI https://asc.fasb.org//1943274/2147482810/280-10-50-30
Reference 4: http://www.xbrl.org/2003/role/disclosureRef
-Topic 280
-SubTopic 10
-Name Accounting Standards Codification
-Section 50
-Paragraph 42
-Publisher FASB
-URI https://asc.fasb.org//1943274/2147482810/280-10-50-42
Reference 5: http://www.xbrl.org/2003/role/disclosureRef
-Topic 280
-SubTopic 10
-Name Accounting Standards Codification
-Section 50
-Paragraph 22
-Subparagraph (b)
-Publisher FASB
-URI https://asc.fasb.org//1943274/2147482810/280-10-50-22
Reference 6: http://www.xbrl.org/2003/role/disclosureRef
-Topic 280
-SubTopic 10
-Name Accounting Standards Codification
-Section 50
-Paragraph 32
-Subparagraph (b)
-Publisher FASB
-URI https://asc.fasb.org//1943274/2147482810/280-10-50-32
Reference 7: http://www.xbrl.org/2003/role/disclosureRef
-Topic 280
-SubTopic 10
-Name Accounting Standards Codification
-Section 50
-Paragraph 40
-Publisher FASB
-URI https://asc.fasb.org//1943274/2147482810/280-10-50-40
Reference 8: http://www.xbrl.org/2003/role/disclosureRef
-Topic 280
-SubTopic 10
-Name Accounting Standards Codification
-Section 50
-Paragraph 22
-Subparagraph (a)
-Publisher FASB
-URI https://asc.fasb.org//1943274/2147482810/280-10-50-22
Reference 9: http://www.xbrl.org/2003/role/disclosureRef
-Topic 280
-SubTopic 10
-Name Accounting Standards Codification
-Section 50
-Paragraph 32
-Subparagraph (a)
-Publisher FASB
-URI https://asc.fasb.org//1943274/2147482810/280-10-50-32
Reference 10: http://www.xbrl.org/2003/role/disclosureRef
-Topic 280
-SubTopic 10
-Name Accounting Standards Codification
-Section 50
-Paragraph 41
-Subparagraph (a)
-Publisher FASB
-URI https://asc.fasb.org//1943274/2147482810/280-10-50-41
Reference 11: http://www.xbrl.org/2003/role/disclosureRef
-Topic 606
-SubTopic 10
-Name Accounting Standards Codification
-Section 50
-Paragraph 4
-Subparagraph (a)
-Publisher FASB
-URI https://asc.fasb.org//1943274/2147479806/606-10-50-4
| Name: |
us-gaap_RevenueFromContractWithCustomerExcludingAssessedTax |
| Namespace Prefix: |
us-gaap_ |
| Data Type: |
xbrli:monetaryItemType |
| Balance Type: |
credit |
| Period Type: |
duration |
|
| X |
- DefinitionThe aggregate total costs related to selling a firm's product and services, as well as all other general and administrative expenses. Direct selling expenses (for example, credit, warranty, and advertising) are expenses that can be directly linked to the sale of specific products. Indirect selling expenses are expenses that cannot be directly linked to the sale of specific products, for example telephone expenses, Internet, and postal charges. General and administrative expenses include salaries of non-sales personnel, rent, utilities, communication, etc. Reference 1: http://fasb.org/us-gaap/role/ref/legacyRef
-Topic 220
-SubTopic 10
-Name Accounting Standards Codification
-Section S99
-Paragraph 2
-Subparagraph (SX 210.5-03.4)
-Publisher FASB
-URI https://asc.fasb.org//1943274/2147483621/220-10-S99-2
| Name: |
us-gaap_SellingGeneralAndAdministrativeExpense |
| Namespace Prefix: |
us-gaap_ |
| Data Type: |
xbrli:monetaryItemType |
| Balance Type: |
debit |
| Period Type: |
duration |
|
| X |
- DefinitionAmount of noncash expense for share-based payment arrangement. Reference 1: http://fasb.org/us-gaap/role/ref/legacyRef
-Name Accounting Standards Codification
-Section 45
-Paragraph 28
-Subparagraph (a)
-SubTopic 10
-Topic 230
-Publisher FASB
-URI https://asc.fasb.org//1943274/2147482740/230-10-45-28
| Name: |
us-gaap_ShareBasedCompensation |
| Namespace Prefix: |
us-gaap_ |
| Data Type: |
xbrli:monetaryItemType |
| Balance Type: |
debit |
| Period Type: |
duration |
|
| X |
- Details
| Name: |
srt_ProductOrServiceAxis=us-gaap_ServiceMember |
| Namespace Prefix: |
|
| Data Type: |
na |
| Balance Type: |
|
| Period Type: |
|
|
| X |
- Details
| Name: |
srt_ProductOrServiceAxis=INSE_ProductSalesMember |
| Namespace Prefix: |
|
| Data Type: |
na |
| Balance Type: |
|
| Period Type: |
|
|
| X |
- Details
| Name: |
us-gaap_StatementBusinessSegmentsAxis=INSE_GamingMember |
| Namespace Prefix: |
|
| Data Type: |
na |
| Balance Type: |
|
| Period Type: |
|
|
| X |
- Details
| Name: |
us-gaap_StatementBusinessSegmentsAxis=INSE_VirtualsportsMember |
| Namespace Prefix: |
|
| Data Type: |
na |
| Balance Type: |
|
| Period Type: |
|
|
| X |
- Details
| Name: |
us-gaap_StatementBusinessSegmentsAxis=INSE_InteractiveMember |
| Namespace Prefix: |
|
| Data Type: |
na |
| Balance Type: |
|
| Period Type: |
|
|
| X |
- Details
| Name: |
us-gaap_StatementBusinessSegmentsAxis=INSE_LeisureMember |
| Namespace Prefix: |
|
| Data Type: |
na |
| Balance Type: |
|
| Period Type: |
|
|
| X |
- Details
| Name: |
us-gaap_StatementBusinessSegmentsAxis=INSE_CorporateFunctionsMember |
| Namespace Prefix: |
|
| Data Type: |
na |
| Balance Type: |
|
| Period Type: |
|
|
v3.24.0.1
| X |
- DefinitionNon-current assets excluding goodwill.
| Name: |
INSE_NoncurrentAssetsExcludingGoodwill |
| Namespace Prefix: |
INSE_ |
| Data Type: |
xbrli:monetaryItemType |
| Balance Type: |
debit |
| Period Type: |
instant |
|
| X |
- DefinitionAmount, excluding tax collected from customer, of revenue from satisfaction of performance obligation by transferring promised good or service to customer. Tax collected from customer is tax assessed by governmental authority that is both imposed on and concurrent with specific revenue-producing transaction, including, but not limited to, sales, use, value added and excise. Reference 1: http://www.xbrl.org/2003/role/disclosureRef
-Topic 924
-SubTopic 10
-Name Accounting Standards Codification
-Section S99
-Paragraph 1
-Subparagraph (SAB Topic 11.L)
-Publisher FASB
-URI https://asc.fasb.org//1943274/2147479941/924-10-S99-1
Reference 2: http://www.xbrl.org/2003/role/disclosureRef
-Topic 606
-SubTopic 10
-Name Accounting Standards Codification
-Section 50
-Paragraph 5
-Publisher FASB
-URI https://asc.fasb.org//1943274/2147479806/606-10-50-5
Reference 3: http://www.xbrl.org/2003/role/disclosureRef
-Topic 280
-SubTopic 10
-Name Accounting Standards Codification
-Section 50
-Paragraph 30
-Subparagraph (a)
-Publisher FASB
-URI https://asc.fasb.org//1943274/2147482810/280-10-50-30
Reference 4: http://www.xbrl.org/2003/role/disclosureRef
-Topic 280
-SubTopic 10
-Name Accounting Standards Codification
-Section 50
-Paragraph 42
-Publisher FASB
-URI https://asc.fasb.org//1943274/2147482810/280-10-50-42
Reference 5: http://www.xbrl.org/2003/role/disclosureRef
-Topic 280
-SubTopic 10
-Name Accounting Standards Codification
-Section 50
-Paragraph 22
-Subparagraph (b)
-Publisher FASB
-URI https://asc.fasb.org//1943274/2147482810/280-10-50-22
Reference 6: http://www.xbrl.org/2003/role/disclosureRef
-Topic 280
-SubTopic 10
-Name Accounting Standards Codification
-Section 50
-Paragraph 32
-Subparagraph (b)
-Publisher FASB
-URI https://asc.fasb.org//1943274/2147482810/280-10-50-32
Reference 7: http://www.xbrl.org/2003/role/disclosureRef
-Topic 280
-SubTopic 10
-Name Accounting Standards Codification
-Section 50
-Paragraph 40
-Publisher FASB
-URI https://asc.fasb.org//1943274/2147482810/280-10-50-40
Reference 8: http://www.xbrl.org/2003/role/disclosureRef
-Topic 280
-SubTopic 10
-Name Accounting Standards Codification
-Section 50
-Paragraph 22
-Subparagraph (a)
-Publisher FASB
-URI https://asc.fasb.org//1943274/2147482810/280-10-50-22
Reference 9: http://www.xbrl.org/2003/role/disclosureRef
-Topic 280
-SubTopic 10
-Name Accounting Standards Codification
-Section 50
-Paragraph 32
-Subparagraph (a)
-Publisher FASB
-URI https://asc.fasb.org//1943274/2147482810/280-10-50-32
Reference 10: http://www.xbrl.org/2003/role/disclosureRef
-Topic 280
-SubTopic 10
-Name Accounting Standards Codification
-Section 50
-Paragraph 41
-Subparagraph (a)
-Publisher FASB
-URI https://asc.fasb.org//1943274/2147482810/280-10-50-41
Reference 11: http://www.xbrl.org/2003/role/disclosureRef
-Topic 606
-SubTopic 10
-Name Accounting Standards Codification
-Section 50
-Paragraph 4
-Subparagraph (a)
-Publisher FASB
-URI https://asc.fasb.org//1943274/2147479806/606-10-50-4
| Name: |
us-gaap_RevenueFromContractWithCustomerExcludingAssessedTax |
| Namespace Prefix: |
us-gaap_ |
| Data Type: |
xbrli:monetaryItemType |
| Balance Type: |
credit |
| Period Type: |
duration |
|
| X |
- DefinitionLine items represent financial concepts included in a table. These concepts are used to disclose reportable information associated with domain members defined in one or many axes to the table.
| Name: |
us-gaap_RevenuesFromExternalCustomersAndLongLivedAssetsLineItems |
| Namespace Prefix: |
us-gaap_ |
| Data Type: |
xbrli:stringItemType |
| Balance Type: |
na |
| Period Type: |
duration |
|
| X |
- Details
| Name: |
srt_StatementGeographicalAxis=country_GB |
| Namespace Prefix: |
|
| Data Type: |
na |
| Balance Type: |
|
| Period Type: |
|
|
| X |
- Details
| Name: |
srt_StatementGeographicalAxis=country_GR |
| Namespace Prefix: |
|
| Data Type: |
na |
| Balance Type: |
|
| Period Type: |
|
|
| X |
- Details
| Name: |
srt_StatementGeographicalAxis=INSE_RestOfWorldMember |
| Namespace Prefix: |
|
| Data Type: |
na |
| Balance Type: |
|
| Period Type: |
|
|
v3.24.0.1
| X |
- DefinitionLine items represent financial concepts included in a table. These concepts are used to disclose reportable information associated with domain members defined in one or many axes to the table. Reference 1: http://www.xbrl.org/2003/role/disclosureRef
-Topic 954
-SubTopic 310
-Name Accounting Standards Codification
-Section 50
-Paragraph 2
-Publisher FASB
-URI https://asc.fasb.org//1943274/2147481027/954-310-50-2
| Name: |
us-gaap_ConcentrationRiskLineItems |
| Namespace Prefix: |
us-gaap_ |
| Data Type: |
xbrli:stringItemType |
| Balance Type: |
na |
| Period Type: |
duration |
|
| X |
- DefinitionFor an entity that discloses a concentration risk in relation to quantitative amount, which serves as the "benchmark" (or denominator) in the equation, this concept represents the concentration percentage derived from the division. Reference 1: http://www.xbrl.org/2003/role/disclosureRef
-Topic 280
-SubTopic 10
-Name Accounting Standards Codification
-Section 50
-Paragraph 42
-Publisher FASB
-URI https://asc.fasb.org//1943274/2147482810/280-10-50-42
Reference 2: http://fasb.org/us-gaap/role/ref/legacyRef
-Name Accounting Standards Codification
-Topic 825
-SubTopic 10
-Section 50
-Paragraph 21
-Subparagraph (a)
-Publisher FASB
-URI https://asc.fasb.org//1943274/2147482907/825-10-50-21
Reference 3: http://fasb.org/us-gaap/role/ref/legacyRef
-Name Accounting Standards Codification
-Topic 825
-SubTopic 10
-Section 50
-Paragraph 20
-Publisher FASB
-URI https://asc.fasb.org//1943274/2147482907/825-10-50-20
Reference 4: http://fasb.org/us-gaap/role/ref/legacyRef
-Name Accounting Standards Codification
-Topic 275
-SubTopic 10
-Section 50
-Paragraph 18
-Publisher FASB
-URI https://asc.fasb.org//1943274/2147482861/275-10-50-18
Reference 5: http://fasb.org/us-gaap/role/ref/legacyRef
-Name Accounting Standards Codification
-Topic 275
-SubTopic 10
-Section 50
-Paragraph 20
-Publisher FASB
-URI https://asc.fasb.org//1943274/2147482861/275-10-50-20
| Name: |
us-gaap_ConcentrationRiskPercentage1 |
| Namespace Prefix: |
us-gaap_ |
| Data Type: |
dtr-types:percentItemType |
| Balance Type: |
na |
| Period Type: |
duration |
|
| X |
- Details
| Name: |
us-gaap_ConcentrationRiskByBenchmarkAxis=us-gaap_SalesRevenueNetMember |
| Namespace Prefix: |
|
| Data Type: |
na |
| Balance Type: |
|
| Period Type: |
|
|
| X |
- Details
| Name: |
us-gaap_ConcentrationRiskByTypeAxis=us-gaap_CustomerConcentrationRiskMember |
| Namespace Prefix: |
|
| Data Type: |
na |
| Balance Type: |
|
| Period Type: |
|
|
| X |
- Details
| Name: |
srt_MajorCustomersAxis=INSE_CustomerOneMember |
| Namespace Prefix: |
|
| Data Type: |
na |
| Balance Type: |
|
| Period Type: |
|
|
| X |
- Details
| Name: |
us-gaap_ConcentrationRiskByBenchmarkAxis=us-gaap_AccountsReceivableMember |
| Namespace Prefix: |
|
| Data Type: |
na |
| Balance Type: |
|
| Period Type: |
|
|
| X |
- Details
| Name: |
srt_MajorCustomersAxis=INSE_NoCustomerMember |
| Namespace Prefix: |
|
| Data Type: |
na |
| Balance Type: |
|
| Period Type: |
|
|
v3.24.0.1
| X |
- DefinitionNumber of shares authorized for issuance under share-based payment arrangement. Reference 1: http://www.xbrl.org/2003/role/exampleRef
-Topic 718
-SubTopic 10
-Name Accounting Standards Codification
-Section 50
-Paragraph 2
-Subparagraph (a)(3)
-Publisher FASB
-URI https://asc.fasb.org//1943274/2147480429/718-10-50-2
| Name: |
us-gaap_ShareBasedCompensationArrangementByShareBasedPaymentAwardNumberOfSharesAuthorized |
| Namespace Prefix: |
us-gaap_ |
| Data Type: |
xbrli:sharesItemType |
| Balance Type: |
na |
| Period Type: |
instant |
|
| X |
- DefinitionThe difference between the maximum number of shares (or other type of equity) authorized for issuance under the plan (including the effects of amendments and adjustments), and the sum of: 1) the number of shares (or other type of equity) already issued upon exercise of options or other equity-based awards under the plan; and 2) shares (or other type of equity) reserved for issuance on granting of outstanding awards, net of cancellations and forfeitures, if applicable. Reference 1: http://fasb.org/us-gaap/role/ref/legacyRef
-Name Accounting Standards Codification
-Topic 718
-SubTopic 10
-Section 50
-Paragraph 2
-Publisher FASB
-URI https://asc.fasb.org//1943274/2147480429/718-10-50-2
| Name: |
us-gaap_ShareBasedCompensationArrangementByShareBasedPaymentAwardNumberOfSharesAvailableForGrant |
| Namespace Prefix: |
us-gaap_ |
| Data Type: |
xbrli:sharesItemType |
| Balance Type: |
na |
| Period Type: |
instant |
|
| X |
- DefinitionDetail information of subsequent event by type. User is expected to use existing line items from elsewhere in the taxonomy as the primary line items for this disclosure, which is further associated with dimension and member elements pertaining to a subsequent event. Reference 1: http://www.xbrl.org/2003/role/disclosureRef
-Topic 830
-SubTopic 30
-Name Accounting Standards Codification
-Section 50
-Paragraph 2
-Publisher FASB
-URI https://asc.fasb.org//1943274/2147481674/830-30-50-2
Reference 2: http://www.xbrl.org/2003/role/disclosureRef
-Topic 855
-SubTopic 10
-Name Accounting Standards Codification
-Section 50
-Paragraph 2
-Publisher FASB
-URI https://asc.fasb.org//1943274/2147483399/855-10-50-2
| Name: |
us-gaap_SubsequentEventLineItems |
| Namespace Prefix: |
us-gaap_ |
| Data Type: |
xbrli:stringItemType |
| Balance Type: |
na |
| Period Type: |
duration |
|
| X |
- Details
| Name: |
us-gaap_PlanNameAxis=INSE_TwoThousandTwentyThreePlanMember |
| Namespace Prefix: |
|
| Data Type: |
na |
| Balance Type: |
|
| Period Type: |
|
|
| X |
- Details
| Name: |
us-gaap_TypeOfArrangementAxis=INSE_AmendmentToEmploymentContractOfWeilAndPierceMember |
| Namespace Prefix: |
|
| Data Type: |
na |
| Balance Type: |
|
| Period Type: |
|
|
| X |
- Details
| Name: |
us-gaap_AwardTypeAxis=INSE_StockPriceBasedRSUsMember |
| Namespace Prefix: |
|
| Data Type: |
na |
| Balance Type: |
|
| Period Type: |
|
|
| X |
- Details
| Name: |
us-gaap_SubsequentEventTypeAxis=us-gaap_SubsequentEventMember |
| Namespace Prefix: |
|
| Data Type: |
na |
| Balance Type: |
|
| Period Type: |
|
|
Inspired Entertainment (NASDAQ:INSE)
Gráfico Histórico do Ativo
De Jan 2025 até Fev 2025

Inspired Entertainment (NASDAQ:INSE)
Gráfico Histórico do Ativo
De Fev 2024 até Fev 2025

