false
0000765880
DEF 14A
0000765880
2023-01-01
2023-12-31
0000765880
peak:MrBrinkerMember
2023-01-01
2023-12-31
0000765880
peak:MrBrinkerMember
2022-01-01
2022-12-31
0000765880
peak:MrHerzogMember
2022-01-01
2022-12-31
0000765880
2022-01-01
2022-12-31
0000765880
peak:MrHerzogMember
2021-01-01
2021-12-31
0000765880
2021-01-01
2021-12-31
0000765880
peak:MrHerzogMember
2020-01-01
2020-12-31
0000765880
2020-01-01
2020-12-31
0000765880
ecd:PeoMember
peak:MrBrinkerMember
peak:GrantDateFairValueOfStockAwardsGrantedInFiscalYearMember
2023-01-01
2023-12-31
0000765880
ecd:PeoMember
peak:MrBrinkerMember
peak:GrantDateFairValueOfStockAwardsGrantedInFiscalYearMember
2022-01-01
2022-12-31
0000765880
ecd:PeoMember
peak:MrBrinkerMember
peak:FairValueAtFiscalYearEndOfOutstandingAndUnvestedStockAwardsGrantedInFiscalYearMember
2023-01-01
2023-12-31
0000765880
ecd:PeoMember
peak:MrBrinkerMember
peak:FairValueAtFiscalYearEndOfOutstandingAndUnvestedStockAwardsGrantedInFiscalYearMember
2022-01-01
2022-12-31
0000765880
ecd:PeoMember
peak:MrBrinkerMember
peak:ChangeInFairValueOfOutstandingAndUnvestedStockAwardsGrantedInPriorFiscalYearsMember
2023-01-01
2023-12-31
0000765880
ecd:PeoMember
peak:MrBrinkerMember
peak:ChangeInFairValueOfOutstandingAndUnvestedStockAwardsGrantedInPriorFiscalYearsMember
2022-01-01
2022-12-31
0000765880
ecd:PeoMember
peak:MrBrinkerMember
peak:FairValueAtVestingOfStockAwardsGrantedInFiscalYearThatVestedDuringFiscalYearMember
2023-01-01
2023-12-31
0000765880
ecd:PeoMember
peak:MrBrinkerMember
peak:FairValueAtVestingOfStockAwardsGrantedInFiscalYearThatVestedDuringFiscalYearMember
2022-01-01
2022-12-31
0000765880
ecd:PeoMember
peak:MrBrinkerMember
peak:ChangeInFairValueAsOfVestingDateOfStockAwardsGrantedInPriorFiscalYearsForWhichApplicableVestingConditionsWereSatisfiedDuringFiscalYearMember
2023-01-01
2023-12-31
0000765880
ecd:PeoMember
peak:MrBrinkerMember
peak:ChangeInFairValueAsOfVestingDateOfStockAwardsGrantedInPriorFiscalYearsForWhichApplicableVestingConditionsWereSatisfiedDuringFiscalYearMember
2022-01-01
2022-12-31
0000765880
ecd:PeoMember
peak:MrBrinkerMember
peak:FairValueAsOfPriorFiscalYearEndOfStockAwardsGrantedInPriorFiscalYearsThatFailedToMeetApplicableVestingConditionsDuringFiscalYearMember
2023-01-01
2023-12-31
0000765880
ecd:PeoMember
peak:MrBrinkerMember
peak:FairValueAsOfPriorFiscalYearEndOfStockAwardsGrantedInPriorFiscalYearsThatFailedToMeetApplicableVestingConditionsDuringFiscalYearMember
2022-01-01
2022-12-31
0000765880
ecd:PeoMember
peak:MrBrinkerMember
peak:DividendsPaidOnOutstandingAndUnvestedStockAwardsMember
2023-01-01
2023-12-31
0000765880
ecd:PeoMember
peak:MrBrinkerMember
peak:DividendsPaidOnOutstandingAndUnvestedStockAwardsMember
2022-01-01
2022-12-31
0000765880
ecd:NonPeoNeoMember
peak:GrantDateFairValueOfStockAwardsGrantedInFiscalYearMember
2023-01-01
2023-12-31
0000765880
ecd:NonPeoNeoMember
peak:GrantDateFairValueOfStockAwardsGrantedInFiscalYearMember
2022-01-01
2022-12-31
0000765880
ecd:NonPeoNeoMember
peak:GrantDateFairValueOfStockAwardsGrantedInFiscalYearMember
2021-01-01
2021-12-31
0000765880
ecd:NonPeoNeoMember
peak:GrantDateFairValueOfStockAwardsGrantedInFiscalYearMember
2020-01-01
2020-12-31
0000765880
ecd:NonPeoNeoMember
peak:FairValueAtFiscalYearEndOfOutstandingAndUnvestedStockAwardsGrantedInFiscalYearMember
2023-01-01
2023-12-31
0000765880
ecd:NonPeoNeoMember
peak:FairValueAtFiscalYearEndOfOutstandingAndUnvestedStockAwardsGrantedInFiscalYearMember
2022-01-01
2022-12-31
0000765880
ecd:NonPeoNeoMember
peak:FairValueAtFiscalYearEndOfOutstandingAndUnvestedStockAwardsGrantedInFiscalYearMember
2021-01-01
2021-12-31
0000765880
ecd:NonPeoNeoMember
peak:FairValueAtFiscalYearEndOfOutstandingAndUnvestedStockAwardsGrantedInFiscalYearMember
2020-01-01
2020-12-31
0000765880
ecd:NonPeoNeoMember
peak:ChangeInFairValueOfOutstandingAndUnvestedStockAwardsGrantedInPriorFiscalYearsMember
2023-01-01
2023-12-31
0000765880
ecd:NonPeoNeoMember
peak:ChangeInFairValueOfOutstandingAndUnvestedStockAwardsGrantedInPriorFiscalYearsMember
2022-01-01
2022-12-31
0000765880
ecd:NonPeoNeoMember
peak:ChangeInFairValueOfOutstandingAndUnvestedStockAwardsGrantedInPriorFiscalYearsMember
2021-01-01
2021-12-31
0000765880
ecd:NonPeoNeoMember
peak:ChangeInFairValueOfOutstandingAndUnvestedStockAwardsGrantedInPriorFiscalYearsMember
2020-01-01
2020-12-31
0000765880
ecd:NonPeoNeoMember
peak:FairValueAtVestingOfStockAwardsGrantedInFiscalYearThatVestedDuringFiscalYearMember
2023-01-01
2023-12-31
0000765880
ecd:NonPeoNeoMember
peak:FairValueAtVestingOfStockAwardsGrantedInFiscalYearThatVestedDuringFiscalYearMember
2022-01-01
2022-12-31
0000765880
ecd:NonPeoNeoMember
peak:FairValueAtVestingOfStockAwardsGrantedInFiscalYearThatVestedDuringFiscalYearMember
2021-01-01
2021-12-31
0000765880
ecd:NonPeoNeoMember
peak:FairValueAtVestingOfStockAwardsGrantedInFiscalYearThatVestedDuringFiscalYearMember
2020-01-01
2020-12-31
0000765880
ecd:NonPeoNeoMember
peak:ChangeInFairValueAsOfVestingDateOfStockAwardsGrantedInPriorFiscalYearsForWhichApplicableVestingConditionsWereSatisfiedDuringFiscalYearMember
2023-01-01
2023-12-31
0000765880
ecd:NonPeoNeoMember
peak:ChangeInFairValueAsOfVestingDateOfStockAwardsGrantedInPriorFiscalYearsForWhichApplicableVestingConditionsWereSatisfiedDuringFiscalYearMember
2022-01-01
2022-12-31
0000765880
ecd:NonPeoNeoMember
peak:ChangeInFairValueAsOfVestingDateOfStockAwardsGrantedInPriorFiscalYearsForWhichApplicableVestingConditionsWereSatisfiedDuringFiscalYearMember
2021-01-01
2021-12-31
0000765880
ecd:NonPeoNeoMember
peak:ChangeInFairValueAsOfVestingDateOfStockAwardsGrantedInPriorFiscalYearsForWhichApplicableVestingConditionsWereSatisfiedDuringFiscalYearMember
2020-01-01
2020-12-31
0000765880
ecd:NonPeoNeoMember
peak:FairValueAsOfPriorFiscalYearEndOfStockAwardsGrantedInPriorFiscalYearsThatFailedToMeetApplicableVestingConditionsDuringFiscalYearMember
2023-01-01
2023-12-31
0000765880
ecd:NonPeoNeoMember
peak:FairValueAsOfPriorFiscalYearEndOfStockAwardsGrantedInPriorFiscalYearsThatFailedToMeetApplicableVestingConditionsDuringFiscalYearMember
2022-01-01
2022-12-31
0000765880
ecd:NonPeoNeoMember
peak:FairValueAsOfPriorFiscalYearEndOfStockAwardsGrantedInPriorFiscalYearsThatFailedToMeetApplicableVestingConditionsDuringFiscalYearMember
2021-01-01
2021-12-31
0000765880
ecd:NonPeoNeoMember
peak:FairValueAsOfPriorFiscalYearEndOfStockAwardsGrantedInPriorFiscalYearsThatFailedToMeetApplicableVestingConditionsDuringFiscalYearMember
2020-01-01
2020-12-31
0000765880
ecd:NonPeoNeoMember
peak:DividendsPaidOnOutstandingAndUnvestedStockAwardsMember
2023-01-01
2023-12-31
0000765880
ecd:NonPeoNeoMember
peak:DividendsPaidOnOutstandingAndUnvestedStockAwardsMember
2022-01-01
2022-12-31
0000765880
ecd:NonPeoNeoMember
peak:DividendsPaidOnOutstandingAndUnvestedStockAwardsMember
2021-01-01
2021-12-31
0000765880
ecd:NonPeoNeoMember
peak:DividendsPaidOnOutstandingAndUnvestedStockAwardsMember
2020-01-01
2020-12-31
0000765880
1
2023-01-01
2023-12-31
0000765880
2
2023-01-01
2023-12-31
0000765880
3
2023-01-01
2023-12-31
iso4217:USD
xbrli:shares
iso4217:USD
xbrli:shares
xbrli:pure
UNITED STATES
SECURITIES AND EXCHANGE COMMISSION
Washington, DC 20549
SCHEDULE 14A
PROXY STATEMENT PURSUANT TO SECTION 14(a)
OF THE SECURITIES EXCHANGE ACT OF 1934
(Amendment No. )
 |
Filed by the Registrant |
 |
Filed by a Party other than the Registrant |
| Check the appropriate box: |
|
Preliminary Proxy Statement |
|
Confidential, for Use of the Commission Only (as permitted by Rule 14A-6(E)(2)) |
|
Definitive Proxy Statement |
|
Definitive Additional Materials |
|
Soliciting Material under §240.14a-12 |
HEALTHPEAK PROPERTIES, INC.

(Name of Registrant as Specified in Its Charter)
(Name of Person(s) Filing Proxy Statement, if
other than the Registrant)
| Payment of Filing Fee (Check all boxes that apply): |
|
No fee required. |
|
Fee paid previously with preliminary materials. |
|
Fee computed on table in exhibit required by Item 25(b) per Exchange Act Rules 14a-6(i)(1) and 0-11. |


Our Strategy
We seek to maximize risk-adjusted returns
for our stockholders through growth in earnings and dividends from investments in high-quality real estate that is essential for
healthcare discovery and delivery. The cornerstones of our strategy are to:
| |
|
|
|
|
|
|
|
|
| Own and develop high-quality, irreplaceable healthcare real estate in
markets where we have scale and expertise, creating a competitive advantage. |
|
Grow our Lab and Outpatient Medical businesses through accretive acquisitions
and developments sourced through extensive relationships. |
|
Be a good partner to biopharma and health system tenants. We pride ourselves on having a stellar
reputation in the industry as a partner of choice that will lead to proprietary opportunities. |
|
Maintain a low cost of capital and a strong balance sheet with BBB+/ Baa1
investment grade credit ratings, which will provide financial strength through industry and economic cycles. |
|
Lead with a people-first culture that attracts, develops and retains top-tier talent.
We believe that diversity and inclusion are critical to a positive work environment that provides equal and fair treatment
to all individuals on the basis of merit. |
| |
|
|
| |
What’s new in this proxy statement
• Transformative business
combination with Physicians Realty Trust
• New independent
Board Chair appointed in 2023 and Board refreshment in 2023 and 2024
• Expanded description of governance practices
• Preview of 10-year
sustainability strategic roadmap |
|
| |
|
|
Our Transformed Company
Healthpeak Properties, Inc. (NYSE: DOC), an S&P 500 company,
invests in real estate serving healthcare delivery and discovery in the United States. We are headquartered in Denver, Colorado,
with additional corporate offices in California, Tennessee, Wisconsin and Massachusetts and property management offices in several
locations throughout the United States. On March 1, 2024, we closed a strategic merger with Physicians Realty Trust in an all-stock
transaction that leverages the power of complementary platforms, increased scale and deep relationships to create value for both
stockholders and tenants.
| |
|
|
|
|
700+
Properties(1)
|
|
7.0%
Annualized
Dividend Yield(3)
|
|
38 Years
as a Public Company
|
IRREPLACEABLE PORTFOLIO(1)
$21 Billion in Total Assets(2)
50+ Million
Sq. Ft. Outpatient Medical
and Lab (in the aggregate)
7,097 Continuing Care Retirement
Community (CCRC) Units
|
|
INVESTMENT GRADE
S&P: BBB+ (Stable)
Moody’s: Baa1 (Stable)
|
|
ESTABLISHED
NYSE-Listed
Member of S&P 500
|
| (1) |
As of March 1, 2024. |
| (2) |
Based on Healthpeak’s total assets plus Physicians Realty Trust’s total assets, in each case as of December 31, 2023. |
| (3) |
Based on Healthpeak’s common stock price of $17.10 as of the close of trading on March 1, 2024, and most recent
quarterly cash dividend of $0.30 per share. Future dividends are at the discretion of Healthpeak’s Board of Directors. |
Business Segments
Outpatient Medical
Outpatient services and healthcare provider visits are
performed efficiently and conveniently
|
|
Lab
New and innovative drugs, therapeutics and medical devices
are developed in our lab properties
|
|
CCRC
Offers seniors an active lifestyle, peace of mind, security
and a continuum of care in a unique campus setting
|
 |
|
 |
|
 |
HEALTHONE SKY RIDGE MEDICAL CENTER
DENVER, CO
|
|
THE COVE AT OYSTER POINT
SOUTH SAN FRANCISCO, CA
|
|
FREEDOM POINTE AT THE VILLAGES
THE VILLAGES, FL
|
2023 Business Highlights (Legacy Healthpeak)
| $1.78 |
|
5.2x |
|
$750M |
| Diluted FFO as Adjusted per common share for the year ended December 31, 2023(1) |
|
Net Debt to Adjusted EBITDAre for the quarter ended December 31, 2023(1) |
|
Long-Term Senior Unsecured Bonds Issued, at a Blended Yield of 5.36% |
| |
|
|
|
|
| 5.5% |
|
4.8% |
|
5.1M |
| Full-Year 2023 Diluted AFFO per Common Share Growth(2) |
|
Full-Year 2023 Same-Store Portfolio Cash (Adjusted) Net Operating Income Growth(2) |
|
Square Feet of Lease Executions(3) |
| (1) |
Diluted Funds from Operations (“FFO”) as Adjusted per common share and Net Debt to Adjusted Earnings Before Interest, Taxes, Depreciation and Amortization for real estate (“Adjusted EBITDAre”) are financial measures that
are not prepared in accordance with generally accepted accounting principles (“GAAP,” and such measures, “non-GAAP”
measures). Adjusted EBITDAre is calculated based on fourth quarter annualized performance and Net Debt as of December 31,
2023. For the definitions and reconciliations to the most directly comparable GAAP measures, see Appendix A. |
| (2) |
Same-Store Portfolio Cash (Adjusted) Net Operating Income and Diluted Adjusted Funds from Operations
(“AFFO”) per common share are non-GAAP financial measures. For the definitions and reconciliations to the most directly
comparable GAAP measures, see Appendix A. |
| (3) |
Represents the total combined Outpatient Medical and Lab lease executions for the year ended
December 31, 2023. |
Table of Contents
Go Green!
To go paperless and receive electronic versions of the
proxy statement and our annual report, please scan the code below and follow the instructions.
|
 |
Notice of Annual Meeting
of Stockholders
Annual Meeting Proposals
| PROPOSALS |
|
|
|
|
| |
|
|
|
| 01 |
|
Election of Eleven Directors |
|

FOR
See pages 12–25
|
| |
|
|
|
|
| 02
|
|
Approval, on an Advisory Basis, of 2023 Executive Compensation |
|
FOR
See pages 41–72
|
| |
|
|
|
|
| 03
|
|
Ratification of Appointment of Independent Registered Public
Accounting Firm for 2024 |
|
FOR
See pages 76–78
|
| |
|
|
|
|
Other business will be transacted as may properly come before
the 2024 annual meeting of stockholders (the “Annual Meeting”).
Proxy Voting
Please submit your proxy or voting instructions as soon as possible
to instruct how your shares are to be voted at the Annual Meeting, even if you plan to attend the meeting. If you later vote at
the Annual Meeting, your previously submitted proxy or voting instructions will not be used.
By Order of the Board of Directors,
Carol B. Samaan
Vice President, Associate General Counsel
and Corporate Secretary
Denver, Colorado
March 13, 2024
| |
Logistics |
|
| |
 |
|
DATE AND TIME
Thursday, April 25, 2024
8:00 a.m. Central Time
|
|
| |
|
|
|
|
| |
 |
|
RECORD DATE
Tuesday, March 5, 2024
|
|
| |
|
|
|
|
| |
 |
|
PLACE
Hilton Franklin Cool Springs
601 Corporate Centre Drive
Franklin, TN 37067
|
|
| |
|
|
|
|
| |
 |
|
PROXY MATERIALS
These proxy materials were first
made available to stockholders on
or about March 13, 2024
|
|
| |
|
|
|
|
| |
|
|
|
|
| |
How to Vote |
|
| |
STOCKHOLDERS OF RECORD |
|
| |
 |
|
BY INTERNET
www.proxyvote.com
|
|
| |
|
|
|
|
| |
 |
|
BY TELEPHONE
800–690–6903
|
|
| |
|
|
|
|
| |
 |
|
BY MAIL
Complete your proxy card and cast your vote by pre-paid
post
|
|
| |
|
|
|
|
| |
BENEFICIAL OWNERS
If you own shares of our common stock registered in the name of a broker, bank or other nominee, please follow the instructions they provide on how to vote your shares.
|
|
|
Important Notice Regarding Internet Availability
of Proxy Materials
This proxy statement and our Annual Report
on Form 10-K for the fiscal year ended December 31, 2023 (“Annual Report”) are available on the Internet at www.proxyvote.com,
which you can access by using the control number provided on your proxy card, voting instruction form or Notice of Internet Availability
of Proxy Materials. The materials are also available in the Investor Relations section of our website at ir.healthpeak.com. References
to websites in this proxy statement are provided for convenience only. Our website is for informational purposes only and the contents
of our website or information connected thereto are not a part of this proxy statement and are not deemed incorporated by reference
into this proxy statement or any other public filing made with the U.S. Securities and Exchange Commission.
|

Letter from Our
Board of Directors
Dear Stockholders,
On your behalf, we are committed to governing Healthpeak in a prudent
and transparent manner and to delivering long-term value for you. We proactively oversee Healthpeak’s business strategy, corporate
governance, executive compensation, corporate responsibility initiatives and risk management, among other things, and we are pleased to
share with you the results of our efforts over the past year.
Most notably, we recently completed our transformative business combination
with Physicians Realty Trust and added five new directors to our Board. We are pleased to welcome John T. Thomas, who will serve as our
Vice Chair, as well as Pamela J. Kessler, Ava E. Lias-Booker, Governor Tommy G. Thompson and Richard A. Weiss to our Board.
We also bid a fond farewell to Christine N. Garvey and David B. Henry, who will retire at this year’s Annual Meeting pursuant to
our director term limit policy. We thank them for their years of dedicated leadership and service.
Merger with Physicians Realty Trust
The all-stock business combination with Physicians Realty Trust created a
combined company with total assets of approximately $21 billion. The combined company is expected to be the leading real estate platform
dedicated to healthcare discovery and delivery, showcasing a portfolio of over 50 million square feet, including 40 million square feet
of outpatient medical properties concentrated in high-growth markets such as Dallas, Houston, Nashville, Phoenix and Denver. The combined
company will benefit from extensive relationships with the nation’s leading health systems.
Commitment to Risk Management and Oversight
The Board is committed to robust risk oversight of the business, among other
things. In 2023, the Board conducted its annual enterprise risk management assessment to identify and prioritize risks throughout the
organization. As part of that review, we engaged a third-party expert to review specific cybersecurity risks throughout our portfolio and
identify and implement proactive mitigation measures.
Corporate Responsibility
We undertake environmental, social and governance (“ESG”) initiatives
that seek to increase long-term stakeholder value and underscore our commitment to corporate responsibility. In 2023, we conducted a comprehensive
review of our sustainability strategy and developed a 10-year strategic roadmap, focusing on our decarbonization pathway and corporate-
and asset-level initiatives that we believe will yield a return on investment, optimize building performance, reduce operating costs,
generate cost savings and promote energy efficiency. We also published our 12th annual ESG Report, which was prepared in accordance
with leading reporting frameworks, including the Task Force on Climate-Related Financial Disclosures, Sustainability Accounting Standards
Board, Global Reporting Initiative and United Nations Sustainable Development Goals. Throughout 2023, we received numerous awards for
our sustainability efforts, including being named by Newsweek to America’s Most Responsible Companies list for the fifth
consecutive year and the Global Real Estate Sustainability Benchmark (GRESB) Green Star Rating for the 12th consecutive year.

|
We focused on human capital management, with a particular emphasis on employee
well-being and diversity and inclusion. We also continued our long-standing commitment to partnering with and supporting charitable
organizations.
As a leader among REITs in corporate governance matters, we prioritized transparent
disclosure and robust governance practices. In 2023, our disclosure practices were recognized by IR Magazine with the Corporate
Governance Award for Best Proxy Statement by a mid-cap company.
Central to our executive compensation philosophy is the concept of paying
for performance. We place a significant portion of executive compensation “at risk” in the form of performance-based
annual cash bonuses and long-term equity awards to help promote the execution of our business strategy in a manner that creates long-term
stockholder value, encourages prudent risk management and enhances retention of our talented executive team.
Looking Ahead
We continue to concentrate our operating and investment strategies where
we have a competitive advantage, which we believe is key to generating sustainable stockholder value. We are excited about Healthpeak’s
market position and believe we are well positioned for long-term growth.
Thank you for your continued support.
Sincerely,
The Board of Directors |
|
 |
|
 |
|
 |
|
| |
Scott M. Brinker
President and Chief Executive Officer, Director |
|
Katherine M. Sandstrom
Independent Chair of the Board |
|
John T. Thomas
Vice Chair of the Board |
|
| |
 |
|
 |
|
 |
|
| |
Brian G. Cartwright
Independent Director |
|
James B. Connor
Independent Director |
|
Christine N. Garvey
Independent Director |
|
| |
 |
|
 |
|
 |
|
| |
R. Kent Griffin, Jr.
Independent Director |
|
David B. Henry
Independent Director |
|
Pamela J. Kessler
Independent Director |
|
| |
 |
|
 |
|
 |
|
| |
Sara G. Lewis
Independent Director |
|
Ava E. Lias-Booker
Independent Director |
|
Governor Tommy G. Thompson
Independent Director |
|
| |
 |
|
|
|
|
|
| |
Richard A. Weiss
Independent Director
|
|
|
|
|
|

Proxy Summary
| |
|
|
|
|
|
PROPOSALS
01 |
|
|
|
|
|
| |
Election of Eleven Directors
Our Board recommends a vote FOR
each of the eleven director nominees
•
Our Board believes
that the eleven director nominees have the qualifications to provide effective leadership, oversight and guidance.
•
All of our
director nominees, other than Mr. Brinker, our President and CEO, and Mr. Thomas, our Vice Chair of the Board and former President
and CEO of Physicians Realty Trust, are independent.
•
All of our
director nominees are highly successful professionals with relevant skills and experience. |
|

FOR
See
pages 12–25
for more
information |
|
| 02 |
|
Approval, on an Advisory Basis, of 2023 Executive Compensation
Our Board recommends a vote FOR
approval, on an advisory basis, of our 2023 executive compensation
•
2023 executive
compensation reflects independent oversight by the Compensation and Human Capital Committee (the “Compensation Committee”)
with advice from independent consultants.
•
Our executive
compensation program aligns with our corporate strategy and helps drive long-term value for stockholders.
•
Pay-for-performance
alignment is reflected in our short-term incentive plan (“STIP”) results, which paid out above the target level as a
result of achieving certain 2023 financial and ESG performance goals, as well as strong individual performance. Our performance-based
long-term incentive plan (“LTIP”) awards paid out below the target level based on total stockholder return (“TSR”)
performance for 2021–2023 relative to defined peers. |
|
FOR
See
pages 41–72
for more
information |
|

| |
|
Our Board of Directors solicits your proxy for the Annual Meeting. This summary provides an overview of information contained in this proxy statement and does not contain all of the information that you should consider before voting. We encourage you to review the entire proxy statement before casting your vote. |
| |
|
|
|
|
|
| |
|
|
PROPOSALS
03 |
|
Ratification of Appointment of Independent Registered Public
Accounting Firm for 2024
Our Board recommends a vote FOR ratification
of the appointment of Deloitte & Touche LLP (“Deloitte”) as our independent registered public accounting firm for
2024
•
Deloitte’s institutional
knowledge of our business and control framework enables effective and efficient audits.
•
The Audit Committee has
considered the independence, performance and qualifications of Deloitte in connection with this proposal and has determined that the retention
of Deloitte continues to be in the best interests of Healthpeak and its stockholders. |
|
FOR
See
pages 76–78
for more
information |
|
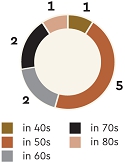
Our Director Nominees
Our Board has a breadth of experience and reflects a diversity of perspectives
and backgrounds. We believe the range of skills and tenures of our director nominees creates a balance between institutional knowledge
and new viewpoints.
| |
|
|
|
|
|
| GENDER DIVERSITY |
RACIAL DIVERSITY |
|
|
AGE |
TENURE |
 |
 |
|
|
 |
 |
| We do not currently have any directors who self-identify as LGBTQ+. |
|
| |
|
|
|
| For an overview of all our directors’ core skills and experience, see the skills matrix on page 13. |
| DIRECTOR NOMINEES |
AGE |
DIRECTOR
SINCE |
GENDER |
RACE
/
ETHINICITY |
 |
 |
 |
 |
 |
Scott M. Brinker
President and Chief Executive Officer,
Healthpeak Properties, Inc. |
47 |
2022 |
Male |
White |
|
|
|
|
 |
Katherine M. Sandstrom INDEPENDENT
Chair of the Board,
Healthpeak Properties, Inc.;
Former Senior Managing Director, Heitman LLC |
55 |
2018 |
Female |
White |
|
|
 |
|
 |
John T. Thomas
Former President and Chief Executive Officer,
Physicians Realty Trust |
57 |
2024 |
Male |
White |
|
|
|
|
 |
Brian G. Cartwright INDEPENDENT
Former General Counsel,
Securities and Exchange Commission |
76 |
2013 |
Male |
White |
 |
 |
|
|
 |
James B. Connor INDEPENDENT
Former Chairman and CEO,
Duke Realty Corporation |
65 |
2023 |
Male |
White |
|
|
|
|
 |
R. Kent Griffin, Jr. INDEPENDENT
Managing Director, PHICAS Investors;
Former President,
BioMed Realty Trust, Inc. |
54 |
2018 |
Male |
White |
|
|
|
|
 |
Pamela J. Kessler INDEPENDENT
Co-President, Chief Financial Officer and
Corporate Secretary, LTC Properties, Inc. |
58 |
2024 |
Female |
White |
* |
|
|
|
 |
Sara G. Lewis INDEPENDENT
Founder and CEO,
Lewis Corporate Advisors, LLC |
56 |
2019 |
Female |
White |
|
 |
|
|
 |
Ava E. Lias Booker INDEPENDENT
Partner, McGuireWoods LLP
|
63 |
2024 |
Female |
African
American
or Black |
|
|
* |
|
 |
Governor Tommy G. Thompson INDEPENDENT
Former U.S. Secretary of
Health and Human Services |
82 |
2024 |
Male |
White |
|
|
|
* |
 |
Richard A. Weiss INDEPENDENT
Former Partner,
Foley & Lardner LLP |
77 |
2024 |
Male |
White |
|
|
|
* |
| |
|
|
|
|
|
Chair Member |
| * |
Following the Annual Meeting and subject to their election by stockholders, Ms. Kessler will serve on the
Audit Committee, Ms. Lias-Booker will serve on the Governance Committee, and Governor Thompson and Mr. Weiss will serve on the Investment
and Finance Committee, with Governor Thompson serving as Chair of that committee. |
Compensation Highlights
2023 Executive Compensation Program
We have an established executive compensation program that we believe is
competitive and that has been developed in response to feedback from our stockholders through ongoing investor outreach and in alignment
with best practices. In 2023, we compensated our named executive officers (“NEOs”) using the following three elements of pay:
| |
ELEMENT |
|
FORM |
|
2023 METRICS AND WEIGHTING |
| 01 |
Base Salary |
|
Fixed Cash |
|
Base level of competitive cash to attract and retain executive talent |
| 02 |
Annual
Incentive
Award
(STIP) |
|
Performance-
Based Cash |
|
55% |
|
Pre-established objective financial performance metrics to align compensation
with strategic goals
•
35% – Normalized FFO per share
•
20% – Net Debt to Adjusted EBITDAre |
| |
|
|
|
|
15% |
|
ESG performance metrics to align compensation with corporate responsibility strategy |
| |
|
|
|
|
30% |
|
Individual performance to reward individual initiative and achievement |
| 03 |
Long-Term
Incentive
Award
(LTIP) |
|
Performance-
Based
Awards |
|
60% |
|
3-year cliff vesting based on TSR performance relative to the following indices,
subject to a 1-year post-vesting holding period (other than the settlement of shares in connection with applicable tax withholding):
•
Selected healthcare REIT peers
(24% of overall award)
•
MSCI US REIT Index (18% of overall
award)
•
FTSE Nareit Equity Office Index
(18% of overall award) |
| |
|
|
Time-Based Awards |
|
40% |
|
3-year annual vesting, subject to a pre-established Normalized FFO per share performance hurdle and 1-year post-vesting holding period (other than the settlement of shares in connection with applicable tax withholding) |
Corporate Responsibility Highlights
We believe that ESG initiatives serve a vital part of value creation and
corporate responsibility. For additional information, please read our annual ESG Report or visit our website at healthpeak.com/esg.
We strive to advance our building performance, efficiency, resilience and
sustainability by identifying projects that minimize environmental impacts, deliver an acceptable return on investment and reduce operating
costs. In 2023, we published our 12th annual ESG Report, aligned with the Task Force on Climate-Based Financial Disclosures
(“TCFD”), Sustainability Accounting Standards Board (“SASB”), Global Reporting Initiatives and United Nations
Sustainable Development Goals reporting frameworks. In 2023, we reported on the progress of our long-term environmental goals for greenhouse
gas emissions (“GHG”), energy, water, waste and recycling with respect to properties in our operational boundary (Scopes 1 &
2). The recognitions reflected below include those for legacy Healthpeak and Physicians Realty Trust.
 |
|
|
|
|
| |
|
Recognitions
GRESB Green Star Rating (2011–2023)
CDP Leadership Band (2012–2023)
DJSI N. America Index Constituent (2012–2023)
and World Index (4 times)
S&P Global Sustainability Yearbook (2016–2023)
Green Lease Leader – Platinum
Nareit Leader in the Light – 10-Time
Award Recipient
FTSE4Good Index Series (2012–2023) |
|
| |
|
|
|
|
| GOALS |
|
GHG EMISSIONS REDUCTION
(SCIENCE-BASED TARGETS)
(BY 2033)(1)
|
|
ENERGY
SAVINGS
(BY 2030)(2)
|
|
WATER
SAVINGS
(BY 2030)(2)
|
|
WASTE
(LANDFILL)
DIVERSION
(BY 2030)(2)
|
|
RECYCLING
INCREASE
(BY 2030)(2)
|
| |
|
37.5% Scopes 1 & 2 |
|
15% |
|
10% |
|
10% |
|
10% |
| PROGRESS(3) |
|

16.1% achieved
Year 4 of 15 |
|

2.7% achieved
Year 2 of 10 |
|

3.1% achieved
Year 2 of 10 |
|

—
Year 2 of 10 |
|

4.2% achieved
Year 2 of 10 |
| (1) |
Relative to 2018 baseline. Validated by the Science-Based Targets initiative. |
| (2) |
Relative to 2021 baseline. |
| (3) |
As reported in 2023 for performance for the year ended December 31, 2022, compared using a cumulative “like-for-like”
methodology. Under our “like-for-like” methodology, direct and indirect GHG emissions and energy, water and waste metrics
are compared on a year-over-year basis (using Scope 1 and Scope 2 GHG emissions) for the properties that we have owned for two full
consecutive calendar years, excluding non-stabilized developments and redevelopments. |
| |
|
|
|
|
|
|
| |
LEED Certifications(1) |
|
|
|
ENERGY
STAR® |
|
| |
LEED Certified Space |
|
|
|
 |
|
|
|
|
|
|
| |
6.5
Million Sq. Ft.
|
|
|
|
|
|
 |
2023 Partner of the Year |
|
| |
(1) Cumulative
for the combined company as of March 1, 2024. LEED®—an acronym for Leadership in Energy and Environmental
Design™—and its related logo are trademarks owned by the U.S. Green Building Council® and are used
with permission. Learn more at www.usgbc.org/LEED. |
|
|
|
We were named an ENERGY STAR Partner of the Year for the third time in 2023. This honor recognizes our leading energy management practices and commitment to advancing energy efficiency across our portfolio. |
|
| |
|
|
|
|
|
|
 |
GENDER DIVERSITY
56%
Female Workforce(1) |
|
 |
RACIAL/ETHNIC DIVERSITY
31%
Racially/Ethnically
Diverse Workforce(1) |
|
Recognitions
•
Bloomberg Gender-Equality Index Constituent (2019-2022)
•
Great Place to Work
Certified (2020-2023)
•
Orange County
Business Journal Best Places to Work (2020, 2022 & 2023)
•
The Tennessean
Top Workplace (2022 & 2023)
•
Fortune
Best Places to Work in Real Estate (2022 & 2023)
•
Modern Healthcare
Best Places to Work (3 Times) |
| |
|
|
|
|
|
 |
COMMUNITY
ENGAGEMENT
Legacy Healthpeak and Physicians Realty Trust partnered with over 125 community or charitable organizations
(in the aggregate) in 2023 |
|
 |
TRAINING AND DEVELOPMENT
Legacy Healthpeak completed company-wide belonging and inclusion training in 2023 with
100% participation |
|
| |
(1) As of March 8, 2024. |
|
|
|
|
|
| |
|
|
| |
Diversity and Inclusion
We believe we are a stronger organization when our workforce represents a
diversity of ideas and experiences. We value and embrace diversity in our employee recruiting, hiring and development practices, including
augmenting recruiting practices to hire more diverse talent; conducting company-wide inclusion and belonging training for all employees;
and sponsoring programs that support the education and recruitment of underrepresented groups, including through executive speaking engagements
at universities, mentorship and financial contributions.
To view our most recently filed EEO-1 Report, visit healthpeak.com/esg/social. |
|
| |
|
|
| |
|
|
|
|
|

All director nominees,
other than Messrs. Brinker and Thomas, are independent
Independent female Board
Chair
Average director nominee
tenure of 3 years
Annual director elections
with majority voting standard
Annual Board and committee
self-evaluations
Board diversity, including
four female director nominees and one racially diverse director nominee
Board oversight of corporate
culture, human capital management, corporate responsibility, cybersecurity and enterprise risk management |
|
Codes of Conduct for directors,
employees and vendors
Award-winning ESG reporting
practices and robust and transparent disclosures
Anti-hedging, anti-pledging
and clawback policies
Robust executive officer
and director stock ownership requirements
Director term limit policy
to support orderly Board refreshment
Policy on director time
commitments and overboarding aligned with key stakeholder policies and best practices
Stockholder proxy access
rights reflecting market standard terms |
|
Recognitions
•
Governance Intelligence
and IR Magazine – Winner of Best Proxy Statement (Mid-Cap) (2023)
•
Newsweek America’s
Most Responsible Companies List (2019–2023)
•
ISS Governance QualityScore –
Top Decile
•
ISS ESG Corporate Rating – Prime
•
MSCI Rating – AA- |

PROPOSAL 01
Election of Directors
 |
FOR |
Our Board recommends a vote FOR each
of the eleven director nominees |
Based on the recommendations of the Nominating and Corporate Governance Committee
(the “Governance Committee”), our Board has nominated eleven director nominees for election at the Annual Meeting to serve
until the 2025 annual meeting of stockholders and until their respective successors are elected and qualified or until their earlier death,
resignation or removal. All of the nominees are current directors of the Company who were previously elected to the Board by our stockholders,
other than Messrs. Thomas and Weiss, Governor Thompson and Mses. Kessler and Lias-Booker, who were appointed to our Board following the
business combination with Physicians Realty Trust on March 1, 2024. Our remaining two current directors, Ms. Garvey and Mr. Henry, will
retire at this year’s Annual Meeting pursuant to our director term limit policy and are not standing for election at the Annual
Meeting. Each director nominee has agreed to be named in this proxy statement and to serve, if elected.
We have no reason to believe that any of our nominees will be unable or unwilling
to serve if elected. However, if any nominee is unable or unwilling for good cause to serve, the proxy holders may vote their shares for
a substitute nominee or for the balance of our Board, leaving a vacancy, unless our Board chooses to reduce the number of directors serving
on our Board.
Voting Standard
MAJORITY VOTING AND DIRECTOR RESIGNATION POLICY
Consistent with corporate governance best practices, our majority voting
standard for director elections requires that a director nominee in an uncontested election receive a majority of the votes cast with
respect to his or her election at the Annual Meeting (that is, the number of votes cast FOR the nominee must exceed the number of votes
cast AGAINST the nominee) to be elected to our Board. Our Board believes that the majority vote standard in uncontested elections strengthens
the director nomination process and enhances director accountability.
We also have a director resignation policy in our Bylaws, which requires
any nominee who fails to receive a majority of votes cast in an uncontested election to promptly submit his or her resignation from the
Board. The Governance Committee would then consider the resignation and make a recommendation to our Board on whether to accept it or
whether other action should be taken. Our Board would then act on the resignation, taking into account the Committee’s recommendation,
and would publicly disclose its decision, along with the rationale for such decision, within 90 days of certification of the election
results. We believe this process provides critical accountability to stockholders.
Director Qualifications, Skills and Experience
Our Governance Committee has determined that each of our director nominees
possesses the qualifications, skills and experience to effectively oversee the Company’s long-term business strategy. The matrix
below indicates the director nominees who possess each qualification, skill or experience.
Core Competencies
Our Board believes that all directors should possess certain core qualities
that ensure their fitness to lead the Company. We believe that each of our directors possesses the following core attributes:
| Strategic Oversight experience is essential
to guiding our long-term business strategy. |
|
Governance supports our goals of strong
Board and management accountability and alignment with stockholders’ interests. |
|
Leadership experience is important for
driving positive change and developing leadership qualities in others. |
|
Integrity and Ethics are paramount for
ensuring the sound reputation and operation of the Company. |
Additional Qualifications
In addition to the core competencies noted above, our Board believes that
the Company will be best served by directors with a wide array of talents and perspectives to drive innovation, promote critical thinking
and enhance discussion. Each of the following additional qualifications meaningfully adds to our Board’s depth.
| |
 |
 |
 |
 |
 |
 |
 |
 |
 |
 |
 |
|
| Risk
Oversight/Management Experience is
critical to our Board’s role in overseeing the risks facing the Company. |
 |
|
|
|
|
|
|
|
|
|
|
 |
| Investment
Expertise is important in evaluating our
assets and portfolio as a whole. |
|
|
|
|
|
|
|
|
|
|
|
|
| Financial
Expertise and/or Literacy is valuable in understanding and
overseeing our financial reporting and internal controls. |
|
|
|
|
|
|
|
|
|
|
|
|
| Human
Capital Management Experience is valuable in helping us
attract, motivate and retain high-performing employees. |
|
|
|
|
|
|
|
|
|
|
|
|
| Public
Company Board Experience provides essential comparison points
for operations and governance. |
|
|
|
|
|
|
|
|
|
|
|
|
| Corporate
Responsibility Experience helps support
the Board’s oversight of the Company’s long-term climate, human capital and corporate governance strategy and
initiatives. |
|
|
|
|
|
|
|
|
|
|
|
|
| REIT/Real
Estate Experience is helpful for understanding the
Company’s strengths and challenges specific to the real estate investment trust and real estate industries. |
|
|
|
|
|
|
|
|
|
|
|
 |
| Legal/Government/Regulatory
Experience is relevant for ensuring
oversight of management’s compliance with SEC, New York Stock Exchange (“NYSE”) and other regulatory
requirements. |
|
|
|
|
|
|
|
|
|
|
|
|
| Healthcare
Industry Experience is important for
understanding the Company’s strengths and challenges specific to the healthcare industry. |
|
|
|
|
|
|
|
|
|
|
|
|
| Cybersecurity
Oversight Experience contributes to the Board’s
understanding and oversight of the Company’s cybersecurity and information technology risks. |
|
|
|
|
|
|
|
|
|
|
|
 |
| Public
Company Executive Experience supports our management team
through relevant advice and leadership. |
|
|
|
|
|
|
|
|
|
|
|
 |
Director Nominees
|

Scott M. Brinker
President and
Chief Executive Officer,
Director
Age: 47
DIRECTOR SINCE: 2022
COMMITTEES: NONE
OTHER
CURRENT PUBLIC COMPANY BOARDS:
• None |
|
PROFESSIONAL EXPERIENCE
• Healthpeak’s President, Chief Executive Officer and a member of the Board since October 2022, President and Chief Investment Officer
from January 2020 to October 2022, and Executive Vice President and Chief Investment Officer from March 2018 to December 2019.
• Executive
Vice President and Chief Investment Officer of Welltower Inc. (NYSE: WELL), from July 2014 to January 2017, and Executive Vice
President – Investments from February 2012 to July 2014.
|
| |
QUALIFICATIONS
Mr. Brinker brings to our Board extensive experience in the healthcare
REIT industry gained from his leadership roles at Healthpeak and another publicly traded REIT. His knowledge of the Company’s
operations and strategy as our President and Chief Executive Officer and former role as Chief Investment Officer, as well as his
extensive and diverse experience in investments, business development, underwriting, asset management, capital markets, investor
relations, corporate finance, and industry-wide relationships and perspective, all contribute to leading our Company and executing
our strategy. |
|
| |
• Risk
Oversight/Management
• Investment
Expertise
• Financial
Expertise and/or Literacy
• Human
Capital Management
|
• Public
Company Board Experience
• Corporate
Responsibility
• REIT/Real
Estate
• Legal/Government/Regulatory |
• Healthcare
Industry
• Cybersecurity
Oversight
• Public
Company Executive |
|
| |
|
|
|
|
|
| |
|
|
|
|
|
|

Katherine M. Sandstrom
Independent Chair of the Board
Age: 55
DIRECTOR SINCE: 2018
COMMITTEES:
GOVERNANCE
(CHAIR)
OTHER
CURRENT PUBLIC COMPANY BOARDS:
• Toll Brothers,
Inc.
(NYSE: TOL)
• EastGroup Properties, Inc. (NYSE: EGP)
• Urban Edge Properties (NYSE: UE) |
|
PROFESSIONAL EXPERIENCE
• Advisor
to Heitman LLC from July 2018 to March 2019.
• Senior Managing
Director and global head of Heitman LLC’s Public Real Estate Securities business from 2013 to 2018.
• Several
senior leadership positions at Heitman LLC across multiple facets of the institutional real estate investment industry.
• Member of
Global Management Committee, the Board of Managers and the Allocation Committee while at Heitman LLC.
• Certified
Public Accountant.
|
| |
QUALIFICATIONS
Ms. Sandstrom brings to our Board more than 20 years of real estate
finance and investment experience. She has extensive background overseeing buy-side investment teams for REIT securities, strategies
and assets. Ms. Sandstrom’s background as a senior executive at Heitman LLC, as well as her tenure as Vice Chair of our Board
from April 2022 until April 2023, are beneficial in her role as the Chair of our Board and Chair of the Governance Committee. |
|
| |
• Risk Oversight/Management
• Investment
Expertise
• Financial
Expertise and/or
Literacy
|
• Human
Capital Management
• Public
Company Board
|
• Corporate
Responsibility
• REIT/Real
Estate
|
|
| |
|
|
|
|
|
|

John T. Thomas
Vice Chair of the Board
Age: 57
DIRECTOR SINCE: 2024
COMMITTEES: NONE
OTHER
CURRENT PUBLIC COMPANY BOARDS:
• None |
|
PROFESSIONAL EXPERIENCE
• President,
Chief Executive Officer, and Trustee of Physicians Realty Trust (formerly NYSE: DOC), from 2013 until its merger with our Company
in 2024.
• Executive
Vice President – Medical Facilities of Welltower Inc. (NYSE: WELL, formerly Health Care REIT Inc.), from 2009 to 2012.
• President,
Chief Development Officer and Business Counsel of Cirrus Health, from 2005 to 2008.
•
Senior Vice President and General Counsel of Baylor Health Care System, from 2000 to 2005.
•
General Counsel and Secretary of the St. Louis division of the Sisters of Mercy Health System, from 1997 to 2000.
• Tax Attorney
at Sonnenschein, Nath & Rosenthal (now Dentons), from 1995 to 1997, where he was elected Partner in 1997; at Shook, Hardy &
Bacon from 1992 to 1995; and at Milbank, Tweed, Hadley & McCoy from 1990 to 1992.
• Member of
the Boards of Trustees of the Jacksonville State University Foundation and the Auburn University Real Estate Foundation.
• Former Director
at Education Realty Trust, Inc. (formerly NYSE: EDR). |
| |
QUALIFICATIONS
Mr. Thomas brings to our Board extensive background, skills and
experience in the healthcare real estate industry. As former President and Chief Executive Officer of Physicians Realty Trust and
a former executive at other companies in the healthcare and real estate industries, he is knowledgeable on various aspects of the outpatient
medical business and has considerable executive experience in the real estate industry. Mr. Thomas also has experience in legal
and government affairs and health care policy from his time as General Counsel of health systems, as co-founder and chairman of
a national coalition to reform medical malpractice laws through federal legislation, and testifying before Congressional committees. |
|
| |
• Risk
Oversight/Management
• Investment
Expertise
• Financial
Expertise and/or Literacy
• Human
Capital Management
|
• Public
Company Board
• Corporate
Responsibility
• REIT/Real Estate
• Legal/Government/Regulatory
|
• Healthcare Industry
• Cybersecurity Oversight
• Public Company Executive
|
|
| |
|
|
|
|
|
| |
|
|
|
|
|

Brian G. Cartwright
Independent Director
Age: 76
DIRECTOR SINCE: 2013
COMMITTEES:
COMPENSATION, GOVERNANCE
OTHER
CURRENT PUBLIC
COMPANY BOARDS:
• None |
|
PROFESSIONAL EXPERIENCE
• Senior Advisor
(inactive) at Patomak Global Partners, LLC, a regulatory consulting firm, since 2012.
• General
Counsel of the SEC from 2006 to 2009.
• Senior Advisor
at the law firm of Latham & Watkins LLP from 2009 to 2011. Partner, serving in various senior management positions, including
as a member of its Executive Committee, from 1988 to 2005.
• Law clerk
to Associate Justice Sandra Day O’Connor, United States Supreme Court from 1981 to 1982.
• Chair of
the Board of Trustees of the Pacific Legal Foundation, a nonprofit provider of legal services, since 2021, and in various capacities
as a member of the Board of Trustees, including as Vice Chair, since 2011.
• Former Director
at Investment Technology Group (formerly NYSE: ITG), from 2016 to 2019.
|
| |
QUALIFICATIONS
Mr. Cartwright brings to our Board unparalleled and distinguished
corporate governance, regulatory and legal experience, having previously served as general counsel of the SEC, which provides valuable
insight in his role as a member of the Governance Committee and Compensation Committee. His legal background and experience managing
a large professional services firm provides our Board with considerable expertise regarding comprehensive issues faced by public
companies. Additionally, Mr. Cartwright has extensive experience with accounting and auditing issues from his time with Latham
& Watkins LLP and at the SEC. |
|
| |
• Risk
Oversight/Management
• Investment
Expertise
• Financial
Expertise and/or Literacy
|
• Human
Capital Management
• Public
Company Board
• Corporate
Responsibility
|
• Legal/Government/Regulatory
• Healthcare
Industry
|
|
| |
|
|
|
|
|
| |
|
|
|
|
|

James B.
Connor
Independent Director
Age: 65
DIRECTOR SINCE: 2023
COMMITTEES: AUDIT, COMPENSATION
OTHER
CURRENT PUBLIC
COMPANY BOARDS:
• EPR Properties
(NYSE:
EPR)
• Prologis, Inc.
(NYSE: PLD)
|
|
PROFESSIONAL EXPERIENCE
• Chairman
and Chief Executive Officer of Duke Realty Corporation (formerly NYSE: DRE), a REIT, from April 2017 until the
company’s acquisition by Prologis, Inc. (NYSE: PLD) in October 2022. President and Chief Executive Officer from January
2016 to April 2017, Senior Executive Vice President and Chief Operating Officer from 2013 to 2015, Senior Regional Executive
Vice President from 2011 to 2013, Executive Vice President Midwest Region from 2003 to 2010, and Senior Vice President from
1998 to 2003.
• Various
executive and brokerage positions at Cushman & Wakefield from 1981 to 1998, most recently as Senior Managing Director for the
Midwest area.
• Former First
Vice Chair of the Executive Board of the National Association of Real Estate Investment Trusts (“Nareit”).
• Chair of
the Board of Trustees of Roosevelt University in Chicago.
|
| |
QUALIFICATIONS
Mr. Connor brings to our Board business administration, capital
markets, corporate development, corporate governance, human capital, investor relations, marketing, public company and sustainability
expertise gained from his leadership roles at another publicly traded REIT for more than 20 years, most recently as its chairman
of the board and chief executive officer, and more than 15 years of additional experience in commercial real estate. His extensive
background as a REIT chief executive provides valuable insight in his role as a member of the Audit Committee and Compensation
Committee. |
|
| |
• Risk
Oversight/Management
• Investment
Expertise
• Financial
Expertise and/or Literacy
|
• Human
Capital Management
• Public
Company Board
• Corporate
Responsibility
|
• REIT/Real Estate
• Cybersecurity
Oversight
• Public Company
Executive
|
|
| |
|
|
|
|
|
| |
|
|
|
|
|

R. Kent
Griffin, Jr.
Independent Director
Age: 54
DIRECTOR SINCE: 2018
COMMITTEES: AUDIT (CHAIR), INVESTMENT
OTHER
CURRENT PUBLIC COMPANY BOARDS:
• Cousins Properties Inc.
(NYSE: CUZ)
|
|
PROFESSIONAL EXPERIENCE
• Managing
Director of PHICAS Investors since June 2016.
• President
and Chief Operating Officer of BioMed Realty Trust, Inc. (formerly NYSE: BMR) from 2008 to 2015. Chief Financial Officer from 2006
to 2010.
• Senior Vice
President, investment banking division, Raymond James & Associates, Inc. from 2003 to 2006.
• Associate,
investment banking division, J.P. Morgan Securities, Inc. from 1998 to 2003.
• Auditor,
Arthur Andersen, LLP from 1992 to 1997.
• Member of
the Board of Advisors at Pilot Mountain Ventures.
• Former Chairman
and current member of the Board of Directors for Charleston Waterkeeper (nonprofit); Chairman of the Board of Directors for Coastal
Conservation League (nonprofit); and Member of Audit & Finance Committee for the Charleston County School District.
• Former Director
at Tier REIT, Inc. (NYSE: TIER), from 2017 to 2019.
|
| |
QUALIFICATIONS
Mr. Griffin brings to our Board extensive real estate and corporate
finance experience gained from his leadership roles, currently at PHICAS as a managing director and previously as the president,
chief operating officer and chief financial officer of BioMed Realty Trust, Inc. Mr. Griffin leverages his experience as an auditor
at a major public accounting firm in his role as Chair of the Audit Committee, as well as his investment banking and corporate
finance experience in his role as a member of the Investment Committee. |
|
| |
• Risk
Oversight/Management
• Investment
Expertise
• Financial
Expertise and/or Literacy
|
• Human
Capital Management
• Public
Company Board
• Corporate
Responsibility
• REIT/Real
Estate
|
• Legal/Government/Regulatory
• Healthcare
Industry
• Cybersecurity
Oversight
• Public Company
Executive
|
|
| |
|
|
|
|
|

Pamela J. Kessler
Independent Director
Age: 58
DIRECTOR SINCE: 2024
COMMITTEES: AUDIT
OTHER
CURRENT PUBLIC
COMPANY BOARDS:
• None
|
|
PROFESSIONAL EXPERIENCE
• Co-President
of LTC Properties, Inc. (NYSE: LTC), since May 2020, Chief Financial Officer and Corporate Secretary, since 2007, and a variety
of other senior positions from 2000 to 2007.
• Corporate
Controller of The Ezralow Company, from 1997 to 2000.
• Director
of Financial Reporting of Irvine Apartment Communities (formerly NYSE: IAC), from 1994 to 1997.
• Assistant
Controller of Inland Empire Division of KB Home, from 1992 to 1994.
• Senior
Accountant, Real Estate Group at Ernst & Young LLP, from 1989 to 1992.
• Former Trustee
at Physicians Realty Trust (formerly NYSE: DOC), from 2018 until its merger with our Company in 2024.
• Member of
the Board and the real estate committee of the Providence Cedars-Sinai Tarzana Foundation.
• Certified
Public Accountant (inactive).
|
| |
QUALIFICATIONS
Ms. Kessler brings to our Board extensive experience in the healthcare
real estate industry, including her experience in risk oversight, strategy and human capital management as an executive officer
of a publicly traded REIT, and her financial expertise as a public company chief financial officer. |
|
| |
• Risk
Oversight/Management
• Investment
Expertise
• Financial
Expertise and/or Literacy
|
• Human
Capital Management
• Public
Company Board
• Corporate
Responsibility
• REIT/Real
Estate
|
• Legal/Government/Regulatory
• Healthcare
Industry
• Cybersecurity
Oversight
• Public Company
Executive
|
|
| |
|
|
|
|
|
| |
|
|
|
|
|

Sara G. Lewis
Independent Director
Age: 56
DIRECTOR SINCE: 2019
COMMITTEES:
COMPENSATION
(CHAIR), GOVERNANCE
OTHER
CURRENT PUBLIC COMPANY BOARDS:
• Freeport-McMoRan, Inc.
(NYSE: FCX)
• Weyerhaeuser Company (NYSE: WY)
|
|
PROFESSIONAL EXPERIENCE
• Founder
and Chief Executive Officer of Lewis Corporate Advisors, LLC from 2009 to 2018.
• Executive
Vice President and Chief Financial Officer of Washington Real Estate Investment Trust (formerly NYSE: WRE) (now Elme Communities
(NYSE: ELME)) from 2002 to 2009, and Managing Director, Finance and Capital Markets from 2001 to 2002.
• Vice President,
Finance and Investor Relations of Corporate Office Properties Trust (NYSE: OFC) from 1999 to 2001.
• Board Leadership
Fellow of National Association of Corporate Directors since 2012; Directorship 100 recipient in 2017.
• Member of
the Board of Trustees of The Brookings Institution since 2016, as well as a member of the Executive Committee and Chair of the
Governance Studies Council, Vice Chair of the Audit Committee, and member of the Investment Committee and Budget & Finance
Committee.
• Member of
the Leadership Board and Corporate Governance Working Group of the U.S. Chamber of Commerce Center for Capital Markets Competitiveness
since 2015, as well as a member of the ESG Working Group.
• Delegate
for the Advisory Council for Risk Oversight for the National Association of Corporate Directors.
• Member of
the Audit Committee Council of the Center for Audit Quality.
• Former
Director at Sun Life Financial, Inc. (NYSE: SLF), from 2014 to 2021; PS Business Parks, Inc. (formerly NYSE: PSB) from 2010 to
2019; and previously served as a director on several other public company boards, including Adamas Pharmaceuticals, Inc. (formerly
Nasdaq: ADMS); Plum Creek Timber Company, Inc. (formerly NYSE: PCL); and CapitalSource, Inc. (formerly NYSE: CSE).
• Certified
Public Accountant and Chartered Financial Analyst.
|
| |
QUALIFICATIONS
Ms. Lewis brings to our Board extensive boardroom
experience and more than 30 years of corporate finance and capital markets experience. She has served on several public
company boards, including as Audit Committee chair, Compensation Committee chair, Governance Committee chair and presiding
director. Ms. Lewis has been part of the executive teams of several public real estate investment trusts, including as a
chief financial officer, which complement her role as Chair of the Compensation Committee and a member of the Governance
Committee. |
|
| |
• Risk
Oversight/Management
• Investment
Expertise
• Financial
Expertise and/or Literacy
• Human
Capital
Management
|
• Public
Company Board
• Corporate
Responsibility
• REIT/Real
Estate
• Legal/Government/Regulatory
|
• Healthcare
Industry
• Cybersecurity
Oversight
• Public Company
Executive
|
|
| |
|
|
|
|
|

Ava E. Lias-Booker
Independent Director
Age: 63
DIRECTOR SINCE: 2024
COMMITTEES: GOVERNANCE
OTHER
CURRENT PUBLIC
COMPANY BOARDS:
• None
|
|
PROFESSIONAL EXPERIENCE
• Partner at McGuireWoods LLP, since 2004, and served in a variety of leadership roles, including as chair of the firm’s Diversity and Inclusion Committee.
•
Partner at Saul Ewing LLP, from 2001 to 2004.
• Partner at Gordon, Feinblatt, Rothman, Hoffberger & Hollander LLP, from 1995 to 2001.
• Partner at Saul Ewing LLP (formerly Weinberg & Green LLC), from 1994 to 1995.
• Former Trustee at Physicians Realty Trust (formerly NYSE: DOC), from 2022 until its merger with our Company in
2024.
•
Member of the Board of Directors of the University of Maryland Saint Joseph's Medical Center; gubernatorial appointee to the
University of Maryland Medical System Board of Directors; and member of the Boards of Visitors of Duke University School of
Law (honorary) and the University of Maryland Francis King Carey School of Law (emeritus).
|
| |
QUALIFICATIONS
Ms. Lias-Booker brings to our Board
extensive experience in legal, governance and regulatory compliance matters, as well as leadership on diversity, inclusion and
human capital management issues. Her prior experience serving on the board of trustees of Physicians Realty Trust provided her
with expertise in risk oversight, investments, financial literacy and public company board matters. |
|
| |
• Risk
Oversight/Management
• Investment
Expertise
• Financial
Expertise and/or Literacy
|
• Human
Capital Management
• Public
Company Board
• Corporate
Responsibility
|
• Legal/Government/Regulatory
|
|
| |
|
|
|
|
|
| |
|
|
|
|
|

Governor Tommy G. Thompson
Independent Director
Age: 82
DIRECTOR SINCE: 2024
COMMITTEES: INVESTMENT
OTHER
CURRENT PUBLIC
COMPANY BOARDS:
• United Therapeutics Corporation
(Nasdaq: UTHR)
• TherapeuticsMD, Inc. (Nasdaq: TXMD)
|
|
PROFESSIONAL EXPERIENCE
• President
of the University of Wisconsin System, from 2020 to 2022.
• U.S. Secretary
of Health and Human Services, from 2001 to 2005.
• Governor
of State of Wisconsin, from 1987 to 2001.
• Senior Advisor
at Deloitte & Touche USA LLP, from 2005 to 2009.
• Partner
at Akin Gump Strauss Hauer & Feld LLP, from 2005 to 2012.
• President
of Logistics Health, Inc., from 2005 to 2011, and Chairman of the Board of Trustees from 2007 to 2011.
• Former Chairman
of the Board of Trustees at Physicians Realty Trust (formerly NYSE: DOC), from 2013 until its merger with our Company in 2024.
• Former Director
at Scilex Holding Company (Nasdaq: SCLX), from 2022 to 2023; Tyme Technologies, Inc. (formerly Nasdaq: TYME), from 2018 to 2020;
and previously served as a director on several other public company boards, including C.R. Bard, Inc. (formerly NYSE: BCR); Cytori
Therapeutics, Inc. (now Plus Therapeutics, Nasdaq: PSTV); Cancer Genetics, Inc. (now Vyant Bio, Inc., formerly Nasdaq: VYNT); Centene Corporation (NYSE: CNC); and CareView Communications, Inc.
|
| |
QUALIFICATIONS
Governor Thompson brings to our Board decades of experience and
leadership in government and the evolving healthcare industry, including unique experience with physicians, healthcare decision
makers and business executives regarding healthcare policy and improvements within the industry. His other service on public company
boards in the healthcare real estate and biopharma industries makes him uniquely situated to serve on our Board with our focus
on healthcare discovery and delivery, including the financial, investment and risk oversight issues specific to our industry and
sector. |
|
| |
• Risk
Oversight/Management
• Investment
Expertise
• Financial
Expertise and/or Literacy
|
• Human
Capital Management
• Public
Company Board
• Corporate
Responsibility
• REIT/Real Estate
|
• Legal/Government/Regulatory
• Healthcare
Industry
|
|
| |
|
|
|
|
|
| |
|
|
|
|
|

Richard A.
Weiss
Independent Director
Age: 77
DIRECTOR SINCE: 2024
COMMITTEES: INVESTMENT
OTHER
CURRENT PUBLIC COMPANY BOARDS:
• None
|
|
PROFESSIONAL EXPERIENCE
• Public finance
attorney at Foley & Lardner LLP, from 1971 to 2008, including as a Partner from 1978 to 2008 and as a member of the Management
Committee from 1999 to 2008.
• Former Trustee
at Physicians Realty Trust (NYSE: DOC), from 2013 until its merger with our Company in 2024.
• Member of
the Board of Directors and former chair of the Audit Committee of Ascendium Education Group.
• Former member
of the Boards of Directors of Advocate Aurora Health and predecessor companies, including terms as finance committee chair and
board chair of Aurora Health Care and Milwaukee Psychiatric Hospital; former member and Chair of the Board of Directors of Washington
Hospital Center in Washington, D.C.; former member of the executive committee of the Board of Directors of the Greater Washington
Board of Trade; and former member of the Board of Trustees of the Medical College of Wisconsin.
|
| |
QUALIFICATIONS
Mr. Weiss brings to our Board more than 50 years of healthcare industry,
legal and financial experience, as well as experience in legal and regulatory compliance matters. |
|
| |
• Risk
Oversight/Management
• Investment
Expertise
• Financial
Expertise and/or Literacy
|
• Human
Capital Management
• Public
Company Board
• Corporate
Responsibility
• REIT/Real
Estate
|
• Legal/Regulatory
• Healthcare
Industry
• Cybersecurity
Oversight
|
|
| |
|
|
|
|
|
Board Effectiveness and Strategic Evolution
| Our Board believes that improving its effectiveness is an ongoing process that requires thoughtful planning, evaluation, recruitment and orderly refreshment. This ongoing process is outlined below. |
01 |
02 |
03 |
04 |
Director
Selection |
Onboarding
and Education |
Board
Self-Evaluation |
Board Composition
and Refreshment |
Director Selection
Identifying and Evaluating Director Nominee Candidates
The Governance Committee considers a variety of factors when reviewing
potential nominees for our Board, including:
| • |
Personal and professional integrity, ethics and values; |
| • |
Experience in the REIT industry and other industries relevant to our operations, such as real
estate, healthcare, development, investments and corporate finance; |
| • |
Experience with relevant legal, regulatory and policy concerns; |
| • |
Experience as a board member of other public companies, as well as other leadership attributes; |
| • |
The ability and willingness to commit adequate time to our Board and its committees; |
| • |
Experience in corporate management and executive leadership, such as serving as an officer or
former officer of a publicly held company; |
| • |
Whether the individual’s skills and personality will complement and supplement those of
the other members (and potential members) of our Board and are likely to be conducive to building a Board that is effective,
collegial and responsive to the needs of the Company; |
| • |
Expertise in an area of Healthpeak’s operations, such as financing strategy, risk management
or human capital management; |
| • |
Practical and mature business judgment; |
| • |
Personal and professional time commitments and capacity, ability and willingness to govern; and |
| • |
Independence from management and lack of relationships with our other directors and employees. |
| |
|
| |
|
|
| |
DIVERSITY |
|
| |
The Governance Committee also considers diversity in gender,
race, age, ethnicity, national origin and professional and personal experience when reviewing potential director nominees,
and strives to create diversity in perspectives on our Board as a whole, when identifying and selecting nominees. On an annual
basis, as part of our Board’s self-evaluation, our Board assesses whether its diversity, which it views as a critical
component to its effectiveness, is appropriate. |
|
| |
|
|
The Governance Committee considers potential director nominees
recommended by various sources, including Board members, stockholders and senior management. The Committee will consider director
candidates properly recommended by stockholders in the same manner as recommendations received from other sources. For a description
of the process for stockholders to recommend or nominate directors, see “Other Matters—2025 Stockholder Proposals,
Director Nominations and Director Candidate Recommendations.”
If the Board, upon the recommendation of the Governance Committee,
determines it is appropriate to consider new director candidates to refresh the Board or fill any Board vacancies, the Chair of
the Governance Committee, or a member designated by the Chair, is responsible for overseeing the search and interview process.
The Committee will provide progress updates to our Board and will meet to consider and recommend final director candidates to the
entire Board. Our Board then determines, taking into account the recommendation of the Committee, which candidates to appoint to
our Board or nominate for election by our stockholders.
Director Candidate Search
Pursuant to our director term limit policy, Ms. Garvey and Mr.
Henry will retire from our Board at the 2024 Annual Meeting. In 2022, in anticipation of these retirements, the Governance Committee
engaged an independent director search firm to assist in identifying and evaluating potential director candidates, including establishing
director nominee criteria and evaluating the candidates’ credentials. As a result of this engagement, the Committee identified
Mr. Connor as a director candidate, and the Board appointed Mr. Connor in 2023. In addition, the Board determined to appoint five
directors from Physicians Realty Trust in connection with our business combination – Messrs. Thomas and Weiss, Governor Thompson
and Mses. Kessler and Lias-Booker. These five directors were selected based on their familiarity with Physicians Realty Trust and
experience in healthcare, real estate, investment, governance and risk management, among other attributes our Board determined
are important for the combined company.
Nominee Independence Considerations
Our Board has assessed whether the members of our Board are independent
according to NYSE listing standards. For a director to be considered independent under NYSE rules, our Board must affirmatively
determine that the director has no material relationship with us (either directly or as a partner, stockholder or officer of an
organization that has a relationship with us), with certain types of relationships automatically disqualifying the director as
independent. Our Board annually evaluates the independence of each non-employee director by considering any matters that could
affect the director’s ability to exercise independent judgment in carrying out his or her responsibilities. This evaluation
includes any transactions or relationships between the director, members of his or her family and organizations with which that
director or family members have an affiliation, on the one hand, and us, our subsidiaries and management, on the other hand.
Based upon its most recent review, our Board affirmatively determined
that each of Mses. Garvey, Kessler, Lewis, Lias-Booker and Sandstrom, Messrs. Cartwright, Connor, Griffin, Henry and Weiss and
Governor Thompson is independent under the rules of the NYSE. As noted above, each of Ms. Garvey and Mr. Henry will retire from
our Board at the Annual Meeting and are not director nominees. We refer to directors for whom we have affirmatively determined
independence under NYSE rules as “Independent Directors.” Our only non-independent directors are Mr. Brinker, our President
and CEO, and Mr. Thomas, former President and CEO of Physicians Realty Trust and our current employee.
Time Commitment and Attendance
When evaluating potential director nominees, our Board considers
ability and willingness to commit adequate time to Board and committee matters, including in light of the nominee’s other
positions, service on other public company boards and/or board leadership positions. We expect our directors to attend regularly
scheduled quarterly meetings of our Board, including the annual meeting of stockholders, as well as make every effort to attend
all other scheduled meetings of the Board and all other meetings of committees of which they are members. Directors are expected
to be sufficiently familiar with our business and the risks and competition we face to facilitate active and effective participation
in the deliberations of the Board and of each committee on which he or she serves.
Our Board values the experience directors bring from other boards
on which they serve, but recognizes that those boards may also present demands on a director’s time and availability. Accordingly,
under our Corporate Governance Guidelines, directors may not serve on the board of directors of more than four other public companies,
and our President and CEO and any director serving as a chief executive officer or other executive officer of another public company
may not serve on the board of directors of more than two other public companies. Our Board has determined that this policy on director
time commitments is appropriate based on a review of institutional investor and proxy advisory firm guidelines, as well as peer
trends and best practices. Our Board, with oversight from the Governance Committee, reviews the policy and each director’s
compliance on an annual basis. All director nominees currently comply with the Company’s policy on director time commitments.
Proxy Access
Our Bylaws permit a stockholder, or group of up to 25 stockholders,
owning at least 3% of our outstanding common stock continuously for three years to nominate up to the greater of two directors
or a number of directors constituting up to 20% of our Board for inclusion in our proxy materials for an annual meeting of stockholders,
subject to complying with the requirements contained in our Bylaws. For more information on using proxy access to nominate directors,
see “Other Matters—2025 Stockholder Proposals, Director Nominations and Director Candidate Recommendations.”
 | |
 | |
 | |
 |
| 25 | |
3% | |
3 | |
20% |
Up to a group of
25 stockholders | |
Owning at least
3% of our shares | |
Continuously for
3 years | |
May nominate the greater
of two nominees or 20%
of our Board |
Onboarding and Education
Continuous Education and Exposure to Best Practices
 |
Onboarding and orientation: When
a director joins our Board, senior management provides an orientation to familiarize the new director with the Company’s
strategy, business, policies and governance practices. |
| |
|
|
Deep dives and meaningful
engagement: Throughout the year, our management team, as well as outside advisors, present to the Board on substantive
topics that affect our business and relate to our strategy. During our regular quarterly Board meetings, our directors meet
with members of management, including emerging leaders, to receive insight on our operations. During 2023, our directors received
cybersecurity, corporate governance, corporate responsibility and risk management updates from subject matter experts. |
| |
|
|
Educational memberships and events: We
encourage directors to attend director education programs relating to board responsibilities, corporate governance and/or
substantive matters relevant to the Company. We provide a list of upcoming educational programs and conferences to our directors
every quarter and reimburse cost of attendance. In addition, each director is provided with membership in the National Association
of Corporate Directors, which provides continuing director education programming. In 2023, our directors attended director
education events covering risk management and corporate governance, among other topics. |
| |
|
|
Governance policymaking: Certain of
our directors are actively involved in shaping policy around corporate governance. For example, Ms. Lewis, our Compensation
Committee Chair and a member of our Governance Committee, is a member of the Leadership Board, Corporate Governance Working
Group and ESG Working Group of the U.S. Chamber of Commerce Center for Capital Markets Competitiveness. |
Board Self-Evaluation
Self-Evaluation Process
Our Board conducts an annual self-assessment aimed at enhancing
its effectiveness. Our directors review areas where they feel our Board functions effectively and, importantly, areas where our
Board believes there are opportunities for improvement, including through ongoing and orderly Board refreshment.

Board Composition and Refreshment
Board Composition, Committee Rotation and Refreshment
Board Composition and Committee Rotation
The Governance Committee periodically assesses our directors’
skills, experience and perspectives in the context of the Board’s overall composition, as well as the current and future
needs of the Company and the Board. Among other matters, the Committee considers the results of its annual self-assessments for
the Board and its committees when regularly reviewing Board leadership and committee composition.
In considering Board composition and leadership, the Board balances
the benefits derived from continuity and experience, as well as the benefits derived from fresh viewpoints and perspectives. By
periodically rotating committee composition, our directors gain a comprehensive understanding of different aspects of our business.
Considering our Company’s portfolio transformation, strategic direction and enhanced focus on corporate governance, human
capital management and corporate responsibility, as well as director refreshment and scheduled retirements under our director term
limit policy, our Board conducted a comprehensive review of its composition and structure and made the following updates in 2023:
| • |
Ms. Sandstrom was appointed as our independent Board Chair, in addition to her role
as Chair of the Governance Committee, rotating off the Compensation Committee. |
| • |
Mr. Cartwright joined the Compensation Committee, bringing his human capital management and SEC
experience to that committee. |
| • |
Mr. Connor was appointed as an Independent Director and joined the Audit and Compensation Committees, bringing his financial expertise to the
Audit Committee and human capital management experience to the Compensation Committee. |
| • |
Following the Annual Meeting and subject to their election by stockholders, we anticipate that
Ms. Kessler will serve on the Audit Committee, Ms. Lias-Booker will serve on the Governance Committee, and Governor Thompson
and Mr. Weiss will serve on the Investment and Finance Committee, with Governor Thompson serving as Chair of that committee,
in each case, based on their prior relevant experience on the board of trustees of Physicians Realty Trust. |
Refreshment
Director Term Limit Policy
Our Board believes that our directors develop an understanding
of the Company and an ability to work effectively as a group over time. Accordingly, our Board places value on year-over-year continuity.
At the same time, the Board believes that director refreshment is important to help ensure that Board composition is aligned with
the needs of the Company as our business evolves. The Board strategically reviews director refreshment from time to time and has
adopted a 15-year director term limit policy.
| • |
Our 15-year term limit policy allows us to continue orderly Board refreshment while allowing for a cohesive Board and diversity of skills, experiences and tenures. |
| • |
Under the 15-year term limit policy, directors will not be nominated for election or appointed to the Board at any annual meeting of stockholders following the calendar year in which they have attained 15 years of service on the Board. On the recommendation of the Governance Committee, the Board, by majority vote and on an annual basis, may waive the term limit if the Board deems such waiver to be in the best interests of the Company. |
| • |
Under the 15-year term limit policy, Ms. Garvey and Mr. Henry are scheduled to retire from the Board and will not be standing for re-election at the Annual Meeting. |
| 54% |
| of Board Refreshed Since 2022 |
| |
| 3 Years |
Average and
Median Director
Nominee Tenure |
Corporate Governance
Board and Stockholder Meeting Attendance
Our Board’s
primary responsibility is to oversee the long-term health and success of our
business on behalf of stockholders. In order to effectively carry out that duty to stockholders,
our Board commits a substantial amount of time and attention throughout the
year to the most significant aspects of our business. Directors are expected to, and do, ask
challenging questions of management.
Our policy
is that directors should make every effort to attend all meetings of our Board and
the annual meeting of stockholders, as well as all meetings of Board committees for which
they are members. Our directors are committed to their responsibilities and are highly
engaged, as demonstrated by their average high attendance in excess of 90% of all
2023 Board and committee meetings. The Board meeting schedule in 2023 was more demanding
due to numerous meetings held in connection with the Physicians Realty Trust merger.
No director attended less than 75% of the aggregate number of meetings of our Board
and the committees on which the director served in 2023. When directors were not able
to attend a Board meeting due to a scheduling conflict, they separately met with our
Board Chair or President and CEO to discuss the meeting topic(s). All of our then-serving
directors attended the 2023 annual meeting of stockholders.
We value
the experience our directors bring from other boards on which they serve, but
we also recognize that those boards may present demands on a director’s time and availability.
As discussed on page 22, all director nominees satisfy our policy on director time
commitments.
Board Effectiveness:
Underscored by Engagement |
| |
| 100% |
2023 Annual Meeting
Attendance by Directors |
| |
| 93% |
Board Meeting
Attendance in 2023 |
| |
| 15 |
Total Board
Meetings in 2023 |
| |
| 100% |
Committee Meeting
Attendance in 2023 |
| |
| 12 |
Total Committee
Meetings in 2023 |
| |
Corporate Governance Highlights
We are committed to sustainable corporate governance practices
that promote long-term value creation, transparency and accountability for our stockholders. Based on investor feedback on our
governance practices, along with our ongoing evaluation of best practices, we made a number of governance and disclosure enhancements
in recent years.
| 2020 |
|
2021 |
|
2022 |
|
2023+ |
Updated the independent director retirement policy
to reflect a 15-year term limit policy instead of a mandatory retirement age
Aligned our ESG disclosure with the TCFD and SASB reporting
frameworks
|
|
Codified the Board’s oversight of corporate responsibility
matters in the Governance Committee Charter
Enhanced ESG disclosures according to leading reporting
frameworks, including TCFD
|
|
Appointed an independent female Vice Chair of the Board
Rotated Board committee memberships |
|
Appointed an independent female Board Chair
Appointed a new director in March 2023 and five new
directors in March 2024 (five of these six directors are independent)
Rotated Board committee memberships, with two of three
NYSE-required committees chaired by women
|
Corporate Governance Policies
CORPORATE GOVERNANCE GUIDELINES
| |
• |
Our Board has adopted Corporate Governance Guidelines with respect to, among other
things, Board composition, Board meetings, our Board’s standing committees, stockholder communications with our Board,
director time commitments, continuing education for directors, succession planning and Board and committee self-assessment. |
CODES OF BUSINESS CONDUCT AND ETHICS
| |
• |
Our Board has adopted a Code of Business Conduct and Ethics (the “Code of Conduct”)
that applies to all of our directors, officers and employees, as well as a Vendor Code of Business Conduct and Ethics (the
“Vendor Code”, and together with the Code of Conduct, the “Codes of Conduct”) that applies to our
vendors and business partners. |
| |
• |
The Codes of Conduct represent an integral part of our commitment to the highest ethical standards,
and are aimed at ensuring that our directors, employees and vendors work collectively to uphold those standards. The Board
reviews the Codes of Conduct annually. |
| |
• |
We provide annual training on the Code of Conduct to all of our employees, with 100% participation
by active employees in 2023. |
| |
• |
The Codes of Conduct address, among other things, labor practices and human rights, health and
safety, environmental sustainability, conflicts of interest, corporate opportunities, confidential information, competition
and fair dealing, including relationships with customers and suppliers, gifts, protection of Company assets and compliance
with laws. |
| |
• |
The Code of Conduct also serves as the code of ethics required under applicable SEC rules for our
senior financial officers. |
| |
• |
Waivers of, and amendments to, our Code of Conduct that apply to our directors and executive officers
will be timely posted on our website at healthpeak.com/esg/governance to the extent required by applicable SEC and NYSE rules.
There were no such waivers in 2023. |
WHISTLEBLOWER HOTLINE
| |
• |
Our officers, employees, vendors and business partners are encouraged to report complaints
regarding accounting, internal controls, auditing matters, violations of law, violations of our Codes of Conduct or other
concerns regarding the conduct of Healthpeak’s employees, representatives or business partners through our secure whistleblower
hotline, and we enable any reported concerns to be submitted anonymously. |
| |
• |
The whistleblower hotline is made available to employees via our intranet and to vendors and business
partners via our website. In each case, the site leads the individual to an external, independent website operated by an independent
service provider. |
| |
• |
Any matter reported through the whistleblower hotline and determined not to be frivolous or immaterial
is reviewed first by our Audit Committee Chair and, in certain cases, by our General Counsel, Chief Human Resources Officer
and/or our head of Internal Audit, and investigated and discussed with our Audit Committee and/or full Board. When appropriate,
independent third parties assist in an investigation. |
| |
• |
No complaints reported through the whistleblower hotline in 2023. |
RELATED PERSON TRANSACTIONS POLICIES AND PROCEDURES
| |
• |
Our General Counsel and our President and CEO initially review potential related person
transactions for materiality and then provide them to the Audit Committee for review and approval, as appropriate. |
| |
• |
For this purpose, “related person transactions” are generally defined under applicable
SEC rules as any transaction or series of transactions in which we are a participant, the amount involved exceeds $120,000
and any of our directors, director nominees, executive officers, 5% or greater stockholders or any of their respective immediate
family members or certain related entities has a direct or indirect material interest. |
| |
• |
Under the Audit Committee Charter and our Related Person Transactions Policy, any related person
transactions brought to the Audit Committee’s attention that could reasonably be expected to have a material impact
on our financial statements must be discussed among the Audit Committee, management and Healthpeak’s independent auditor. |
| |
• |
In determining whether to approve or reject a related person transaction, the Audit Committee takes
into account, among other factors it deems appropriate, whether the proposed transaction is on terms no less favorable than
terms generally available to an unaffiliated third party under the same or similar circumstances, as well as the extent of
the related person’s economic interest in the transaction. |
| |
• |
No related person transactions required to be disclosed for 2023. For information relating to Mr.
Thomas’s employee compensation, see “Director Compensation—2023.” |
| Where to find our corporate governance documents |
|
We encourage you to view the following corporate governance materials on our website
at healthpeak.com/esg/governance: |
|
• Board
Committee Charters
• Corporate Governance Guidelines
|
|
• Code of Business Conduct and Ethics
• Vendor Code of Business Conduct and Ethics
|
Risk Oversight
Board Responsibilities
Our Board believes that effective risk management involves our
entire corporate governance framework. Both management and our Board have key responsibilities in managing risk throughout the
Company, as shown below. The Board oversees the risk management process. Oversight of risks inherent in their respective areas
of oversight are delegated to the various Board committees, with each committee working with management and reporting to our
Board at each regular Board meeting.
Our risk management process includes checks and balances that
allows our Independent Directors to review and consider any risk matters. In the event it is advisable that our Independent Directors
review or take alternative action on management’s recommendation on any risk matters, our independent Chair has the authority
to call and preside at special meetings or executive sessions of the Independent Directors as necessary or advisable.
Management Responsibilities
Management proactively analyzes the short-, intermediate-and long-term
risks that may adversely affect our business, operations or financial condition. Management utilizes an ongoing assessment process
that identifies material risks and implements management and mitigation strategies, reporting to and working with the Board and
its committees. Our formal Enterprise Risk Management program identifies, assesses, evaluates, responds to and monitors the risks
identified by management’s various subject matter experts across the Company, including finance, tax, legal, operations,
internal audit and the business segments. Our General Counsel, who reports to our President and CEO, oversees our compliance program,
and our Vice President of Internal Audit, who has a direct reporting line to our independent Audit Committee Chair, oversees our
Enterprise Risk Management program and our ongoing risk assessment process.
After determining risks that could have a material business, operational
or financial impact, management models the potential impact using a scorecard/heat map, in addition to analyzing trends of increasing
or decreasing importance. Our Board and its committees receive reports from and engage with management regarding these risks, their
potential impacts and the steps management has taken to monitor and mitigate these risks, making determinations on any action warranted.
These risks include short-, intermediate-and long-term risks, as well as both existing risks and emerging risks. Our Board’s
oversight standards apply regardless of the immediacy of the risk assessed. Each of our current directors possesses risk oversight
and management experience, which we believe makes our Board particularly effective in engaging with management to address existing
risks and identify significant emerging risks.
In addition to identifying and mitigating risks, management assesses
which risks merit disclosure in our periodic reports, including through a cross-functional management-level disclosure committee
that meets quarterly to identify any significant emerging risks warranting disclosure, as well as an extensive annual cross-functional
review of our risk factors disclosed in our Annual Report on Form 10-K. These disclosure controls and procedures are designed to
ensure that information required to be disclosed in our reports under the Securities Exchange Act of 1934, as amended (the “Exchange
Act”) is recorded, processed, summarized and reported within the time periods specified in the SEC’s rules and forms
and that this information is accumulated and communicated to our management to allow for timely decisions regarding disclosure.
These disclosure controls and procedures, and the resulting assessments and determinations regarding disclosure of risks, are discussed
regularly with our Board as part of its risk oversight function.
Our Board periodically reviews management’s risk mitigation
strategies, including our business continuity plan and crisis response protocols, with management to ensure that we appropriately
and timely identify and respond to emerging risks. As determined appropriate, our Board is also guided by independent advisors,
who report from time to time to the Board on various risk topics within their area of expertise. For example, a third-party cybersecurity
expert presents to our Board at least annually regarding known and emerging cybersecurity risks and its cybersecurity reviews of
our systems, and our independent auditors present to our Board regularly regarding various operational and other risks that could
impact our financial statements. For additional discussion of our cybersecurity risk management and governance, see Part I, Item
1C. “Cybersecurity” in our Annual Report on Form 10-K for the fiscal year ended December 31, 2023 filed with the SEC
on February 9, 2024.
Risk Oversight Responsibilities
| |
Board Responsibilities |
| |
 |
Oversight of the risk management
process |
|
|
Leadership of management succession
planning |
|
|
Review of periodic reports
from Board committees on specific risk oversight responsibilities |
| |
|
Development of business strategy
and major resource allocation |
|
|
Business conduct and compliance
oversight |
|
|
General oversight of cybersecurity
risk |

| AUDIT COMMITTEE |
COMPENSATION
COMMITTEE |
GOVERNANCE
COMMITTEE |
INVESTMENT COMMITTEE |
• Oversight
of enterprise risk management activities, including data, cybersecurity and artificial intelligence policies and programs
• Oversight
of staffing and performance of internal audit function
• Oversight
of integrity of financial statements and internal control over financial reporting
• Responsible
for appointment, compensation and oversight of independent registered public accounting firm
|
• Oversight
of compensation-related risks and overall philosophy
• Oversight
of human capital matters, including succession planning, diversity, inclusion, talent development, recruitment,
retention, health, wellness and safety
|
• Overall
corporate governance leadership
• Provides
recommendations regarding Board and committee composition
• Oversight
of corporate governance and environmental performance and climate strategy
|
• Overall
oversight of investment policies and strategies
• Overall
oversight of finance requirements and plans relating to investment strategies
|
| Management
Responsibilities |
|
|
• Identify material risks
• Implement appropriate risk management and mitigation strategies
|
|
• Integrate risk management into our decision-making process
• Transmit information with respect to material risks to senior executives and our Board
|
| RISK AREAS |
• Strategic
• Reputational
• Capital
markets and liquidity
|
• Legal,
regulatory and compliance
• Operational
• Financial
reporting and internal control
|
• Cybersecurity,
artificial intelligence and information technology systems
• Human
capital and health/wellness matters
• Corporate
responsibility/sustainability
|
Stockholder Engagement
We engage in proactive outreach to discuss business strategy,
financial and operational performance, corporate governance and responsibility, among other topics of interest to our stockholders.
We believe that ongoing dialogue with our stockholders is a critical component of responsive and transparent corporate governance.
Stockholder feedback has been instrumental in structuring our ESG program, as well as enhancing our corporate governance practices.
The following graphic illustrates our annual cycle of stockholder outreach:

2023 Stockholder Engagement
We are committed to regular stockholder engagement and solicited
our stockholders’ views on financial performance, governance, ESG and other issues in 2023.
| |
|
|
|
|
| |
OUTREACH |
|
FOCUS AREAS |
|
| |
•
14 industry investor
conferences and numerous one- on-one meetings
•
Hosted management presentations
and Lab and Medical City Dallas tours
•
19 investor property
tours
|
|
•
Business performance
and balance sheet and liquidity management
•
Corporate responsibility
matters, such as sustainability and governance
•
Board and executive
leadership outreach
|
|
| |
|
|
|
|
| |
KEY TAKEAWAYS – WHAT WE HEARD |
|
WHAT WE DID IN RESPONSE |
|
| |
•
Support for our strategy and solid operational performance
•
Questions about the impact of macroeconomic conditions
and strategy to deal with potential headwinds in the Lab sector
|
|
•
Embarked on transformative business combination with Physicians
Realty Trust, which closed on March 1, 2024, to position ourselves as an industry leader for healthcare discovery and delivery
•
Proactive balance sheet management and continued intensive
focus on leasing and tenant engagement
|
|
| |
|
|
|
|
Communicating with the Board
If you wish to contact members of our Board, the Chair of the
Board, any Board committee, or our Independent Directors as a group, you may send written correspondence to our Corporate Secretary
at Healthpeak Properties, Inc., 4600 South Syracuse Street, Suite 500, Denver, Colorado 80237. Please clearly note the name(s)
of any specific intended Board recipients. If you are a stockholder, please also provide documentation of share ownership and appropriate
contact information in all correspondence. Our Corporate Secretary will process and direct your communication to the appropriate
member(s) of our Board, other than items unrelated to our Board’s duties, such as spam, junk mail, solicitations, employment
inquires and similar items (at their request). This centralized process assists our Board in reviewing and responding to stockholder
and interested party communications in a more efficient manner.
Corporate Responsibility Initiatives
Our Board believes that integrating ESG initiatives into our strategic
business objectives is critical to our long-term success. Through our integrated and ongoing approach to sustainability, we seek
to drive positive change and create value for our stakeholders through corporate responsibility and stewardship.
Oversight
|
BOARD
Oversees all corporate responsibility matters
and receives quarterly updates from management regarding strategy, goals, opportunities, risks, initiatives and results
|
|
AUDIT COMMITTEE
Oversees quality and integrity of quantitative public disclosures
relating to ESG matters
|
|
GOVERNANCE COMMITTEE
Oversees our climate risk management, corporate
governance and responsibility initiatives
|
|
COMPENSATION COMMITTEE
Oversees executive compensation and human capital matters
|
Focus Areas
Informed by internal assessments and stakeholder engagement, we
prioritize the initiatives that we believe matter most to our business and stakeholders, keeping in mind our operational level
of control with respect to our properties. Our key performance indicators for these areas include:
 |
Value Creation
•
Cost savings
•
Tenant attraction and
satisfaction
•
Sustainable returns
|
| Climate
Risk Management |
|
Governance
Initiatives |
|
Social
Responsibility |
•
Efficient
buildings to generate savings
•
Proactive
green strategies
|
|
•
Best-in-class
corporate governance practices
•
Transparency
•
Risk
management
•
Ethics
and compliance
|
|
•
Diversity and inclusion
•
Talent
acquisition, retention and development
•
Employee
engagement and satisfaction
•
Community
engagement
|
10-Year Sustainability Strategic Roadmap
In 2023, we undertook an extensive review of our sustainability
practices and progress and developed a comprehensive 10-year strategic roadmap, with the following specific near-term focus areas:
| • |
Renewable Energy: Enhance renewable energy procurement, including through green utility tariffs, on-site solar, community choice aggregation and/or power purchase agreements |
| • |
Decarbonization: Conduct a full inventory of GHG emissions across the newly combined company portfolio to identify data gaps and assist in establishing new long-term GHG emissions reduction targets |
Key 2023 Initiatives
 |
Published our 12th annual ESG Report aligned with several leading reporting frameworks, including TCFD |
|
Conducted a top-down review and refinement of our sustainability strategy |
|
Continued implementing projects to achieve our long-term science-based GHG emissions reduction targets, as well as energy, water and waste reduction goals |
|
Continued focusing on diversity and inclusion initiatives |
|
132 new ENERGY STAR certifications and 4 new LEED certifications in 2023 |
| We are consistently recognized for our corporate responsibility initiatives and disclosure. See “Proxy Summary—Corporate Responsibility Highlights” for a summary of our recent recognitions. To learn more about our ESG efforts, including our industry leadership, view our annual ESG Report at healthpeak.com/esg. |
Human Capital Management
Our Board believes that human capital management is vital to the
Company’s organizational health and is strongly committed to diversity and equal opportunity, with the tone set from the
top. The Compensation Committee has oversight over human capital matters, including culture, diversity, inclusion, talent
acquisition, retention, employee satisfaction and engagement, succession planning and executive compensation.
Cornerstones of Our Human Capital Management Initiatives
|
Diversity and inclusion:
Makes our organization stronger through a variety of skills, perspectives and backgrounds
Employee satisfaction
and engagement: Helps us retain top talent and continuously enhance our performance
Attracting top talent:
Positions us for long-term success
|
|
Training and development:
Helps enhance career and professional development and identify emerging leaders
Compensation and benefits:
Provides merit-based, equitable compensation to attract, retain and recognize top talent
Community partnership:
Provides support to charitable organizations and initiatives that share our mission
|
|
Health, safety and wellness:
Protects our most vital assets – our employees – through special training and other measures
Succession planning:
Ensures that top management positions can be filled without undue interruption
|
Board Leadership Structure
Independent Chair
As part of its ongoing evaluations, our Board carefully considers
the appropriate Board leadership structure, taking into account each director’s skills, experience and perspectives, as well
as the current and future needs of the Company and our Board.
Our Board has determined that an appropriate structure for the
Company and its stockholders at this time consists of an independent Chair of the Board. This role effectively allocates authority,
responsibility and oversight between management and the independent members of our Board. This structure gives primary responsibility
for the operational leadership and strategic direction to the CEO, while enabling our independent Chair to facilitate our Board’s
oversight of management, promote communication between management and the Board and support our Board’s consideration of
key governance and ESG matters.
Our Corporate Governance Guidelines outline the considerations
relating to our Board leadership. These considerations include potentially filling the positions of Chair of the Board and CEO
by one individual or two different individuals as the Board determines is appropriate. The Board believes it is important to structure
its leadership based upon its assessment of the Company’s needs including, without limitation, our business, strategic opportunities
and succession planning priorities. Our Board also takes into account the views of institutional investors and proxy advisory firms,
as well as governance and industry trends.
|
|
|
|
|
 |
Katherine M.
Sandstrom
Chair of the Board
|
|
|
Katherine M. Sandstrom serves as our independent Chair of the
Board. Our Chair actively manages our Board by:
•
Presiding at all meetings
of our Board
•
Establishing the agenda
for each Board meeting in consultation with our management team
•
Calling and presiding
at executive sessions of the Independent Directors
•
Engaging with management on topics
discussed in executive session as needed
•
Planning for future
Board leadership roles and succession, as well as orderly director refreshment, including actively overseeing the search for potential
director candidates
|
|
| |
|
|
|
|
| |
|
|
|
|
|
We engage in ongoing stockholder outreach and dialogue on a variety
of issues, including with respect to corporate governance matters such as our Board’s composition and leadership structure.
In addition, our independent Chair and independent Board committee chairs represent the Board in stockholder outreach and engagement
as they deem necessary or advisable. Should our Board determine that a combined Chair and CEO position is appropriate, our Board
would decide whether and when to seek additional prior stockholder input, balancing the needs of the Company and the considerations
driving the timing and disclosure of the appointment.
In connection with the above responsibilities, our Chair leads
our Board in overseeing the management and direction of the Company; however, any specific actions taken in connection with this
oversight responsibility are exercised by our full Board or any Board committee to which authority has been delegated by our Board,
and not by any individual director.
Executive Sessions
The Independent Directors hold regular executive sessions to provide
an opportunity to discuss matters without Company management present, including our President and CEO. These executive sessions
allow for candid conversations and promote the independence of our Board from management. Executive sessions follow regularly scheduled
Board and committee meetings, but are also sometimes held independently of regular Board and committee meetings. Any Independent Director may call an executive session.
Board Committees
Our Board has a standing Audit Committee, Compensation and Human
Capital Committee, and Nominating and Corporate Governance Committee, each of which has a written charter available on our website
at healthpeak.com/esg/governance. Our Board also has a standing Investment and Finance Committee to review Healthpeak’s potential
investments, financing requirements and related capital structure, plans and strategies.
As a corporate governance best practice, the Governance Committee
annually considers the composition of our standing Board committees to ensure an appropriate balance of workloads and a diversity
of perspectives. The committee descriptions below reflect the current membership of the standing committees of our Board and the
number of meetings and attendance for each in 2023. Messrs. Brinker and Thomas do not and will not serve on any Board committees.
Following the Annual Meeting and subject to their election by
stockholders, we anticipate that Ms. Kessler will serve on the Audit Committee, Ms. Lias-Booker will serve on the Governance Committee,
and Governor Thompson and Mr. Weiss will serve on the Investment and Finance Committee, with Governor Thompson serving as Chair
of that committee.
|
Audit
Committee
100% INDEPENDENT
CURRENT MEMBERS
R. Kent Griffin, Jr.*, Chair
James B. Connor*
Christine N. Garvey*
David B. Henry*
*NYSE/SEC
Financial Expert

|
RESPONSIBILITIES INCLUDE:
•
Oversee independent
auditor
•
Oversee annual
assessment of internal controls and the internal audit function
•
Review independence
and quality control procedures of independent auditor
•
Oversee financial
statement and internal control integrity and processes, including implementation of new accounting standards
•
Plan annual
audit with management, independent auditor and internal audit team
•
Communicate
with independent auditor regarding conduct of the audit and other matters, including review of critical audit matters and issues
encountered during the annual audit
•
Pre-approve
audit and non-audit services to be provided by the independent auditor
•
Oversee legal
and regulatory compliance and enterprise risk management activities
•
Oversee information
and cybersecurity risk management processes
•
Oversee quality
and integrity of quantitative public disclosures relating to ESG matters
•
Review strategy
for use of swaps or derivative instruments for hedging risks
•
Review quarterly
and annual financial statements and related disclosures
•
Review related
person transactions
|
|
|
KEY MEMBER SKILLS
•
High level of financial
experience
•
Senior leadership experience
•
Risk oversight/management
experience
Total 2023 Meetings: 4
2023 Meeting Attendance: 100%
|
2023 HIGHLIGHTS
•
Reviewed portfolio
and operational risk management plans, including cybersecurity risk mitigation practices
•
Oversaw use of non-GAAP
financial measures and other accounting policies
|
|
| |
|
|
|
| Investment
and Finance
Committee
100% INDEPENDENT
CURRENT MEMBERS
David B. Henry, Chair
Christine N. Garvey
R. Kent Griffin, Jr.

|
RESPONSIBILITIES INCLUDE:
• Review
our investment policies and related financing requirements, plans and strategies
• Review
potential significant acquisitions, dispositions, developments or redevelopments of single properties or portfolios of
properties
|
|
KEY MEMBER SKILLS
•
REIT/real
estate experience
•
Public company
executive/Board experience
•
Investment expertise
Total 2023 Meetings: 1
2023 Meeting Attendance: 100%
|
2023 HIGHLIGHTS
•
Reviewed and
advised on significant transactions and developments
|
|
| |
|
|
|
|
Compensation
and Human
Capital
Committee
100% INDEPENDENT
CURRENT MEMBERS
Sara G. Lewis, Chair
Brian G. Cartwright
James B. Connor
Christine N. Garvey

|
RESPONSIBILITIES INCLUDE:
•
Determine executive
compensation, including approving performance goals, objectives and target opportunities
•
Evaluate executive
officer performance annually in connection with compensation decisions
•
Review director
compensation and recommend changes to our Board
•
Periodically
review all annual cash incentive, equity incentive, 401(k), severance and change-in-control plans
•
Assess risks
related to compensation arrangements
•
Oversee the
administration of the clawback policy
•
Consider results
of stockholder advisory vote on executive compensation
•
Review and discuss
with management the compensation discussion and analysis, and recommend to our Board whether it be included in the annual proxy
statement
•
Review and approve independent compensation
consultant engagement
•
Oversee human capital matters
•
Grant equity
awards or delegate such authority to a subcommittee (the Board and Compensation Committee have delegated authority to Mr. Brinker
to grant certain equity awards to non-executive employees within certain limits)
For information on the role of Ferguson Partners
Consulting L.P. (“Ferguson Partners Consulting”), the Compensation Committee’s independent compensation consultant,
relating to executive compensation decisions, as well as the role of our President and CEO for our other executive officers, see
“Compensation Discussion and Analysis.”
|
|
|
KEY MEMBER SKILLS
•
Senior leadership experience
•
Human capital management experience
Total 2023 Meetings: 3
2023 Meeting Attendance: 100%
|
2023 HIGHLIGHTS
•
Provided oversight of and guidance on human capital
matters
•
Made 2023 compensation determinations based on approved
2023 compensation plans
•
Established 2024 executive
compensation plans and approved compensation of management team members
|
|
| |
|
|
|
Nominating
and Corporate
Governance
Committee
100% INDEPENDENT
CURRENT MEMBERS
Katherine M.
Sandstrom, Chair
Brian G. Cartwright
David B. Henry
Sara G. Lewis

|
RESPONSIBILITIES INCLUDE:
•
Develop and
oversee Corporate Governance Guidelines applicable to our Board
•
Oversee corporate
governance, sustainability and corporate responsibility matters
•
Oversee policy
on director time commitments
•
Review Codes
of Conduct and the enforcement procedures in place at least annually
•
Identify qualified
candidates as potential Board members
•
Recommend candidates
for election at annual stockholder meeting and to fill Board vacancies
•
Oversee annual
Board and committee evaluation process
•
Oversee Board
and committee composition and recommend committee rotations when appropriate
•
Review performance
of each director at least annually and assess continued suitability as a director when he or she has a change in job responsibilities
|
|
|
KEY MEMBER SKILLS
•
Legal/regulatory experience
•
Public company executive/Board
experience
•
Risk oversight/management
experience
Total 2023 Meetings: 4
2023 Meeting Attendance: 100%
|
2023 HIGHLIGHTS
•
Provided oversight
and guidance on corporate governance matters
•
Oversaw corporate responsibility
initiatives and climate risk strategy and received regular management updates on corporate responsibility strategy and performance
•
Oversaw the search
for new director candidates, leading to the appointment of one new director in 2023 and five new director appointments in connection
with our merger with Physicians Realty Trust
|
|
| |
|
|
|
Director Compensation—2023
Annual Compensation
In consultation with Ferguson Partners Consulting, the Compensation
Committee’s independent compensation consultant, the Compensation Committee periodically reviews our Independent Director
compensation program for continued alignment with comparable companies and sound governance practices and last reviewed director
compensation in 2022. The Committee determined not to make any changes to director compensation for 2023.
Compensation paid to our Independent Directors for services in
2023 is further described below. Mr. Brinker, our President and CEO and a director, received no separate compensation for his services
as a director in 2023. Mr. Thomas will not receive compensation in connection with his service on the Board. Following the closing
of our merger with Physicians Realty Trust on March 1, 2024, Mr. Thomas receives compensation as our employee beginning in 2024, with total aggregate compensation of $100,000
annual base salary, $400,000 annual restricted unit grant and standard employee benefits, which amounts will be included in the
2024 Director Compensation table in next year’s proxy statement.
|
ANNUAL INDEPENDENT DIRECTOR COMPENSATION

|
ADDITIONAL ANNUAL CASH COMPENSATION
Independent Chair: $140,000
Independent Vice Chair: $70,000*
|
|
Audit Committee
•
Chair – $35,000
•
Member – $17,500
Compensation Committee
•
Chair – $30,000
•
Member – $10,000
|
Governance Committee
•
Chair – $20,000
•
Member – $9,000
Investment Committee
•
Chair – $25,000
•
Member – $7,500
|
*
Ms. Sandstrom served as Independent Vice Chair for a portion of 2023
|
| |
|
|
Independent Director Cash Compensation
We pay an annual cash retainer of $85,000 to each director, as
well as an additional annual cash retainer of $140,000 to our independent Chair (and an additional $70,000, prorated, to Ms. Sandstrom
in connection with her role as independent Vice Chair for the portion of the year in which she served in that role) and committee
fees as set forth in the table above.
We also pay Independent Directors an additional $1,500 per meeting
fee for each Board or individual committee meeting they attend beyond 10 meetings of our Board or that committee, as applicable,
in a given calendar year (for example, for each Audit Committee meeting after 10 Audit Committee meetings in one calendar year).
In 2023, there were five such additional meetings.
All cash retainers are paid quarterly in arrears and prorated
based on the number of days that a member serves in the applicable capacity. We also reimburse Independent Directors for director
education and reasonable travel expenses in connection with their Board duties.
Independent Director Equity Compensation
We grant an annual equity retainer in restricted stock units (“RSUs”)
with a grant date fair value of $180,000, rounded up to the nearest whole share, to each Independent Director who is elected at
the annual meeting of stockholders or is initially appointed as an Independent Director other than at the annual meeting. The award
for a new Independent Director who is initially appointed other than at an annual meeting may be pro-rated. In 2023, each independent
director was granted an annual equity award in the form of RSUs with a grant date fair market value of $180,000 on April 28, 2023.
The RSUs cliff-vest in full on the earliest of the first anniversary of the grant date, the Company’s next annual meeting
of stockholders, or the termination of the independent director’s service due to death or disability. The awards are subject
to forfeiture if the director’s service terminates for any other reason. The Compensation Committee believes
that the 1-year cliff vesting promotes retention during the annual term in which our directors serve.
2023 Independent Director Compensation
The following table summarizes the compensation of the Independent
Directors for the fiscal year ended December 31, 2023.
NAME(1)
(A) | |
FEES EARNED OR
PAID IN CASH
($)
(b) | |
STOCK
AWARDS ($)(2)
(c) | |
TOTAL ($)
(h) |
| Brian
G. Cartwright | |
178,670 | |
180,000 | |
358,670 |
| James
B. Connor | |
58,536 | |
180,000 | |
238,536 |
| Christine
N. Garvey | |
120,000 | |
180,000 | |
300,000 |
| R. Kent
Griffin, Jr. | |
127,500 | |
180,000 | |
307,500 |
| David
B. Henry | |
136,500 | |
180,000 | |
316,500 |
| Sara
G. Lewis | |
124,000 | |
180,000 | |
304,000 |
| Katherine
M. Sandstrom | |
210,934 | |
180,000 | |
390,934 |
| (1) |
Messrs. Thomas and Weiss, Governor Thompson and Mses. Kessler and Lias-Booker did not serve as directors during 2023. |
| (2) |
RSUs issued pursuant to the 2023 Performance Incentive Plan (the “2023 Plan”). The value in the stock award column represents the aggregate grant date fair value of RSUs awarded to the director in the fiscal year, computed in accordance with Financial Accounting Standards Board (“FASB”) Accounting Standards Codification (“ASC”) Topic 718—Compensation. For a discussion of the assumptions and methodologies used to calculate the amounts referred to above, see Note 14—Compensation Plans to the Consolidated Financial Statements included in our Annual Report. As of December 31, 2023, each of our Independent Directors who were serving on the Board at that time held 8,193 unvested RSUs. |
Director Compensation Policies and Plans
Director Stock Ownership Guidelines
Independent Directors are required to accumulate and hold shares
of Healthpeak stock (including RSUs) equal in value to at least five times the amount of the annual cash retainer for Independent
Directors (i.e., $425,000). The guidelines are effective on the first May 15 that occurs more than five years after an Independent
Director first becomes a member of our Board. Once subject to the guidelines, an Independent Director’s level of stock ownership
will be reviewed annually on May 15 for as long as the director remains in office. Shares that count toward the satisfaction of
the stock ownership guidelines include shares of our common stock beneficially held (directly or indirectly) by the Independent
Director, vested or unvested restricted stock units, and shares of our common stock deferred under a deferred compensation plan.
The Governance Committee is responsible for reviewing, overseeing and monitoring compliance with the director stock ownership guidelines.
All of our Independent Directors for whom the guidelines were effective as of May 15, 2023 satisfied the required level of ownership
as of that date.
Director Deferred Compensation Plan
We maintain a deferred compensation plan (the “Director
Deferral Plan”), which permits our Independent Directors to elect to defer their annual retainers. Amounts deferred under
the Director Deferral Plan generally are payable in cash as a lump sum, in monthly installments, or a combination of both, as elected
by the director, upon the termination of the director’s service on our Board, the director’s death or such earlier
date as elected by the director. A director participating in the Director Deferral Plan may elect to have his or her deferred compensation
credited to (i) an interest rate account wherein the deferrals accrue interest at a rate equal to the current prime rate minus
1%, or (ii) a stock credit account wherein the deferrals are treated as if invested in our common stock with the account increasing
for dividends paid, and increasing or decreasing in value with changes in our stock price. None of our Independent Directors currently
participate in this plan.
Director Stock-For-Fees Program
Under the Non-Employee Director Stock-for-Fees Program, each of
our Independent Directors may elect to receive all or a portion of their annual retainer and meeting fees in the form of shares
of our common stock in lieu of payment in cash. The election will apply to the elected amount of such fees that would otherwise
be paid in cash, commencing with the fiscal quarter after the election is made. Shares will be issued as soon as practicable after
we pay an ordinary cash dividend to our stockholders following the date that cash director fees for the preceding quarter would
otherwise be payable to the director. The number of shares issued will be determined by dividing the amount of the fees by the
average closing price of our common stock for the 10 trading days immediately preceding the relevant dividend payment date. None
of our Independent Directors currently participate in this program.
Our Executive Officers
 |
Scott M. Brinker, 47, President and Chief Executive Officer
DIRECTOR SINCE: 2022
|
|
| Mr. Brinker has been our President and Chief Executive Officer since October 2022. He previously served as President and Chief Investment Officer from January 2020 until October 2022 and Executive Vice President and Chief Investment Officer from March 2018 until December 2019. Before joining Healthpeak, Mr. Brinker was at Welltower Inc. (NYSE: WELL), a healthcare REIT, from 2001 to 2017, most recently as its Executive Vice President and Chief Investment Officer. He is also an Executive Board Member of Nareit. |
|
| |
|
|
 |
Peter
A. Scott, 44, Chief Financial
Officer |
|
|
Mr. Scott has been our Chief Financial Officer since February
2017. He previously also served as Executive Vice President from February 2017 to July 2021. Prior to joining Healthpeak in February
2017, Mr. Scott served as a Managing Director, Real Estate Banking Group of Barclays, a financial services firm listed on the London
Stock Exchange, from 2014 to 2017. His experience also includes various positions of increasing responsibility at the financial
services firms Credit Suisse from 2011 to 2014, Barclays from 2008 to 2011 and Lehman Brothers from 2002 to 2008.
|
|
| |
|
|
 |
Thomas
M. Klaritch, 66, Chief
Operating Officer |
|
| Mr. Klaritch has been our Chief Operating Officer since September 2017. He previously also served as Executive Vice President, Chief Operating Officer and Chief Development Officer from February 2019 to July 2021, as Executive Vice President and Chief Operating Officer from August 2017 to February 2019, as Executive Vice President – Medical Office Properties from April 2008 to August 2017, and as Senior Vice President – Medical Office Properties from October 2003 to April 2008. Prior to joining Healthpeak, Mr. Klaritch was a founding member and Chief Financial Officer of MedCap Properties LLC, a company that owned, operated and developed healthcare real estate (Healthpeak acquired MedCap Properties LLC in October 2003). He has 41 years of operational and financial management experience in the medical office and hospital sectors. Mr. Klaritch is a Fellow in the Healthcare Financial Management Association. He is also a certified public accountant (inactive). |
|
| |
|
|
 |
Scott
R. Bohn, 45, Chief Development
Officer and Head of Lab |
|
| Mr. Bohn has been our Chief Development Officer and Head of Lab since February 2024, and prior to that, he served as Chief Development Officer and Co-Head of Lab from October 2022 to February 2024. He previously served as Executive Vice President – Co-Head of Life Science from January 2022 until October 2022, as Senior Vice President – Co-Head of Life Science from February 2021 until January 2022, as Senior Vice President – Life Science from January 2019 until February 2021, as Vice President – Life Science Estates from January 2014 until December 2018, and as Director – Life Science Estates from September 2012 until December 2013. Prior to joining Healthpeak, Mr. Bohn held various development, acquisition and leasing positions at Terreno Realty Corporation (NYSE: TRNO) in 2012, D’Aprile Properties from 2009 to 2011, AMB Property Corporation (now Prologis – NYSE: PLD) from 2006 to 2009, RREEF/Deutsche Bank from 2003 to 2006, and LaSalle Bank, from 2002 to 2003. |
|
| |
|
|
 |
Jeffrey
H. Miller, 64, General
Counsel |
|
| Mr. Miller has been our General Counsel since November 2022. He previously served as Executive Vice President – Development from April 2021 to October 2022, as Executive Vice President – Senior Housing from January 2020 to March 2021 and as Senior Vice President – Senior Housing Asset Management from November 2018 to December 2019. Prior to joining Healthpeak, Mr. Miller served as Chief Operating Officer at Welltower, Inc. (NYSE: WELL), a healthcare REIT, from July 2014 to January 2017, and General Counsel from July 2004 to July 2014. He was a partner at the law firm Shumaker, Loop & Kendrick, LLP from 1996 to 2004, where he represented a broad range of clients in corporate and real estate matters. |
|
| |
|
|
 |
Shawn
G. Johnston, 44, Executive
Vice President and Chief Accounting Officer |
|
| Mr. Johnston has been our Executive Vice President and Chief Accounting Officer since February 2019. He previously served as Senior Vice President and Chief Accounting Officer from August 2017 until January 2019. Prior to joining Healthpeak in August 2017, Mr. Johnston served as Vice President – Chief Accounting Officer of UDR, Inc. (NYSE: UDR), a multifamily real estate investment trust, from March 2016 to August 2017, and Vice President – Controller from September 2013 until March 2016. He also served as Interim Principal Financial Officer of UDR from June 2016 through December 2016. From August 2010 to August 2013, Mr. Johnston served as Chief Accounting Officer at American Residential Communities LLC, a residential real estate company. Prior to that, he served in the Ernst & Young LLP Audit Department, specializing in real estate, from October 2002 to August 2010. |
|
| |
|
|
 |
Ankit
B. Patadia, 46, Executive
Vice President and Treasurer – Corporate Finance |
|
| Mr. Patadia has been our Executive Vice President and Treasurer – Corporate Finance since February 2023. He joined Healthpeak in 2010 and has served in a variety of roles, including Senior Vice President and Treasurer – Corporate Finance from February 2019 to January 2023, Vice President and Treasurer from 2018 to 2019, Assistant Treasurer and Vice President – Financial Planning and Analysis from 2017 to 2018 and Assistant Treasurer and Vice President – Capital Markets/Treasury from 2016 to 2017. Prior to joining Healthpeak, Mr. Patadia served as Senior Consultant at Deloitte Consulting from 2004 to 2008. |
|
| |
|
|
 |
Adam
G. Mabry, 39, Chief Investment
Officer |
|
| Mr.
Mabry has been our Chief Investment Officer since October 2022. He previously served as Senior Vice President – Investments
from February 2018 to October 2022 and as Vice President – Corporate Transactions from June 2017 to January 2018. Prior to
joining Healthpeak, Mr. Mabry was a Vice President at The Wolff Company, a fully-integrated real estate private equity firm, where
he focused on executing structured transactions across the multifamily, senior and affordable housing sectors. Prior to that, he
was a Vice President at Barclays in the real estate investment banking group. Mr. Mabry is a Chartered Financial Analyst®
charterholder. |
|
| |
|
|
 |
Lisa
A. Alonso, 47, Executive
Vice President and Chief Human Resources Officer |
|
| Ms. Alonso has been our Executive Vice President and Chief Human Resources Officer since January 2020. She joined Healthpeak in 2014 and served in a variety of roles, including Senior Vice President – Human Resources from February 2018 to December 2019, Vice President – Human Resources from January 2016 to January 2018, Director – Human Resources from April 2015 to December 2015, and Manager – Human Resources from November 2014 to April 2015. Prior to joining Healthpeak, Ms. Alonso served as Director of Human Resources/HR Business Partner at The Irvine Company’s Resort at Pelican Hill from April 2013 to July 2014. Prior to that, she served as Vice President of Human Resources and Director of Recruiting and Training at California First National Bancorp (Nasdaq: CFNB) from February 2003 to March 2013. |
|
| |
|
|

PROPOSAL 02
Approval of 2023 Executive Compensation on an Advisory Basis
| |
 |
FOR |
Our Board recommends a vote FOR approval of 2023 executive compensation
on an advisory basis |
Advisory Resolution
In accordance with the requirements of Section 14A of the Exchange
Act and the related rules of the SEC, stockholders are entitled to cast a nonbinding, advisory vote to approve the compensation
of our NEOs (often referred to as “say-on-pay”). Accordingly, you are being asked to vote on the following resolution
at the Annual Meeting:
RESOLVED, that the stockholders APPROVE, on an advisory
basis, the compensation paid to the NEOs, as disclosed in the proxy statement, which includes the “Compensation Discussion
and Analysis,” the accompanying tables, and the related narrative disclosure, pursuant to the SEC’s executive compensation
disclosure rules.
Our Board recommends that you vote FOR
this resolution because it believes that our executive compensation program supports our compensation objectives and
philosophies, including:
 |
Aligning compensation with stockholder interests and promoting long-term stockholder value creation |
|
Providing a straightforward and transparent compensation program, with rigorous, objective and at-risk performance, including
future relative TSR as a significant component |
|
Attracting, motivating and retaining key employees with outstanding talent and ability |
|
Discouraging excessive risk-taking by balancing short-and long-term compensation with a mix of cash and equity incentives |
|
Paying for performance, with a meaningful portion of compensation tied to the Company’s strategic and financial
goals, with limited fixed or discretionary components |
|
Robust oversight by an independent Board committee |
Voting Standard
This proposal to approve the compensation paid to our NEOs will pass if there is the affirmative
vote of a majority of the votes cast on the proposal at the Annual Meeting. This proposal is advisory only and will not be binding
on, overrule any decision by, or create or imply additional fiduciary duties for, Healthpeak, our Board or the Compensation Committee.
The Compensation Committee, which is responsible for designing and administering our executive compensation program, values the
opinions expressed by stockholders in their vote on this proposal and will consider the outcome of the vote when making future
compensation decisions for NEOs. Our current policy is to provide our stockholders with an opportunity to approve the compensation
of our NEOs each year at the annual meeting of stockholders. It is expected that the next advisory vote on executive compensation
will be held at the 2025 annual meeting of stockholders.
|
Letter from Our Compensation and Human Capital Committee
Dear Stockholders,
As the members of the Compensation and Human Capital Committee,
we are responsible for overseeing the design and implementation of a competitive executive compensation program that furthers the
interests of stockholders and demonstrates strong pay-for-performance alignment. This responsibility includes listening to and
considering your views on executive compensation. We also help oversee management’s efforts to develop and implement a robust
human capital management program.
The Compensation Discussion and Analysis, or CD&A, that follows
describes what we pay, why we pay it and how we made our executive compensation decisions in 2023. Our compensation philosophy
is intended to align the interests of our executives and stockholders through a transparent and rigorous compensation program.
We incentivize our executives by offering a combination of performance-based
and fixed compensation, with a significant portion at risk in the form of performance-based equity awards. The value of these awards
depends upon the value of our common stock, which we believe further aligns executives’ interests with those of our stockholders.
We believe this compensation philosophy also motivates our talented management team, promotes the execution of our business strategy
in a manner that focuses on long-term stockholder value creation, encourages prudent risk management and enhances retention of
our executive team in a competitive marketplace for talent.
The key objectives of our compensation program include:
| • |
Aligning executive compensation with the interests of our stockholders |
| • |
Linking a significant portion of executive compensation to the achievement of key financial and strategic goals |
| • |
Providing a transparent compensation program with objective performance hurdles with a substantial possibility of not
being achieved |
| • |
Evaluating hurdles across multiple metrics and performance periods, including 3-year relative total stockholder return,
or TSR, performance |
| • |
Limiting discretionary compensation components while maintaining flexibility to compensate for individual performance
|
In 2023, base salary increases for our named executive officers
were limited to increases in connection with certain promotions, and we did not increase the target-level opportunities under the
short-term incentive plan (STIP), our annual cash bonus program, except in connection with one promotion. We increased named executive
officers’ target-level long-term incentive plan (LTIP) opportunities in 2023 to better align equity compensation with the
equity compensation of similarly-situated executives at peer companies.
Our executive compensation program payout results reflect our
pay-for-performance philosophy. The objective metrics under our 2023 STIP were achieved at above-target levels, aligning executive
bonus payouts with the Company’s financial, operational and ESG performance. The 2021 LTIP, covering a three-year performance
period of 2021–2023, paid out below target level based on our total stockholder return performance relative to objectively-defined
peer indices, further reinforcing the importance of aligning the management team’s compensation with long-term stockholder
value creation.
We believe that our compensation program provides compelling incentives
for our executives, which in turn benefits our stockholders by driving our business strategy and goals. We also believe our stockholders’
interests are best served over time by a balanced compensation program that takes a long-term, holistic view of our business strategy
and emphasizes the drivers of long-term value creation.
Compensation and Human Capital Committee Report
We reviewed and discussed the CD&A with management, as well
as the Compensation and Human Capital Committee’s independent compensation consultant and legal advisors. Based upon this
review and discussion, we recommended to the Board that the CD&A be included in this proxy statement.
COMPENSATION AND HUMAN CAPITAL COMMITTEE OF THE BOARD OF DIRECTORS
| |
|
|
|
|
|
|
|
|
| |
 |
|
 |
|
 |
|
 |
|
| |
|
|
|
|
|
|
|
|
| |
Sara G. Lewis (Chair)
Independent Chair
|
|
Brian G. Cartwright
Independent Director
|
|
James B. Connor
Independent Director
|
|
Christine N. Garvey
Independent Director
|
|
| |
|
|
|
|
|
|
|
|
| |
|
|
|
|
|
|
|
|
The foregoing report of the Compensation Committee is not soliciting
material, is not deemed filed with the SEC and is not incorporated by reference in any filing of the Company under the Securities
Act of 1933, as amended (the “Securities Act”), or the Exchange Act, whether made before or after the date of this
proxy statement and irrespective of any general incorporation language in such filing.
Compensation Discussion and Analysis
Named Executive Officers
Our CD&A describes Healthpeak’s 2023 executive compensation
program for the named executive officers, or NEOs, listed below.
| |
|
|
|
|
|
|
|
|
|
|
| |
 |
|
 |
|
 |
|
 |
|
 |
|
| |
|
|
|
|
|
|
|
|
|
|
| |
Scott M. Brinker
President and Chief Executive Officer
|
|
Peter A. Scott
Chief Financial Officer
|
|
Thomas M. Klaritch
Chief Operating Officer
|
|
Scott R. Bohn
Chief Development Officer and Head of Lab
|
|
Ankit B. Patadia,
Executive Vice President and Treasurer – Corporate Finance |
|
| |
|
|
|
|
|
|
|
|
|
|
| |
|
|
|
|
|
|
|
|
|
|
2023 Compensation Program Overview
Consistent with our goals of aligning executive and stockholder
interests and appropriately incentivizing our executives, the Compensation and Human Capital Committee, or the Compensation Committee,
adopted a compensation program that incorporates a mix of at-risk incentives and fixed pay designed to accomplish the key objectives
of our executive compensation program. The key objectives of our executive compensation program are outlined in the Letter from
Our Compensation and Human Capital Committee above. In 2023, our compensation program consisted of the following key elements,
as further detailed under “2023 NEO Compensation” below.
Key Compensation Elements
| |
BASE
SALARY |
|
+ |
|
ANNUAL CASH INCENTIVE
OPPORTUNITIES |
|
+ |
|
LONG-TERM EQUITY INCENTIVE
OPPORTUNITIES |
|
| |
• Competitive base salary
to attract and retain talent based on experience, job scope, market data and individual performance
• Annually reviewed
against similarly situated executives at peer companies to maintain competitive levels
|
|
|
|
• Based on the achievement
of objective, at-risk Company performance metrics to align compensation with strategic goals
• Includes objective
financial performance metrics of Normalized FFO per share and Net Debt to Adjusted EBITDAre, which are common REIT performance
measures
• Includes quantitative
and qualitative ESG metrics, underscoring our leadership’s commitments to environmental, social and governance performance
• A portion of the annual
cash incentive, or bonus, is based on individual performance to reward individual initiative, achievements and contributions
and ensure that executives are driving execution of our business strategy
|
|
|
|
• Performance-based
awards and service-based awards with a performance hurdle (granted in the form of restricted stock units or profits interest
units)
• Performance-based
awards earned by achieving 3-year Company TSR performance hurdles relative to constituents in third-party indices and
select healthcare REIT peers, aligning executive compensation with stockholders’ long-term interests and value creation
• Service-based awards
encourage retention by vesting ratably over three years, subject to a performance hurdle requiring achievement of a minimum
Normalized FFO per share threshold in the grant year
|
|
| |
|
|
|
|
|
|
|
|
|
|
| |
2023 Changes: Base salary increases were limited to certain
executive promotions |
|
|
|
2023 Changes: Target-level bonus opportunities remained
flat from 2022 except in connection with certain executive promotions; increased weighting of objective, quantitative metrics
and decreased weighting of individual performance metric |
|
|
|
2023 Changes: Target-level opportunities increased to align
executive pay with similarly-situated executives at peer companies; simplified number of peer indices used to measure relative
TSR |
|
| |
|
|
|
|
|
|
|
|
|
|
Pay-for-Performance Philosophy
Our executive compensation program rewards successful annual performance
and encourages long-term value creation for our stockholders. NEO short-and long-term incentive compensation is subject to rigorous,
objective, at-risk performance hurdles across multiple metrics and performance periods, which the Compensation Committee intends
to incentivize management to drive Company performance and encourage prudent risk management consistent with the Company’s
financial and strategic goals. The below graphics illustrate the mix of 2023 fixed pay (base salary) and at-risk pay incentives
(cash incentive compensation and grant date fair value of equity awards granted during the year), presented at the target level
of performance, for our President and CEO and our other NEOs.

Compensation Practices at a Glance
| STOCKHOLDER-FRIENDLY PRACTICES WE FOLLOW |
PRACTICES WE AVOID |
Align
short-term pay and performance by linking 70% of STIP compensation to objective, quantitative performance hurdles
Align long-term pay and performance by linking 60% of LTIP compensation
to 3-year relative TSR with 1-year post-vesting holding period (other than the settlement of shares in connection with applicable
tax withholding)
Promote retention with 40% of LTIP compensation subject to 3-year
vesting with 1-year post-vesting holding period (other than the settlement of shares in connection with applicable tax withholding)
Cap payout and vesting levels for incentive awards
Provide market-based standardized severance and change-in-control
benefits for executives
Maintain robust stock ownership guidelines and clawback policy
Conduct annual compensation risk assessment
Compensation Committee comprised solely of Independent Directors
Use of an independent compensation consultant
Conduct annual compensation analysis against peer company practices
|
 No individual employment agreements No individual employment agreements
No guaranteed cash incentives, equity compensation or
salary increases for existing NEOs
No new stock option awards to NEOs
No tax gross-up payments on change-in-control or severance
payments or executive perquisites
No pledging or hedging of our securities by directors,
officers or other employees
No single-trigger change in control severance payments
No excessive perquisites or other benefits
No repricing or buyouts of stock options (no outstanding
stock options as of March 2024)
No equity plan evergreen provisions
No equity awards with less than 1-year total vesting
period
|
| |
|
|
|
|
| |
|
|
|
|
|
Say-on-Pay Results
The Compensation Committee considers our say-on-pay vote results
in approving our executive compensation program. The Committee determined to maintain the core structure of our overall executive
compensation program for 2023, taking into account:
• Strong
support demonstrated by our stockholders in our 2023 say-on-pay vote
• Recommendations
of our independent compensation consultant
• Positive
stockholder feedback through outreach efforts
|
|
|

In 2023, over 91% of stockholder votes cast were cast FOR our
2022 executive compensation program, and average support over the last 5 years was 91%
|
|
| |
|
|
|
|
2023 NEO Compensation
The Compensation Committee oversees the design and administration
of our executive compensation program and evaluates these programs against Company performance, competitive practices, legal and
regulatory developments and corporate governance trends. The Committee considers analysis and recommendations from Ferguson Partners
Consulting when making compensation decisions. Additionally, our President and Chief Executive Officer provides feedback to the
Committee with respect to our other executive officers based on individual performance.
 |
|
Scott M. Brinker, President and Chief Executive Officer |
|
| |
2023 TARGET COMPENSATION: $7.8 MILLION
($ MILLIONS)

• No
changes were made to 2023 base salary or the STIP opportunity compared to 2022.
• In
connection with his promotion to President and Chief Executive Officer in October 2022, Mr. Brinker’s 2023 target-level LTIP
opportunity was increased from $2.98 million to $5.9 million to align his equity compensation with the equity compensation of similarly-situated
executives at peer companies.
• The
Compensation Committee established overall compensation for Mr. Brinker, as a new CEO, on the lower end of market practices and
anticipates to increase such compensation in future years assuming a commensurate degree of performance.
|
|
| |
|
|
|
 |
|
Peter A. Scott, Chief Financial Officer |
|
| |
2023 TARGET COMPENSATION: $4.0 MILLION
($ MILLIONS)

• No
changes were made to 2023 base salary or STIP opportunity compared to 2022.
• 2023
target-level LTIP opportunity was increased from $1.75 million to $2.35 million to better align Mr. Scott’s equity compensation
with the compensation of similarly situated executives at peer companies.
|
|
| |
|
|
|
 |
|
Thomas M. Klaritch, Chief Operating Officer |
|
| |
2023 TARGET COMPENSATION: $3.25 MILLION
($ MILLIONS)
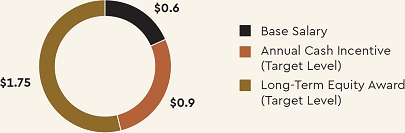
• No
changes were made to 2023 base salary or STIP opportunity compared to 2022.
• 2023
target-level LTIP opportunity was increased from $1.5 million to $1.75 million to better align Mr. Klaritch’s equity compensation
with the compensation of similarly situated executives at peer companies.
|
|
| |
|
|
|
 |
|
Scott R. Bohn, Chief Development Officer and Head of Lab |
|
| |
2023 TARGET COMPENSATION: $2.03 MILLION
($ MILLIONS)
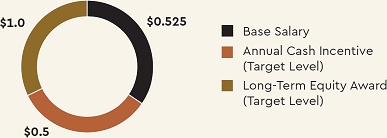
• 2023
base salary was increased from $500,000 to $525,000 in connection with Mr. Bohn’s promotion in October 2022.
• The
Compensation Committee determined not to make changes to Mr. Bohn’s 2023 STIP opportunity or 2023 target-level LTIP opportunity,
noting that promotion-related increases were made to Mr. Bohn’s STIP opportunity and LTIP award opportunity in late 2022,
as disclosed in our proxy statement filed with the SEC in calendar year 2023.
|
|
| |
|
|
|
 |
|
Ankit
B. Patadia, Executive Vice President and Treasurer –
Corporate Finance |
|
| |
2023 TARGET COMPENSATION: $1.33 MILLION (not including promotion
retentive award) ($ MILLIONS)

• Mr.
Patadia’s 2023 base salary, STIP opportunity and target-level LTIP award opportunity were increased in connection with his
promotion to Executive Vice President and Treasurer – Corporate Finance in February 2023. He also received a retentive award
in connection with his promotion as described under “--2023 Long-Term Equity Incentive Compensation.”
|
|
| |
|
|
|
Base Salary
In October 2022 and again in February 2023, the Compensation Committee
reviewed executive compensation data of peer companies prepared by Ferguson Partners Consulting (as described below under “Compensation
Policies and Practices—Peer Company Comparison”). Following this review, the Committee determined to increase the base
salaries for Messrs. Bohn and Patadia in connection with their promotions, based on its review of compensation data for executives
at peer companies with substantially similar roles and responsibilities prepared by Ferguson Partners Consulting (as described
under “Compensation Policies and Practices – Peer Company Comparison”). Mr. Bohn’s 2023 salary was increased
from $500,000 to $525,000 annually, and Mr. Patadia’s 2023 salary was increased from $350,000 to $425,000 annually. No changes
were made to the annual base salary levels for Messrs. Brinker, Scott and Klaritch.
| NAME |
2023 ANNUAL
BASE SALARY ($) |
| Scott M. Brinker |
750,000 |
| Peter A. Scott |
650,000 |
| Thomas M. Klaritch |
600,000 |
| Scott R. Bohn |
525,000 |
| Ankit B. Patadia |
425,000 |
Annual Cash Incentive Compensation
2023 Short-Term Incentive Plan Structure
Our NEOs are eligible to receive annual cash bonuses under the 2023 STIP
based on the achievement of performance criteria established by the Compensation Committee for the performance period and taking into
account individual performance. In selecting metrics and weighting for the 2023 STIP, the Compensation Committee also reviewed the Company’s
strategic focus on portfolio quality, a strong balance sheet, and organic growth complemented by acquisitions and developments, as well
as the importance of ESG to our Company’s business and long-term strategy. Considering these goals, together with feedback from
our stockholders during ongoing engagement and input from Ferguson Partners Consulting, the Committee determined it would be appropriate
to reduce the weighting of the individual performance metric from 40% to 30%, and increase the weighting of the objective financial metrics,
Normalized FFO per share and Net Debt to Adjusted EBITDAre, from 30% to 35% and 15% to 20%, respectively. The Committee approved the following
2023 STIP annual metrics and weighting.
 |
|
35%
Normalized FFO
Per Share |
|
•
Funds from operations (FFO) is
a commonly used REIT financial metric defined by Nareit; Normalized FFO per share is adjusted to exclude the impact from certain non-recurring
or non-comparable items.
•
Allows stockholders to compare
operating performance among REITs over time on a consistent basis.
•
May significantly impact the trading
price of a REIT’s common stock and, therefore, may significantly impact TSR. |
| |
20%
Net Debt to
Adjusted
EBITDAre |
|
•
Net Debt to Adjusted EBITDAre
is a supplemental measure of our achievement of established debt targets and is adjusted to exclude the impact from certain non-recurring
or non-comparable items.
•
Promotes a strong balance sheet
and balances the Normalized FFO per share metric to discourage overleveraging.
•
Reflects the ability to generate
sufficient earnings to meet debt obligations as the portfolio grows.
•
A strong balance sheet is also
important for REITs to enable acquisition and investment opportunities. |
| |
15%
ESG Performance |
|
•
Corporate responsibility through
environmental, social and governance initiatives is important to our Company’s long-term strategy and success.
•
Measures the Company’s performance
on various quantitative and qualitative ESG initiatives as described in detail in the ESG performance scorecard on page 51. |
| |
30%
Individual
Performance |
|
•
Assessment of individual contributions
to the Company’s financial and operational performance, as well as accomplishments relative to annual objectives.
•
Strongly influenced by objective
criteria, such as the quality of the Company’s portfolio and investments, including investment performance relative to underwriting
or budget and other quantitative and qualitative performance metrics and trends as determined by the Compensation Committee.
•
Incentivizes and rewards individual
initiative, achievements and contributions to ensure that executives are driving execution of our business strategy in their respective
roles. |
| |
|
|
|
|
The pre-established target-level performance hurdle for Normalized FFO per
share was set at the mid-point of our initial public guidance for 2023. The pre-established target-level performance hurdle for Net Debt
to Adjusted EBITDAre was set in relation to our internally budgeted expectation, which is not publicly disclosed. The pre-established
performance factors for ESG Performance, as further described below, was set in relation to internal strategic goals and key performance
indicators, and taking external stockholder feedback into account.
2023 STIP Award Opportunities
The Compensation Committee approved NEO 2023 STIP award opportunities in
February 2023, following a review of compensation data for peers with substantially similar roles and responsibilities prepared by Ferguson
Partners Consulting (as described below under “Compensation Policies and Practices—Peer Company Comparison”). The award
opportunities reflect the Committee’s assessment of each NEO’s job position and responsibilities, experience, compensation
peer group data and individual performance. Based on this assessment, the Committee determined to increase the 2023 STIP award opportunity
for Mr. Patadia from $400,000 to $450,000 in connection with his promotion, but not to increase 2023 STIP award opportunities for Messrs.
Brinker, Scott, Klaritch and Bohn.
With respect to each of the performance metrics under the 2023 STIP, reaching
the threshold, target or high achievement level results in a payout of 50%, 100% or 150%, respectively, of the target-level award opportunity.
Payout amounts between threshold, target and high levels are interpolated on a linear basis. No bonus is paid for metrics with outcomes
below the threshold achievement level. The following table reflects the 2023 STIP NEO award opportunities.
| |
|
2023 STIP AWARD OPPORTUNITY ($) |
| NAME |
|
THRESHOLD (50%) |
|
TARGET (100%) |
|
HIGH (150%) |
| Scott M. Brinker |
|
575,000 |
|
1,150,000 |
|
1,725,000 |
| Peter A. Scott |
|
500,000 |
|
1,000,000 |
|
1,500,000 |
| Thomas M. Klaritch |
|
450,000 |
|
900,000 |
|
1,350,000 |
| Scott R. Bohn |
|
250,000 |
|
500,000 |
|
750,000 |
| Ankit B. Patadia |
|
225,000 |
|
450,000 |
|
675,000 |
2023 STIP Performance and Results
| |
|
|
Financial Metrics (55% of Overall Award) |
| |
1 |
|
| |
|
|
STRONG OPERATIONAL PERFORMANCE AND BALANCE SHEET MANAGEMENT
The Compensation Committee sets executive compensation performance hurdles
near the beginning of the performance period consistent with the Company’s strategic goals and in line with our publicly disclosed
initial guidance for the performance year, as applicable, consistent with our past practice.
RELATIVE
WEIGHTING |
|
2023 STIP PERFORMANCE METRIC |
|
THRESHOLD
(50%) |
|
TARGET
(100%) |
|
HIGH
(150%) |
|
OUTCOME
(PAYOUT %) |
 |
|
Normalized FFO Per Share |
|
 |
|
$1.78 (150%) |
 |
|
Net Debt to Adjusted EBITDAre |
|
 |
|
5.2x (150%) |
| Weighted Blended Overall Financial Performance Payout Percentage Relative to Target Level: |
|
150% |
| (1) |
For the definitions and reconciliations of Normalized FFO per share and Net Debt to Adjusted EBITDAre to the most directly comparable GAAP measures, see Appendix A. |
| |
|
|
ESG Performance Metric (15% of Overall Award) |
| |
2 |
|
| |
|
|
STRONG COMMITMENT TO SUSTAINABILITY, PEOPLE-FIRST CULTURE AND LEADING
GOVERNANCE PRACTICES
The Compensation Committee established an ESG performance metric scorecard
with both quantitative and qualitative ESG factors. The Committee selected measurable ESG performance criteria that it determined to be
rigorous yet achievable, and which could be impacted by each NEO’s performance during the period, including: green buildings, diversity and inclusion; employee well-being; and sound corporate governance. Factors were also identified based on key performance indicators
in our ESG program.
ESG PERFORMANCE METRIC SCORECARD
RELATIVE
WEIGHTING |
|
2023 STIP PERFORMANCE METRIC |
|
THRESHOLD |
|
TARGET |
|
HIGH |
|
OUTCOME
(PAYOUT %) |
 |
|
ESG Performance Metric |
|
 |
|
18 points
(150%) |
| |
|
|
Individual
Performance (30% of Overall Award) |
| |
3 |
|
| |
|
|
INDIVIDUAL PERFORMANCE REFLECTS LEADERSHIP AND ACHIEVEMENT
The remaining 30% of the 2023 STIP award was based on an assessment of
individual performance. The Compensation Committee has discretion to award between 0% and 150% of each NEO’s target-level individual
performance award opportunity. The Committee took into account each NEO’s individual accomplishments and leadership, as reflected
in the following 2023 performance scorecards, in determining each NEO’s individual performance award payout under the 2023 STIP.
In determining individual performance, the Committee took into consideration
each NEO’s individual contributions, as described in detail in each NEO’s individual performance scorecard below. The Committee
also noted the NEOs’ overall contributions to factors that were especially important to the Company in 2023, including driving operational
performance and execution, managing balance sheet and liquidity, and continued strategic positioning.
| Scott M. Brinker, |
|
|
| President and Chief Executive Officer |
Individual
Performance Scorecard |
• Despite a challenging macroeconomic
environment, led strong financial and operational performance, including FFO as Adjusted and AFFO at the high end of original guidance
• Oversaw the development of
our updated business strategic plan in the summer of 2023 |
• Led efforts for transformative
strategic combination with Physicians Realty Trust
• Spent extensive time developing
senior leadership team, touring properties and meeting with key investors, tenants and relationships in pursuit of strategic goals
• Executed on key deliverables
for developments, redevelopments and transactions |
Individual Performance Payout:
150% of Target |
| |
|
|
| Peter A. Scott, |
|
|
| Chief Financial Officer |
Individual
Performance Scorecard |
• Developed flexible funding
strategy, including execution of $750 million in bonds at a blended yield of 5.36%
• Maintained strong balance
sheet and financial results, including FFO as Adjusted and AFFO at the high end of original guidance |
• Developed dynamic 3-year
forecast process, enabling updates to outer years every quarter for better planning and decision making
• Maintained strong focus on
investor engagement and marketing efforts, including hosting 19 property tours, attending 14 industry conferences and publishing
four investor presentations |
Individual Performance Payout:
145% of Target |
| |
|
|
| Thomas M. Klaritch, |
|
|
| Chief Operating Officer |
Individual
Performance Scorecard |
• Led efforts with tenants
to maintain strong leasing, rent collections and occupancy in Outpatient Medical segment
• Expanded sustainability initiatives
in Outpatient Medical segment, including 77 LED lighting retrofit projects in tenant spaces and 123 ENERGY STAR certifications |
• Met with health systems in
top markets to identify and pursue relationship expansions
• Oversaw process improvements,
including capturing efficiencies of automation (i.e., budgeting and asset management) and new technologies (i.e., parking
systems, fan wall systems) |
Individual Performance Payout:
145% of Target |
| |
|
|
| Scott
R. Bohn, |
|
|
| Chief Development Officer and Head of Lab |
Individual
Performance Scorecard |
• Advanced Lab entitlement
opportunities, including significant rezoning milestone for Alewife development in Cambridge, MA; and 1.3 million sq. ft. of entitlements
for Vantage development in South San Francisco, CA
• Led progress on
major redevelopment campuses, including design, construction and leasing |
• Led efforts for
Lab lease executions of almost 1 million sq. ft. and maintained solid Lab results, including 2023 Same Store Cash (Adjusted) NOI
growth at midpoint of original guidance
• Oversaw sustainability
initiatives within development and operating portfolio, including submitting for and/or achieving LEED Gold, WELL and Fitwel certifications |
Individual Performance Payout:
130% of Target |
| |
|
|
| Ankit
B. Patadia, |
|
|
| Executive Vice President and Treasurer – Corporate Finance |
Individual
Performance Scorecard |
• Supported flexible
funding strategy, with $750 million in bonds at a blended yield of 5.36%
• Utilized proceeds
from bonds, dispositions and loan repayments to maintain leverage in the low 5x range and net floating rate debt exposure below 10%
target |
• Maintained BBB+/Baa1
credit ratings with stable outlook from S&P/Moody’s
• Developed dynamic
3-year forecast process, enabling rolling updates to outer years for better planning and decision making |
Individual Performance Payout:
145% of Target |
| |
|
|
| |
|
|
Overall
2023 STIP Results |
| |
4 |
|
| |
|
|
The following table summarizes the actual annual incentive awards paid
to each NEO under the 2023 STIP in February 2024 based on the foregoing results and determinations.
| NAME | |
2023 STIP
OPPORTUNITY
(AT TARGET) | |
(55%)
ACTUAL
FINANCIAL
PERFORMANCE(1) | |
(15%)
ACTUAL
ESG
PERFORMANCE(1) | |
(30%)
ACTUAL
INDIVIDUAL
PERFORMANCE | |
OVERALL
WEIGHTED
PAYOUT
(%) | |
TOTAL
AWARD
($) |
| Scott
M. Brinker | |
$1,150,000 | |
150% | |
150% | |
150% | |
150% | |
$1,725,000 |
| Peter A. Scott | |
$1,000,000 | |
150% | |
150% | |
145% | |
149% | |
$1,485,000 |
| Thomas M. Klaritch | |
$ 900,000 | |
150% | |
150% | |
145% | |
149% | |
$1,336,500 |
| Scott R. Bohn | |
$ 500,000 | |
150% | |
150% | |
130% | |
144% | |
$ 720,000 |
| Ankit B. Patadia | |
$ 450,000 | |
150% | |
150% | |
145% | |
149% | |
$ 668,250 |
| (1) |
As a percentage of the target level. |
Long-Term Equity Incentive Compensation
All 2023 equity awards were granted in the form of at-risk service-based
and performance-based equity awards. We have not awarded stock options since 2014.
2023 Long-Term Incentive Plan
Our NEOs received long-term equity incentive awards under the 2023 LTIP,
which are subject to the achievement of performance metrics and vesting criteria established by the Compensation Committee near the beginning
of the performance period. Executives could elect to receive long-term equity incentive awards in the form of restricted stock units or
profits interest units (i.e., equity interests in our operating partnership, Healthpeak OP, LLC, intended to qualify as “profits
interests” for U.S. Federal income tax purposes and convertible into shares of our common stock).
3-Year Relative TSR Performance-Based Awards (60%)
| • |
60% of this award is subject to our relative TSR performance (calculated assuming dividend reinvestment) for
the 3-year forward-looking performance period beginning on January 1, 2023 and ending December 31, 2025 (“TSR-Based LTIP”),
measured against a selected index of healthcare peer REITs and third-party peer indices (MSCI US REIT Index and FTSE Nareit Equity
Office Index, with certain pre-determined index constituent excluded as described below). TSR-Based LTIP awards are subject to a
1-year post-vesting holding period (other than the settlement of shares in connection with applicable tax withholding). |
| • |
The Compensation Committee selected a relative TSR performance metric as the basis for our performance-based LTIP awards because
it allows stockholders to evaluate our performance compared to our peers and mitigates the impact of broad market trends that are
not reflective of our actual performance. The Committee also determined to replace the S&P 500 REIT Index (used in 2022 LTIP
awards) with the MSCI US REIT Index, with certain exclusions as described below, to better measure our performance against a broader
range of REITs. |
| • |
Payout amounts between threshold or target, and target and high levels are interpolated. No value is paid for metrics with outcomes
below the threshold achievement levels. |

| RESULT |
|
ABSOLUTE MEAN TSR PERFORMANCE HURDLES(3) |
|
PAYOUT
(% OF GRANT AT TARGET) |
| Threshold |
|
25% Below Peer Group Mean (Median)(3) |
|
0% |
| Target |
|
At Peer Group Mean (Median)(3) |
|
100% |
| High |
|
25% or Higher Above Peer Group Mean (Median)(3) |
|
200% |
| (1) |
Includes Alexandria Real Estate Equities, Inc.; Healthcare Realty Trust Incorporated; Physicians Realty Trust
(until its announcement of a merger with our Company); and Ventas, Inc. |
| (2) |
Excludes Alexandria Real Estate Equities, Inc. because it is included in the healthcare REIT peer set; REITs with smaller market
capitalization (Office Properties Income Trust; Orion Office REIT, Inc.; City Office REIT, Inc.; Franklin Street Properties Corp.;
Creative Media & Community Trust Corporation; and New York City REIT, Inc. Class A); and Equity Commonwealth due to its
liquidation of assets. |
| (3) |
Compared to the mean performance for the Healthcare REIT Peers and MSCI US REIT Index and median performance for the FTSE Nareit
Equity Office Index. |
3-Year 2023 Retentive Award (40%)
The remaining 40% of the 2023 LTIP awards are service-based awards that
vest in three equal annual installments beginning on the first anniversary of the grant date, subject to achievement of a minimum Normalized
FFO per share hurdle of $1.28 for the 2023 performance year (“Retentive LTIP”). The Compensation Committee believes that the
Retentive LTIP awards, which vest over time independent of TSR, promote the retention of our talented management team, while still incentivizing
a focus on long-term results because the ultimate value of the Retentive LTIP awards is tied to our stock price.
2023 LTIP Award Opportunities
Annual LTIP Awards
As described under “2023 NEO Compensation,” the Compensation
Committee, in consultation with Ferguson Partners Consulting, approved target-level 2023 LTIP opportunities for the NEOs in early 2023,
as well as in connection with the promotion of Mr. Patadia in February 2023. The award opportunities were based on the Committee’s
assessment of peer compensation data prepared by Ferguson Partners Consulting (as described below under “Compensation Policies and
Practices – Peer Company Comparison”), each NEO’s relative duties and responsibilities, and the NEO’s impact on
Healthpeak’s results. Based on this assessment, the Committee determined to increase the 2023 target-level LTIP award opportunities
for each NEO.
The table below reflects the 2023 LTIP award target-level values approved
by the Compensation Committee.
| NAME(1) | |
TOTAL TARGET-LEVEL
LTIP
OPPORTUNITY
($)(2) |
| Scott M. Brinker | |
5,900,000 |
| Peter A. Scott | |
2,350,000 |
| Thomas M. Klaritch | |
1,750,000 |
| Scott R. Bohn | |
1,000,000 |
| Ankit B. Patadia | |
450,000 |
| (1) |
The table above does not reflect retentive LTIP award granted to Mr. Patadia in connection with his promotion
as described below. |
| (2) |
The amounts reflected in the Grants of Plan-Based Awards During 2023 table differ from the amounts above with respect to retentive
LTIP awards due to rounding to the nearest whole share, and with respect to the TSR-Based LTIP awards, due to calculating the grant
date fair value for financial reporting purposes based on a Monte Carlo valuation model in accordance with FASB ASC Topic 718. |
Retentive LTIP Award – Executive Promotion
The Compensation Committee granted Mr. Patadia a one-time Retentive LTIP
award with a grant value of $750,000 in connection with his promotion. A one-time retentive LTIP award was determined to be preferable
to relative TSR performance-based award to promote Mr. Patadia’s long-term retention, with the Retentive LTIP award scheduled to
vest over six years, subject to achievement of a 2023 Normalized FFO per share performance hurdle of $1.28.
Performance Results
The Company exceeded the Normalized FFO hurdle of at least $1.28 per share
for the Retentive LTIP awards granted in February 2023, thereby satisfying the performance hurdle requirement for all Retentive LTIP awards.
The Compensation Committee will make a determination regarding achievement of the TSR-Based LTIP performance criteria following the end
of the performance period on December 31, 2025.
2021-2023 3-Year TSR-Based LTIP Results
In 2021, we awarded the NEOs 3-year TSR-Based LTIP awards that had a performance
period ending on December 31, 2023. The following table summarizes the actual payouts awarded to the NEOs under those awards. Award payouts
were capped at 200%.
RELATIVE
WEIGHTING |
|
2021 LTIP
PERFORMANCE METRIC |
|
THRESHOLD
(50%) |
|
TARGET
(100%) |
|
HIGH
(200%) |
|
OUTCOME
/
PAYOUT (%) |
 |
|
Relative
TSR Performance Healthcare PEER Index (Absolute Comparative Performance)(1) |
|
 |
|
24.9% Below Mean
(18.6%) |
 |
|
Relative TSR Performance S&P 500 REIT Index (Percentile Rank) |
|
 |
|
0th Percentile
(0%) |
| |
|
|
Weighted Blended Overall Payout: |
|
Below Target
(12.4%) |
| (1) |
Peers include Healthcare Realty Trust Incorporated; Healthcare Trust of America, Inc.; Physicians Realty Trust;
Alexandria Real Estate Equities, Inc.; Ventas, Inc.; and Welltower Inc. |
Status of LTIP Award Programs
TSR-BASED LTIP AWARD STATUS THROUGH DECEMBER 31, 2023

| (1) |
The performance period for these awards remains open and the payout percentage for these awards has not been determined. If the
performance period applicable to the award had ended as of December 31, 2023, the Company’s relative TSR ranking considered
for purposes of the award would have resulted in a below-target level payout with respect to certain peer indices. We make no prediction
as to the future performance of our stock. The total amount realized with respect to the outstanding 2022 and 2023 TSR-Based LTIP
awards will be determined following the 3-year performance periods ending December 31, 2024, and 2025, respectively. |
2024 Compensation Decisions
After reviewing the business strategy for 2024, as well as financial, operational
and stock price performance, the Compensation Committee approved the following changes with respect to our executive compensation structure
for 2024:
Compensation Opportunities
No changes were made to base salary levels, target-level STIP award opportunities
or target-level LTIP award opportunities for NEOs in 2024.
2024 STIP
| • |
The performance metrics and weightings are consistent with the 2023 STIP, except that Net Debt to Adjusted EBITDAre was replaced
with a run-rate synergies performance metric tied to our business combination with Physicians Realty Trust. |
| • |
In addition to payout levels at Threshold (50%), Target (100%) and High (150%), an Outperformance payout level (200%) was added,
consistent with the majority of annual incentive programs for executive officers at the peer companies. |
2024 LTIP
| • |
The peer REIT companies against which we measure relative TSR were updated to better reflect companies that we currently consider
to be competitors, and the weightings of each peer set were accordingly adjusted. |
| • |
To better align with peer company practices, we added a non-TSR performance metric, Net Debt to Adjusted EBITDAre, to the performance-based
LTIP award, noting that the relative TSR performance metric remains the primary metric for the performance-based LTIP awards. |
| • |
Net Debt to Adjusted EBITDAre was selected as a performance metric for the 2024 LTIP because it promotes longer-term balance
sheet management. |
Compensation Policies and Practices
Compensation
Risk Assessment |
We believe that any risks arising from our compensation program
are not reasonably likely to have a material adverse effect on us for the reasons outlined below.
Base salaries are fixed in amount and thus do not encourage inappropriate
or excessive risk taking.
Our incentive compensation balances quantitative and qualitative
performance assessments. While the STIP, our annual cash incentive plan, focuses on annual goals, we cap awards under the plan.
The Compensation Committee believes that the STIP appropriately balances risk and the desire to focus executives on specific annual
goals important to our success.
A substantial portion of our executive officers’ compensation
is in the form of equity awards to further align executive and stockholder interests. The Compensation Committee believes that
the LTIP awards do not encourage unnecessary or excessive risk taking because the ultimate value of the awards is tied to our performance
and stock price, and because the awards are subject to long-term vesting schedules based on forward-looking performance goals.
Additionally, our stock ownership guidelines, in addition to the 1-year post-vesting holding requirement for LTIP awards, help
ensure that executives have significant value tied to our performance.
Furthermore, as discussed below, our executive officers are subject
to a clawback policy, which permits us to recover incentive compensation received by such officers in the event the amount of the
payment or award was determined based on the achievement of financial results that were subsequently the subject of an accounting
restatement due to material noncompliance with a financial reporting requirement under securities laws. |
Policy Regarding
Executive
Employment
Agreements |
Our Executive Severance Plan and Executive Change in Control Severance Plan (the “CIC Plan”) (as both are further described under “Potential Payments upon a Termination or Change in Control Severance Arrangements” below) provide severance protections without the use of individual employment agreements with our executive officers. Our severance plans, which operate in lieu of individual contractual arrangements, provide standardized severance benefits for our executives. Our general policy against executive employment agreements also eliminates guaranteed base salaries and incentive levels, which allows the Company to focus on pay for performance and other factors that the Compensation Committee deems relevant in setting executive compensation, without contractual restrictions. |
Compensation
Consultant |
The Compensation Committee is authorized to retain independent
counsel, compensation and benefits consultants, and other outside experts or advisors. Since November 2008, the Committee has retained
Ferguson Partners Consulting as its outside independent compensation consultant. For 2023, Ferguson Partners Consulting advised
the Committee with respect to trends in executive compensation, determination of pay programs, assessment of competitive pay levels
and mix (e.g., proportion of fixed pay to incentive pay and proportion of annual cash pay to long-term incentive pay) and setting
compensation levels. Ferguson Partners Consulting also reviewed comparable equity REITs for 2023 and assisted the Committee with
obtaining and evaluating current executive compensation data for these companies. The Committee made its 2023 compensation decisions,
including those with respect to the NEOs, after consulting with Ferguson Partners Consulting.
Ferguson Partners Consulting reports directly to the Compensation
Committee and works with management as directed by the Committee. During 2023, Ferguson Partners Consulting did not perform work
for Healthpeak other than pursuant to its engagement by the Committee. Its affiliate, Ferguson Partners L.P., was engaged by the
Board in 2022 and early 2023 to assist with a director candidate search. The Committee has assessed the independence of Ferguson
Partners Consulting and concluded that their engagement of Ferguson Partners Consulting does not raise any conflict of interest
with Healthpeak or any of its directors or executive officers.
|
Management
Succession
Planning |
Our Board is responsible for attracting, retaining and incentivizing a high-performing management team. With the assistance of the Compensation Committee, Board reviews management development and our succession plan to help ensure that top management positions, including the CEO position, can be filled without undue interruption. High-potential leaders, including emerging diverse leaders, are given exposure and visibility to Board members through formal presentations at Board and committee meetings, as well as through informal events. |
Compensation
Peer Group |
In developing our 2023 executive compensation program, the Compensation Committee considered market and peer data provided by Ferguson Partners Consulting. Based on Ferguson Partners Consulting’s recommendations, the Committee updated the group of peer companies for 2023 as set forth below. The Committee also reviewed general survey compensation data from companies in the S&P 500 REIT Index when determining executive compensation. As compared to 2022, no changes were made to the peer companies. For 2024, Vornado Realty Trust was removed as a peer and Healthcare Realty Trust Incorporated was added to better align with peers based on market capitalization, revenue and business focus. |
| |
The companies in our 2023 executive compensation peer group were as follows: |
| |
|
| |
• Alexandria Real Estate Equities, Inc. |
• Omega Healthcare Investors, Inc. |
| |
• AvalonBay Communities, Inc. |
• Realty Income Corporation |
| |
• Boston Properties, Inc. |
• Regency Centers Corporation |
| |
• Equity Residential |
• UDR, Inc. |
| |
• Host Hotels & Resorts, Inc. |
• Ventas, Inc. |
| |
• Kimco Realty Corporation |
• Vornado Realty Trust |
| |
• Medical Properties Trust, Inc. |
• Welltower Inc. |
Peer Company
Comparison |
The 2023 compensation peer companies consist of S&P 500 equity REITs that the Compensation Committee
believed are comparable to Healthpeak. In reviewing executive compensation paid by peer companies, the Committee took into
account, among other things, Healthpeak’s enterprise value and market capitalization compared to the median of peer
companies, as shown below: |
| |
|
| |
AS OF DECEMBER 31, 2023* |
| |
(in billions) |
| |
|
| |
 |
| |
* Source: KeyBanc for Enterprise Value; S&P Global for Market Capitalization. |
Compensation
Assessment |
In early 2023, the Compensation Committee reviewed compensation data for executives at peer companies with positions comparable
to those held by each NEO. This data consisted of base salary, annual cash incentive award opportunities and equity award
information, as well as total direct compensation paid by the peer companies. Although the Committee reviewed and discussed
the compensation data provided by Ferguson Partners Consulting to help inform its decision-making process, the Committee does
not set or “benchmark” compensation levels at any specific point or percentile against the peer group data. As
described above, the peer group data is only one point of information taken into account by the Committee in making compensation
decisions. |
| |
|
| |
The Compensation Committee’s executive compensation decisions for 2023 (including with respect to compensation
levels, program design and the determination of executive performance with respect to subjective performance criteria) were
the result of the Committee’s business judgment. This judgment is informed by the experiences of the members of the
Committee, input and peer group data provided by Ferguson Partners Consulting, and the Committee’s overall assessment
of executive compensation trends. Compensation decisions with respect to objective performance criteria were based on actual
performance against the pre-established goals and were not discretionary. |
Stock Ownership
Guidelines |
The Compensation Committee believes that ownership of Healthpeak securities promotes our executives’
focus on our long-term business objectives. Our stock ownership guidelines, which are reviewed by the Committee annually,
provide that executives at the level of executive vice president or higher own minimum levels of common stock and unvested
stock awards. All executives are required to achieve their mandatory holdings within five years of becoming subject to the
guidelines. The following securities are taken into account to determine an executive’s compliance with the guidelines:
shares of our common stock beneficially held (directly or indirectly) by the executive; shares of our common stock or profits
interest units subject to time-based equity awards, whether vested or unvested; and shares of our common stock deferred under
a deferred compensation plan. Shares or profits interest units subject to performance-based equity awards are not taken into
account unless and until the applicable performance-based vesting requirements are satisfied. |
| |
EXECUTIVE |
STOCK OWNERSHIP AS
MULTIPLE OF BASE SALARY |
| |
CEO |
10x |
| |
Other NEOs |
6x |
| |
Executive Officers (Non-NEOs) |
3x |
| |
Compliance with the ownership guidelines is tested annually on May 15. As of the annual testing date of May 15, 2023, all of our NEOs who are subject to the stock ownership guidelines satisfied the ownership requirements. |
| Clawback Policy |
We maintain an executive compensation clawback policy regarding the adjustment or recovery of certain incentive awards or payments made to current or former executive officers in the event that we are required to prepare an accounting restatement due to material noncompliance with any financial reporting requirement under the U.S. securities laws. In general, the policy provides that, unless an exception applies, we will seek to recover compensation that is awarded to an executive officer based on the Company’s attainment of a financial metric during the three-year period prior to the fiscal year in which the restatement occurs, to the extent such compensation exceeds the amount that would have been awarded based on the restated financial results. |
Anti-Hedging
Policy |
Our Board recognizes that hedging against losses in Healthpeak securities may disturb the alignment between the interests of our officers and directors and those of our other stockholders. For this reason, directors, officers and other employees (and if applicable, their family members) are prohibited from purchasing financial instruments (including prepaid variable forward contracts, equity swaps, collars and exchange funds), or otherwise engaging in transactions, that hedge or offset, or are designed to hedge or offset, any decrease in the market value of Healthpeak securities. |
Anti-Pledging
Policy |
Our Board recognizes that a forced margin sale or foreclosure sale of Healthpeak securities may negatively impact our stock price or violate our insider trading policy. Accordingly, our Board adopted a policy that prohibits directors, officers and other employees (and if applicable, their family members) from holding Healthpeak securities in a margin account or pledging Healthpeak securities as collateral for a loan. |
No Tax Gross Up
Payments |
None of our NEOs are entitled to tax gross-up payments on severance benefits or in the event they are subject to excise taxes imposed under Sections 280G and 4999 of the Internal Revenue Code of 1986, as amended (the “Code”) as a result of a change in control of the company. |
Tax Deductibility
of Executive
Compensation |
Section 162(m) of the Code generally limits the deductibility
of compensation paid to our current and former executive officers that exceeds $1 million during the tax year. The Tax Cuts and
Jobs Act of 2017 (the “Jobs Act”) made substantial changes to Section 162(m) of the Code. Pursuant to the Jobs Act,
certain awards granted before November 2, 2017, that were based upon attaining pre-established performance measures that were set
by the Compensation Committee under a plan approved by our stockholders, as well as amounts payable to former executives pursuant
to a written binding contract that was in effect on November 2, 2017, may qualify for an exception to the $1 million deductibility
limit.
As one of the factors in its consideration of compensation matters,
the Compensation Committee notes this deductibility limitation. However, the Committee generally has the flexibility to take any
compensation-related actions that it determines are in the Company’s and its stockholders’ best interest, including
designing and awarding compensation for our executive officers that is not fully deductible for tax purposes. In addition, we qualify
as a REIT under the Code and are not subject to federal income taxes, meaning that the payment of compensation that is not deductible
under Section 162(m) does not have a material adverse consequence to us as long as we qualify as a REIT under the Code. Furthermore,
there can be no assurance that any compensation will in fact be deductible.
|
Executive Compensation Tables
Summary Compensation Table—2023
The Summary Compensation Table below quantifies the different
forms of compensation earned by or awarded to our NEOs for 2023, 2022 and 2021, in the manner and format required under applicable
SEC rules.
NAME AND PRINCIPAL
POSITION(S) |
|
YEAR |
|
SALARY
($) |
|
BONUS
($) |
|
STOCK
AWARDS
($)(1) |
|
OPTION
AWARDS
($) |
|
NON-EQUITY
INCENTIVE PLAN
COMPENSATION
($) |
|
CHANGE IN
PENSION
VALUE AND
NONQUALIFIED
DEFERRED
COMPENSATION
EARNINGS
($) |
|
ALL OTHER
COMPENSATION
($)(2) |
|
TOTAL
($) |
| (a) |
|
(b) |
|
(c) |
|
(d) |
|
(e) |
|
(f) |
|
(g) |
|
(h) |
|
(i) |
|
(j) |
| Scott M. Brinker |
|
2023 |
|
750,000 |
|
— |
|
5,204,310 |
|
— |
|
1,725,000 |
|
— |
|
13,200 |
|
7,692,510 |
| President and Chief Executive Officer |
|
2022 |
|
750,000 |
|
— |
|
3,134,399 |
|
— |
|
1,660,485 |
|
— |
|
12,200 |
|
5,557,084 |
| |
2021 |
|
750,000 |
|
— |
|
2,663,454 |
|
— |
|
1,725,000 |
|
— |
|
11,600 |
|
5,150,054 |
| Peter A. Scott |
|
2023 |
|
650,000 |
|
— |
|
2,072,983 |
|
— |
|
1,485,000 |
|
— |
|
13,200 |
|
4,221,183 |
| Chief Financial Officer |
|
2022 |
|
650,000 |
|
— |
|
2,001,834 |
|
— |
|
1,443,900 |
|
— |
|
12,200 |
|
4,107,934 |
| |
|
2021 |
|
650,000 |
|
— |
|
1,623,499 |
|
— |
|
1,500,000 |
|
— |
|
11,600 |
|
3,785,099 |
| Thomas M. Klaritch |
|
2023 |
|
600,000 |
|
— |
|
1,543,731 |
|
— |
|
1,336,500 |
|
— |
|
13,200 |
|
3,493,431 |
| Chief Operating Officer |
|
2022 |
|
600,000 |
|
— |
|
1,580,387 |
|
— |
|
1,299,510 |
|
— |
|
12,200 |
|
3,492,097 |
| |
|
2021 |
|
600,000 |
|
— |
|
1,522,041 |
|
— |
|
1,350,000 |
|
— |
|
11,600 |
|
3,483,641 |
| Scott R. Bohn |
|
2023 |
|
525,000 |
|
— |
|
882,148 |
|
— |
|
720,000 |
|
— |
|
13,200 |
|
2,141,502 |
| Chief Development Officer and Head of Lab |
|
2022 |
|
461,875 |
|
— |
|
1,447,966 |
|
— |
|
639,481 |
|
— |
|
12,200 |
|
2,561,522 |
| Ankit B. Patadia |
|
2023 |
|
425,000 |
|
— |
|
1,051,236 |
|
— |
|
668,250 |
|
— |
|
13,200 |
|
2,157,686 |
| Executive Vice President and Treasurer – Corporate Finance |
|
|
|
|
|
|
|
|
|
|
|
|
|
|
|
|
|
|
| (1) |
The amounts reported in column (e) for each fiscal year reflect the fair value on the grant date of the time-based and performance-based equity awards granted to NEOs during the fiscal year. For the grant date fair value of each equity award granted to an NEO in 2023, see the Grants of Plan-Based Awards During 2023 table in the proxy statement. These values have been determined under the principles used to calculate the grant date fair value of equity awards for purposes of our consolidated financial statements. For a discussion of the assumptions and methodologies used to value the awards reported in column (e), see the discussion of stock awards contained in Note 14—Compensation Plans to Healthpeak’s Consolidated Financial Statements, included in our Annual Report. As to TSR-Based LTIP performance awards granted to NEOs, the grant date fair value of the awards included in column (e) for the year of grant was determined using a Monte Carlo simulation, which probability weights multiple potential outcomes as of the grant date of the award. The assumptions made in applying the Monte Carlo simulation to determine the grant date fair value of the awards granted in 2023, 2022 and 2021 included: the closing price of a share of Healthpeak common stock on the grant date of $26.05, $32.17 and $30.94, respectively; expected share price volatility assumption of 33.0%, 38.9% and 39.1%, respectively; and a risk-free annual interest rate assumption of 4.38%, 1.8% and 0.2%, respectively. Under the terms of the TSR-Based LTIP performance awards, between 0% and 200% of target of the underlying performance-based restricted stock units (or the corresponding profits interest units subject to the Replacement Awards (as defined below), as the case may be) subject to the awards may vest based on performance for the applicable performance period. The following table presents the grant date fair values of performance-based awards (i) determined under the principles used to calculate the grant date fair value of equity awards for purposes of our consolidated financial statements using the Monte Carlo simulation, and (ii) assuming that the highest level of performance conditions would be achieved using our closing stock price on the grant date, without regard to the Monte Carlo simulation: |
| |
|
|
2023
($) |
|
2022
($) |
|
2021
($) |
| |
NAME |
|
GRANT
DATE FAIR
VALUE (BASED
ON MONTE
CARLO
SIMULATION) |
|
GRANT
DATE FAIR
VALUE (BASED
ON MAXIMUM
PERFORMANCE) |
|
GRANT DATE FAIR
VALUE (BASED
ON MONTE CARLO
SIMULATION) |
|
GRANT DATE FAIR
VALUE (BASED
ON MAXIMUM
PERFORMANCE) |
|
GRANT DATE FAIR
VALUE (BASED
ON MONTE CARLO
SIMULATION) |
|
GRANT DATE FAIR
VALUE (BASED
ON MAXIMUM
PERFORMANCE) |
| |
Scott M. Brinker |
|
3,145,946 |
|
7,080,077 |
|
1,944,335 |
|
3,570,162 |
|
1,613,382 |
|
3,150,063 |
| |
Peter A. Scott |
|
1,253,086 |
|
2,820,121 |
|
1,241,818 |
|
2,280,210 |
|
983,412 |
|
1,920,075 |
| |
Thomas M. Klaritch |
|
933,153 |
|
2,100,099 |
|
980,384 |
|
1,800,169 |
|
921,960 |
|
1,800,089 |
| |
Scott R. Bohn |
|
533,237 |
|
1,200,071 |
|
277,832 |
|
510,152 |
|
— |
|
— |
| |
Ankit B. Patadia |
|
239,973 |
|
540,069 |
|
— |
|
— |
|
— |
|
— |
| (2) |
The 2023 amounts reported in column (i) reflect a 401(k) Plan matching contribution of $13,200 made
on behalf of each NEO in accordance with the terms of our 401(k) Plan. |
Grants of Plan-Based Awards During 2023
The following table presents information regarding the incentive
awards granted to our NEOs during 2023, in the manner and format required under applicable SEC rules.
| |
|
|
|
|
|
|
|
|
|
ALL OTHER AWARDS(1) |
| |
|
|
|
|
|
ESTIMATED FUTURE PAYMENTS
UNDER NON-EQUITY INCENTIVE
PLAN AWARDS |
|
ESTIMATED FUTURE PAYMENTS
UNDER EQUITY INCENTIVE
PLAN AWARDS(1) |
|
STOCK
AWARDS:
NUMBER
OF SHARES
OF STOCK |
|
OPTION
AWARDS:
NUMBER OF
SECURITIES
UNDERLYING |
|
GRANT
DATE FAIR
VALUE OF
STOCK AND
OPTION |
| NAME |
|
|
|
GRANT DATE |
|
THRESHOLD
($) |
|
TARGET
($) |
|
MAXIMUM
($) |
|
THRESHOLD
(#) |
|
TARGET
(#) |
|
MAXIMUM
(#) |
|
OR UNITS
(#) |
|
OPTIONS
(#) |
|
AWARDS
($)(2) |
| (a) |
|
|
|
(b) |
|
(c) |
|
(d) |
|
(e) |
|
(f) |
|
(g) |
|
(h) |
|
(i) |
|
(j) |
|
(k) |
| Scott M. Brinker |
|
Annual Incentive |
|
— |
|
575,000 |
|
1,150,000 |
|
1,725,000 |
|
— |
|
— |
|
— |
|
— |
|
— |
|
— |
| |
|
Retentive |
|
2/15/2023 |
|
— |
|
— |
|
— |
|
— |
|
— |
|
— |
|
90,597 |
|
— |
|
2,360,052 |
| |
|
TSR- Based |
|
2/15/2023 |
|
— |
|
— |
|
— |
|
84,934 |
|
169,868 |
|
339,735 |
|
— |
|
— |
|
3,540,039 |
| Peter A. Scott |
|
Annual Incentive |
|
— |
|
500,000 |
|
1,000,000 |
|
1,500,000 |
|
— |
|
— |
|
— |
|
— |
|
— |
|
— |
| |
|
Retentive |
|
2/15/2023 |
|
— |
|
— |
|
— |
|
— |
|
— |
|
— |
|
36,087 |
|
— |
|
819,897 |
| |
|
TSR- Based |
|
2/15/2023 |
|
— |
|
— |
|
— |
|
33,831 |
|
67,661 |
|
135,323 |
|
— |
|
— |
|
1,253,086 |
| Thomas M. Klaritch
|
|
Annual Incentive |
|
— |
|
450,000 |
|
900,000 |
|
1,350,000 |
|
— |
|
— |
|
— |
|
— |
|
— |
|
— |
| |
|
Retentive |
|
2/15/2023 |
|
— |
|
— |
|
— |
|
— |
|
— |
|
— |
|
26,874 |
|
— |
|
700,068 |
| |
|
TSR- Based |
|
2/15/2023 |
|
— |
|
— |
|
— |
|
25,193 |
|
50,386 |
|
100,773 |
|
— |
|
— |
|
1,050,049 |
| Scott R. Bohn |
|
Annual Incentive |
|
— |
|
250,000 |
|
500,000 |
|
750,000 |
|
— |
|
— |
|
— |
|
— |
|
|
|
|
| |
|
Retentive |
|
2/15/2023 |
|
|
|
|
|
|
|
|
|
|
|
|
|
15,357 |
|
|
|
348,911 |
| |
|
TSR- Based |
|
2/15/2023 |
|
|
|
|
|
|
|
14,396 |
|
28,793 |
|
57,585 |
|
|
|
|
|
533,237 |
| Ankit B. Patadia |
|
Annual Incentive |
|
— |
|
225,000 |
|
450,000 |
|
675,000 |
|
— |
|
— |
|
— |
|
— |
|
— |
|
— |
| |
|
Retentive |
|
2/15/2023 |
|
— |
|
— |
|
— |
|
— |
|
— |
|
— |
|
6,912 |
|
— |
|
157,041 |
| |
|
TSR- Based |
|
2/15/2023 |
|
— |
|
— |
|
— |
|
6,479 |
|
12,958 |
|
25,915 |
|
— |
|
— |
|
239,973 |
| |
|
Retentive |
|
2/15/2023 |
|
|
|
|
|
|
|
|
|
|
|
|
|
28,795 |
|
|
|
654,222 |
| (1) |
Replacement Awards granted to NEOs in connection with the conversion of restricted stock units into
profits interest units did not result in incremental fair value (within the meaning of FASB ASC Topic 718) with respect to
any such Replacement Award, and therefore the Replacement Awards are not reflected in this table. |
| (2) |
The amounts reported in column (k) of the table above have been determined under the principles used to calculate the
grant date fair value of equity awards for purposes of our consolidated financial statements. For a discussion of the assumptions
and methodologies used to value the awards reported in column (k), see the discussion of stock awards contained in Note 14—Compensation
Plans to Healthpeak’s Consolidated Financial Statements, included in our Annual Report, and footnote (1) to the Summary
Compensation Table above. |
Description of Plan-Based Awards
Amended and Restated 2014 Performance Incentive Plan
All 2023 awards reported in the above table were granted under,
and are subject to, the Amended and Restated Performance Incentive Plan, or the 2014 Plan. Following approval of the 2023 Performance
Incentive Plan, or 2023 Plan, by our stockholders on April 27, 2023, no new awards may be granted under the 2014 Plan. The Compensation
Committee administers the 2014 and 2023 Plans and has the authority to interpret its provisions and make all required determinations
thereunder.
Non-Equity Incentive Plan Awards
Our NEOs’ 2023 non-equity (cash) incentive awards reported
in the above table are described under “2023 NEO Compensation—Annual Cash Incentive Compensation” in our CD&A.
Equity Incentive Awards
The Grants of Plan-Based Awards During 2023 table above reflects
the TSR-Based and Retentive LTIP awards granted to our eligible NEOs, as described under “2023 NEO Compensation—Long-Term
Equity Incentive Compensation” in our CD&A. Each TSR-Based or Retentive LTIP Award represents (i) with respect to awards
comprised of restricted stock units, a contractual right to receive one share of our common stock, subject to the applicable time-based
and performance-based vesting requirements, and (ii) with respect to awards comprised of profits interest units, the right to receive
equity interests in our operating partnership, Healthpeak OP, LLC, intended to qualify as “profits interests” for U.S.
Federal income tax purposes and convertible into shares of our common stock.
In connection with our corporate reorganization into a holding
company structure commonly referred to as an Umbrella Partnership Real Estate Investment Trust, or UPREIT, in February 2023, each
NEO elected to convert certain of their outstanding LTIP awards granted to them prior to 2023 into profits interest units (“Replacement
Awards”). Each Replacement Award has equivalent target value, performance conditions (if applicable), vesting schedule and
other terms and conditions as the original award. Such Replacement Awards did not result in any incremental fair value within the
meaning of FASB ASC Topic 718.
2023 3-Year TSR-Based LTIP Awards
The 3-year TSR-Based LTIP awards granted in 2023 cliff vest, if
at all, subject to the achievement of performance criteria (based on forward-looking relative TSR) over a performance period from
January 1, 2023, through December 31, 2025, subject to a 1-year post-vesting holding requirement (other than the settlement of
shares in connection with applicable tax withholding) to promote retention and further align executives’ long-term interests
with those of our stockholders. This 1-year holding requirement will lapse upon death, disability or a qualifying retirement. A
qualifying retirement occurs if an NEO voluntary retires from service on or after the date on which the NEO’s age plus total
years of service equals at least 70, the NEO has attained at least 55 years of age, and the NEO has completed at least five years
of service with the Company. If the employment of an NEO terminates due to death or disability, or if Healthpeak terminates an
NEO without cause, the NEO’s TSR-Based LTIP Awards will remain outstanding during the performance period and the eligible
NEO will receive the number of units earned, if any, had the NEO remained employed with the Company until the end of the performance
period. If the employment of an NEO terminates due to a qualifying retirement, the NEO’s TSR-Based LTIP Awards will remain
outstanding during the performance period and the eligible NEO will receive the number of units earned, if any, had the NEO remained
employed with the Company until the end of the performance period, prorated based on the NEO’s days of service during the
performance period. For each NEO, if there is a change in control of Healthpeak during the performance period, the performance
period for the TSR-Based LTIP Award will be shortened and performance will be determined based on such shortened period and the
number of units underlying the award deemed to have vested based on such shortened period will accelerate and vest in connection
with the change in control.
2023 Retentive LTIP Awards
Retentive LTIP Awards granted in respect of the annual 2023 LTIP
vest in equal installments on the first, second and third anniversaries of the grant date, subject to a performance hurdle related
to Normalized FFO per share for the 2023 performance period of $1.28, which was exceeded. The awards are also subject to a 1-year
post-vesting holding requirement (other than the settlement of shares in connection with applicable tax withholding) to promote
retention and further align executives’ long-term interests with those of our stockholders. This 1-year holding requirement
will lapse upon death, disability or a qualifying retirement. If an NEO’s employment terminates due to death, disability
or a qualifying retirement, if Healthpeak terminates an NEO without cause (whether before or after a change in control of Healthpeak),
or if an NEO terminates employment for good reason (whether before or after a change in control of Healthpeak), the NEO’s
retentive awards will fully vest as of the severance date (with respect to a qualifying retirement, only if the one-year performance
hurdle has been achieved as of the severance date). If a change in control of Healthpeak occurs and outstanding equity awards are
to be terminated in connection with the transaction and not assumed or continued by an acquiring entity, then the outstanding Retentive
LTIP Awards will fully vest in connection with such change in control. Also see the description under “2023 NEO Compensation—Long-Term
Equity Incentive Compensation” with respect to promotion Retentive LTIP Award granted to Mr. Patadia, which vests over six
years.
Other Terms
Vested Retentive and TSR-Based LTIP Awards are payable in an equal
number of shares of our common stock, or if elected by the holder, profits interest units. Payment will generally be made as the
award vests. The NEO does not have the right to vote or dispose of the units or interests underlying the award, but does have the
right to receive dividend equivalents in the form of cash payments (for Retentive LTIP Awards) based on the amount of dividends
paid by Healthpeak during the term of the award on a number of shares equal to the number of outstanding and unpaid units then
subject to the award. Such payments are made concurrently with the related dividends paid to our stockholders. However, dividend
equivalents that would otherwise be paid during the applicable performance period with respect to the TSR-Based LTIP Awards will
instead accrue and be paid at the end of the performance period based on the number of units actually earned if the related threshold
performance requirement for the award is satisfied (and forfeited in whole if the related threshold performance goal is not satisfied).
Outstanding Equity Awards at December 31, 2023
The following table presents, in the manner and format required
under applicable SEC rules, information regarding the outstanding equity awards held by each of our NEOs at December 31, 2023.
| |
|
OPTION AWARDS |
|
STOCK AWARDS |
| NAME |
|
AWARD
GRANT
DATE |
|
NUMBER OF
SECURITIES
UNDERLYING
UNEXERCISED
OPTIONS
EXERCISABLE
(#) |
|
NUMBER OF
SECURITIES
UNDERLYING
UNEXERCISED
OPTIONS
UNEXERCISABLE
(#) |
|
OPTION
EXERCISE
PRICE
($) |
|
OPTION
EXPIRATION
DATE |
|
NUMBER
OF SHARES
OR UNITS
OF STOCK
THAT HAVE
NOT VESTED
(#)(1) |
|
MARKET
VALUE OF
SHARES
OR UNITS
OF STOCK
THAT
HAVE NOT
VESTED
($)(1) |
|
EQUITY
INCENTIVE
PLAN AWARDS:
NUMBER OF
UNEARNED
SHARES,
UNITS OR
OTHER RIGHTS
THAT HAVE
NOT VESTED
(#)(1) |
|
EQUITY
INCENTIVE
PLAN AWARDS:
MARKET OR
PAYOUT VALUE
OF UNEARNED
SHARES, UNITS OR
OTHER RIGHTS
THAT HAVE NOT
VESTED
($)(1) |
| (a) |
|
|
|
(b) |
|
(c) |
|
(d) |
|
(e) |
|
(f) |
|
(g) |
|
(h) |
|
(i) |
| Scott M. Brinker |
|
2/15/2023 |
|
— |
|
— |
|
— |
|
— |
|
90,597 |
(2) |
1,793,821 |
|
— |
|
— |
| |
2/15/2023 |
|
— |
|
— |
|
— |
|
— |
|
— |
|
— |
|
169,868 |
(3) |
3,363,386 |
| |
2/10/2022 |
|
— |
|
— |
|
— |
|
— |
|
24,662 |
(4) |
488,308 |
|
— |
|
— |
| |
|
2/10/2022 |
|
— |
|
— |
|
— |
|
— |
|
— |
|
— |
|
69,362 |
(5) |
1,373,368 |
| |
|
2/12/2021 |
|
— |
|
— |
|
— |
|
— |
|
11,313 |
(6) |
223,997 |
|
— |
|
— |
| |
|
2/12/2021 |
|
— |
|
— |
|
— |
|
— |
|
— |
|
— |
|
6,790 |
(7) |
134,442 |
| |
|
2/12/2021 |
|
— |
|
— |
|
— |
|
— |
|
— |
|
— |
|
— |
(8) |
— |
| |
|
3/1/2018 |
|
— |
|
— |
|
— |
|
— |
|
45,600 |
(9) |
902,880 |
|
— |
|
— |
| Peter A. Scott |
|
2/15/2023 |
|
— |
|
— |
|
— |
|
— |
|
36,087 |
(2) |
714,523 |
|
— |
|
— |
| |
2/15/2023 |
|
— |
|
— |
|
— |
|
— |
|
— |
|
— |
|
67,662 |
(3) |
1,339,708 |
| |
2/10/2022 |
|
— |
|
— |
|
— |
|
— |
|
15,750 |
(10) |
311,850 |
|
— |
|
— |
| |
|
2/10/2022 |
|
— |
|
— |
|
— |
|
— |
|
— |
|
— |
|
44,300 |
(5) |
877,140 |
| |
|
2/12/2021 |
|
— |
|
— |
|
— |
|
— |
|
6,896 |
(11) |
136,541 |
|
— |
|
— |
| |
|
2/12/2021 |
|
— |
|
— |
|
— |
|
— |
|
— |
|
— |
|
4,139 |
(7) |
81,952 |
| |
|
2/12/2021 |
|
— |
|
— |
|
— |
|
— |
|
— |
|
— |
|
— |
(8) |
— |
| Thomas M. Klaritch |
|
2/15/2023 |
|
— |
|
— |
|
— |
|
— |
|
26,874 |
(2) |
532,105 |
|
— |
|
— |
| |
2/15/2023 |
|
— |
|
— |
|
— |
|
— |
|
— |
|
— |
|
50,387 |
(3) |
997,663 |
| |
2/10/2022 |
|
— |
|
— |
|
— |
|
— |
|
12,434 |
(10) |
246,193 |
|
— |
|
— |
| |
|
2/10/2022 |
|
— |
|
— |
|
— |
|
— |
|
— |
|
— |
|
34,974 |
(5) |
692,485 |
| |
|
2/12/2021 |
|
— |
|
— |
|
— |
|
— |
|
6,465 |
(11) |
128,007 |
|
— |
|
— |
| |
|
2/12/2021 |
|
— |
|
— |
|
— |
|
— |
|
— |
|
— |
|
3,881 |
(7) |
76,844 |
| |
|
2/12/2021 |
|
— |
|
— |
|
— |
|
— |
|
— |
|
— |
|
— |
(8) |
— |
| |
|
2/3/2014 |
|
31,759 |
|
— |
|
33.79 |
|
2/3/2024 |
|
— |
|
— |
|
— |
|
— |
| Scott R. Bohn |
|
2/15/2023 |
|
— |
|
— |
|
— |
|
— |
|
15,357 |
(2) |
304,069 |
|
— |
|
— |
| |
2/15/2023 |
|
— |
|
— |
|
— |
|
— |
|
— |
|
— |
|
28,793 |
(3) |
570,101 |
| |
10/26/2022 |
|
— |
|
— |
|
— |
|
— |
|
7,248 |
(12) |
143,510 |
|
— |
|
— |
| |
|
4/28/2022 |
|
— |
|
— |
|
— |
|
— |
|
21,905 |
(13) |
433,719 |
|
— |
|
— |
| |
|
2/10/2022 |
|
— |
|
— |
|
— |
|
— |
|
3,524 |
(10) |
69,775 |
|
— |
|
— |
| |
|
2/10/2022 |
|
— |
|
— |
|
— |
|
— |
|
— |
|
— |
|
9,912 |
(5) |
196,258 |
| |
|
2/12/2021 |
|
— |
|
— |
|
— |
|
— |
|
4,398 |
(6) |
87,080 |
|
— |
|
— |
| |
|
2/3/2014 |
|
1,814 |
|
— |
|
33.79 |
|
2/3/2024 |
|
— |
|
— |
|
— |
|
— |
| Ankit B. Patadia |
|
2/15/2023 |
|
— |
|
— |
|
— |
|
— |
|
6,912 |
(2) |
136,858 |
|
— |
|
— |
| |
2/15/2023 |
|
— |
|
— |
|
— |
|
— |
|
28,795 |
(14) |
570,141 |
|
— |
|
— |
| |
2/15/2023 |
|
— |
|
— |
|
— |
|
— |
|
— |
|
— |
|
12,958 |
(3) |
256,559 |
| |
|
2/10/2022 |
|
— |
|
— |
|
— |
|
— |
|
6,218 |
(10) |
123,116 |
|
— |
|
— |
| |
|
2/12/2021 |
|
— |
|
— |
|
— |
|
— |
|
2,155 |
(11) |
42,669 |
|
— |
|
— |
| (1) |
The number of shares or units reported in column (f) reflect time-vested Retentive LTIP Awards, while
the number of shares or units reported in column (h) reflect performance TSR-Based LTIP Awards, assuming threshold payout
level (50% for restricted stock units, or 25% for profits interest units, which are granted assuming maximum performance),
target payout level (100% for restricted stock units, or 50% for profits interest units) or high (maximum) payout level (200%
for restricted stock units, or 100% for profits interest units), based on how the performance of each such award was tracking
as of December 31, 2023. For awards granted in 2021, reflects the actual payout level for such TSR-Based LTIP Awards determined
after the end of the 2023 fiscal year. See the footnotes below for additional details. The dollar amounts shown in columns
(g) and (i) are determined by multiplying the number of shares or units reported in columns (f) or (h), respectively, by $19.80
(the closing price of our common stock on the last trading day of 2023). |
| (2) |
The unvested portions of this award are scheduled to vest in three equal installments on February 15, 2024, 2025 and 2026. |
| (3) |
Subject to the satisfaction of applicable performance criteria, the unvested portion of this award is scheduled to vest
upon certification of the performance results by the Compensation Committee following the performance period ending December
31, 2025. The number of shares reported is based on the achievement at the target payout level, based on performance tracking
between the threshold and target payout levels as of December 31, 2023. |
| (4) |
The unvested portions of this award are scheduled to vest in two equal installments on February 10, 2024 and 2025. |
| (5) |
This award was originally granted to the NEO on February 10, 2022 and was converted into a Replacement Award on February
15, 2023. Subject to the satisfaction of applicable performance criteria, the unvested portion of this award is scheduled
to vest upon certification of the performance results by the Compensation Committee following the performance period ending
December 31, 2024. The number of shares reported is based on the achievement at the target payout level, based on performance
tracking between the threshold and target payout levels as of December 31, 2023. |
| (6) |
The unvested portion of this award vested on February 12, 2024. |
| (7) |
This award was originally granted to the NEO on February 12, 2021 and was converted into a Replacement Award on February
15, 2023. The unvested portion of this award vested upon certification of the performance results by the Compensation Committee
following the performance period ended December 31, 2023. The number of shares reported is based on actual performance for
the performance period. For additional information on the actual performance and payout of the award, see the “Compensation
Discussion and Analysis” section. |
| (8) |
This award was originally granted to the NEO on February 12, 2021 and was converted into a Replacement Award on February
15, 2023. The unvested portion of this award vested upon certification of the performance results by the Compensation Committee
following the performance period ended December 31, 2023. The number of shares reported is based on actual performance for
the performance period, resulting in the award being forfeited in its entirety for achieving performance below the threshold
level. For additional information on the actual performance and payout of the award, see the “Compensation Discussion
and Analysis” section. |
| (9) |
This award was originally granted to the NEO on March 1, 2018 and was converted into a Replacement Award on February 15,
2023. The unvested portions of this award vested on March 1, 2024. |
| (10) |
This award was originally granted to the NEO on February 10, 2022 and was converted into a Replacement Award on February
15, 2023. The unvested portions of this award are scheduled to vest in two equal installments on February 10, 2024 and 2025. |
| (11) |
This award was originally granted to the NEO on February 12, 2021 and was converted into a Replacement Award on February
15, 2023. The unvested portion of this award vested on February 12, 2024. |
| (12) |
This award was originally granted to the NEO on October 26, 2022 and was converted into a Replacement Award on February
15, 2023. The unvested portions of this award are scheduled to vest in two equal installments on April 28, 2024 and 2025. |
| (13) |
This award was originally granted to the NEO on April 28, 2022 and was converted into a Replacement Award on February
15, 2023. The unvested portions of this award are scheduled to vest in five equal installments on April 28, 2024, 2025, 2026,
2027 and 2028. |
| (14) |
The unvested portions of this award are scheduled to vest in five equal installments on February 15, 2025, 2026, 2027,
2028 and 2029. |
Option Exercises and Stock Vested During 2023
The following table presents information regarding the exercise
of stock options by NEOs during 2023 and the vesting of other equity awards during 2023.
| |
|
OPTION AWARDS |
|
STOCK/EQUITY AWARDS |
| NAME |
|
NUMBER OF
SHARES
ACQUIRED
ON EXERCISE
(#) |
|
VALUE
REALIZED
ON EXERCISE
($) |
|
NUMBER OF
SHARES
ACQUIRED
ON VESTING
(#) |
|
VALUE
REALIZED
ON VESTING
($)(1) |
| (a) |
|
(b) |
|
(c) |
|
(d) |
|
(e) |
| Scott M. Brinker |
|
— |
|
— |
|
117,432 |
|
3,052,096 |
| Peter A. Scott |
|
— |
|
— |
|
64,649 |
|
1,671,829 |
| Thomas M. Klaritch |
|
— |
|
— |
|
44,370 |
|
1,220,641 |
| Scott R. Bohn |
|
— |
|
— |
|
11,437 |
|
286,724 |
| Ankit B. Patadia |
|
— |
|
— |
|
6,917 |
|
183,217 |
| (1) |
The dollar amount shown in column (e) above for stock awards is determined by multiplying the number of shares or profits
interest units, as applicable, that vested by the per share closing price of Healthpeak common stock on the vesting date (or
if not a trading day, the most recent trading day prior to the vesting date). LTIP awards granted to NEOs are subject to a
one-year post-vesting holding period. In addition, Messrs. Brinker, Scott and Bohn vested in profits interest units that were
not immediately convertible into shares of Healthpeak common stock at the time of vesting. |
Potential Payments Upon a Termination or Change in Control
The following section describes the benefits that may become payable
to our NEOs in connection with a termination of their employment with Healthpeak and/or a change in control of Healthpeak. You
should read this section in combination with “Description of Plan-Based Awards—Equity Incentive Awards” above,
which describes the treatment of outstanding equity-based awards held by our NEOs upon a termination or change in control of Healthpeak.
Severance Plans
Executive Severance Plan
We provide competitive severance benefits to attract and retain
key employees with outstanding talent and ability. The Compensation Committee determined that the adoption of the Executive Severance
Plan (“Severance Plan”) in lieu of entering into individual employment agreements with our executives was consistent
with compensation best practices. Severance benefits are appropriate in light of severance protections available to executives
at our peer group companies and are an important component of each executive’s overall compensation as they help us to attract
and retain our key executives who could have other job alternatives that may appear to them to be more attractive absent these
protections. See “Compensation Policies and Practices—Policy Regarding Executive Employment Agreements” in our
CD&A.
The Severance Plan is intended to provide severance benefits to
employees who are selected by the Compensation Committee to participate, including each NEO, upon a termination of employment by
us without “cause” or by the NEO for “good reason” (each as defined in the Severance Plan, as such definitions
may be amended from time to time) other than in circumstances in which the participant would receive benefits under the CIC Plan
(described under “—Executive Change in Control Severance Plan” below), as set forth below. An NEO’s right
to receive benefits under the Severance Plan is subject to his or her execution of a general release of claims against us, and
his or her agreement to post-termination confidentiality, non-solicitation and non-competition restrictive covenants, as applicable.
Payments (or benefits payable) to an NEO under the Severance Plan will, to the extent applicable, either be reduced to avoid excise
taxes under Sections 280G and 4999 of the Code or be paid in full (with the NEO paying any such excise taxes), whichever option
places the NEO in the best after-tax position.
| SEVERANCE BENEFIT |
|
AMOUNT |
| CASH SEVERANCE INSTALLMENT PAYMENTS |
|
3x for CEO (2x for Messrs. Scott, Klaritch and Bohn and 1.5x for Mr. Patadia) the sum of:
Base salary, plus greater of (i) target-level annual cash incentive award for the year of termination
or (ii) average of three prior years’ annual cash incentive awards
|
| LUMP SUM OF ESTIMATED COST OF HEALTHCARE COVERAGE |
|
Cash payment in lieu of COBRA premiums for: |
| |
|
• Three years for CEO |
| |
|
• Two years for Messrs. Scott, Klaritch and Bohn |
| |
|
• Eighteen months for Mr. Patadia |
| ANNUAL CASH INCENTIVE AWARD |
|
Prorated annual incentive award, payable based on actual performance at time award would have been paid if NEO had not
terminated employment, with the individual performance portion to be determined in the Compensation Committee’s discretion |
| SERVICE-BASED EQUITY AWARDS |
|
• Stock options fully vested and remain exercisable for two years (no
stock options remain outstanding as of March 2024) |
| |
|
• Service-based awards continue to vest according to their terms for 24
months, after which any remaining unvested portion will become fully vested |
| PERFORMANCE-BASED EQUITY AWARDS |
|
Continue vesting in accordance with their terms with respect to the performance requirements |
Executive Change in Control Severance Plan
All of our current officers are participants in the CIC Plan.
Under the CIC Plan, if a change in control of Healthpeak occurs during the term of the CIC Plan and a participant’s employment
with Healthpeak is terminated by Healthpeak without cause or by the participant for good reason within the two-year period following
the change in control, the participant will generally be entitled to receive the following benefits:
| SEVERANCE BENEFIT |
|
AMOUNT |
| LUMP SUM CASH SEVERANCE PAYMENT |
|
3x for CEO (2x for Messrs. Scott, Klaritch and Bohn and 1.5x for Mr. Patadia) the sum of:
Base salary, plus greater of (i) target-level annual cash incentive award for the year of termination or (ii) average of three prior years’ annual cash incentive awards |
| LUMP SUM OF ESTIMATED COST OF HEALTHCARE COVERAGE |
|
Cash payment in lieu of COBRA premiums for: |
| |
|
• Three years for CEO |
| |
|
• Two years for Messrs. Scott, Klaritch and Bohn |
| |
|
• Eighteen months for Mr. Patadia |
| ANNUAL CASH INCENTIVE AWARD |
|
Prorated annual incentive award based on the greater of target-level or average of three prior years’ payments |
| RETIREMENT PLAN BENEFITS |
|
• Full vesting of any non-qualified retirement plan benefits |
| |
|
• Cash payment equal to unvested benefits under 401(k) Plan |
| SERVICE-BASED EQUITY AWARDS |
|
Full vesting; options remain exercisable for two years (no stock options remain outstanding as of March 2024) |
| PERFORMANCE-BASED EQUITY AWARDS |
|
Continue vesting in accordance with their terms with respect to the performance requirements, unless otherwise noted in the award agreement as described below under “Change-in-Control Benefits (Assuming No Employment Termination)” |
For these purposes, the terms “cause,” “good
reason” and “change in control” are each defined in the CIC Plan, as such definitions may be amended from time
to time.
A participant’s right to receive benefits under the CIC
Plan is subject to the execution of a release of claims in favor of Healthpeak upon the termination of the participant’s
employment. Participants are also subject to an indefinite confidentiality covenant and post-termination non-solicitation and non-competition
restrictive covenants under the CIC Plan for the duration of the severance payout period, as applicable and enforceable. Participants
in the CIC Plan are not entitled to tax gross-ups under the CIC Plan or any other agreement with the Company.
Estimated Severance and Change-in-Control Benefits
Severance Benefits (No Change in Control)
The following table presents our estimate of the amount of the
benefits to which the NEOs would have been entitled had their employment terminated under the indicated circumstances pursuant
to the terms of the Severance Plan on December 31, 2023. The chart assumes that the executive would not be entitled to receive
the benefits provided under the CIC Plan in connection with such a termination of employment.
| | |
TERMINATION BY HEALTHPEAK WITHOUT CAUSE | |
TERMINATION DUE TO EXECUTIVE’S
DEATH OR DISABILITY |
| NAME | |
CASH
SEVERANCE
($)(1) | |
CONTINUATION
OF HEALTH/
LIFE BENEFITS
($)(2) | |
EQUITY
ACCELERATION
($)(3) | |
TOTAL
($) | |
CASH
SEVERANCE
($) | |
CONTINUATION
OF HEALTH
BENEFITS
($)(2) | |
EQUITY
ACCELERATION
($)(3) | |
TOTAL
($) |
| Scott M. Brinker | |
8,156,866 | |
123,979 | |
8,280,182 | |
16,561,027 | |
— | |
— | |
8,280,182 | |
8,280,182 |
| Peter A. Scott | |
5,209,270 | |
52,928 | |
3,461,698 | |
8,723,897 | |
— | |
— | |
3,461,698 | |
3,461,698 |
| Thomas M. Klaritch | |
4,718,343 | |
37,983 | |
2,673,282 | |
7,429,609 | |
— | |
— | |
2,673,282 | |
2,673,282 |
| Scott R. Bohn | |
2,770,000 | |
82,653 | |
1,804,493 | |
4,657,146 | |
— | |
— | |
1,804,493 | |
1,804,493 |
| Ankit B. Patadia | |
1,980,750 | |
43,932 | |
1,129,343 | |
3,154,024 | |
— | |
— | |
1,129,343 | |
1,129,343 |
| (1) |
As described above under “—Severance Plans—Executive Severance
Plan” and as quantified in this column, the Severance Plan provides for a cash severance payment in the event of a qualifying
termination of employment based on a multiple of base salary and annual cash incentive. For purposes of the Severance Plan,
the annual cash incentive component of the severance payment is based on the greater of such individual’s target-level
annual cash incentive award in effect on the date of termination or the average of the prior three years’ annual cash incentive
awards. Additionally, the Severance Plan provides for the payment of a pro-rated annual cash incentive amount for the year
of termination, which, assuming a termination on December 31, 2023, would have resulted in the following awards (based on
actual performance for the performance period): Mr. Brinker, $1,725,000; Mr. Scott, $1,485,000; Mr. Klaritch, $1,336,500;
Mr. Bohn, $720,000; and Mr. Patadia, $668,250. |
| (2) |
These amounts represent the amounts that would be paid to the individual for the estimated
aggregate cost of the premiums that would be charged to each individual to continue health coverage pursuant to COBRA for
such individual and his eligible dependents (to the extent that such dependents were receiving health benefits prior to the
individual’s termination date) for the period of coverage set forth above. |
| (3) |
These columns report the intrinsic value of the unvested portions of the executive’s
equity awards that would accelerate in the circumstances described above. For service-based awards, this value is calculated
by multiplying $19.80 (the closing price of our common stock on the last trading day of 2023) by the number of units subject
to the portion of the award that would have accelerated. We have included the value related to accelerated vesting of awards
in the table above assuming the performance-based vesting requirements were satisfied at target levels, and for 2021 performance-based
awards, based on actual performance as of December 31, 2023. |
Retirement Benefits
Under our retirement policy, equity awards granted in 2023 will
vest upon an NEO’s qualifying retirement. A qualifying retirement occurs if an NEO voluntary retires from service on or after
the date on which the NEO’s age plus total years of service equals at least 70, the NEO has attained at least 55 years of
age, and the NEO has completed at least five years of service with the Company. Retentive LTIP awards vest in full upon a qualifying
retirement if the performance hurdle has been satisfied, while performance-based awards vest based on actual performance, prorated
for the NEO’s service during the performance period. Mr. Klaritch is the only NEO who would have satisfied retirement eligibility
in 2023. Assuming his qualifying retirement on December 31, 2023, the value of the unvested portions of his 2023 equity awards
that would have accelerated in connection with such a qualifying retirement (calculated using a price per share of $19.80, which
is the closing price of our common stock on the last trading day of 2023) is $1,529,753. Equity awards granted in 2021–2022
do not include provisions for accelerated vesting in the event of an NEO’s retirement.
Change-in-Control Benefits (Assuming No Employment Termination)
As described above under “Description of Plan-Based Awards—2023
3-Year LTIP Awards,” if we undergo a change in control during the performance period applicable to outstanding TSR-Based
LTIP Awards granted to the NEOs, the performance period for such TSR-Based LTIP Awards will be shortened and performance will be
determined based on the shortened period. The number of units deemed to have vested based on the shortened period will accelerate
and vest in connection with the change in control. In this scenario, the TSR-Based LTIP Awards would vest without regard to whether
the NEO terminates employment in connection with the change in control. Upon a change in control of Healthpeak, Retentive LTIP
Awards held by NEOs would continue to be subject to service-based vesting in accordance with the terms of the awards and would
only accelerate upon a termination of an NEO’s employment as described under “Change-in-Control Severance Benefits
in Connection with Employment Termination” below.
Assuming that a change in control of Healthpeak occurred on December
31, 2023, the values of the unvested portions of the TSR-Based LTIP Awards held by each NEO that would have accelerated in connection
with such change in control (calculated using a price per share of $19.80, which is the closing price of our common stock on the
last trading day of 2023) are as follows: (1) $4,871,176 for Mr. Brinker; (2) $2,298,785 for Mr. Scott; (3) $1,766,977 for Mr.
Klaritch; (4) $766,339 for Mr. Bohn; and (5) $256,559 for Mr. Patadia.
Change-in-Control Severance Benefits in Connection with Employment
Termination
The following table presents our estimate of the benefits to which
each of the NEOs would have been entitled had a change in control of the Company occurred on December 31, 2023, and the executive’s
employment with us had terminated under the circumstances described above on such date (before any excise-tax reduction under our
CIC Plan described above or under the executive’s applicable equity award agreement).
| NAME | |
CASH
SEVERANCE
($)(1) | |
CONTINUATION
OF HEALTH/LIFE
BENEFITS
($)(2) | |
EQUITY
ACCELERATION
($)(3) | |
TOTAL
($) |
| Scott M. Brinker | |
8,156,866 | |
123,979 | |
3,409,006 | |
11,689,851 |
| Peter A. Scott | |
6,140,338 | |
66,160 | |
1,162,913 | |
7,369,411 |
| Thomas M. Klaritch | |
5,563,804 | |
47,479 | |
906,305 | |
6,517,589 |
| Scott R. Bohn | |
3,282,500 | |
103,316 | |
1,038,154 | |
4,423,970 |
| Ankit B. Patadia | |
2,418,250 | |
58,576 | |
872,784 | |
3,349,610 |
| (1) |
As described above under “—Severance Plans—Executive Change in Control Severance
Plan” and as quantified in this column, the CIC Plan provides for a cash severance payment in the event of a qualifying
termination of employment. Additionally, the CIC Plan provides for the payment of a pro-rated annual cash incentive amount
for the year of termination, which, assuming a termination on December 31, 2023, would have resulted in the following awards
(based on actual performance for the performance period): Mr. Brinker, $1,725,000; Mr. Scott, $1,485,000; Mr. Klaritch, $1,336,500;
Mr. Bohn, $720,000; and Mr. Patadia, $668,250. |
| (2) |
These amounts represent the amounts that would be paid to the individual for the estimated aggregate cost of the premiums
that would be charged to each individual to continue health coverage pursuant to COBRA for such individual and his eligible
dependents (to the extent that such dependents were receiving health benefits prior to the individual’s termination
date) for the period of coverage set forth above. |
| (3) |
See footnote (3) to the preceding table under “—Severance Benefits” for the manner of calculating equity
acceleration value. All outstanding Retentive LTIP Awards held by an NEO as of December 31, 2023, would accelerate upon a
termination of the NEO’s employment by the Company without cause or by the NEO for good reason upon or following a change
in control of Healthpeak or if the awards were to be terminated (and not assumed or continued) in connection with a change
in control of Healthpeak. See TSR-Based LTIP Award values (disclosed under “Change-in-Control Benefits (Assuming no
Employment Termination)”) that would vest on a change in control regardless of whether the NEO terminates employment. |
Pay Ratio
The following pay ratio and supporting information compares the
annual total compensation of our President and CEO and the annual total compensation of our employees other than our President
and CEO, as required by Section 953(b) of the Dodd-Frank Act. The pay ratio is a reasonable estimate calculated in a manner consistent
with Item 402(u) of Regulation S-K.
For 2023, our last completed fiscal year:
| • |
The annual total compensation of our median employee was $238,548; and |
| • |
The annual total compensation of our President and CEO, as reported in the Summary Compensation
Table, was $7,692,510. |
| • |
Based on the foregoing, the estimated ratio of the annual total compensation of our President
and CEO to the annual total compensation of our median employee was approximately 32:1. To determine the pay ratio, we took
the steps outlined below. |
| • |
We determined that as of December 31, 2023, our employee population (excluding our President
and CEO) consisted of 200 individuals, all of whom were located in the United States. This population consists of our full-time
and temporary employees. We did not have any seasonal employees. We excluded independent contractors, as well as interns and
employees who terminated employment prior to December 31, 2023. |
| • |
To identify the median employee, we computed each employee’s annual compensation
consisting of annual base salary as well as all cash bonuses and the grant date value of equity awards granted during the
year, as applicable. For these purposes, we annualized the base salary and cash bonuses of employees who did not work for
us for the entire year, other than temporary employees. We did not make any cost of living adjustments. |
| • |
Once we identified our median employee, we calculated that employee’s
annual total compensation for 2023 in accordance with the requirements of the SEC’s rules for calculating the “total”
compensation of each of our NEOs for 2023 for purposes of the Summary Compensation Table above. With respect to our CEO, we
used the amount reported as total compensation in the Summary Compensation Table. Any adjustments, estimates and assumptions
used to calculate our CEO’s total annual compensation are described in the footnotes to the Summary Compensation Table. |
This pay ratio is an estimate calculated in a manner consistent
with SEC rules based on the methodology described above. The SEC rules for identifying the median compensated employee and calculating
the pay ratio based on that employee’s annual total compensation allow companies to adopt a variety of methodologies, apply
certain exclusions and make reasonable estimates and assumptions. As such, the pay ratio reported by other companies may not be
comparable to our pay ratio, as other companies may have different employment and compensation practices and may utilize different
methodologies, exclusions, estimates and assumptions in calculating their own pay ratios.
Pay-Versus-Performance Table
The following summarizes the relationship between our CEO’s,
and our other Named Executive Officers’, total compensation paid and our financial performance for the fiscal years shown
in the table (in this discussion, our CEO is also referred to as our principal executive officer or “PEO”, and our
Named Executive Officers other than our CEO are referred to as our “Non-PEO NEOs”).
| | |
| | |
| | |
| | |
| | |
AVERAGE
SUMMARY | | |
| | |
VALUE OF INITIAL
FIXED $100
INVESTMENT
BASED ON: | | |
| | |
| |
| YEAR | |
SUMMARY
COMP. TABLE
TOTAL
FOR CEO
(MR. BRINKER)(1)(2) | | |
COMP.
ACTUALLY
PAID TO
CEO
(MR. BRINKER)(3) | | |
SUMMARY
COMP. TABLE
TOTAL
FOR
FORMER CEO
(MR. HERZOG)(1)(2) | | |
COMP.
ACTUALLY
PAID TO
FORMER CEO
(MR. HERZOG)(3) | | |
COMP.
TABLE
TOTAL
PAID TO
NON-PEO
NEOs(1)(2) | | |
AVERAGE
COMP.
ACTUALLY
PAID TO
NON-PEO
NEOs(3) | | |
HEALTH-
PEAK
TOTAL
STOCK-
HOLDER
RETURN(4) | | |
PEER
TOTAL
STOCK-
HOLDER
RETURN(4) | | |
NET
INCOME
(IN MILLIONS)(5) | | |
NORMALIZED
FFO PER
SHARE(6) | |
| 2023 | |
$ | 7,692,510 | | |
$ | 2,500,263 | | |
$ | — | | |
$ | — | | |
$ | 3,003,451 | | |
$ | 1,549,751 | | |
$ | 65.39 | | |
$ | 112.04 | | |
$ | 334.8 | | |
$ | 1.78 | |
| 2022 | |
$ | 5,557,084 | | |
$ | 2,901,565 | | |
$ | 24,308,605 | | |
$ | 19,680,747 | | |
$ | 3,267,762 | | |
$ | 1,959,250 | | |
$ | 82.79 | | |
$ | 100.62 | | |
$ | 516.4 | | |
$ | 1.73 | |
| 2021 | |
$ | — | | |
$ | — | | |
$ | 11,713,883 | | |
$ | 17,200,186 | | |
$ | 3,767,688 | | |
$ | 5,579,450 | | |
$ | 114.23 | | |
$ | 134.06 | | |
$ | 525.9 | | |
$ | 1.60 | |
| 2020 | |
$ | — | | |
$ | — | | |
$ | 11,374,615 | | |
$ | 9,884,943 | | |
$ | 3,389,595 | | |
$ | 2,905,009 | | |
$ | 92.31 | | |
$ | 94.88 | | |
$ | 428.3 | | |
$ | 1.60 | |
| (1) |
In accordance with applicable SEC rules, since Mr. Brinker and Mr. Herzog each
served as PEO during covered fiscal years, they are each included in the table above and the footnotes that follow the table
as a PEO for the fiscal years in which they served in such capacity. For each of 2020 and 2021, our Non-PEO NEOs were Messrs.
Brinker, Scott, Klaritch and McHenry. For 2022, our Non-PEO NEOs were Messrs. Scott, Klaritch, Bohn, Mabry and McHenry. For
2023, our Non-PEO NEOs were Messrs. Scott, Klaritch, Bohn and Patadia. |
| (2) |
See the Summary Compensation Table above, and the Summary Compensation Table as disclosed
in our proxy statement filed with the SEC in calendar year 2023, for detail on the Summary Compensation Table total compensation
for each CEO for each fiscal year covered in the table. The average compensation for the Non-PEO NEOs for 2023 was calculated
from the Summary Compensation Table above. The average compensation for the Non-PEO NEOs for each of 2022, 2021 and 2020 was
calculated from the Summary Compensation Table as disclosed in our Proxy Statement filed with the SEC in calendar year 2023,
2022 or 2021, respectively. |
| (3) |
For purposes of this table, the compensation actually paid (also referred to as “CAP”)
to each of our NEOs (including, for purposes of this table, former executive officers who are included in the Non-PEO NEO
group for 2020, 2021, 2022 and 2023) means each NEO’s total compensation as reflected in the Summary Compensation Table
for the applicable fiscal year and adjusted for the following:
•
Less the amounts reported in the “Stock Awards” columns of the
Summary Compensation Table for the applicable fiscal year based on the grant date fair value of such awards;
•
Plus the fiscal year-end value of Healthpeak stock awards granted in the covered fiscal
year that were outstanding and unvested at the end of the covered fiscal year;
•
Plus/(less) the change in value as of the end of the covered fiscal year as compared to
the value at the end of the prior fiscal year for Healthpeak stock awards that were granted in prior fiscal years and were
outstanding and unvested at the end of the covered fiscal year;
•
Plus the vesting date value of Healthpeak stock awards that were granted and vested during
the same covered fiscal year;
•
Plus/(less) the change in value as of the vesting date as compared to the value at the
end of the prior fiscal year for Healthpeak stock awards that were granted in prior fiscal years and vested in the covered
fiscal year;
•
Less, as to any Healthpeak stock awards that were granted in prior fiscal years that were
forfeited during the covered fiscal year, the value of such awards as of the end of the prior fiscal year; and
•
Plus the dollar value of any dividends or other earnings paid during the covered fiscal
year on outstanding and unvested Healthpeak stock awards to the extent not reflected in the grant date fair values of the
awards.
|
No stock options were granted, and no unvested stock options were
outstanding, during the applicable fiscal years. There were no material modifications to any stock awards during the applicable
fiscal years.
In making each of these adjustments, the “value” of
a stock award is the fair value of the award on the applicable date determined in accordance with FASB ASC Topic 718 using the
valuation assumptions we then used to calculate the fair value of our equity awards. For more information on the valuation of our
equity awards, see the notes to our financial statements that appear in our Annual Report on Form 10-K each fiscal year and the
footnotes to the Summary Compensation Table that appears in our annual Proxy Statement.
The table above reflects the CAP (determined as noted above) for
each CEO and, for our Non-PEO NEOs, the average of the CAPs determined for the Non-PEO NEOs for each of the fiscal years shown
in the table.
The following table provides a reconciliation of the Summary Compensation
Table Total to Compensation Actually Paid for Mr. Brinker.
RECONCILIATION OF SUMMARY COMPENSATION TABLE TOTAL TO
COMPENSATION ACTUALLY PAID FOR CEO (MR. BRINKER) | |
FISCAL YEAR
2023 ($ | ) | |
FISCAL YEAR
2022 ($ | ) | |
FISCAL YEAR
2021 ($) | | |
FISCAL YEAR
2020 ($) | |
| Summary Compensation Table Total | |
| 7,692,510 | | |
| 5,557,084 | | |
| — | | |
| — | |
| Grant Date Fair Value of Stock Awards Granted in Fiscal Year | |
| (5,204,310 | ) | |
| (3,134,399 | ) | |
| — | | |
| — | |
| Fair Value at Fiscal Year-End of Outstanding and Unvested Stock Awards Granted in Fiscal Year | |
| 2,997,838 | | |
| 2,541,379 | | |
| — | | |
| — | |
| Change in Fair Value of Outstanding and Unvested Stock Awards Granted in Prior Fiscal Years | |
| (2,282,005 | ) | |
| (2,232,034 | ) | |
| — | | |
| — | |
| Fair Value at Vesting of Stock Awards Granted in Fiscal Year That Vested During Fiscal Year | |
| — | | |
| 402,297 | | |
| — | | |
| — | |
| Change in Fair Value as of Vesting Date of Stock Awards Granted in Prior Fiscal Years For Which Applicable Vesting Conditions Were Satisfied During Fiscal Year | |
| (960,951 | ) | |
| (445,419 | ) | |
| — | | |
| — | |
| Fair Value as of Prior Fiscal Year-End of Stock Awards Granted in Prior Fiscal Years That Failed to Meet Applicable Vesting Conditions During Fiscal Year | |
| — | | |
| — | | |
| — | | |
| — | |
| Dividends Paid on Outstanding and Unvested Stock Awards | |
| 257,182 | | |
| 212,657 | | |
| — | | |
| — | |
| Compensation Actually Paid | |
| 2,500,263 | | |
| 2,901,565 | | |
| — | | |
| — | |
The following table provides a reconciliation of the
average of the Summary Compensation Table Total for the Non-PEO NEOs for a fiscal year to the average of the Compensation
Actually Paid for the Non-PEO NEOs for that fiscal year.
RECONCILIATION OF AVERAGE SUMMARY COMPENSATION TABLE TOTAL TO
AVERAGE COMPENSATION ACTUALLY PAID FOR NON-PEO NEOS | |
FISCAL YEAR
2023 ($ | ) | |
FISCAL YEAR
2022 ($ | ) | |
FISCAL YEAR
2021 ($) | | |
FISCAL YEAR
2020 ($) | |
| Summary Compensation Table Total | |
| 3,003,451 | | |
| 3,267,762 | | |
| 3,767,688 | | |
| 3,389,595 | |
| Grant Date Fair Value of Stock Awards Granted in Fiscal Year | |
| (1,387,525 | ) | |
| (1,535,477 | ) | |
| (1,718,594 | ) | |
| (1,849,445 | ) |
| Fair Value at Fiscal Year-End of Outstanding and Unvested Stock Awards Granted in Fiscal Year | |
| 822,314 | | |
| 1,087,331 | | |
| 2,004,500 | | |
| 1,509,955 | |
| Change in Fair Value of Outstanding and Unvested Stock Awards Granted in Prior Fiscal Years | |
| (671,242 | ) | |
| (368,699 | ) | |
| 1,104,314 | | |
| (640,251 | ) |
| Fair Value at Vesting of Stock Awards Granted in Fiscal Year That Vested During Fiscal Year | |
| — | | |
| 103,198 | | |
| 249,639 | | |
| 354,058 | |
| Change in Fair Value as of Vesting Date of Stock Awards Granted in Prior Fiscal Years For Which Applicable Vesting Conditions Were Satisfied During Fiscal Year | |
| (292,301 | ) | |
| (132,238 | ) | |
| 59,047 | | |
| (17,412 | ) |
| Fair Value as of Prior Fiscal Year-End of Stock Awards Granted in Prior Fiscal Years That Failed to Meet Applicable Vesting Conditions During Fiscal Year | |
| — | | |
| (516,184 | ) | |
| — | | |
| — | |
| Dividends Paid on Outstanding and Unvested Stock Awards | |
| 75,053 | | |
| 53,557 | | |
| 112,856 | | |
| 158,509 | |
| Compensation Actually Paid | |
| 1,549,751 | | |
| 1,959,250 | | |
| 5,579,450 | | |
| 2,905,009 | |
| (4) |
Healthpeak TSR represents cumulative total stockholder return on a fixed investment
of $100 in our common stock for the period beginning on the last trading day of 2019 through the end of the applicable fiscal
year, and is calculated assuming the reinvestment of dividends before consideration of income taxes. Peer total stockholder
return represents cumulative total stockholder return on a fixed investment of $100 in the Equity REIT Index of Nareit for
the period beginning on the last trading day of 2019 through the end of the applicable fiscal year, and is calculated assuming
the reinvestment of dividends before consideration of income taxes. |
The following chart illustrates our TSR for each of the
last three fiscal years against our TSR and the TSR for the Equity REIT Index of Nareit (each calculated as described above)
over that period of time.

The following chart illustrates the CAP for each CEO and the average
CAP for our Non-PEO NEOs for each of the last four fiscal years against our TSR and the TSR for the Equity REIT Index of Nareit
(each calculated as described above) over that period of time.

| (5) |
This column shows Healthpeak’s net income for each fiscal year covered
by the table. The following chart illustrates the CAP for each CEO and the average CAP for our Non-PEO NEOs for each of the
last four fiscal years against our net income for each of those years. |

| (6) |
This column shows Healthpeak’s Normalized FFO per share for each fiscal
year covered by the table. We consider Normalized FFO per share to be a key metric in our executive compensation program;
see the Compensation Discussion and Analysis section of this proxy statement for more information regarding the use of this
performance measure. The following chart illustrates the CAP for each CEO and the average CAP for our Non-PEO NEOs for each
of the last four fiscal years against our Normalized FFO per share for each of those years. |

Following is an unranked list of our financial performance measures
we consider most important in linking the compensation actually paid to our NEOs for 2023 with our performance.
| • |
Normalized FFO per share (used in our 2023 STIP and Retentive LTIP awards) |
| • |
Net Debt to Adjusted EBITDAre (used in our 2023 STIP) |
| • |
Relative TSR (used in our TSR-Based LTIP awards) |
In addition to the financial performance measures listed above,
we view our stock price, upon which the value of all of our LTIP awards is dependent, as a key performance-based component of our
executive compensation program in order to further align the interests of our senior management team with the interests of our
stockholders.
Equity Compensation Plan Information
The following table sets forth, for each of the Company’s
equity compensation plans, the number of shares of common stock subject to outstanding awards, the weighted average exercise price
of outstanding options and the number of shares remaining available for future award grants as of December 31, 2023.
| PLAN CATEGORY | |
NUMBER OF
SECURITIES TO
BE ISSUED UPON
EXERCISE OF
OUTSTANDING
OPTIONS,
WARRANTS AND
RIGHTS | |
WEIGHTED
AVERAGE
EXERCISE PRICE
OF OUTSTANDING
OPTIONS,
WARRANTS AND
RIGHTS
($) | |
NUMBER OF SECURITIES
REMAINING AVAILABLE
FOR FUTURE ISSUANCE
UNDER EQUITY
COMPENSATION
PLANS (EXCLUDING
SECURITIES REFLECTED
IN COLUMN (A)) |
| | |
(a) | | |
(b) | | |
(c) | |
| Equity compensation plans approved by security holders | |
| 3,071,586 | (1) | |
| 33.79 | (2) | |
| 30,771,272 | (3) |
| Equity compensation plans not approved by security holders | |
| N/A | | |
| N/A | | |
| N/A | |
| Total | |
| 3,071,586 | | |
| 33.79 | | |
| 30,771,272 | |
| (1) |
Of these shares, 222,601 were subject to outstanding stock options, 1,969,786
were subject to profits interest units (including outstanding performance-based profits interest unit awards, which are presented
at their maximum level of achievement), and 879,199 were subject to outstanding restricted stock units (including outstanding
performance-based stock units, which are presented at their target level of performance). |
| (2) |
This weighted average exercise price does not reflect 1,969,786 shares that could be issued
in connection with profits interest units (including outstanding performance-based profits interest unit awards, which are
presented at their maximum level of achievement), and 879,199 shares that could be issued in connection with restricted stock
units (including outstanding performance-based stock units, which are presented at their target level of performance). |
| (3) |
Of the aggregate number of shares that remained available for issuance as of December 31,
2023, all were available under the 2023 Plan. Subject to certain express limits of the 2023 Plan, shares available for award
purposes under the plan generally may be used for any type of award authorized under that plan including options, stock appreciation
rights and other forms of awards granted or denominated in shares of our common stock including, without limitation, stock
bonuses, restricted stock, restricted stock units, and performance-based stock units, as well as shares denominated in profits
interest units. |
Security Ownership of Principal Stockholders, Directors and
Management
The following table sets forth certain information as of March 5, 2024 (unless otherwise indicated) regarding the beneficial
ownership, as that term is defined in Rule 13d-3 under the Exchange Act, of shares of our common stock by: (i) each person known
to beneficially own more than 5% of our outstanding common stock; (ii) each director and nominee for election as director; (iii) each
of the NEOs; and (iv) all current directors and executive officers as a group. This table is based on Company records and information
supplied to us by our executive officers, directors and principal stockholders or included in a Schedule 13G, or an amendment
thereto, filed with the SEC with respect to shares of our common stock. With respect to the principal stockholders, the following
table does not reflect beneficial ownership of any additional shares that such stockholders may have acquired upon the closing
of our merger with Physicians Realty Trust on March 1, 2024. The following table also does not include certain LTIP Units, which,
regardless of their vesting schedules, are subject to a 14-month holding period following their grant date or cancellation and
replacement date, as applicable.
| | |
SHARES BENEFICIALLY OWNED(1)(2) | |
| NAME OF BENEFICIAL OWNER | |
NUMBER
OF SHARES | |
NUMBER OF
OPTIONS/
RSUS/
PROFITS
INTEREST
UNITS(3) | |
PERCENT
OF CLASS(4) |
| Greater than 5% Stockholders | |
| | |
| | |
| |
The Vanguard Group, Inc. and affiliates(5)
100 Vanguard Boulevard
Malvern, PA 1 9355 | |
| 87,756,738 | | |
| — | | |
| 16.04 | % |
BlackRock, Inc.(6)
50 Hudson Yards
New York, NY 10001 | |
| 57,105,438 | | |
| — | | |
| 10.40 | % |
State Street Corporation(7)
State Street Financial Center
1 Congress Street, Suite 1
Boston, MA 02114 | |
| 41,217,077 | | |
| — | | |
| 7.53 | % |
| Directors | |
| | | |
| | | |
| | |
| Scott M. Brinker(8) | |
| 183,588 | | |
| — | | |
| * | |
| Katherine M. Sandstrom | |
| 27,212 | | |
| 8,193 | | |
| * | |
| John T. Thomas(9) | |
| 827,229 | | |
| — | | |
| * | |
| Brian G. Cartwright | |
| 45,321 | | |
| 8,193 | | |
| * | |
| James B. Connor | |
| 10 | (10) | |
| 8,193 | | |
| * | |
| Christine N. Garvey | |
| 27,885 | (11) | |
| 8,193 | | |
| * | |
| R. Kent Griffin, Jr. | |
| 52,026 | | |
| 8,193 | | |
| * | |
| David B. Henry | |
| 76,717 | | |
| 8,193 | | |
| * | |
| Pamela J. Kessler(12) | |
| 32,822 | | |
| — | | |
| * | |
| Sara G. Lewis | |
| 43,319 | (13) | |
| 8,193 | | |
| * | |
| Ava E. Lias-Booker | |
| 10,329 | | |
| — | | |
| * | |
| Governor Tommy G. Thompson(14) | |
| 112,581 | | |
| — | | |
| * | |
| Richard A. Weiss | |
| 49,493 | | |
| — | | |
| * | |
| Named Executive Officers | |
| | | |
| | | |
| | |
| Peter A. Scott | |
| 164,339 | | |
| — | | |
| * | |
| Thomas M. Klaritch | |
| 336,900 | | |
| — | | |
| * | |
| Scott R. Bohn | |
| 18,625 | | |
| — | | |
| * | |
| Ankit B. Patadia | |
| 6,115 | | |
| — | | |
| * | |
| All current directors and executive officers as a group (21 persons) | |
| 2,096,846 | | |
| 57,351 | | |
| * | |
| * |
Less than 1% |
| (1) |
Except as otherwise noted and subject to applicable community property laws, each individual
has sole voting and investment power with respect to the shares listed. |
| (2) |
Does not include profits interest units to acquire equity interests in Healthpeak OP, LLC
beneficially owned by such person that are not exchangeable into Healthpeak common stock within 60 days of March 5, 2024. |
| (3) |
For the Independent Directors, consists of shares represented by unvested RSU awards that
will vest within 60 days of March 5, 2024. |
| (4) |
Unless otherwise indicated, based on 709,577,429 shares outstanding
as of March 5, 2024. In addition, for purposes of computing the percentage of shares held by an individual, the number of shares
outstanding includes shares represented by unvested RSUs that will vest within 60 days of March 5, 2024, profits interest units
that can be convertible into shares of our common stock within 60 days of March 5, 2024, or upon the individual’s qualified
retirement, but, in each case, such shares are not included in the number of shares outstanding for purposes of computing the
percentage of shares held by any other person. |
| (5) |
Share and beneficial ownership information for The Vanguard Group, Inc. (“Vanguard”)
is given as of December 29, 2023, and was obtained from a Schedule 13G/A filed on February 13, 2024, with the SEC. According
to the Schedule 13G/A, Vanguard has shared voting power over 1,140,280 shares, sole dispositive power over 84,952,851 shares
and shared dispositive power over 2,803,887 shares of our common stock. The Schedule 13G/A states that Vanguard’s clients
have the right to receive or the power to direct the receipt of dividends from, or the proceeds from the sale of, our common
stock but that no one other person’s interest in our common stock is more than 5% of the total outstanding common shares. |
| (6) |
Share and beneficial ownership information for BlackRock, Inc. (“BlackRock”)
is given as of December 31, 2023, and was obtained from a Schedule 13G/A filed on January 24, 2024, with the SEC. According
to the Schedule 13G/A, BlackRock has sole voting power over 51,668,427 shares and sole dispositive power over 57,105,438 shares
of our common stock. The Schedule 13G/A states that various persons have the right to receive or the power to direct the receipt
of dividends from or the proceeds from the sale of our common stock, but that no one person’s interest in our common
stock is more than 5% of the total outstanding common shares. |
| (7) |
Share and beneficial ownership information for State Street Corporation (“State Street”)
is given as of December 31, 2023, and was obtained from a Schedule 13G/A filed on January 30, 2024, with the SEC. According
to the Schedule 13G/A, State Street has shared voting power over 25,905,284 shares and shared dispositive power over 41,140,742
shares of our common stock. |
| (8) |
Mr. Brinker is also an NEO. |
| (9) |
Includes 4,274 shares held by accounts for the benefit of Mr. Thomas’s children,
and 67,400 shares subject to a legacy margin loan that existed prior to the Physicians Realty Trust merger and will be paid
off in full following the closing of the merger. |
| (10) |
Consists of shares held in spouse’s trust. |
| (11) |
Consists of shares held in a family trust. |
| (12) |
Includes 20,875 shares held in a family trust, 200 shares held in an individual retirement
account and 2,547 shares held by spouse’s individual retirement account. |
| (13) |
Includes 22,000 shares held in a trust and 3,000 shares held in an individual retirement
account. |

PROPOSAL 03
Ratification of Appointment of
Independent Registered Public
Accounting Firm
| |
|
FOR |
Our Board recommends a vote FOR
ratification of the appointment of Deloitte & Touche LLP as our independent registered public accounting firm for
2024 |
Auditor Evaluation and Appointment
Our Audit Committee is responsible for the appointment, compensation,
retention and oversight of the Company’s independent registered public accounting firm that audits the Company’s financial
statements and internal control over financial reporting. The Audit Committee has appointed Deloitte & Touche LLP, or
Deloitte, to continue to serve as Healthpeak’s independent registered public accounting firm for the year ending December
31, 2024. Deloitte has served as Healthpeak’s independent registered public accounting firm since March 3, 2010. A representative
of Deloitte is expected to attend the Annual Meeting and will have an opportunity to make a statement and be available to respond
to appropriate questions.
The Audit Committee annually reviews Deloitte’s performance
and independence in deciding whether to engage a different independent registered public accounting firm. In the course of these
reviews, the Audit Committee considers, among other things:
 |
Deloitte’s independence from the Company and management, including any
factors that may impact Deloitte’s objectivity |
|
Deloitte’s qualifications and capability in handling all aspects of the Company’s
operations |
|
The desired balance of Deloitte’s experience and fresh perspective occasioned by
mandatory audit partner rotation |
|
The experience, qualifications and performance of our existing audit engagement team |
|
Any issues raised by the Public Company Accounting Oversight Board’s (“PCAOB”)
most recent quality control review of Deloitte |
|
The quality and candor of Deloitte’s communications with the Audit Committee and
management |
|
Deloitte’s quality control procedures |
|
The quality and effectiveness of Deloitte’s historical and recent audit plans and
performance on our audit |
|
The advisability and potential impact of appointing a different independent public accounting
firm |
Voting Standard and Board Recommendation
We are asking our stockholders to vote FOR ratification
of the appointment of Deloitte as our independent registered public accounting firm for 2024. Ratification requires the affirmative
vote of a majority of the votes cast on this proposal at the Annual Meeting. Although ratification is not required by our organizational
documents or otherwise, our Board is submitting the appointment of Deloitte to our stockholders as a matter of good corporate
governance.
If the appointment is not ratified, the Audit Committee will
consider whether it is appropriate to appoint another independent registered public accounting firm. Even if the appointment is
ratified, the Audit Committee, in its discretion, may appoint a different independent registered public accounting firm at any
time during the year if the Audit Committee determines that such a change would be in the best interests of the Company. |
Following its review, the Audit Committee believes that Deloitte’s
continued engagement as our independent registered public accounting firm is in the best interests of the Company for the following
reasons:
| |
|
|
|
|
| |
EXPERIENCE AND EFFECTIVENESS
Enhanced audit quality. Through years of experience,
Deloitte has gained significant institutional knowledge of our business and operations, accounting policies and practices,
and internal control over financial reporting.
Effective audit plans and efficient fee structures. Deloitte’s knowledge of our business
and control framework enables it to design effective audit plans that cover key risk areas while capturing cost efficiencies in
audit scope and internal control testing.
Maintaining continuity avoids disruption. Bringing
on a new auditor, without reasonable cause, would require extensive education and a significant period of time for the
new auditor to reach a comparable level of knowledge and familiarity with our business and control framework.
|
|
STRONG INDEPENDENCE CONTROLS
Thorough Audit Committee oversight. The Audit
Committee believes that any concerns with Deloitte’s tenure are mitigated by the Audit Committee’s oversight,
which includes ongoing engagement with Deloitte and a comprehensive annual review process.
Robust pre-approval policies and limits on non-audit
services. The Audit Committee must pre-approve all audit and non-audit services performed by Deloitte, including the
types of services to be provided and the estimated fees relating to those services.
Deloitte’s strong internal independence procedures
and regulatory framework. Deloitte conducts periodic internal quality reviews of its audit work and rotates lead partners
every five years. Deloitte is also subject to PCAOB inspections, peer reviews, and PCAOB and SEC oversight.
|
|
| |
|
|
|
|
| |
|
|
|
|
Audit and Non-Audit Fees
The following table shows information about the respective fees
billed by Deloitte during or related to the fiscal years ended December 31, 2023 and 2022 (in thousands):
| |
|
|
2023 |
|
2022 |
| Audit Fees(1) |
|
$ |
3,540 |
|
$ 2,704 |
| Audit-Related Fees(2) |
|
|
239 |
|
445 |
| Tax Fees: |
|
|
|
|
|
| Tax Compliance(3) |
|
|
787 |
|
694 |
| Tax Planning and Tax Advice(4) |
|
|
1,047 |
|
735 |
| All Other Fees |
|
|
— |
|
— |
| Total |
|
$ |
5,613 |
|
$ 4,578 |
| (1) |
Audit fees include fees and out-of-pocket expenses billed for the audit of
our annual consolidated financial statements and internal control over financial reporting, the review of interim consolidated
financial statements included in our Quarterly Reports on Form 10-Q, and other SEC registration statement and consent services.
Audit fees for 2023 include fees related to the merger with Physicians Realty Trust. |
| (2) |
Audit-related fees primarily relate to, among other things, fees for the separate audits
of certain of our consolidated subsidiaries and certain accounting consultations. |
| (3) |
Tax compliance fees primarily involve the preparation or review of tax returns. |
| (4) |
Tax planning and tax advice fees encompass a diverse range of services, including tax advice
related to acquisitions and investments, consultation regarding the impact of proposed actions/activities on REIT qualification,
and consultation regarding the foreign, federal, state, and local tax matters related to various transactions. Tax planning
and tax advice fees for 2023 include fees related to the merger with Physicians Realty Trust. |
Policy on Pre-Approval of Audit and Permitted Non-Audit Services
Pursuant to its charter and good corporate governance practices,
the Audit Committee must pre-approve all audit and permitted non-audit services performed by Deloitte and all related fees. The
Audit Committee has delegated its preapproval authority to its Chair, provided that the Chair presents any pre-approvals related
to audit and permitted non-audit services to the Audit Committee at its next scheduled meeting. The Audit Committee considered
whether the provision of proposed non-audit services by Deloitte to the Company was compatible with maintaining the audit firm’s
independence and concluded that Deloitte’s independence was not compromised by the provision of such services and pre-approved
all services provided by Deloitte in 2023 and 2022.
Audit Committee Report
The Audit Committee currently consists of four members: Messrs.
Griffin (Chair), Connor and Henry and Ms. Garvey. The Board has determined that all Audit Committee members are independent under
applicable NYSE and SEC rules and that Messrs. Griffin, Connor and Henry and Ms. Garvey are financial experts. The Audit Committee
has certain duties and powers as described in its written charter adopted by the Board. A copy of the charter can be found on the
Company’s website at healthpeak.com/esg/governance.
The Audit Committee oversees the Company’s financial reporting
process on behalf of the Board. Management has the primary responsibility for establishing and maintaining adequate internal financial
controls, preparing the financial statements and the public reporting process. Deloitte, the Company’s independent registered
public accounting firm for 2023, is responsible for expressing opinions on the conformity of the Company’s audited consolidated
financial statements with U.S. generally accepted accounting principles (GAAP) and on the Company’s internal
control over financial reporting.
In fulfilling its oversight responsibilities, the Audit Committee
has reviewed and discussed with management and Deloitte the audited consolidated financial statements for the fiscal year ended
December 31, 2023, Deloitte’s evaluation of the Company’s internal control over financial reporting, significant accounting
policies and practices, and management judgments and estimates. The Audit Committee has discussed with Deloitte the matters required
to be discussed by the applicable requirements of the PCAOB and the SEC. The Audit Committee also received the written disclosures
and the letter from Deloitte required by applicable requirements of the PCAOB regarding Deloitte’s communications with the
Audit Committee concerning independence. In addition, the Audit Committee has discussed with Deloitte any relationships that may
impact its objectivity and independence and satisfied itself as to Deloitte’s independence.
Based on the Audit Committee’s review of the audited consolidated
financial statements and the review and discussions described in the foregoing paragraph, the Audit Committee recommended to the
Board that the audited consolidated financial statements for the fiscal year ended December 31, 2023, be included in the Annual
Report, as filed with the SEC.
Audit Committee of the Board of Directors
| |
|
|
|
|
|
| |
 |
 |
 |
 |
|
| |
R. Kent Griffin,
Jr. (Chair)
Independent Director |
James B. Connor
Independent Director |
Christine N. Garvey
Independent Director |
David B. Henry
Independent Director |
|
| |
|
|
|
|
|
| |
|
|
|
|
|
The foregoing report of the Audit Committee is not soliciting
material, is not deemed filed with the SEC and is not incorporated by reference in any filing of the Company under the Securities
Act or the Exchange Act, whether made before or after the date of this proxy statement and irrespective of any general incorporation
language in such filing.
Additional Information about the Annual Meeting
Voting at the Annual Meeting
General Information
Stockholders of record of our common stock as of the close of
business on March 5, 2024, the record date for the Annual Meeting, are entitled to notice of and to vote at the Annual Meeting.
As of the close of business on the record date, there were 709,577,429 shares of our common stock outstanding and eligible to
vote at the Annual Meeting. There is no other class of voting securities outstanding. Each share of common stock entitles its
holder to one vote at the Annual Meeting. To have a quorum at the Annual Meeting, the holders of a majority of the shares of our
common stock outstanding and entitled to vote at the Annual Meeting must be present or represented by proxy.
Voting Standard, Board Recommendations and
Effect of Abstentions and Broker Non-Votes
AGENDA
ITEM | |
DESCRIPTION | |
PAGE
NUMBER | |
BOARD
RECOMMENDATION | |
VOTE
REQUIREMENT
FOR APPROVAL | |
EFFECT
OF ABSTENTIONS | |
EFFECT
OF BROKER
NON-VOTES |
| 01 | |
Proposal to elect
the eleven director nominees | |
12 | |
FOR | |
Majority of votes cast | |
No effect | |
No effect |
| 02 | |
Proposal to approve, on an advisory basis, the compensation of our named executive officers | |
41 | |
FOR | |
Majority of votes cast | |
No effect | |
No effect |
| 03 | |
Proposal to ratify the appointment of Deloitte & Touche LLP as our independent registered public accounting firm for the fiscal year ending December 31, 2024 | |
76 | |
FOR | |
Majority of votes cast | |
No effect | |
None expected |
Abstentions will be counted as present and entitled to vote for
purposes of determining the presence of a quorum but will not be counted as votes cast for purposes of determining the outcome
of any proposal. Broker non-votes on Proposal No. 1 (election of directors) and Proposal No. 2 (approval of 2023 executive
compensation on an advisory basis), will be counted as present and entitled to vote for the purpose of determining the presence
of a quorum at the Annual Meeting, but will not be counted as votes cast for purposes of determining the outcome of any of these
proposals.
Voting via the Internet, Telephone or Mail
You may submit your proxy or voting instructions via the Internet,
by telephone or by mail, depending on the manner in which you receive your proxy materials. If you received a Notice of Internet
Availability by mail, you can submit a proxy or voting instructions via the Internet by following the instructions provided in
the Notice of Internet Availability. If you received a printed set of the proxy materials by mail, you may submit a proxy or voting
instructions via the Internet, by telephone (if available) or by mail by following the instructions on the proxy card or voting
instruction form.
If you are a stockholder of record voting by telephone or the
Internet, your proxy must be received by 9:59 p.m. Mountain Time (11:59 p.m. Eastern Time) on April 24, 2024, in order for your
shares to be voted at the Annual Meeting. However, if you are a stockholder of record submitting a proxy card by mail, you may
instead mark, sign and date the proxy card you received and return it in the accompanying prepaid and addressed envelope so that
it is received by us before the Annual Meeting. If you hold your shares in street name, please provide your voting instructions
to the bank, broker or other nominee who holds your shares by the deadline specified by such bank, broker or nominee.
Voting in Person
All stockholders of record may vote in person at the Annual Meeting
by written ballot. However, if you are the beneficial owner of shares held in street name through a bank, broker or other nominee,
you may not vote your shares at the Annual Meeting unless you obtain a “legal proxy” from the bank, broker or nominee
that holds your shares giving you the right to vote the shares at the Annual Meeting. Even if you plan to attend the Annual
Meeting, we recommend that you submit your proxy or voting instructions in advance to authorize the voting of your shares at the
Annual Meeting so that your vote will be counted if you are later unable to attend. If you later attend the Annual Meeting and
vote in person, your previously submitted proxy or voting instructions will not be used.
How Your Shares Will be Voted
Your shares will be voted as you specify in your proxy or voting
instructions. Although our Board does not know of any business to be considered at the Annual Meeting other than the three proposals
described in this proxy statement, if any other business properly comes before the Annual Meeting, a stockholder’s properly
submitted proxy gives authority to the proxy holder to vote on those matters in his or her discretion. If you are a stockholder
of record and properly submit a proxy but do not specify your voting choice on one or more of the items listed in the notice of
meeting, your shares will be voted as recommended by our Board on those items.
If you hold your shares in street name through a brokerage account
and you do not submit voting instructions to your broker, your broker will not be authorized to vote your shares on any of the
matters at the Annual Meeting, other than Proposal No. 3 (the ratification of the appointment of Deloitte as our independent registered
public accounting firm for 2024). If your broker exercises its discretion to vote on Proposal No. 3 at the Annual Meeting, your
shares will constitute “broker non-votes” on each of the other items at the Annual Meeting.
Revoking or Changing Your Vote
If you are a stockholder of record, you may revoke your proxy
at any time before it is voted at the Annual Meeting by delivering a written notice of revocation to our Corporate Secretary at
our principal executive offices, by submitting a later-dated proxy via the Internet, by telephone or by mail by the applicable
deadline provided under “Voting Via the Internet, Telephone or Mail,” or by voting in person at the Annual Meeting.
If your shares are held in street name through a bank, broker or other nominee, you may revoke any previous voting instructions
by submitting new voting instructions to your bank, broker or nominee by the deadline specified by your bank, broker or nominee
or by attending the Annual Meeting and voting in person. Attendance at the Annual Meeting will not by itself constitute a revocation
of any proxy or voting instructions.
Additional Annual Meeting Information
Delivery of Proxy Materials
We may satisfy SEC rules regarding delivery of proxy materials,
including our proxy statements and Annual Reports, by delivering only one set of proxy materials to multiple stockholders that
share the same address, unless we have received contrary instructions in writing. This “householding” process can result
in meaningful cost savings for us and is consistent with our commitment to sustainability by reducing the environmental impact
of printing and mailing paper copies. Upon oral or written request, we will deliver promptly a separate copy of proxy materials
to a stockholder at a shared address to which a single copy of the proxy materials was delivered. If your shares are registered
in your own name, you may request a separate copy of the proxy materials for this Annual Meeting or for future meetings of Healthpeak
stockholders by notifying Broadridge toll-free at 1–866–540–7095 or writing to Broadridge Financial Solutions,
Inc., 51 Mercedes Way, Edgewood, New York 11717. If you are a street name holder, please contact the broker, bank or other nominee
that holds your shares to request a separate copy of proxy materials.
In the future, stockholders of record can avoid receiving duplicate
mailings by following the instructions on the Internet at www.proxyvote.com. If you hold your shares in street name and you would
like to receive only one copy of the proxy materials in the future, you should contact your bank, broker or other nominee.
Financial Statements
Our Annual Report containing our audited consolidated financial
statements accompanies this proxy statement. Upon the written request of any person solicited hereby, we will provide a copy of
our Annual Report to such person, without charge. Requests should be directed to our Corporate Secretary at Healthpeak Properties,
Inc., 4600 South Syracuse Street, Suite 500, Denver, Colorado 80237.
Inspector of Elections
Votes cast by proxy or at the Annual Meeting will be counted by
a representative of Broadridge Financial Solutions, Inc., the appointed inspector of elections for the Annual Meeting. In connection
with the duties as inspector of elections, Broadridge’s representative will also determine whether a quorum is present, evaluate
the validity of proxies and ballots, and certify the voting results.
Proxy Solicitation
We will bear all costs of the solicitation of proxies for the
Annual Meeting. In addition to solicitation by mail, directors and officers of Healthpeak, without receiving any additional compensation,
may solicit proxies personally or by telephone, email or other electronic means. We will request brokerage houses, banks and other
custodians or nominees holding stock in their names for others to forward proxy materials to their customers or principals who
are the beneficial owners of shares of our common stock and will reimburse them for their expenses in doing so. We have retained
the services of Georgeson LLC to assist in the solicitation of proxies for a fee of $10,000 plus reasonable out-of-pocket expenses.
We may engage Georgeson for additional solicitation work and incur fees greater than $10,000, depending on a variety of factors,
including preliminary voting results.
Voting Results
We intend to announce preliminary voting results at the Annual
Meeting and disclose final voting results in a Current Report on Form 8-K to be filed with the SEC within four business days following
the Annual Meeting.
Other Matters
2025 Stockholder Proposals, Director Nominations and Director
Candidate Recommendations
Proposals to be Included in 2025 Proxy Materials
Any stockholder that desires to have a proposal considered for
presentation at the 2025 annual meeting of stockholders, and included in Healthpeak’s proxy materials used in connection
with our 2025 annual meeting, must submit the proposal in writing to our Corporate Secretary so that it is received no later than
November 13, 2024. The proposal must also comply with the requirements of Rule 14a-8 under the Exchange Act to be so included.
If the date of next year’s annual meeting is changed by more than 30 days from the date of this year’s Annual Meeting,
then the deadline will be a reasonable time before we begin to make our proxy materials available to stockholders.
Proxy Access Nominations
Any stockholder (or group of no more than 25 stockholders) meeting
the Company’s continuous ownership requirements set forth in our Bylaws that wishes to nominate candidates for election to
our Board for inclusion in our proxy materials for our 2025 annual meeting of stockholders must provide written notice to our Corporate
Secretary no earlier than October 14, 2024, nor later than November 13, 2024. Other specifics regarding the foregoing proxy access
right, including the required content of the notice and certain other eligibility and procedural requirements, can be found in
Section 8 of Article II of our Bylaws.
Nominations or Proposals Not to be Included
in 2025 Proxy Materials
If a stockholder seeks to nominate a candidate for election or
to propose business for consideration at our 2025 annual meeting but not have it included in our proxy materials for the 2025 annual
meeting, we must receive notice of the proposal or director nomination no earlier than January 25, 2025, and no later than February
24, 2025. If we change the date of our 2025 annual meeting to a date that is before March 26, 2025, or after June 24, 2025, however,
notice of any proposal or director nomination must instead be delivered not earlier than the 90th day and not later
than the close of business on the later of the 60th day prior to our 2025 annual meeting, or the 10th day
following the day on which we publicly announce the date of our 2025 annual meeting. If the notice is not received between these
dates or does not satisfy the additional notice requirements set forth in Article II, Section 7(a) of our Bylaws, the notice will
be considered untimely and any nomination or business proposed to be brought before the meeting will be disregarded and not acted
upon at our 2025 annual meeting. Proposals, nominations and notices should be directed to the attention of the Corporate Secretary,
Healthpeak Properties, Inc., 4600 South Syracuse Street, Suite 500, Denver, Colorado 80237. In accordance with our Bylaws, the
foregoing deadline and notice requirements set forth in Article II, Section 7(a) of our Bylaws are also intended to apply to and
satisfy the notice requirements set forth in Rule 14a-19 under the Exchange Act, including paragraph (b) thereunder, with respect
to notice by a stockholder who intends to solicit proxies in support of director nominees other than the Company’s nominees
at the 2025 annual meeting.
Recommendations of Director Candidates
Stockholders may also recommend director candidates for our Board’s
consideration. The Governance Committee will consider director candidates properly recommended by stockholders in the same manner
as recommendations received from other sources. Stockholder recommendations must be submitted in writing to the Chair of the Governance
Committee, c/o Healthpeak Properties, Inc., 4600 South Syracuse Street, Suite 500, Denver, Colorado 80237, together with the proposed
candidate’s name, address, age, appropriate biographical information, descriptions of the candidate’s qualifications
and the relationship, if any, to the recommending stockholder, together with any other information about the stockholder and the
candidate that would otherwise be required pursuant to our Bylaws if the stockholder was nominating the candidate for election
to our Board at an annual meeting of stockholders. Stockholders who would like to recommend a candidate for consideration by our
Board in connection with the next annual meeting of stockholders should submit their written recommendation no later than January
1 of the year of the annual meeting.
Vote
We urge you to submit your proxy or voting instructions
as soon as possible, whether or not you expect to attend and vote at the Annual Meeting. If you attend and vote at the
Annual Meeting, your proxy will not be used.
|
By Order of the Board of Directors,
Carol B. Samaan
Vice President, Associate General Counsel and Corporate Secretary
Denver, Colorado
March 13, 2024
Forward-Looking Statements
Statements in this proxy statement that are not historical facts
are “forward-looking statements” within the meaning of Section 27A of the Securities Act and Section 21E of the Exchange
Act. Forward-looking statements include, among other things, statements regarding our and our officers’ intent, belief or
expectation as identified by the use of words such as “may,” “will,” “project,” “expect,”
“believe,” “intend,” “anticipate,” “seek,” “target,” “forecast,”
“plan,” “potential,” “estimate,” “could,” “would,” “should”
and other comparable and derivative terms or the negatives thereof. Examples of forward-looking statements include, among other
things, (i) statements regarding timing, outcomes and other details relating to current, pending or contemplated acquisitions,
dispositions, transitions, developments, redevelopments, joint venture transactions, financing activities, or other transactions;
(ii) development opportunities; (iii) the outlook for Lab, Outpatient Medical and CCRCs; (iv) our expectations regarding corporate
responsibility and ESG goals and initiatives; and (v) potential capital sources and uses. You should not place undue reliance on
these forward-looking statements. Pending acquisitions, dispositions, and leasing activity, including those that are subject to
binding agreements, remain subject to closing conditions and may not close within the anticipated timeframes or at all. Forward-looking
statements reflect our current expectations and views about future events and are subject to risks and uncertainties that could
significantly affect our future financial condition and results of operations. While forward-looking statements reflect our good
faith belief and assumptions we believe to be reasonable based upon current information, we can give no assurance that our expectations
or forecasts will be attained. Further, we cannot guarantee the accuracy of any such forward-looking statement contained in this
proxy statement, and such forward-looking statements are subject to known and unknown risks and uncertainties that are difficult
to predict. These risks and uncertainties include, but are not limited to: macroeconomic trends, including inflation, interest
rates, labor costs, and unemployment; risks associated with the merger transactions with Physicians Realty Trust (the “Mergers”)
that were completed on March 1, 2024, including, but not limited to, our ability to integrate the operations of the Company and
Physicians Realty Trust successfully and realize the anticipated synergies and other benefits of the Mergers or do so within the
anticipated time frame; changes within the industries in which we operate; significant regulation, funding requirements, and uncertainty
faced by our lab tenants; factors adversely affecting our tenants’, operators’, or borrowers’ ability to meet
their financial and other contractual obligations to us; the insolvency or bankruptcy of one or more of our major tenants, operators,
or borrowers; our concentration of real estate investments in the healthcare property sector, which makes us more vulnerable to
a downturn in a specific sector than if we invested across multiple sectors; the illiquidity of real estate investments; our ability
to identify and secure new or replacement tenants and operators; our property development, redevelopment, and tenant improvement
risks, including project abandonments, project delays, and lower profits than expected; the ability of the hospitals on whose campuses
our outpatient medical buildings are located and their affiliated healthcare systems to remain competitive or financially viable;
our ability to develop, maintain, or expand hospital and health system client relationships; operational risks associated with
third party management contracts, including the additional regulation and liabilities of our properties operated through RIDEA
structures; economic conditions, natural disasters, weather, and other conditions that negatively affect geographic areas where
we have concentrated investments; uninsured or underinsured losses, which could result in significant losses and/or performance
declines by us or our tenants and operators; our investments in joint ventures and unconsolidated entities, including our lack
of sole decision making authority and our reliance on our partners’ financial condition and continued cooperation; our use
of fixed rent escalators, contingent rent provisions, and/or rent escalators based on the Consumer Price Index; competition for
suitable healthcare properties to grow our investment portfolio; our ability to foreclose or exercise rights on collateral securing
our real estate-related loans; any requirement that we recognize reserves, allowances, credit losses, or impairment charges; investment
of substantial resources and time in transactions that are not consummated; our ability to successfully integrate or operate acquisitions;
the potential impact on us and our tenants, operators, and borrowers from litigation matters, including rising liability and insurance
costs; environmental compliance costs and liabilities associated with our real estate investments; our ability to satisfy ESG and
sustainability commitments and requirements, as well as stakeholder expectations; epidemics, pandemics, or other infectious diseases,
including Covid, and health and safety measures intended to reduce their spread; human capital risks, including the loss or limited
availability of our key personnel; our reliance on information technology systems and the possibility of a cybersecurity incident
or cybersecurity threat affecting our information systems or the information systems of our tenants, operators or borrowers; volatility,
disruption, or uncertainty in the financial markets; increased borrowing costs, including due to rising interest rates; cash available
for distribution to stockholders and our ability to make dividend distributions at expected levels; the availability of external
capital on acceptable terms or at all, including due to rising interest rates, changes in our credit ratings and the value of our
common stock, bank failures or other events affecting financial institutions; our ability to manage our indebtedness level and
covenants in and changes to the terms of such indebtedness; the failure of our tenants, operators, and borrowers to comply with
federal, state, and local laws and regulations, including resident health and safety requirements, as well as licensure, certification,
and inspection requirements; required regulatory approvals to transfer our senior housing properties; compliance with the Americans
with Disabilities Act and fire, safety, and other regulations; laws or regulations prohibiting eviction of our tenants; the requirements
of, or changes to, governmental reimbursement programs such as Medicare or Medicaid; legislation to address federal government
operations and administrative decisions affecting the Centers for Medicare and Medicaid Services; our participation in the Coronavirus
Aid, Relief, and Economic Security Act (“CARES Act”) Provider Relief Fund and other Covid-related stimulus and relief
programs; our ability to maintain our qualification as a REIT; our taxable REIT subsidiaries being subject to corporate level tax;
tax imposed on any net income from “prohibited transactions”; changes to U.S. federal income tax laws, and potential
deferred and contingent tax liabilities from corporate acquisitions; calculating non-REIT tax earnings and profits distributions;
ownership limits in our charter that restrict ownership in our stock; provisions of Maryland law and our charter that could prevent
a transaction that may otherwise be in the interest of our stockholders; conflicts of interest between the interests of our stockholders
and the interests of holders of Healthpeak OP common units; provisions in the operating agreement of Healthpeak OP and other agreements
that may delay or prevent unsolicited acquisitions and other transactions; our status as a holding company of Healthpeak OP; and
other risks and uncertainties described from time to time in our SEC filings. Except as required by law, we do not undertake, and
hereby disclaim, any obligation to update any forward-looking statements, which speak only as of the date on which they are made.
Appendix A
Reconciliations and Definitions
Reconciliations
NAREIT FFO, FFO AS ADJUSTED, AFFO AND NORMALIZED FFO PER SHARE
In thousands, except per share data
| | |
YEAR ENDED DECEMBER 31, | |
| | |
2023 | |
2022 |
| Net income (loss) applicable to common shares | |
$ | 304,284 | | |
$ | 497,792 | |
| Real estate related depreciation and amortization | |
| 749,901 | | |
| 710,569 | |
| Healthpeak’s share of real estate related depreciation and amortization from unconsolidated joint ventures | |
| 24,800 | | |
| 27,691 | |
| Noncontrolling interests’ share of real estate related depreciation and amortization | |
| (18,654 | ) | |
| (19,201 | ) |
| Loss (gain) on sales of depreciable real estate, net | |
| (86,463 | ) | |
| (10,422 | ) |
| Healthpeak’s share of loss (gain) on sales of depreciable real estate, net, from unconsolidated joint ventures | |
| — | | |
| 134 | |
| Noncontrolling interests’ share of gain (loss) on sales of depreciable real estate, net | |
| 11,546 | | |
| 12 | |
| Loss (gain) upon change of control, net(1) | |
| (234 | ) | |
| (311,438 | ) |
| Taxes associated with real estate dispositions | |
| — | | |
| 29 | |
| Nareit FFO applicable to common shares | |
$ | 985,180 | | |
$ | 895,166 | |
| Distributions on dilutive convertible units and other | |
| 9,394 | | |
| 9,407 | |
| Diluted Nareit FFO applicable to common shares | |
$ | 994,574 | | |
$ | 904,573 | |
| Weighted average shares outstanding – diluted Nareit FFO | |
| 554,559 | | |
| 546,462 | |
| Impact of adjustments to Nareit FFO: | |
| | | |
| | |
| Transaction and merger-related items(2) | |
$ | 13,835 | | |
$ | 4,788 | |
| Other impairments (recoveries) and other losses (gains), net(3) | |
| (3,850 | ) | |
| 3,829 | |
| Restructuring and severance-related charges(4) | |
| 1,368 | | |
| 32,749 | |
| Casualty-related charges (recoveries), net(5) | |
| (4,033 | ) | |
| 4,401 | |
| Recognition (reversal) of valuation allowance on deferred tax assets(6) | |
| (14,194 | ) | |
| — | |
| Total adjustments | |
$ | (6,874 | ) | |
$ | 45,767 | |
| FFO as Adjusted applicable to common shares | |
$ | 978,306 | | |
$ | 940,933 | |
| Distributions on dilutive convertible units and other | |
| 9,402 | | |
| 9,326 | |
| Diluted FFO as Adjusted applicable to common shares | |
$ | 987,708 | | |
$ | 950,259 | |
| Weighted average shares outstanding – diluted FFO as Adjusted | |
| 554,559 | | |
| 546,462 | |
| FFO as Adjusted applicable to common shares | |
$ | 978,306 | | |
$ | 940,933 | |
| Stock-based compensation amortization expense | |
| 14,480 | | |
| 16,537 | |
| Amortization of deferred financing costs | |
| 11,916 | | |
| 10,881 | |
| Straight-line rents(7) | |
| (14,387 | ) | |
| (49,183 | ) |
| AFFO capital expenditures | |
| (113,596 | ) | |
| (108,510 | ) |
| Deferred income taxes | |
| (816 | ) | |
| (4,096 | ) |
| Amortization of above (below) market lease intangibles, net | |
| (25,791 | ) | |
| (23,380 | ) |
| Other AFFO adjustments | |
| (9,335 | ) | |
| 520 | |
| AFFO applicable to common shares | |
$ | 840,777 | | |
$ | 783,702 | |
| Distributions on dilutive convertible units and other | |
| 6,581 | | |
| 6,594 | |
| Diluted AFFO applicable to common shares | |
$ | 847,358 | | |
$ | 790,296 | |
| Weighted average shares outstanding – diluted AFFO | |
| 552,734 | | |
| 544,637 | |
| | |
YEAR ENDED DECEMBER 31, | |
| | |
2023 | |
2022 |
| Diluted earnings per common share | |
$ | 0.56 | | |
$ | 0.92 | |
| Depreciation and amortization | |
| 1.37 | | |
| 1.33 | |
| Loss (gain) on sales of depreciable real estate, net | |
| (0.14 | ) | |
| (0.02 | ) |
| Loss (gain) upon change of control, net(1) | |
| 0.00 | | |
| (0.57 | ) |
| Taxes associated with real estate dispositions | |
| — | | |
| 0.00 | |
| Diluted Nareit FFO per common share | |
$ | 1.79 | | |
$ | 1.66 | |
| Transaction and merger-related items(2) | |
| 0.03 | | |
| 0.01 | |
| Other impairments (recoveries) and other losses (gains), net(3) | |
| (0.01 | ) | |
| 0.00 | |
| Restructuring and severance-related charges(4) | |
| 0.01 | | |
| 0.06 | |
| Casualty-related charges (recoveries), net(5) | |
| (0.01 | ) | |
| 0.01 | |
| Recognition (reversal) of valuation allowance on deferred tax assets(6) | |
| (0.03 | ) | |
| — | |
| Diluted FFO as Adjusted per common share | |
$ | 1.78 | | |
$ | 1.74 | |
| Stock-based compensation amortization expense | |
| 0.03 | | |
| 0.03 | |
| Amortization of deferred financing costs | |
| 0.02 | | |
| 0.02 | |
| Straight-line rents(7) | |
| (0.03 | ) | |
| (0.09 | ) |
| AFFO capital expenditures | |
| (0.20 | ) | |
| (0.20 | ) |
| Deferred income taxes | |
| 0.00 | | |
| (0.01 | ) |
| Amortization of above (below) market lease intangibles, net | |
| (0.05 | ) | |
| (0.04 | ) |
| Other AFFO adjustments | |
| (0.02 | ) | |
| 0.00 | |
| Diluted AFFO per common share | |
$ | 1.53 | | |
$ | 1.45 | |
| | |
| | | |
| | |
| Diluted FFO as Adjusted applicable to common shares | |
$ | 987,708 | | |
$ | 950,259 | |
| Impact of adjustments to FFO as Adjusted: | |
| | | |
| | |
| Less: positive impact of CARES Act funding | |
| (413 | ) | |
| (7,860 | ) |
| Normalized FFO | |
$ | 987,295 | | |
$ | 942,399 | |
| Normalized FFO Per Share | |
$ | 1.78 | | |
$ | 1.73 | |
| (1) |
The year ended December 31, 2022 includes a gain upon change of control related to the sale of a 30%
interest to a sovereign wealth fund and deconsolidation of seven previously consolidated lab buildings in South San Francisco,
California. The gain upon change of control is included in other income (expense), net in the Consolidated Statements of Operations. |
| (2) |
The year ended December 31, 2023 includes costs related to the Mergers, which are primarily comprised of legal, accounting,
tax, and other costs that were incurred prior to year-end, partially offset by termination fee income associated with Graphite
Bio, Inc., for which the lease terms have been modified to accelerate expiration of the lease to December 2024. Termination
fee income is included in rental and related revenues on the Consolidated Statements of Operations. |
| (3) |
The year ended December 31, 2022 includes the following: (i) $7 million of charges incurred in connection with the downsizing
of our corporate headquarters in Denver, Colorado, which are included in general and administrative expenses in the Consolidated
Statements of Operations, (ii) $14 million of expenses incurred for tenant relocation and other costs associated with the
demolition of an outpatient medical building, which are included in other income (expense), net in the Consolidated Statements
of Operations, and (iii) a $23 million gain on sale of a hospital under a direct financing lease, which is included in other
income (expense), net in the Consolidated Statements of Operations. The years ended December 31, 2023 and 2022 include reserves
and (recoveries) for expected loan losses recognized in impairments and loan loss reserves (recoveries), net in the Consolidated
Statements of Operations. |
| (4) |
The year ended December 31, 2022 includes $32 million of severance-related charges associated with the departures of our
former Chief Executive Officer and former Chief Legal Officer and General Counsel in the fourth quarter of 2022. These expenses
are included in general and administrative expenses in the Consolidated Statements of Operations. |
| (5) |
Casualty-related charges (recoveries), net are recognized in other income (expense), net and equity income (loss) from
unconsolidated joint ventures in the Consolidated Statements of Operations. |
| (6) |
In conjunction with classifying the assets related to the Callan Ridge JV as held for sale as of December 31, 2023, we
concluded it was more likely than not that we would realize the future value of certain deferred tax assets generated by the
net operating losses of taxable REIT subsidiaries. Accordingly, during the year ended December 31, 2023, we recognized the
reversal of a portion of the associated valuation allowance and recognized a corresponding income tax benefit. |
| (7) |
The year ended December 31, 2023 includes a $8.7 million write-off of straight-line rent receivable associated with Sorrento
Therapeutics, Inc., which commenced voluntary reorganization proceedings under Chapter 11 of the U.S. Bankruptcy Code. This
activity is reflected as a reduction of rental and related revenues in the Consolidated Statements of Operations. |
EBITDAre AND ADJUSTED EBITDAre
In thousands
| | |
THREE MONTHS ENDED
DECEMBER 31, 2023 | |
| Net income (loss) | |
$ | 75,395 | |
| Interest expense | |
| 52,784 | |
| Income tax expense (benefit) | |
| (11,842 | ) |
| Depreciation and amortization | |
| 188,544 | |
| Other depreciation and amortization | |
| 1,168 | |
| Share of unconsolidated joint venture (“JV”): | |
| | |
| Interest expense | |
| 834 | |
| Income tax expense (benefit) | |
| 150 | |
| Depreciation and amortization | |
| 6,723 | |
| EBITDAre | |
$ | 313,756 | |
| Transaction and merger-related items(1) | |
| 11,202 | |
| Other impairments (recoveries) and losses (gains)(1) | |
| (5,445 | ) |
| Casualty-related charges (recoveries)(1) | |
| (3,462 | ) |
| Stock-based compensation amortization expense | |
| 3,513 | |
| Impact of transactions closed during the period(2) | |
| 52 | |
| Adjusted EBITDAre | |
$ | 319,616 | |
| (1) |
This amount includes the corresponding line on the FFO as Adjusted, AFFO per share and Normalized FFO
per share reconciliation on page 85 of this proxy statement excluding the related tax impact included in the adjustment for
income tax expense (benefit) above. |
| (2) |
Adjustment reflects the impact of transactions that closed during the period as if the transactions were completed at
the beginning of the period. |
NET DEBT
| | |
DECEMBER 31, 2023 | |
| Bank line of credit and commercial paper | |
$ | 720,000 | |
| Term loans | |
| 496,824 | |
| Senior unsecured notes | |
| 5,403,378 | |
| Mortgage debt | |
| 256,097 | |
| Consolidated Debt | |
$ | 6,876,299 | |
| Share of unconsolidated JV mortgage debt | |
| 39,906 | |
| Enterprise Debt | |
$ | 6,916,205 | |
| Cash and cash equivalents | |
| (117,635 | ) |
| Share of unconsolidated JV cash and cash equivalents | |
| (29,243 | ) |
| Restricted cash | |
| (51,388 | ) |
| Share of unconsolidated JV restricted cash | |
| (8,022 | ) |
| Net Debt | |
$ | 6,709,917 | |
NET DEBT TO ADJUSTED EBITDAre (ANNUALIZED)
Dollars in thousands
| | |
THREE MONTHS ENDED
DECEMBER 31, 2023 |
| Net Debt | |
$ | 6,709,917 |
| Adjusted EBITDAre (annualized)(1) | |
$ | 1,278,464 |
| Net Debt to Adjusted EBITDAre (annualized) | |
| 5.2x |
| (1) |
Represents Adjusted EBITDAre for the three months ended December 31, 2023 multiplied by a factor of
four. |
SAME-STORE PORTFOLIO CASH (ADJUSTED) NOI GROWTH
In thousands
| | |
YEAR ENDED
DECEMBER 31, 2023 | |
YEAR ENDED
DECEMBER 31, 2022 |
| | |
LAB | | |
OUTPATIENT
MEDICAL | | |
CCRC | | |
LAB | | |
OUTPATIENT
MEDICAL | | |
CCRC | |
| Net income (loss) | |
$ | 385,059 | | |
$ | 216,618 | | |
$ | (26,587 | ) | |
$ | 620,105 | | |
$ | 208,580 | | |
$ | (43,053 | ) |
| (Income) loss from discontinued operations | |
| — | | |
| — | | |
| — | | |
| — | | |
| — | | |
| — | |
| Income (loss) from continuing operations | |
$ | 385,059 | | |
$ | 216,618 | | |
$ | (26,587 | ) | |
$ | 620,105 | | |
$ | 208,580 | | |
$ | (43,053 | ) |
| Interest expense | |
| — | | |
| 7,770 | | |
| 7,010 | | |
| — | | |
| 6,900 | | |
| 7,509 | |
| Depreciation and amortization | |
| 328,349 | | |
| 289,683 | | |
| 131,869 | | |
| 302,649 | | |
| 279,546 | | |
| 128,374 | |
| Transaction and merger-related costs | |
| 333 | | |
| 1,120 | | |
| 1,881 | | |
| 387 | | |
| 1,255 | | |
| 725 | |
| (Gain) loss on sales of real estate, net | |
| (60,498 | ) | |
| (21,312 | ) | |
| — | | |
| (3,744 | ) | |
| (10,659 | ) | |
| — | |
| Other (income) expense, net | |
| (7 | ) | |
| (2,697 | ) | |
| (228 | ) | |
| (311,939 | ) | |
| (12,709 | ) | |
| 1,380 | |
| Government grant income | |
| — | | |
| — | | |
| 184 | | |
| — | | |
| — | | |
| 6,765 | |
| Equity (income) loss from unconsolidated JVs | |
| (4,540 | ) | |
| (835 | ) | |
| — | | |
| 972 | | |
| (852 | ) | |
| (539 | ) |
| Healthpeak’s share of unconsolidated joint venture NOI | |
| 5,832 | | |
| 1,844 | | |
| — | | |
| 7,038 | | |
| 1,821 | | |
| 380 | |
| Noncontrolling interests’ share of consolidated joint venture NOI | |
| (463 | ) | |
| (25,152 | ) | |
| — | | |
| (181 | ) | |
| (25,400 | ) | |
| — | |
| Portfolio NOI | |
$ | 654,065 | | |
$ | 467,039 | | |
$ | 114,129 | | |
$ | 615,287 | | |
$ | 448,482 | | |
$ | 101,541 | |
| Adjustments to NOI | |
| (36,524 | ) | |
| (14,314 | ) | |
| (1,618 | ) | |
| (62,754 | ) | |
| (15,513 | ) | |
| 2,300 | |
| Portfolio Cash (Adjusted) NOI | |
$ | 617,541 | | |
$ | 452,725 | | |
$ | 112,511 | | |
$ | 552,533 | | |
$ | 432,969 | | |
$ | 103,841 | |
| Portfolio Income | |
$ | 617,541 | | |
$ | 452,725 | | |
$ | 112,511 | | |
$ | 552,533 | | |
$ | 432,969 | | |
$ | 103,841 | |
| Adjustments to NOI | |
| 36,524 | | |
| 14,314 | | |
| 1,618 | | |
| 62,754 | | |
| 15,513 | | |
| (2,300 | ) |
| Non-SS Portfolio NOI | |
| (168,957 | ) | |
| (39,987 | ) | |
| 1,101 | | |
| (125,260 | ) | |
| (32,899 | ) | |
| (5,521 | ) |
| SS Portfolio NOI | |
$ | 485,108 | | |
$ | 427,052 | | |
$ | 115,230 | | |
$ | 490,027 | | |
$ | 415,583 | | |
$ | 96,020 | |
| Non-cash adjustment to SS Portfolio NOI | |
| (23,979 | ) | |
| (11,685 | ) | |
| (1,618 | ) | |
| (45,496 | ) | |
| (13,763 | ) | |
| 2,300 | |
| SS Portfolio Cash (Adjusted) NOI | |
$ | 461,129 | | |
$ | 415,367 | | |
$ | 113,612 | | |
$ | 444,531 | | |
$ | 401,820 | | |
$ | 98,320 | |
YEAR-OVER-YEAR TOTAL SS PORTFOLIO CASH (ADJUSTED) NOI GROWTH
| | |
FULL YEAR 2023 |
| | |
SS GROWTH | % | |
% OF SS |
| Lab | |
| 3.7 | % | |
| 46.6 | % |
| Outpatient Medical | |
| 3.4 | % | |
| 42.0 | % |
| CCRC | |
| 15.6 | % | |
| 11.5 | % |
| Total Portfolio | |
| 4.8 | % | |
| 100.0 | % |
Definitions
Consolidated Debt. The carrying amount of bank line of
credit, commercial paper, term loans, senior unsecured notes, and mortgage debt, as reported in our consolidated financial statements.
EBITDAre and Adjusted EBITDAre. EBITDAre, or EBITDA for
Real Estate, is a supplemental performance measure defined by Nareit and intended for real estate companies. It represents earnings
before interest expense, income taxes, depreciation and amortization, gains or losses from sales of depreciable property (including
gains or losses on change in control), and impairment charges (recoveries) related to depreciable property. Adjusted EBITDAre is
defined as EBITDAre excluding other impairments (recoveries) and other losses (gains), transaction and merger-related items, prepayment
costs (benefits) associated with early retirement or payment of debt, restructuring and severance-related charges, litigation costs
(recoveries), casualty-related charges (recoveries), stock-based compensation amortization expense, and foreign currency remeasurement
losses (gains), adjusted to reflect the impact of transactions that closed during the period as if the transactions were completed
at the beginning of the period. EBITDAre and Adjusted EBITDAre include our pro rata share of our unconsolidated JVs presented on
the same basis. We consider EBITDAre and Adjusted EBITDAre important supplemental measures to net income (loss) because they provide
an additional manner in which to evaluate our operating performance and serve as additional indicators of our ability to service
our debt obligations. Net income (loss) is the most directly comparable GAAP measure to EBITDAre and Adjusted EBITDAre.
Enterprise Debt. Consolidated Debt plus our pro rata share
of total debt from our unconsolidated JVs. Enterprise Debt is a supplemental measure of our financial position, which enables both
management and investors to analyze our leverage and to compare our leverage to that of other companies. Our pro rata share of
total debt from our unconsolidated JVs is not intended to reflect our actual liability or ability to access assets should there
be a default under any or all such loans or a liquidation of the JVs.
Funds From Operations (“Nareit FFO”) and FFO as
Adjusted. FFO encompasses Nareit FFO and FFO as Adjusted, each of which is described in detail below. We believe FFO applicable
to common shares, diluted FFO applicable to common shares, and diluted FFO per common share are important supplemental non-GAAP
measures of operating performance for a REIT. Because the historical cost accounting convention used for real estate assets utilizes
straight-line depreciation (except on land), such accounting presentation implies that the value of real estate assets diminishes
predictably over time. Since real estate values instead have historically risen and fallen with market conditions, presentations
of operating results for a REIT that use historical cost accounting for depreciation could be less informative. The term FFO was
designed by the REIT industry to address this issue.
Nareit FFO. FFO, as defined by the National Association
of Real Estate Investment Trusts (“Nareit”), is net income (loss) applicable to common shares (computed in accordance
with GAAP), excluding gains or losses from sales of depreciable property, including any current and deferred taxes directly associated
with sales of depreciable property, impairments of, or related to, depreciable real estate, plus real estate and other real estate-related
depreciation and amortization, and adjustments to compute our share of Nareit FFO and FFO as Adjusted (see below) from joint ventures.
Adjustments for joint ventures are calculated to reflect our pro rata share of both our consolidated and unconsolidated joint ventures.
We reflect our share of Nareit FFO for unconsolidated joint ventures by applying our actual ownership percentage for the period
to the applicable reconciling items on an entity by entity basis. For consolidated joint ventures in which we do not own 100%,
we reflect our share of the equity by adjusting our Nareit FFO to remove the third party ownership share of the applicable reconciling
items based on actual ownership percentage for the applicable periods. Our pro rata share information is prepared on a basis consistent
with the comparable consolidated amounts, is intended to reflect our proportionate economic interest in the operating results of
properties in our portfolio and is calculated by applying our actual ownership percentage for the period. We do not control the
unconsolidated joint ventures, and the pro rata presentations of reconciling items included in Nareit FFO do not represent our
legal claim to such items. The joint venture members or partners are entitled to profit or loss allocations and distributions of
cash flows according to the joint venture agreements, which provide for such allocations generally according to their invested
capital.
The presentation of pro rata information has limitations, which
include, but are not limited to, the following: (i) the amounts shown on the individual line items were derived by applying our
overall economic ownership interest percentage determined when applying the equity method of accounting and do not necessarily
represent our legal claim to the assets and liabilities, or the revenues and expenses and (ii) other companies in our industry
may calculate their pro rata interest differently, limiting the usefulness as a comparative measure. Because of these limitations,
the pro rata financial information should not be considered independently or as a substitute for our financial statements as reported
under GAAP. We compensate for these limitations by relying primarily on our GAAP financial statements, using the pro rata financial
information as a supplement.
Nareit FFO does not represent cash generated from operating activities
in accordance with GAAP, is not necessarily indicative of cash available to fund cash needs and should not be considered an alternative
to net income (loss). We compute Nareit FFO in accordance with the current Nareit definition; however, other REITs may report Nareit
FFO differently or have a different interpretation of the current Nareit definition from ours.
FFO as Adjusted. In addition, we present Nareit FFO on
an adjusted basis before the impact of non-comparable items including, but not limited to, transaction and merger-related items,
other impairments (recoveries) and other losses (gains), restructuring and severance-related charges, prepayment costs (benefits)
associated with early retirement or payment of debt, litigation costs (recoveries), casualty-related charges (recoveries), deferred
tax asset valuation allowances, and changes in tax legislation (“FFO as Adjusted”). These adjustments are net of tax,
when applicable. Transaction and merger-related items include transaction expenses and gains/charges incurred as a result of mergers
and acquisitions and lease amendment or termination activities. Prepayment costs (benefits) associated with early retirement of
debt include the write-off of unamortized deferred financing fees, or additional costs, expenses, discounts, make-whole payments,
penalties or premiums incurred as a result of early retirement or payment of debt. Other impairments (recoveries) and other losses
(gains) include interest income associated with early and partial repayments of loans receivable and other losses or gains associated
with non-depreciable assets including goodwill, DFLs, undeveloped land parcels, and loans receivable. Management believes that
FFO as Adjusted provides a meaningful supplemental measurement of our FFO run-rate and is frequently used by analysts, investors,
and other interested parties in the evaluation of our performance as a REIT. At the same time that Nareit created and defined its
FFO measure for the REIT industry, it also recognized that “management of each of its member companies has the responsibility
and authority to publish financial information that it regards as useful to the financial community.” We believe stockholders,
potential investors, and financial analysts who review our operating performance are best served by an FFO run-rate earnings measure
that includes certain other adjustments to net income (loss), in addition to adjustments made to arrive at the Nareit defined measure
of FFO. FFO as Adjusted is used by management in analyzing our business and the performance of our properties and we believe it
is important that stockholders, potential investors, and financial analysts understand this measure used by management. We use
FFO as Adjusted to: (i) evaluate our performance in comparison with expected results and results of previous periods, relative
to resource allocation decisions, (ii) evaluate the performance of our management, (iii) budget and forecast future results to
assist in the allocation of resources, (iv) assess our performance as compared with similar real estate companies and the industry
in general, and (v) evaluate how a specific potential investment will impact our future results. Other REITs or real estate companies
may use different methodologies for calculating an adjusted FFO measure, and accordingly, our FFO as Adjusted may not be comparable
to those reported by other REITs.
Net Debt. Enterprise Debt less the carrying amount of cash
and cash equivalents, restricted cash, and expected net proceeds from the future settlement of shares issued through our equity
forward contracts, as reported in our consolidated financial statements and our pro rata share of cash and cash equivalents and
restricted cash from our unconsolidated JVs. Consolidated Debt is the most directly comparable GAAP measure to Net Debt. Net Debt
is a supplemental measure of our financial position, which enables both management and investors to analyze our leverage and to
compare our leverage to that of other companies.
Net Debt to Adjusted EBITDAre. Net Debt divided by Adjusted
EBITDAre is a supplemental measure of our ability to decrease our debt. Because we may not be able to use our cash to reduce our
debt on a dollar-for-dollar basis, this measure may have material limitations.
Net Operating Income (“NOI”) and Cash (Adjusted)
NOI. NOI and Adjusted NOI are non-GAAP supplemental financial measures used to evaluate the operating performance of real estate.
NOI is defined as real estate revenues (inclusive of rental and related revenues, resident fees and services, income from direct
financing leases, and government grant income and exclusive of interest income), less property level operating expenses; NOI excludes
all other financial statement amounts included in net income (loss). Adjusted NOI is calculated as NOI after eliminating the effects
of straight-line rents, DFL non-cash interest, amortization of market lease intangibles, termination fees, actuarial reserves for
insurance claims that have been incurred but not reported, and the impact of deferred community fee income and expense. NOI and
Adjusted NOI are calculated as NOI and Adjusted NOI from consolidated properties, plus our share of NOI and Adjusted NOI from unconsolidated
joint ventures (calculated by applying our actual ownership percentage for the period), less noncontrolling interests’ share
of NOI and Adjusted NOI from consolidated joint ventures (calculated by applying our actual ownership percentage for the period).
Management utilizes its share of NOI and Adjusted NOI in assessing its performance as we have various joint ventures that contribute
to its performance. We do not control our unconsolidated joint ventures, and our share of amounts from unconsolidated joint ventures
do not represent our legal claim to such items. Our share of NOI and Adjusted NOI should not be considered a substitute for, and
should only be considered together with and as a supplement to, our financial information presented in accordance with GAAP.
Adjusted NOI is oftentimes referred to as “Cash NOI.”
Management believes NOI and Adjusted NOI are important supplemental measures because they provide relevant and useful information
by reflecting only income and operating expense items that are incurred at the property level and present them on an unlevered
basis. We use NOI and Adjusted NOI to make decisions about resource allocations, to assess and compare property level performance,
and to evaluate our Same-Store (“SS”) performance, as described below. We believe that net income (loss) is the most
directly comparable GAAP measure to NOI and Adjusted NOI. NOI and Adjusted NOI should not be viewed as alternative measures of
operating performance to net income (loss) as defined by GAAP since they do not reflect various excluded items. Further, our definitions
of NOI and Adjusted NOI may not be comparable to the definitions used by other REITs or real estate companies, as they may use
different methodologies for calculating NOI and Adjusted NOI. Operating expenses generally relate to leased outpatient medical
and lab buildings, as well as CCRC facilities. We generally recover all or a portion of our leased outpatient medical and lab property
expenses through tenant recoveries. We present expenses as operating or general and administrative based on the underlying nature
of the expense.
Normalized FFO Per Share. Normalized FFO Per Share is a
measure used for our compensation metrics and is defined as Diluted FFO as Adjusted per common share, further adjusted to exclude
the effect of any special charges or other special circumstances as may be determined by the Compensation Committee. For purposes
of this metric, the Compensation Committee has determined to exclude the positive impact of CARES Act funding.
Same-Store (“SS”). Same-Store NOI and Cash
(Adjusted) NOI information allows us to evaluate the performance of our property portfolio under a consistent population by eliminating
changes in the composition of our portfolio of properties, excluding properties within the other non-reportable segments. We include
properties from our consolidated portfolio, as well as properties owned by our unconsolidated joint ventures in Same-Store NOI
and Adjusted NOI (see NOI definition above for further discussion regarding our use of pro-rata share information and its limitations).
Same-Store NOI and Adjusted NOI exclude government grant income under the CARES Act. Same-Store Adjusted NOI also excludes amortization
of deferred revenue from tenant-funded improvements and certain non-property specific operating expenses that are allocated to
each operating segment on a consolidated basis. Properties are included in Same-Store once they are stabilized for the full period
in both comparison periods. Newly acquired operating assets are generally considered stabilized at the earlier of lease-up (typically
when the tenant(s) control(s) the physical use of at least 80% of the space and rental payments have commenced) or 12 months from
the acquisition date. Newly completed developments and redevelopments are considered stabilized at the earlier of lease-up or 24
months from the date the property is placed in service. Properties that experience a change in reporting structure are considered
stabilized after 12 months in operations under a consistent reporting structure. A property is removed from Same-Store when it
is classified as held for sale, sold, placed into redevelopment, experiences a casualty event that significantly impacts operations,
a change in reporting structure or operator transition has been agreed to, or a significant tenant relocates from a Same-Store
property to a non Same-Store property and that change results in a corresponding increase in revenue. We do not report Same-Store
metrics for our other non-reportable segments.
**
Helpful Resources
Weblinks
| Board
of Directors |
healthpeak.com/leadership/board-of-directors/ |
| Board Committee Composition |
healthpeak.com/leadership/board-of-directors/ |
| |
committee-composition/ |
| Board Committee Charters |
healthpeak.com/esg/governance/ |
| Audit Committee Charter |
|
| Compensation and Human Capital Committee Charter |
|
| Nominating
and Corporate Governance Committee Charter |
|
| Executive
Team |
healthpeak.com/leadership/executive-team/ |
| Investor Relations |
ir.healthpeak.com/ |
| Financial Information |
ir.healthpeak.com/ |
| SEC Filings |
ir.healthpeak.com/financials/sec-filings/ |
| Investor Presentations |
ir.healthpeak.com/news-events/ |
| Press Releases |
ir.healthpeak.com/news/ |
| ESG |
healthpeak.com/esg/ |
| Annual ESG Report |
healthpeak.com/esg/ |
| Environmental Initiatives |
healthpeak.com/esg/environment/ |
| Social Initiatives |
healthpeak.com/esg/social/ |
| Governance Initiatives |
healthpeak.com/esg/governance/ |
| Historical Reports |
healthpeak.com/esg/historical-reports/ |
| Sustainable
Finance |
healthpeak.com/esg/sustainable-finance/ |
| Corporate Governance Documents |
healthpeak.com/esg/governance/ |
| Code of Business Conduct and Ethics |
|
| Vendor Code of Business Conduct and Ethics |
|
| Corporate
Governance Guidelines |
|
| Learn More |
|
| Corporate Website |
healthpeak.com |
| FAQs |
ir.healthpeak.com/resources/investor-faqs/ |
| Email Alerts |
ir.healthpeak.com/resources/investor-email-alerts/ |
Weblinks are provided for convenience only, and the content
on the referenced websites does not constitute a part of this proxy statement.
Contacts
Company Contacts
Corporate Secretary
Healthpeak Properties, Inc.
4600 South Syracuse Street, Suite 500
Denver, Colorado 80237
Board of Directors
Healthpeak Properties, Inc.
4600 South Syracuse Street, Suite 500
Denver, Colorado 80237
Investor Relations
InvestorRelations@healthpeak.com
|
Proxy Statement/Annual Meeting
Broadridge Financial Solutions,
Inc.
(Tabulator/Inspector of Election)
Broadridge Financial Solutions
51 Mercedes Way
Edgewood, New York 11717
866-540-7095
Georgeson LLC
(Proxy Solicitor for the Company)
888-607-9107
To Vote Your Shares
www.proxyvote.com
800-690-6903 |


HEALTHPEAK PROPERTIES, INC.
4600 SOUTH SYRACUSE STREET
SUITE 500
DENVER, CO 80237
 |
SCAN
TO
VIEW MATERIALS & VOTE |
 |
VOTE BY INTERNET - www.proxyvote.com or
scan the QR Barcode above
Use the Internet to transmit your voting instructions and for electronic delivery of information
up until 11:59 p.m. Eastern Time on April 24, 2024. Have your proxy card in hand when you access the website and follow the instructions
to obtain your records and to create an electronic voting instruction form.
ELECTRONIC DELIVERY OF FUTURE PROXY MATERIALS
If
you would like to reduce the costs incurred by our company in mailing proxy materials, you can consent to receiving all future
proxy statements, proxy cards and annual reports electronically via e-mail or the Internet. To sign up for electronic delivery,
please follow the instructions above to vote using the Internet and, when prompted, indicate that you agree to receive or access
proxy materials electronically in future years.
VOTE BY PHONE - 1-800-690-6903
Use any touch-tone
telephone to transmit your voting instructions up until 11:59 p.m. Eastern Time on April 24, 2024. Have your proxy card in hand
when you call and then follow the instructions.
VOTE BY MAIL
Mark, sign and date your proxy card
and return it in the postage-paid envelope we have provided or return it to Vote Processing, c/o Broadridge, 51 Mercedes Way,
Edgewood, NY 11717.
| TO VOTE, MARK BLOCKS BELOW IN BLUE OR BLACK INK AS FOLLOWS: |
|
| V33887-P05326 |
KEEP THIS PORTION FOR
YOUR RECORDS |
|
DETACH
AND RETURN THIS PORTION ONLY |
| THIS
PROXY CARD IS VALID ONLY WHEN SIGNED AND DATED. |
HEALTHPEAK PROPERTIES, INC.
| |
|
|
|
The Board of Directors recommends you vote “FOR” each of the director nominees named in proposal 1 and “FOR” proposals 2 and
3. |
|
|
|
| |
|
|
|
|
|
| 1. |
|
Election of Directors |
For
|
Against |
Abstain |
|
|
1a. Scott M. Brinker |
o |
o |
o |
|
|
1b. Katherine M. Sandstrom |
o |
o |
o |
|
|
1c. John T. Thomas |
o |
o |
o |
|
|
1d. Brian G. Cartwright |
o |
o |
o |
|
|
1e. James B. Connor |
o |
o |
o |
|
|
1f. R. Kent Griffin, Jr. |
o |
o |
o |
|
|
1g. Pamela J. Kessler |
o |
o |
o |
|
|
1h. Sara G. Lewis |
o |
o |
o |
|
|
1i. Ava E. Lias-Booker |
o |
o |
o |
|
|
1j. Tommy G. Thompson |
o |
o |
o |
|
|
1k. Richard A. Weiss |
o |
o |
o |
|
|
|
|
|
|
|
|
| |
|
|
|
|
|
|
|
|
|
|
|
|
|
| |
|
|
|
|
|
| |
|
|
|
|
|
|
|
|
For |
Against
|
Abstain |
| 2. |
|
Approval of 2023 executive compensation on an advisory basis. |
o |
o |
o |
| 3. |
|
Ratification of the appointment of Deloitte & Touche LLP as Healthpeak Properties, Inc.’s independent registered public
accounting firm for the year ending December 31, 2024. |
o |
o |
o |
| NOTE: At their discretion, the named proxies are authorized to consider and vote upon such other business as may properly come before
the meeting or any adjournments or postponements thereof. |
|
|
|
Please sign exactly as your name(s) appear(s) hereon. When signing as attorney, executor, administrator, or other fiduciary,
please give full title as such. Joint owners should each sign personally. All holders must sign. If a corporation or partnership,
please sign in full corporate or partnership name by authorized officer.
| |
|
|
|
|
|
| Signature
[PLEASE SIGN WITHIN BOX] |
Date |
|
Signature
(Joint Owners) |
Date |
|
HEALTHPEAK PROPERTIES, INC.
ANNUAL MEETING OF STOCKHOLDERS
Thursday, April 25, 2024
8:00 a.m. Central Time
Held In Person
Hilton Franklin Cool Springs
601 Corporate Centre Drive
Franklin, TN 37067
Important Notice Regarding the Availability of Proxy Materials for the Annual Meeting:
The
Notice and Proxy Statement and the 2023 Annual Report are available at
http://materials.proxyvote.com/Healthpeak.
You
can also view these materials at www.proxyvote.com by using the 16-digit control number provided on this proxy
card.
This proxy is solicited by the Board of Directors
for use at the Annual Meeting on April 25, 2024.
By signing this proxy, the undersigned stockholder
hereby appoints Katherine M. Sandstrom and Scott M. Brinker, and each of them, with full power of substitution, to act
as attorneys and proxies of the undersigned and to vote on behalf of the undersigned all shares of common stock of Healthpeak
Properties, Inc. that the undersigned is entitled to vote at the 2024 Annual Meeting of Stockholders to be held on Thursday,
April 25, 2024, at 8:00 a.m. Central Time, or any adjournments or postponements thereof.
This proxy is revocable and, when properly
executed, will be voted in the manner directed herein by the undersigned. If no choice is specified, the proxy (if signed)
will be voted “FOR” each of the eleven director nominees named in Proposal 1 and “FOR” Proposals 2 and
3. The shares entitled to be voted by the undersigned will be cast in the discretion of the proxies named above on any other
matter that may properly come before the meeting or any adjournments or postponements
thereof.
Continued and to be signed on the reverse side
v3.24.0.1
| X |
- DefinitionBoolean flag that is true when the XBRL content amends previously-filed or accepted submission.
| Name: |
dei_AmendmentFlag |
| Namespace Prefix: |
dei_ |
| Data Type: |
xbrli:booleanItemType |
| Balance Type: |
na |
| Period Type: |
duration |
|
| X |
- DefinitionThe type of document being provided (such as 10-K, 10-Q, 485BPOS, etc). The document type is limited to the same value as the supporting SEC submission type, or the word 'Other'.
| Name: |
dei_DocumentType |
| Namespace Prefix: |
dei_ |
| Data Type: |
dei:submissionTypeItemType |
| Balance Type: |
na |
| Period Type: |
duration |
|
| X |
- DefinitionA unique 10-digit SEC-issued value to identify entities that have filed disclosures with the SEC. It is commonly abbreviated as CIK. Reference 1: http://www.xbrl.org/2003/role/presentationRef
-Publisher SEC
-Name Exchange Act
-Number 240
-Section 12
-Subsection b-2
| Name: |
dei_EntityCentralIndexKey |
| Namespace Prefix: |
dei_ |
| Data Type: |
dei:centralIndexKeyItemType |
| Balance Type: |
na |
| Period Type: |
duration |
|
| X |
- DefinitionThe exact name of the entity filing the report as specified in its charter, which is required by forms filed with the SEC. Reference 1: http://www.xbrl.org/2003/role/presentationRef
-Publisher SEC
-Name Exchange Act
-Number 240
-Section 12
-Subsection b-2
| Name: |
dei_EntityRegistrantName |
| Namespace Prefix: |
dei_ |
| Data Type: |
xbrli:normalizedStringItemType |
| Balance Type: |
na |
| Period Type: |
duration |
|
v3.24.0.1
Pay vs Performance Disclosure
|
12 Months Ended |
|
Dec. 31, 2023
USD ($)
|
Dec. 31, 2022
USD ($)
|
Dec. 31, 2021
USD ($)
|
Dec. 31, 2020
USD ($)
|
| Pay vs Performance Disclosure [Table] |
|
|
|
|
|
| Pay vs Performance [Table Text Block] |
|
Pay-Versus-Performance Table
The following summarizes the relationship between our CEO’s,
and our other Named Executive Officers’, total compensation paid and our financial performance for the fiscal years shown
in the table (in this discussion, our CEO is also referred to as our principal executive officer or “PEO”, and our
Named Executive Officers other than our CEO are referred to as our “Non-PEO NEOs”).
| | |
| | |
| | |
| | |
| | |
AVERAGE
SUMMARY | | |
| | |
VALUE OF INITIAL
FIXED $100
INVESTMENT
BASED ON: | | |
| | |
| |
| YEAR | |
SUMMARY
COMP. TABLE
TOTAL
FOR CEO
(MR. BRINKER)(1)(2) | | |
COMP.
ACTUALLY
PAID TO
CEO
(MR. BRINKER)(3) | | |
SUMMARY
COMP. TABLE
TOTAL
FOR
FORMER CEO
(MR. HERZOG)(1)(2) | | |
COMP.
ACTUALLY
PAID TO
FORMER CEO
(MR. HERZOG)(3) | | |
COMP.
TABLE
TOTAL
PAID TO
NON-PEO
NEOs(1)(2) | | |
AVERAGE
COMP.
ACTUALLY
PAID TO
NON-PEO
NEOs(3) | | |
HEALTH-
PEAK
TOTAL
STOCK-
HOLDER
RETURN(4) | | |
PEER
TOTAL
STOCK-
HOLDER
RETURN(4) | | |
NET
INCOME
(IN MILLIONS)(5) | | |
NORMALIZED
FFO PER
SHARE(6) | |
| 2023 | |
$ | 7,692,510 | | |
$ | 2,500,263 | | |
$ | — | | |
$ | — | | |
$ | 3,003,451 | | |
$ | 1,549,751 | | |
$ | 65.39 | | |
$ | 112.04 | | |
$ | 334.8 | | |
$ | 1.78 | |
| 2022 | |
$ | 5,557,084 | | |
$ | 2,901,565 | | |
$ | 24,308,605 | | |
$ | 19,680,747 | | |
$ | 3,267,762 | | |
$ | 1,959,250 | | |
$ | 82.79 | | |
$ | 100.62 | | |
$ | 516.4 | | |
$ | 1.73 | |
| 2021 | |
$ | — | | |
$ | — | | |
$ | 11,713,883 | | |
$ | 17,200,186 | | |
$ | 3,767,688 | | |
$ | 5,579,450 | | |
$ | 114.23 | | |
$ | 134.06 | | |
$ | 525.9 | | |
$ | 1.60 | |
| 2020 | |
$ | — | | |
$ | — | | |
$ | 11,374,615 | | |
$ | 9,884,943 | | |
$ | 3,389,595 | | |
$ | 2,905,009 | | |
$ | 92.31 | | |
$ | 94.88 | | |
$ | 428.3 | | |
$ | 1.60 | |
| (1) |
In accordance with applicable SEC rules, since Mr. Brinker and Mr. Herzog each
served as PEO during covered fiscal years, they are each included in the table above and the footnotes that follow the table
as a PEO for the fiscal years in which they served in such capacity. For each of 2020 and 2021, our Non-PEO NEOs were Messrs.
Brinker, Scott, Klaritch and McHenry. For 2022, our Non-PEO NEOs were Messrs. Scott, Klaritch, Bohn, Mabry and McHenry. For
2023, our Non-PEO NEOs were Messrs. Scott, Klaritch, Bohn and Patadia. |
| (2) |
See the Summary Compensation Table above, and the Summary Compensation Table as disclosed
in our proxy statement filed with the SEC in calendar year 2023, for detail on the Summary Compensation Table total compensation
for each CEO for each fiscal year covered in the table. The average compensation for the Non-PEO NEOs for 2023 was calculated
from the Summary Compensation Table above. The average compensation for the Non-PEO NEOs for each of 2022, 2021 and 2020 was
calculated from the Summary Compensation Table as disclosed in our Proxy Statement filed with the SEC in calendar year 2023,
2022 or 2021, respectively. |
| (3) |
For purposes of this table, the compensation actually paid (also referred to as “CAP”)
to each of our NEOs (including, for purposes of this table, former executive officers who are included in the Non-PEO NEO
group for 2020, 2021, 2022 and 2023) means each NEO’s total compensation as reflected in the Summary Compensation Table
for the applicable fiscal year and adjusted for the following:
•
Less the amounts reported in the “Stock Awards” columns of the
Summary Compensation Table for the applicable fiscal year based on the grant date fair value of such awards;
•
Plus the fiscal year-end value of Healthpeak stock awards granted in the covered fiscal
year that were outstanding and unvested at the end of the covered fiscal year;
•
Plus/(less) the change in value as of the end of the covered fiscal year as compared to
the value at the end of the prior fiscal year for Healthpeak stock awards that were granted in prior fiscal years and were
outstanding and unvested at the end of the covered fiscal year;
•
Plus the vesting date value of Healthpeak stock awards that were granted and vested during
the same covered fiscal year;
•
Plus/(less) the change in value as of the vesting date as compared to the value at the
end of the prior fiscal year for Healthpeak stock awards that were granted in prior fiscal years and vested in the covered
fiscal year;
•
Less, as to any Healthpeak stock awards that were granted in prior fiscal years that were
forfeited during the covered fiscal year, the value of such awards as of the end of the prior fiscal year; and
•
Plus the dollar value of any dividends or other earnings paid during the covered fiscal
year on outstanding and unvested Healthpeak stock awards to the extent not reflected in the grant date fair values of the
awards.
No stock options were granted, and no unvested stock options were
outstanding, during the applicable fiscal years. There were no material modifications to any stock awards during the applicable
fiscal years.
In making each of these adjustments, the “value” of
a stock award is the fair value of the award on the applicable date determined in accordance with FASB ASC Topic 718 using the
valuation assumptions we then used to calculate the fair value of our equity awards. For more information on the valuation of our
equity awards, see the notes to our financial statements that appear in our Annual Report on Form 10-K each fiscal year and the
footnotes to the Summary Compensation Table that appears in our annual Proxy Statement. |
| (4) |
Healthpeak TSR represents cumulative total stockholder return on a fixed investment
of $100 in our common stock for the period beginning on the last trading day of 2019 through the end of the applicable fiscal
year, and is calculated assuming the reinvestment of dividends before consideration of income taxes. Peer total stockholder
return represents cumulative total stockholder return on a fixed investment of $100 in the Equity REIT Index of Nareit for
the period beginning on the last trading day of 2019 through the end of the applicable fiscal year, and is calculated assuming
the reinvestment of dividends before consideration of income taxes. |
| (5) |
This column shows Healthpeak’s net income for each fiscal year covered
by the table. The following chart illustrates the CAP for each CEO and the average CAP for our Non-PEO NEOs for each of the
last four fiscal years against our net income for each of those years. |
| (6) |
This column shows Healthpeak’s Normalized FFO per share for each fiscal
year covered by the table. We consider Normalized FFO per share to be a key metric in our executive compensation program;
see the Compensation Discussion and Analysis section of this proxy statement for more information regarding the use of this
performance measure. The following chart illustrates the CAP for each CEO and the average CAP for our Non-PEO NEOs for each
of the last four fiscal years against our Normalized FFO per share for each of those years. |
| (1) |
In accordance with applicable SEC rules, since Mr. Brinker and Mr. Herzog each
served as PEO during covered fiscal years, they are each included in the table above and the footnotes that follow the table
as a PEO for the fiscal years in which they served in such capacity. For each of 2020 and 2021, our Non-PEO NEOs were Messrs.
Brinker, Scott, Klaritch and McHenry. For 2022, our Non-PEO NEOs were Messrs. Scott, Klaritch, Bohn, Mabry and McHenry. For
2023, our Non-PEO NEOs were Messrs. Scott, Klaritch, Bohn and Patadia. |
| (2) |
See the Summary Compensation Table above, and the Summary Compensation Table as disclosed
in our proxy statement filed with the SEC in calendar year 2023, for detail on the Summary Compensation Table total compensation
for each CEO for each fiscal year covered in the table. The average compensation for the Non-PEO NEOs for 2023 was calculated
from the Summary Compensation Table above. The average compensation for the Non-PEO NEOs for each of 2022, 2021 and 2020 was
calculated from the Summary Compensation Table as disclosed in our Proxy Statement filed with the SEC in calendar year 2023,
2022 or 2021, respectively. |
| (3) |
For purposes of this table, the compensation actually paid (also referred to as “CAP”)
to each of our NEOs (including, for purposes of this table, former executive officers who are included in the Non-PEO NEO
group for 2020, 2021, 2022 and 2023) means each NEO’s total compensation as reflected in the Summary Compensation Table
for the applicable fiscal year and adjusted for the following:
•
Less the amounts reported in the “Stock Awards” columns of the
Summary Compensation Table for the applicable fiscal year based on the grant date fair value of such awards;
•
Plus the fiscal year-end value of Healthpeak stock awards granted in the covered fiscal
year that were outstanding and unvested at the end of the covered fiscal year;
•
Plus/(less) the change in value as of the end of the covered fiscal year as compared to
the value at the end of the prior fiscal year for Healthpeak stock awards that were granted in prior fiscal years and were
outstanding and unvested at the end of the covered fiscal year;
•
Plus the vesting date value of Healthpeak stock awards that were granted and vested during
the same covered fiscal year;
•
Plus/(less) the change in value as of the vesting date as compared to the value at the
end of the prior fiscal year for Healthpeak stock awards that were granted in prior fiscal years and vested in the covered
fiscal year;
•
Less, as to any Healthpeak stock awards that were granted in prior fiscal years that were
forfeited during the covered fiscal year, the value of such awards as of the end of the prior fiscal year; and
•
Plus the dollar value of any dividends or other earnings paid during the covered fiscal
year on outstanding and unvested Healthpeak stock awards to the extent not reflected in the grant date fair values of the
awards.
|
No stock options were granted, and no unvested stock options were
outstanding, during the applicable fiscal years. There were no material modifications to any stock awards during the applicable
fiscal years.
In making each of these adjustments, the “value” of
a stock award is the fair value of the award on the applicable date determined in accordance with FASB ASC Topic 718 using the
valuation assumptions we then used to calculate the fair value of our equity awards. For more information on the valuation of our
equity awards, see the notes to our financial statements that appear in our Annual Report on Form 10-K each fiscal year and the
footnotes to the Summary Compensation Table that appears in our annual Proxy Statement.
The table above reflects the CAP (determined as noted above) for
each CEO and, for our Non-PEO NEOs, the average of the CAPs determined for the Non-PEO NEOs for each of the fiscal years shown
in the table.
The following table provides a reconciliation of the Summary Compensation
Table Total to Compensation Actually Paid for Mr. Brinker.
RECONCILIATION OF SUMMARY COMPENSATION TABLE TOTAL TO
COMPENSATION ACTUALLY PAID FOR CEO (MR. BRINKER) | |
FISCAL YEAR
2023 ($ | ) | |
FISCAL YEAR
2022 ($ | ) | |
FISCAL YEAR
2021 ($) | | |
FISCAL YEAR
2020 ($) | |
| Summary Compensation Table Total | |
| 7,692,510 | | |
| 5,557,084 | | |
| — | | |
| — | |
| Grant Date Fair Value of Stock Awards Granted in Fiscal Year | |
| (5,204,310 | ) | |
| (3,134,399 | ) | |
| — | | |
| — | |
| Fair Value at Fiscal Year-End of Outstanding and Unvested Stock Awards Granted in Fiscal Year | |
| 2,997,838 | | |
| 2,541,379 | | |
| — | | |
| — | |
| Change in Fair Value of Outstanding and Unvested Stock Awards Granted in Prior Fiscal Years | |
| (2,282,005 | ) | |
| (2,232,034 | ) | |
| — | | |
| — | |
| Fair Value at Vesting of Stock Awards Granted in Fiscal Year That Vested During Fiscal Year | |
| — | | |
| 402,297 | | |
| — | | |
| — | |
| Change in Fair Value as of Vesting Date of Stock Awards Granted in Prior Fiscal Years For Which Applicable Vesting Conditions Were Satisfied During Fiscal Year | |
| (960,951 | ) | |
| (445,419 | ) | |
| — | | |
| — | |
| Fair Value as of Prior Fiscal Year-End of Stock Awards Granted in Prior Fiscal Years That Failed to Meet Applicable Vesting Conditions During Fiscal Year | |
| — | | |
| — | | |
| — | | |
| — | |
| Dividends Paid on Outstanding and Unvested Stock Awards | |
| 257,182 | | |
| 212,657 | | |
| — | | |
| — | |
| Compensation Actually Paid | |
| 2,500,263 | | |
| 2,901,565 | | |
| — | | |
| — | |
The following table provides a reconciliation of the
average of the Summary Compensation Table Total for the Non-PEO NEOs for a fiscal year to the average of the Compensation
Actually Paid for the Non-PEO NEOs for that fiscal year.
RECONCILIATION OF AVERAGE SUMMARY COMPENSATION TABLE TOTAL TO
AVERAGE COMPENSATION ACTUALLY PAID FOR NON-PEO NEOS | |
FISCAL YEAR
2023 ($ | ) | |
FISCAL YEAR
2022 ($ | ) | |
FISCAL YEAR
2021 ($) | | |
FISCAL YEAR
2020 ($) | |
| Summary Compensation Table Total | |
| 3,003,451 | | |
| 3,267,762 | | |
| 3,767,688 | | |
| 3,389,595 | |
| Grant Date Fair Value of Stock Awards Granted in Fiscal Year | |
| (1,387,525 | ) | |
| (1,535,477 | ) | |
| (1,718,594 | ) | |
| (1,849,445 | ) |
| Fair Value at Fiscal Year-End of Outstanding and Unvested Stock Awards Granted in Fiscal Year | |
| 822,314 | | |
| 1,087,331 | | |
| 2,004,500 | | |
| 1,509,955 | |
| Change in Fair Value of Outstanding and Unvested Stock Awards Granted in Prior Fiscal Years | |
| (671,242 | ) | |
| (368,699 | ) | |
| 1,104,314 | | |
| (640,251 | ) |
| Fair Value at Vesting of Stock Awards Granted in Fiscal Year That Vested During Fiscal Year | |
| — | | |
| 103,198 | | |
| 249,639 | | |
| 354,058 | |
| Change in Fair Value as of Vesting Date of Stock Awards Granted in Prior Fiscal Years For Which Applicable Vesting Conditions Were Satisfied During Fiscal Year | |
| (292,301 | ) | |
| (132,238 | ) | |
| 59,047 | | |
| (17,412 | ) |
| Fair Value as of Prior Fiscal Year-End of Stock Awards Granted in Prior Fiscal Years That Failed to Meet Applicable Vesting Conditions During Fiscal Year | |
| — | | |
| (516,184 | ) | |
| — | | |
| — | |
| Dividends Paid on Outstanding and Unvested Stock Awards | |
| 75,053 | | |
| 53,557 | | |
| 112,856 | | |
| 158,509 | |
| Compensation Actually Paid | |
| 1,549,751 | | |
| 1,959,250 | | |
| 5,579,450 | | |
| 2,905,009 | |
| (4) |
Healthpeak TSR represents cumulative total stockholder return on a fixed investment
of $100 in our common stock for the period beginning on the last trading day of 2019 through the end of the applicable fiscal
year, and is calculated assuming the reinvestment of dividends before consideration of income taxes. Peer total stockholder
return represents cumulative total stockholder return on a fixed investment of $100 in the Equity REIT Index of Nareit for
the period beginning on the last trading day of 2019 through the end of the applicable fiscal year, and is calculated assuming
the reinvestment of dividends before consideration of income taxes. |
The following chart illustrates our TSR for each of the
last three fiscal years against our TSR and the TSR for the Equity REIT Index of Nareit (each calculated as described above)
over that period of time.
The following chart illustrates the CAP for each CEO and the average
CAP for our Non-PEO NEOs for each of the last four fiscal years against our TSR and the TSR for the Equity REIT Index of Nareit
(each calculated as described above) over that period of time.
| (5) |
This column shows Healthpeak’s net income for each fiscal year covered
by the table. The following chart illustrates the CAP for each CEO and the average CAP for our Non-PEO NEOs for each of the
last four fiscal years against our net income for each of those years. |
| (6) |
This column shows Healthpeak’s Normalized FFO per share for each fiscal
year covered by the table. We consider Normalized FFO per share to be a key metric in our executive compensation program;
see the Compensation Discussion and Analysis section of this proxy statement for more information regarding the use of this
performance measure. The following chart illustrates the CAP for each CEO and the average CAP for our Non-PEO NEOs for each
of the last four fiscal years against our Normalized FFO per share for each of those years. |
|
|
|
|
| Company Selected Measure Name |
|
Normalized FFO per share
|
|
|
|
| Named Executive Officers, Footnote [Text Block] |
|
| (1) |
In accordance with applicable SEC rules, since Mr. Brinker and Mr. Herzog each
served as PEO during covered fiscal years, they are each included in the table above and the footnotes that follow the table
as a PEO for the fiscal years in which they served in such capacity. For each of 2020 and 2021, our Non-PEO NEOs were Messrs.
Brinker, Scott, Klaritch and McHenry. For 2022, our Non-PEO NEOs were Messrs. Scott, Klaritch, Bohn, Mabry and McHenry. For
2023, our Non-PEO NEOs were Messrs. Scott, Klaritch, Bohn and Patadia. |
|
|
|
|
| Adjustment To PEO Compensation, Footnote [Text Block] |
|
RECONCILIATION OF SUMMARY COMPENSATION TABLE TOTAL TO
COMPENSATION ACTUALLY PAID FOR CEO (MR. BRINKER) | |
FISCAL YEAR
2023 ($ | ) | |
FISCAL YEAR
2022 ($ | ) | |
FISCAL YEAR
2021 ($) | | |
FISCAL YEAR
2020 ($) | |
| Summary Compensation Table Total | |
| 7,692,510 | | |
| 5,557,084 | | |
| — | | |
| — | |
| Grant Date Fair Value of Stock Awards Granted in Fiscal Year | |
| (5,204,310 | ) | |
| (3,134,399 | ) | |
| — | | |
| — | |
| Fair Value at Fiscal Year-End of Outstanding and Unvested Stock Awards Granted in Fiscal Year | |
| 2,997,838 | | |
| 2,541,379 | | |
| — | | |
| — | |
| Change in Fair Value of Outstanding and Unvested Stock Awards Granted in Prior Fiscal Years | |
| (2,282,005 | ) | |
| (2,232,034 | ) | |
| — | | |
| — | |
| Fair Value at Vesting of Stock Awards Granted in Fiscal Year That Vested During Fiscal Year | |
| — | | |
| 402,297 | | |
| — | | |
| — | |
| Change in Fair Value as of Vesting Date of Stock Awards Granted in Prior Fiscal Years For Which Applicable Vesting Conditions Were Satisfied During Fiscal Year | |
| (960,951 | ) | |
| (445,419 | ) | |
| — | | |
| — | |
| Fair Value as of Prior Fiscal Year-End of Stock Awards Granted in Prior Fiscal Years That Failed to Meet Applicable Vesting Conditions During Fiscal Year | |
| — | | |
| — | | |
| — | | |
| — | |
| Dividends Paid on Outstanding and Unvested Stock Awards | |
| 257,182 | | |
| 212,657 | | |
| — | | |
| — | |
| Compensation Actually Paid | |
| 2,500,263 | | |
| 2,901,565 | | |
| — | | |
| — | |
|
|
|
|
| Non-PEO NEO Average Total Compensation Amount |
[1],[2] |
$ 3,003,451
|
$ 3,267,762
|
$ 3,767,688
|
$ 3,389,595
|
| Non-PEO NEO Average Compensation Actually Paid Amount |
[3] |
$ 1,549,751
|
1,959,250
|
5,579,450
|
2,905,009
|
| Adjustment to Non-PEO NEO Compensation Footnote [Text Block] |
|
RECONCILIATION OF AVERAGE SUMMARY COMPENSATION TABLE TOTAL TO
AVERAGE COMPENSATION ACTUALLY PAID FOR NON-PEO NEOS | |
FISCAL YEAR
2023 ($ | ) | |
FISCAL YEAR
2022 ($ | ) | |
FISCAL YEAR
2021 ($) | | |
FISCAL YEAR
2020 ($) | |
| Summary Compensation Table Total | |
| 3,003,451 | | |
| 3,267,762 | | |
| 3,767,688 | | |
| 3,389,595 | |
| Grant Date Fair Value of Stock Awards Granted in Fiscal Year | |
| (1,387,525 | ) | |
| (1,535,477 | ) | |
| (1,718,594 | ) | |
| (1,849,445 | ) |
| Fair Value at Fiscal Year-End of Outstanding and Unvested Stock Awards Granted in Fiscal Year | |
| 822,314 | | |
| 1,087,331 | | |
| 2,004,500 | | |
| 1,509,955 | |
| Change in Fair Value of Outstanding and Unvested Stock Awards Granted in Prior Fiscal Years | |
| (671,242 | ) | |
| (368,699 | ) | |
| 1,104,314 | | |
| (640,251 | ) |
| Fair Value at Vesting of Stock Awards Granted in Fiscal Year That Vested During Fiscal Year | |
| — | | |
| 103,198 | | |
| 249,639 | | |
| 354,058 | |
| Change in Fair Value as of Vesting Date of Stock Awards Granted in Prior Fiscal Years For Which Applicable Vesting Conditions Were Satisfied During Fiscal Year | |
| (292,301 | ) | |
| (132,238 | ) | |
| 59,047 | | |
| (17,412 | ) |
| Fair Value as of Prior Fiscal Year-End of Stock Awards Granted in Prior Fiscal Years That Failed to Meet Applicable Vesting Conditions During Fiscal Year | |
| — | | |
| (516,184 | ) | |
| — | | |
| — | |
| Dividends Paid on Outstanding and Unvested Stock Awards | |
| 75,053 | | |
| 53,557 | | |
| 112,856 | | |
| 158,509 | |
| Compensation Actually Paid | |
| 1,549,751 | | |
| 1,959,250 | | |
| 5,579,450 | | |
| 2,905,009 | |
|
|
|
|
| Compensation Actually Paid vs. Total Shareholder Return [Text Block] |
|
|
|
|
|
| Compensation Actually Paid vs. Net Income [Text Block] |
|
|
|
|
|
| Compensation Actually Paid vs. Company Selected Measure [Text Block] |
|
|
|
|
|
| Total Shareholder Return Vs Peer Group [Text Block] |
|
|
|
|
|
| Tabular List [Table Text Block] |
|
Following is an unranked list of our financial performance measures
we consider most important in linking the compensation actually paid to our NEOs for 2023 with our performance.
| • |
Normalized FFO per share (used in our 2023 STIP and Retentive LTIP awards) |
| • |
Net Debt to Adjusted EBITDAre (used in our 2023 STIP) |
| • |
Relative TSR (used in our TSR-Based LTIP awards) |
In addition to the financial performance measures listed above,
we view our stock price, upon which the value of all of our LTIP awards is dependent, as a key performance-based component of our
executive compensation program in order to further align the interests of our senior management team with the interests of our
stockholders.
|
|
|
|
| Total Shareholder Return Amount |
[4] |
$ 65.39
|
82.79
|
114.23
|
92.31
|
| Peer Group Total Shareholder Return Amount |
[4] |
112.04
|
100.62
|
134.06
|
94.88
|
| Net Income (Loss) Attributable to Parent |
[5] |
$ 334,800,000
|
$ 516,400,000
|
$ 525,900,000
|
$ 428,300,000
|
| Company Selected Measure Amount |
[6] |
1.78
|
1.73
|
1.60
|
1.60
|
| Measure [Axis]: 1 |
|
|
|
|
|
| Pay vs Performance Disclosure [Table] |
|
|
|
|
|
| Measure Name |
|
Normalized FFO per share (used in our 2023 STIP and Retentive LTIP awards)
|
|
|
|
| Measure [Axis]: 2 |
|
|
|
|
|
| Pay vs Performance Disclosure [Table] |
|
|
|
|
|
| Measure Name |
|
Net Debt to Adjusted EBITDAre (used in our 2023 STIP)
|
|
|
|
| Measure [Axis]: 3 |
|
|
|
|
|
| Pay vs Performance Disclosure [Table] |
|
|
|
|
|
| Measure Name |
|
Relative TSR (used in our TSR-Based LTIP awards)
|
|
|
|
| Non-PEO NEO [Member] | Grant Date Fair Value of Stock Awards Granted in Fiscal Year |
|
|
|
|
|
| Pay vs Performance Disclosure [Table] |
|
|
|
|
|
| Adjustment to Compensation Amount |
|
$ (1,387,525)
|
$ (1,535,477)
|
$ (1,718,594)
|
$ (1,849,445)
|
| Non-PEO NEO [Member] | Fair Value at Fiscal Year-End of Outstanding and Unvested Stock Awards Granted in Fiscal Year |
|
|
|
|
|
| Pay vs Performance Disclosure [Table] |
|
|
|
|
|
| Adjustment to Compensation Amount |
|
822,314
|
1,087,331
|
2,004,500
|
1,509,955
|
| Non-PEO NEO [Member] | Change in Fair Value of Outstanding and Unvested Stock Awards Granted in Prior Fiscal Years |
|
|
|
|
|
| Pay vs Performance Disclosure [Table] |
|
|
|
|
|
| Adjustment to Compensation Amount |
|
(671,242)
|
(368,699)
|
1,104,314
|
(640,251)
|
| Non-PEO NEO [Member] | Fair Value at Vesting of Stock Awards Granted in Fiscal Year That Vested During Fiscal Year |
|
|
|
|
|
| Pay vs Performance Disclosure [Table] |
|
|
|
|
|
| Adjustment to Compensation Amount |
|
|
103,198
|
249,639
|
354,058
|
| Non-PEO NEO [Member] | Change in Fair Value as of Vesting Date of Stock Awards Granted in Prior Fiscal Years For Which Applicable Vesting Conditions Were Satisfied During Fiscal Year |
|
|
|
|
|
| Pay vs Performance Disclosure [Table] |
|
|
|
|
|
| Adjustment to Compensation Amount |
|
(292,301)
|
(132,238)
|
59,047
|
(17,412)
|
| Non-PEO NEO [Member] | Fair Value as of Prior Fiscal Year-End of Stock Awards Granted in Prior Fiscal Years That Failed to Meet Applicable Vesting Conditions During Fiscal Year |
|
|
|
|
|
| Pay vs Performance Disclosure [Table] |
|
|
|
|
|
| Adjustment to Compensation Amount |
|
|
(516,184)
|
|
|
| Non-PEO NEO [Member] | Dividends Paid on Outstanding and Unvested Stock Awards |
|
|
|
|
|
| Pay vs Performance Disclosure [Table] |
|
|
|
|
|
| Adjustment to Compensation Amount |
|
75,053
|
53,557
|
112,856
|
158,509
|
| Scott M. Brinker |
|
|
|
|
|
| Pay vs Performance Disclosure [Table] |
|
|
|
|
|
| PEO Total Compensation Amount |
[1],[2] |
7,692,510
|
5,557,084
|
|
|
| PEO Actually Paid Compensation Amount |
[3] |
$ 2,500,263
|
$ 2,901,565
|
|
|
| PEO Name |
|
Mr. Brinker
|
Mr. Brinker
|
|
|
| Scott M. Brinker | PEO [Member] | Grant Date Fair Value of Stock Awards Granted in Fiscal Year |
|
|
|
|
|
| Pay vs Performance Disclosure [Table] |
|
|
|
|
|
| Adjustment to Compensation Amount |
|
$ (5,204,310)
|
$ (3,134,399)
|
|
|
| Scott M. Brinker | PEO [Member] | Fair Value at Fiscal Year-End of Outstanding and Unvested Stock Awards Granted in Fiscal Year |
|
|
|
|
|
| Pay vs Performance Disclosure [Table] |
|
|
|
|
|
| Adjustment to Compensation Amount |
|
2,997,838
|
2,541,379
|
|
|
| Scott M. Brinker | PEO [Member] | Change in Fair Value of Outstanding and Unvested Stock Awards Granted in Prior Fiscal Years |
|
|
|
|
|
| Pay vs Performance Disclosure [Table] |
|
|
|
|
|
| Adjustment to Compensation Amount |
|
(2,282,005)
|
(2,232,034)
|
|
|
| Scott M. Brinker | PEO [Member] | Fair Value at Vesting of Stock Awards Granted in Fiscal Year That Vested During Fiscal Year |
|
|
|
|
|
| Pay vs Performance Disclosure [Table] |
|
|
|
|
|
| Adjustment to Compensation Amount |
|
|
402,297
|
|
|
| Scott M. Brinker | PEO [Member] | Change in Fair Value as of Vesting Date of Stock Awards Granted in Prior Fiscal Years For Which Applicable Vesting Conditions Were Satisfied During Fiscal Year |
|
|
|
|
|
| Pay vs Performance Disclosure [Table] |
|
|
|
|
|
| Adjustment to Compensation Amount |
|
(960,951)
|
(445,419)
|
|
|
| Scott M. Brinker | PEO [Member] | Fair Value as of Prior Fiscal Year-End of Stock Awards Granted in Prior Fiscal Years That Failed to Meet Applicable Vesting Conditions During Fiscal Year |
|
|
|
|
|
| Pay vs Performance Disclosure [Table] |
|
|
|
|
|
| Adjustment to Compensation Amount |
|
|
|
|
|
| Scott M. Brinker | PEO [Member] | Dividends Paid on Outstanding and Unvested Stock Awards |
|
|
|
|
|
| Pay vs Performance Disclosure [Table] |
|
|
|
|
|
| Adjustment to Compensation Amount |
|
$ 257,182
|
212,657
|
|
|
| Thomas M. Herzog |
|
|
|
|
|
| Pay vs Performance Disclosure [Table] |
|
|
|
|
|
| PEO Total Compensation Amount |
[1],[2] |
|
24,308,605
|
11,713,883
|
11,374,615
|
| PEO Actually Paid Compensation Amount |
[3] |
|
$ 19,680,747
|
$ 17,200,186
|
$ 9,884,943
|
| PEO Name |
|
|
Mr. Herzog
|
Mr. Herzog
|
Mr. Herzog
|
|
|
| X |
- ReferencesReference 1: http://www.xbrl.org/2003/role/presentationRef
-Publisher SEC
-Name Regulation S-K
-Number 229
-Section 402
-Subsection v
-Paragraph 3
| Name: |
ecd_AdjToCompAmt |
| Namespace Prefix: |
ecd_ |
| Data Type: |
xbrli:monetaryItemType |
| Balance Type: |
na |
| Period Type: |
duration |
|
| X |
- ReferencesReference 1: http://www.xbrl.org/2003/role/presentationRef
-Publisher SEC
-Name Regulation S-K
-Number 229
-Section 402
-Subsection v
-Paragraph 3
| Name: |
ecd_AdjToNonPeoNeoCompFnTextBlock |
| Namespace Prefix: |
ecd_ |
| Data Type: |
dtr-types:textBlockItemType |
| Balance Type: |
na |
| Period Type: |
duration |
|
| X |
- ReferencesReference 1: http://www.xbrl.org/2003/role/presentationRef
-Publisher SEC
-Name Regulation S-K
-Number 229
-Section 402
-Subsection v
-Paragraph 3
| Name: |
ecd_AdjToPeoCompFnTextBlock |
| Namespace Prefix: |
ecd_ |
| Data Type: |
dtr-types:textBlockItemType |
| Balance Type: |
na |
| Period Type: |
duration |
|
| X |
- ReferencesReference 1: http://www.xbrl.org/2003/role/presentationRef
-Publisher SEC
-Name Regulation S-K
-Number 229
-Section 402
-Subsection v
-Paragraph 2
-Subparagraph vi
| Name: |
ecd_CoSelectedMeasureAmt |
| Namespace Prefix: |
ecd_ |
| Data Type: |
xbrli:decimalItemType |
| Balance Type: |
na |
| Period Type: |
duration |
|
| X |
- ReferencesReference 1: http://www.xbrl.org/2003/role/presentationRef
-Publisher SEC
-Name Regulation S-K
-Number 229
-Section 402
-Subsection v
-Paragraph 2
-Subparagraph vi
| Name: |
ecd_CoSelectedMeasureName |
| Namespace Prefix: |
ecd_ |
| Data Type: |
xbrli:normalizedStringItemType |
| Balance Type: |
na |
| Period Type: |
duration |
|
| X |
- ReferencesReference 1: http://www.xbrl.org/2003/role/presentationRef
-Publisher SEC
-Name Regulation S-K
-Number 229
-Section 402
-Subsection v
-Paragraph 5
-Subparagraph iii
| Name: |
ecd_CompActuallyPaidVsCoSelectedMeasureTextBlock |
| Namespace Prefix: |
ecd_ |
| Data Type: |
dtr-types:textBlockItemType |
| Balance Type: |
na |
| Period Type: |
duration |
|
| X |
- ReferencesReference 1: http://www.xbrl.org/2003/role/presentationRef
-Publisher SEC
-Name Regulation S-K
-Number 229
-Section 402
-Subsection v
-Paragraph 5
-Subparagraph ii
| Name: |
ecd_CompActuallyPaidVsNetIncomeTextBlock |
| Namespace Prefix: |
ecd_ |
| Data Type: |
dtr-types:textBlockItemType |
| Balance Type: |
na |
| Period Type: |
duration |
|
| X |
- ReferencesReference 1: http://www.xbrl.org/2003/role/presentationRef
-Publisher SEC
-Name Regulation S-K
-Number 229
-Section 402
-Subsection v
-Paragraph 5
-Subparagraph i
| Name: |
ecd_CompActuallyPaidVsTotalShareholderRtnTextBlock |
| Namespace Prefix: |
ecd_ |
| Data Type: |
dtr-types:textBlockItemType |
| Balance Type: |
na |
| Period Type: |
duration |
|
| X |
- ReferencesReference 1: http://www.xbrl.org/2003/role/presentationRef
-Publisher SEC
-Name Regulation S-K
-Number 229
-Section 402
-Subsection v
-Paragraph 2
-Subparagraph vi
| Name: |
ecd_MeasureName |
| Namespace Prefix: |
ecd_ |
| Data Type: |
xbrli:normalizedStringItemType |
| Balance Type: |
na |
| Period Type: |
duration |
|
| X |
- ReferencesReference 1: http://www.xbrl.org/2003/role/presentationRef
-Publisher SEC
-Name Regulation S-K
-Number 229
-Section 402
-Subsection v
-Paragraph 3
| Name: |
ecd_NamedExecutiveOfficersFnTextBlock |
| Namespace Prefix: |
ecd_ |
| Data Type: |
dtr-types:textBlockItemType |
| Balance Type: |
na |
| Period Type: |
duration |
|
| X |
- ReferencesReference 1: http://www.xbrl.org/2003/role/presentationRef
-Publisher SEC
-Name Regulation S-K
-Number 229
-Section 402
-Subsection v
-Paragraph 2
-Subparagraph iii
| Name: |
ecd_NonPeoNeoAvgCompActuallyPaidAmt |
| Namespace Prefix: |
ecd_ |
| Data Type: |
xbrli:monetaryItemType |
| Balance Type: |
na |
| Period Type: |
duration |
|
| X |
- ReferencesReference 1: http://www.xbrl.org/2003/role/presentationRef
-Publisher SEC
-Name Regulation S-K
-Number 229
-Section 402
-Subsection v
-Paragraph 2
-Subparagraph ii
| Name: |
ecd_NonPeoNeoAvgTotalCompAmt |
| Namespace Prefix: |
ecd_ |
| Data Type: |
xbrli:monetaryItemType |
| Balance Type: |
na |
| Period Type: |
duration |
|
| X |
- ReferencesReference 1: http://www.xbrl.org/2003/role/presentationRef
-Publisher SEC
-Name Regulation S-K
-Number 229
-Section 402
-Subsection v
-Paragraph 2
-Subparagraph iv
| Name: |
ecd_PeerGroupTotalShareholderRtnAmt |
| Namespace Prefix: |
ecd_ |
| Data Type: |
xbrli:monetaryItemType |
| Balance Type: |
na |
| Period Type: |
duration |
|
| X |
- ReferencesReference 1: http://www.xbrl.org/2003/role/presentationRef
-Publisher SEC
-Name Regulation S-K
-Number 229
-Section 402
-Subsection v
-Paragraph 2
-Subparagraph iii
| Name: |
ecd_PeoActuallyPaidCompAmt |
| Namespace Prefix: |
ecd_ |
| Data Type: |
xbrli:monetaryItemType |
| Balance Type: |
na |
| Period Type: |
duration |
|
| X |
- ReferencesReference 1: http://www.xbrl.org/2003/role/presentationRef
-Publisher SEC
-Name Regulation S-K
-Number 229
-Section 402
-Subsection v
-Paragraph 3
| Name: |
ecd_PeoName |
| Namespace Prefix: |
ecd_ |
| Data Type: |
xbrli:normalizedStringItemType |
| Balance Type: |
na |
| Period Type: |
duration |
|
| X |
- ReferencesReference 1: http://www.xbrl.org/2003/role/presentationRef
-Publisher SEC
-Name Regulation S-K
-Number 229
-Section 402
-Subsection v
-Paragraph 2
-Subparagraph ii
| Name: |
ecd_PeoTotalCompAmt |
| Namespace Prefix: |
ecd_ |
| Data Type: |
xbrli:monetaryItemType |
| Balance Type: |
na |
| Period Type: |
duration |
|
| X |
- ReferencesReference 1: http://www.xbrl.org/2003/role/presentationRef
-Publisher SEC
-Name Regulation S-K
-Number 229
-Section 402
-Subsection v
-Paragraph 1
| Name: |
ecd_PvpTable |
| Namespace Prefix: |
ecd_ |
| Data Type: |
xbrli:stringItemType |
| Balance Type: |
na |
| Period Type: |
duration |
|
| X |
- ReferencesReference 1: http://www.xbrl.org/2003/role/presentationRef
-Publisher SEC
-Name Regulation S-K
-Number 229
-Section 402
-Subsection v
-Paragraph 1
| Name: |
ecd_PvpTableTextBlock |
| Namespace Prefix: |
ecd_ |
| Data Type: |
dtr-types:textBlockItemType |
| Balance Type: |
na |
| Period Type: |
duration |
|
| X |
- ReferencesReference 1: http://www.xbrl.org/2003/role/presentationRef
-Publisher SEC
-Name Regulation S-K
-Number 229
-Section 402
-Subsection v
-Paragraph 6
| Name: |
ecd_TabularListTableTextBlock |
| Namespace Prefix: |
ecd_ |
| Data Type: |
dtr-types:textBlockItemType |
| Balance Type: |
na |
| Period Type: |
duration |
|
| X |
- ReferencesReference 1: http://www.xbrl.org/2003/role/presentationRef
-Publisher SEC
-Name Regulation S-K
-Number 229
-Section 402
-Subsection v
-Paragraph 2
-Subparagraph iv
| Name: |
ecd_TotalShareholderRtnAmt |
| Namespace Prefix: |
ecd_ |
| Data Type: |
xbrli:monetaryItemType |
| Balance Type: |
na |
| Period Type: |
duration |
|
| X |
- ReferencesReference 1: http://www.xbrl.org/2003/role/presentationRef
-Publisher SEC
-Name Regulation S-K
-Number 229
-Section 402
-Subsection v
-Paragraph 5
-Subparagraph iv
| Name: |
ecd_TotalShareholderRtnVsPeerGroupTextBlock |
| Namespace Prefix: |
ecd_ |
| Data Type: |
dtr-types:textBlockItemType |
| Balance Type: |
na |
| Period Type: |
duration |
|
| X |
- DefinitionThe portion of profit or loss for the period, net of income taxes, which is attributable to the parent. Reference 1: http://www.xbrl.org/2003/role/disclosureRef
-Topic 235
-SubTopic 10
-Name Accounting Standards Codification
-Section S99
-Paragraph 1
-Subparagraph (SX 210.4-08(g)(1)(ii))
-Publisher FASB
-URI https://asc.fasb.org//1943274/2147480678/235-10-S99-1
Reference 2: http://www.xbrl.org/2003/role/disclosureRef
-Topic 323
-SubTopic 10
-Name Accounting Standards Codification
-Section 50
-Paragraph 3
-Subparagraph (c)
-Publisher FASB
-URI https://asc.fasb.org//1943274/2147481687/323-10-50-3
Reference 3: http://www.xbrl.org/2003/role/disclosureRef
-Topic 825
-SubTopic 10
-Name Accounting Standards Codification
-Section 50
-Paragraph 28
-Subparagraph (f)
-Publisher FASB
-URI https://asc.fasb.org//1943274/2147482907/825-10-50-28
Reference 4: http://www.xbrl.org/2003/role/disclosureRef
-Topic 220
-SubTopic 10
-Name Accounting Standards Codification
-Section 50
-Paragraph 6
-Publisher FASB
-URI https://asc.fasb.org//1943274/2147482765/220-10-50-6
Reference 5: http://www.xbrl.org/2003/role/disclosureRef
-Topic 250
-SubTopic 10
-Name Accounting Standards Codification
-Section 50
-Paragraph 3
-Publisher FASB
-URI https://asc.fasb.org//1943274/2147483443/250-10-50-3
Reference 6: http://www.xbrl.org/2003/role/disclosureRef
-Topic 250
-SubTopic 10
-Name Accounting Standards Codification
-Section 50
-Paragraph 1
-Subparagraph (b)(2)
-Publisher FASB
-URI https://asc.fasb.org//1943274/2147483443/250-10-50-1
Reference 7: http://www.xbrl.org/2003/role/disclosureRef
-Topic 815
-SubTopic 40
-Name Accounting Standards Codification
-Section 65
-Paragraph 1
-Subparagraph (f)
-Publisher FASB
-URI https://asc.fasb.org//1943274/2147480175/815-40-65-1
Reference 8: http://www.xbrl.org/2003/role/disclosureRef
-Topic 250
-SubTopic 10
-Name Accounting Standards Codification
-Section 50
-Paragraph 8
-Publisher FASB
-URI https://asc.fasb.org//1943274/2147483443/250-10-50-8
Reference 9: http://www.xbrl.org/2003/role/disclosureRef
-Topic 250
-SubTopic 10
-Name Accounting Standards Codification
-Section 50
-Paragraph 9
-Publisher FASB
-URI https://asc.fasb.org//1943274/2147483443/250-10-50-9
Reference 10: http://www.xbrl.org/2003/role/disclosureRef
-Topic 250
-SubTopic 10
-Name Accounting Standards Codification
-Section 50
-Paragraph 11
-Subparagraph (a)
-Publisher FASB
-URI https://asc.fasb.org//1943274/2147483443/250-10-50-11
Reference 11: http://www.xbrl.org/2003/role/disclosureRef
-Topic 250
-SubTopic 10
-Name Accounting Standards Codification
-Section 50
-Paragraph 11
-Subparagraph (b)
-Publisher FASB
-URI https://asc.fasb.org//1943274/2147483443/250-10-50-11
Reference 12: http://www.xbrl.org/2003/role/disclosureRef
-Topic 250
-SubTopic 10
-Name Accounting Standards Codification
-Section 50
-Paragraph 4
-Publisher FASB
-URI https://asc.fasb.org//1943274/2147483443/250-10-50-4
Reference 13: http://www.xbrl.org/2003/role/exampleRef
-Topic 946
-SubTopic 830
-Name Accounting Standards Codification
-Section 55
-Paragraph 10
-Publisher FASB
-URI https://asc.fasb.org//1943274/2147480167/946-830-55-10
Reference 14: http://www.xbrl.org/2003/role/disclosureRef
-Topic 946
-SubTopic 220
-Name Accounting Standards Codification
-Section 45
-Paragraph 7
-Publisher FASB
-URI https://asc.fasb.org//1943274/2147483581/946-220-45-7
Reference 15: http://www.xbrl.org/2003/role/disclosureRef
-Topic 944
-SubTopic 220
-Name Accounting Standards Codification
-Section S99
-Paragraph 1
-Subparagraph (SX 210.7-04(18))
-Publisher FASB
-URI https://asc.fasb.org//1943274/2147483586/944-220-S99-1
Reference 16: http://www.xbrl.org/2003/role/disclosureRef
-Topic 280
-SubTopic 10
-Name Accounting Standards Codification
-Section 50
-Paragraph 22
-Publisher FASB
-URI https://asc.fasb.org//1943274/2147482810/280-10-50-22
Reference 17: http://www.xbrl.org/2003/role/disclosureRef
-Topic 946
-SubTopic 220
-Name Accounting Standards Codification
-Section S99
-Paragraph 1
-Subparagraph (SX 210.6-07(9))
-Publisher FASB
-URI https://asc.fasb.org//1943274/2147483575/946-220-S99-1
Reference 18: http://www.xbrl.org/2003/role/disclosureRef
-Topic 946
-SubTopic 220
-Name Accounting Standards Codification
-Section S99
-Paragraph 3
-Subparagraph (SX 210.6-09(1)(d))
-Publisher FASB
-URI https://asc.fasb.org//1943274/2147483575/946-220-S99-3
Reference 19: http://www.xbrl.org/2003/role/disclosureRef
-Topic 470
-SubTopic 10
-Name Accounting Standards Codification
-Section S99
-Paragraph 1A
-Subparagraph (SX 210.13-01(a)(4)(i))
-Publisher FASB
-URI https://asc.fasb.org//1943274/2147480097/470-10-S99-1A
Reference 20: http://www.xbrl.org/2009/role/commonPracticeRef
-Topic 470
-SubTopic 10
-Name Accounting Standards Codification
-Section S99
-Paragraph 1A
-Subparagraph (SX 210.13-01(a)(4)(ii))
-Publisher FASB
-URI https://asc.fasb.org//1943274/2147480097/470-10-S99-1A
Reference 21: http://www.xbrl.org/2003/role/disclosureRef
-Topic 470
-SubTopic 10
-Name Accounting Standards Codification
-Section S99
-Paragraph 1A
-Subparagraph (SX 210.13-01(a)(4)(iii)(A))
-Publisher FASB
-URI https://asc.fasb.org//1943274/2147480097/470-10-S99-1A
Reference 22: http://www.xbrl.org/2003/role/disclosureRef
-Topic 470
-SubTopic 10
-Name Accounting Standards Codification
-Section S99
-Paragraph 1A
-Subparagraph (SX 210.13-01(a)(4)(iv))
-Publisher FASB
-URI https://asc.fasb.org//1943274/2147480097/470-10-S99-1A
Reference 23: http://www.xbrl.org/2003/role/disclosureRef
-Topic 470
-SubTopic 10
-Name Accounting Standards Codification
-Section S99
-Paragraph 1A
-Subparagraph (SX 210.13-01(a)(5))
-Publisher FASB
-URI https://asc.fasb.org//1943274/2147480097/470-10-S99-1A
Reference 24: http://www.xbrl.org/2003/role/disclosureRef
-Topic 470
-SubTopic 10
-Name Accounting Standards Codification
-Section S99
-Paragraph 1B
-Subparagraph (SX 210.13-02(a)(4)(i))
-Publisher FASB
-URI https://asc.fasb.org//1943274/2147480097/470-10-S99-1B
Reference 25: http://www.xbrl.org/2003/role/disclosureRef
-Topic 470
-SubTopic 10
-Name Accounting Standards Codification
-Section S99
-Paragraph 1B
-Subparagraph (SX 210.13-02(a)(4)(iii)(A))
-Publisher FASB
-URI https://asc.fasb.org//1943274/2147480097/470-10-S99-1B
Reference 26: http://www.xbrl.org/2003/role/disclosureRef
-Topic 470
-SubTopic 10
-Name Accounting Standards Codification
-Section S99
-Paragraph 1B
-Subparagraph (SX 210.13-02(a)(4)(iii)(B))
-Publisher FASB
-URI https://asc.fasb.org//1943274/2147480097/470-10-S99-1B
Reference 27: http://www.xbrl.org/2003/role/disclosureRef
-Topic 470
-SubTopic 10
-Name Accounting Standards Codification
-Section S99
-Paragraph 1B
-Subparagraph (SX 210.13-02(a)(4)(iv))
-Publisher FASB
-URI https://asc.fasb.org//1943274/2147480097/470-10-S99-1B
Reference 28: http://www.xbrl.org/2003/role/disclosureRef
-Topic 470
-SubTopic 10
-Name Accounting Standards Codification
-Section S99
-Paragraph 1B
-Subparagraph (SX 210.13-02(a)(5))
-Publisher FASB
-URI https://asc.fasb.org//1943274/2147480097/470-10-S99-1B
Reference 29: http://www.xbrl.org/2003/role/disclosureRef
-Topic 280
-SubTopic 10
-Name Accounting Standards Codification
-Section 50
-Paragraph 30
-Subparagraph (b)
-Publisher FASB
-URI https://asc.fasb.org//1943274/2147482810/280-10-50-30
Reference 30: http://www.xbrl.org/2003/role/disclosureRef
-Topic 280
-SubTopic 10
-Name Accounting Standards Codification
-Section 50
-Paragraph 32
-Subparagraph (f)
-Publisher FASB
-URI https://asc.fasb.org//1943274/2147482810/280-10-50-32
Reference 31: http://www.xbrl.org/2003/role/disclosureRef
-Topic 260
-SubTopic 10
-Name Accounting Standards Codification
-Section 45
-Paragraph 60B
-Subparagraph (a)
-Publisher FASB
-URI https://asc.fasb.org//1943274/2147482689/260-10-45-60B
Reference 32: http://www.xbrl.org/2003/role/exampleRef
-Topic 280
-SubTopic 10
-Name Accounting Standards Codification
-Section 50
-Paragraph 31
-Publisher FASB
-URI https://asc.fasb.org//1943274/2147482810/280-10-50-31
Reference 33: http://www.xbrl.org/2003/role/disclosureRef
-Topic 280
-SubTopic 10
-Name Accounting Standards Codification
-Section 50
-Paragraph 32
-Subparagraph (c)
-Publisher FASB
-URI https://asc.fasb.org//1943274/2147482810/280-10-50-32
Reference 34: http://www.xbrl.org/2003/role/disclosureRef
-Topic 205
-SubTopic 20
-Name Accounting Standards Codification
-Section 50
-Paragraph 7
-Publisher FASB
-URI https://asc.fasb.org//1943274/2147483499/205-20-50-7
Reference 35: http://fasb.org/us-gaap/role/ref/legacyRef
-Topic 230
-SubTopic 10
-Name Accounting Standards Codification
-Section 45
-Paragraph 28
-Publisher FASB
-URI https://asc.fasb.org//1943274/2147482740/230-10-45-28
Reference 36: http://www.xbrl.org/2003/role/disclosureRef
-Topic 220
-SubTopic 10
-Name Accounting Standards Codification
-Section 45
-Paragraph 1A
-Subparagraph (a)
-Publisher FASB
-URI https://asc.fasb.org//1943274/2147482790/220-10-45-1A
Reference 37: http://www.xbrl.org/2003/role/disclosureRef
-Topic 220
-SubTopic 10
-Name Accounting Standards Codification
-Section 45
-Paragraph 1B
-Subparagraph (a)
-Publisher FASB
-URI https://asc.fasb.org//1943274/2147482790/220-10-45-1B
Reference 38: http://fasb.org/us-gaap/role/ref/legacyRef
-Topic 220
-SubTopic 10
-Name Accounting Standards Codification
-Section S99
-Paragraph 2
-Subparagraph (SX 210.5-03(20))
-Publisher FASB
-URI https://asc.fasb.org//1943274/2147483621/220-10-S99-2
Reference 39: http://fasb.org/us-gaap/role/ref/legacyRef
-Topic 942
-SubTopic 220
-Name Accounting Standards Codification
-Section S99
-Paragraph 1
-Subparagraph (SX 210.9-04(22))
-Publisher FASB
-URI https://asc.fasb.org//1943274/2147483589/942-220-S99-1
| Name: |
us-gaap_NetIncomeLoss |
| Namespace Prefix: |
us-gaap_ |
| Data Type: |
xbrli:monetaryItemType |
| Balance Type: |
credit |
| Period Type: |
duration |
|
| X |
- Details
| Name: |
ecd_MeasureAxis=1 |
| Namespace Prefix: |
|
| Data Type: |
na |
| Balance Type: |
|
| Period Type: |
|
|
| X |
- Details
| Name: |
ecd_MeasureAxis=2 |
| Namespace Prefix: |
|
| Data Type: |
na |
| Balance Type: |
|
| Period Type: |
|
|
| X |
- Details
| Name: |
ecd_MeasureAxis=3 |
| Namespace Prefix: |
|
| Data Type: |
na |
| Balance Type: |
|
| Period Type: |
|
|
| X |
- Details
| Name: |
ecd_ExecutiveCategoryAxis=ecd_NonPeoNeoMember |
| Namespace Prefix: |
|
| Data Type: |
na |
| Balance Type: |
|
| Period Type: |
|
|
| X |
- Details
| Name: |
ecd_AdjToCompAxis=peak_GrantDateFairValueOfStockAwardsGrantedInFiscalYearMember |
| Namespace Prefix: |
|
| Data Type: |
na |
| Balance Type: |
|
| Period Type: |
|
|
| X |
- Details
| Name: |
ecd_AdjToCompAxis=peak_FairValueAtFiscalYearEndOfOutstandingAndUnvestedStockAwardsGrantedInFiscalYearMember |
| Namespace Prefix: |
|
| Data Type: |
na |
| Balance Type: |
|
| Period Type: |
|
|
| X |
- Details
| Name: |
ecd_AdjToCompAxis=peak_ChangeInFairValueOfOutstandingAndUnvestedStockAwardsGrantedInPriorFiscalYearsMember |
| Namespace Prefix: |
|
| Data Type: |
na |
| Balance Type: |
|
| Period Type: |
|
|
| X |
- Details
| Name: |
ecd_AdjToCompAxis=peak_FairValueAtVestingOfStockAwardsGrantedInFiscalYearThatVestedDuringFiscalYearMember |
| Namespace Prefix: |
|
| Data Type: |
na |
| Balance Type: |
|
| Period Type: |
|
|
| X |
- Details
| Name: |
ecd_AdjToCompAxis=peak_ChangeInFairValueAsOfVestingDateOfStockAwardsGrantedInPriorFiscalYearsForWhichApplicableVestingConditionsWereSatisfiedDuringFiscalYearMember |
| Namespace Prefix: |
|
| Data Type: |
na |
| Balance Type: |
|
| Period Type: |
|
|
| X |
- Details
| Name: |
ecd_AdjToCompAxis=peak_FairValueAsOfPriorFiscalYearEndOfStockAwardsGrantedInPriorFiscalYearsThatFailedToMeetApplicableVestingConditionsDuringFiscalYearMember |
| Namespace Prefix: |
|
| Data Type: |
na |
| Balance Type: |
|
| Period Type: |
|
|
| X |
- Details
| Name: |
ecd_AdjToCompAxis=peak_DividendsPaidOnOutstandingAndUnvestedStockAwardsMember |
| Namespace Prefix: |
|
| Data Type: |
na |
| Balance Type: |
|
| Period Type: |
|
|
| X |
- Details
| Name: |
ecd_IndividualAxis=peak_MrBrinkerMember |
| Namespace Prefix: |
|
| Data Type: |
na |
| Balance Type: |
|
| Period Type: |
|
|
| X |
- Details
| Name: |
ecd_ExecutiveCategoryAxis=ecd_PeoMember |
| Namespace Prefix: |
|
| Data Type: |
na |
| Balance Type: |
|
| Period Type: |
|
|
| X |
- Details
| Name: |
ecd_IndividualAxis=peak_MrHerzogMember |
| Namespace Prefix: |
|
| Data Type: |
na |
| Balance Type: |
|
| Period Type: |
|
|
Healthpeak Properties (NYSE:PEAK)
Gráfico Histórico do Ativo
De Jan 2025 até Fev 2025

Healthpeak Properties (NYSE:PEAK)
Gráfico Histórico do Ativo
De Fev 2024 até Fev 2025

