North Bay Resources
Acquires Mt. Vernon Gold Mine, Sierra County, California, with
Assays up to 4.8 oz. Au per Ton
Bishop, CA -- July 18, 2024 --
InvestorsHub NewsWire -- North Bay Resources Inc. (the
"Company" or
"North
Bay") (OTC:
NBRI) is pleased to announce it has entered into an agreement
(the "Agreement") with a private arms-length
Company to acquire a 100% interest in the Mt. Vernon Mine located
in Sierra County, California. The Mt. Vernon Mine is a largely
undeveloped deposit, proximate to some of the richest past
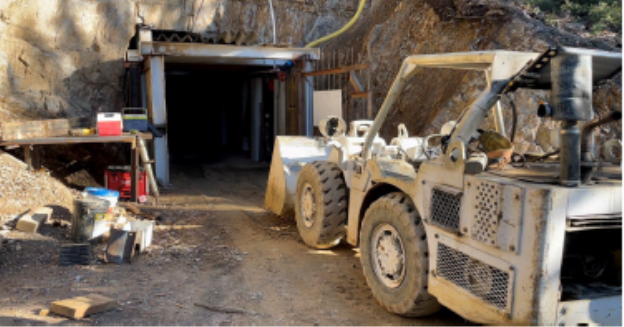
producing gold mines in North America. Mt. Vernon is a permitted underground
mine with modern portal, tunnel, ventilation. power, and equipment
(see Picture
1). The Company plans to commence test
mining immediately and initial production of 100 tons per day
shortly, pending minor infrastructure and permitting
updates. The ore will be shipped to the
Company's Bishop, California Gold Mill for
processing. The Company is targeting initial net
mine production of 3 truckloads per day utilizing 30 ton triaxle
dump trucks for delivery of feedstock to the Bishop Gold Mill with
an average target grade of one ounce gold per ton.
Production targets are based on prior
exploration and currently developed underground access to the gold
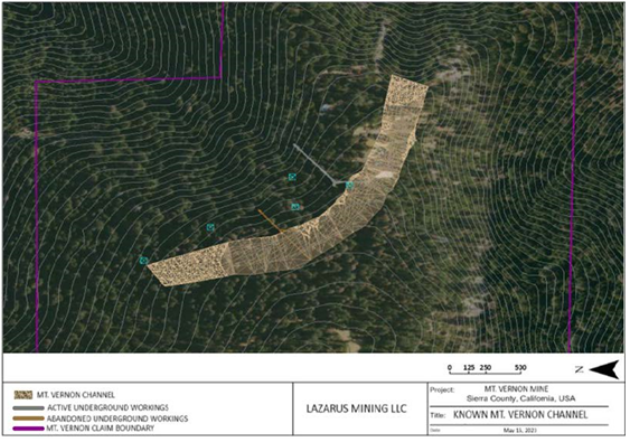
bearing ore body. The ore body is estimated at 954,000
tons based on the known channel (see
Figure 1
– B. Hanford
2023.

Picture 1. Mt.
Vernon Main Portal

Figure 1. Mt.
Vernon Known Channel
Gold
Mineralization
The Property is 120 acres, composed
of six 20-acre claims. Two types of gold mineralization
occur on the Property, a) paleo-placer deposits buried under
mudflows and volcanic rocks and b) auriferous quartz veins. The
Tertiary placer channels are large cobble conglomerates cemented
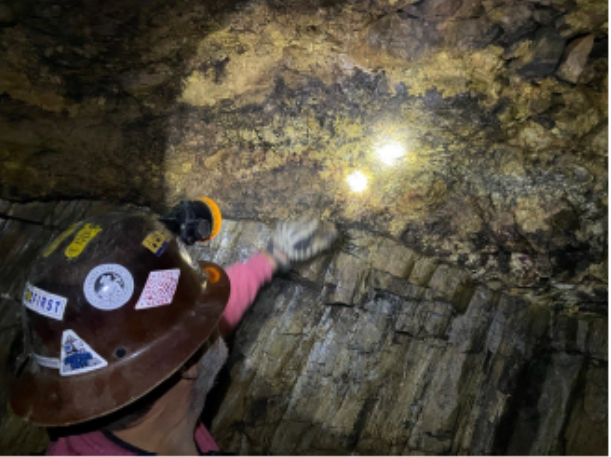
with a ferruginous sand matrix containing free gold. Gold is
recovered as fine flakes and large nuggets (see
Picture
2). The channels vary in thickness
from 4 feet to as much as 20 feet thick. Typically, the lower 4
feet of the gravels contain the higher grades. A 90-ounce nugget
was found on the Property in 1926. The Property is located directly
adjacent and upstream from the neighboring Ruby Mine. The Ruby
produced what is considered to be the best collection of gold
nuggets in the world. The Property is located upstream between the
rich lode deposit, the source of the placer gold, and the Ruby Mine
and on the same channel as the Ruby Mine.
The erosion of the gold-quartz veins
during the Cretaceous-Eocene period concentrated river gravels in
the ancient streams. The eruption and deposition of the lava and
mud flows covered rocks during the Pliocene period and sealed the
gravels in place.

Picture 2. Gold
Mineralization at the Bedrock Contact
Recent
Exploration
In 2023, channel sampling was
completed throughout the underground at the bedrock
contact. Assays were completed using
acid-digestion and fire assay at Enviro-Chem Analytical Laboratory.
Results are as follows:
|
Mt. Vernon - Main Tunnel North
Face
|
|
|
|
Sample ID
|
Channel Sample Location 10'
Intervals
|
Au Oz./Ton
|
|
MV23-8
|
3+90-4+00 L
|
2.11
|
|
MV23-7
|
4+00-4+10 L
|
2.02
|
|
MV23-6
|
4+10-4+20 L
|
1.35
|
|
MV23-25
|
4+20-4+30 L
|
2.10
|
|
MV23-18
|
4+30-4+40 L
|
3.22
|
|
MV23-12
|
4+40-4+50 L
|
4.80
|
|
MV23-14
|
4+50-4+60 L
|
2.48
|
|
MV23-23
|
4+60-4+70 L
|
1.82
|
|
MV23-13
|
4+70-4+80 L
|
2.83
|
|
MV23-26
|
4+80-4+90 L
|
1.52
|
|
MV23-2
|
4+90-5+00 L
|
2.57
|
|
MV23-24
|
5+00-5+10 L
|
1.06
|
|
MV23-9
|
5+10-5+20 L
|
0.67
|
|
MV23-3
|
5+20-5+30 L
|
0.94
|
|
MV23-29
|
5+30-5+40 L
|
0.93
|
|
|
|
|
|
Mt. Vernon - Main Tunnel South
Face
|
|
|
|
Sample ID
|
Channel Sample Location 10'
Intervals
|
Au Oz./Ton
|
|
MV23-17
|
3+90-4+00 R
|
2.01
|
|
MV23-10
|
4+10-4+20R
|
2.4
|
|
MV23-19
|
4+20-4+30 R
|
2.21
|
|
MV23-28
|
4+30-4+40 R
|
1.32
|
|
MV23-16
|
4+40-4+50 R
|
1.58
|
|
MV23-21
|
4+50-4+60 R
|
1.27
|
|
MV23-20
|
4+60-4+70 R
|
1.85
|
|
MV23-11
|
4+70-4+80 R
|
0.74
|
|
MV23-27
|
4+80-4+90 R
|
1.19
|
|
MV23-1
|
4+90-5+00 R
|
0.85
|
|
MV23-4
|
5+00-5+10 R
|
1.70
|
|
MV23-15
|
5+10-5+20 R
|
1.21
|
|
MV23-5
|
5+20-5+30 R
|
0.40
|
|
MV23-22
|
5+30-5+40 R
|
0.38
|
Terms of the
Agreement
The terms of the Mt. Vernon
acquisition agreement are as follows:
$25,000 on signing (the
"Due Diligence
Payment");
$25,000 within 45 days of signing
(the "MET Analyses
Payment")
$500,000 within 90 days of signing
(the "Down
Payment");
$1,000,000 within 180 days of signing
(the "First Annual
Payment");
$1,000,000 within 1 year of the First
Annual Payment (the "Second Annual
Payment");
$1,000,000 within 2 years of the
First Annual Payment (the "Third Annual
Payment");
$1,000,000 within 3 years of the
First Annual Payment (the "Fourth Annual
Payment");
$1,000,000 within 4 years of the
First Annual Payment (the "Fifth Annual
Payment");
$4,450,000 within 5 years of the
First Annual Payment (the "Final
Payment").
Subsequent to the completion of the
Option, the Property will be subject to a 2% Net Smelter Return
(the "NSR"). North Bay will have the right to
acquire 100% of the NSR for a payment of $10,000,000 in whole or in
part on a pro-rata
basis to either or both of the NSR
owners at any time for a period of up to 20 years from the date of
this agreement.
Corporate
Update
The Company has entered into an
agreement with Tomek Jablowski for digital marketing and media
services. Mr. Jablowski to receive $7,500 per
month and the right to acquire $100,000 of North Bay Common Stock
at a price of $0.0004 in the form of 250,000,000 incentive stock
options with an exercise price of $0.0004 and a term of 3
years.
The options will vest at the rate of
20% quarterly.
On behalf of the Board of Directors
of
NORTH BAY RESOURCES
INC.
Jared Lazerson
CEO
info@northbay-resources.com
northbay-resources.com
X: @NorthBayRes
Facebook:
North Bay Resources Inc | Facebook
LinkedIn:
North Bay Resources Inc | LinkedIn
This news release
may contain certain "Forward-Looking Statements" within the meaning
of the United States Private Securities Litigation Reform Act of
1995 and applicable Canadian securities
laws.