ETF of the Week: Industrial SPDR (XLI) - ETF News And Commentary
14 Fevereiro 2013 - 9:45AM
Zacks
We had earlier made a bullish case for the
Industrial Select Sector SPDR (XLI) before
starting the year 2013. This was particularly important as it was
just ahead of the ISM Manufacturing Data Release — one of the key
pieces of economic releases to kick of the New Year. The ETF then
was on the verge of a positive breakout and the positive looking
data surely fuelled its surge upwards.
Having said this, it is important to consider that XLI has added
about 7.55% year-to-date. Of course this includes the massive New
Year’s gain, which was on account of the fiscal cliff relief
rally.
However, even without taking the relief rally into
consideration, it is prudent to note that XLI has added about 5% so
far in 2013 (see Three Country ETFs Struggling in 2013).
Nevertheless, with the Industrial Production and capacity
utilization data scheduled for release tomorrow, XLI could well be
the ETF that captures investors’ attention heading into the long
weekend.
Industrial production inched up at a slow pace last time
primarily due to the temporary effects of Hurricane Sandy. This
also resulted in the U.S. economy shrinking by 0.1% in the fourth
quarter.
However, falling levels of unemployment and increase in personal
consumption expenditure have given a major boost to auto sales.
This in turn might cause industrial production to surge (see Three
Surging ETFs with Strong Momentum).
Even with this optimism, the overall earnings picture has been
bleak for the industrial sector. Although earnings have witnessed
growth, revenue has severely lagged behind even though the
construction industry has fared quite well, comparatively.
Nevertheless, with Europe relatively stable and China avoiding a
hard landing, the demand for industrial products is expected to
rebound in the upcoming quarters, thereby improving the fundamental
earnings picture for the overall sector.
With this backdrop let us have a closer look at the
Industrial Select Sector SPDR ETF (XLI).
The ETF was launched in December of 1998 and since then has been
able to amass an asset base of $4.75 billion. The ETF has an
average daily volume of more than 16.5 million shares.
XLI tracks the Industrial Select Sector Index, which measures
the performance of all the companies from the S&P 500 Index
which belong to the Industrial sector (read Zacks #2 Ranked
Industrial ETF in Focus).
The ETF holds 62 securities in its portfolio with almost 50% of
its total assets in the top 10 holdings. However, the assets of the
ETF in the top 10 holdings have a huge disparity in allocation as
more than 12% is invested in General Electric Co (GE). This makes
the ETF susceptible to concentration risk, although much of the
rest of the portfolio is well spread out.
Some of its other important holdings consist of United
Technologies Corp (UTX), Union Pacific Corp (UNP), Caterpillar Inc
and 3M Co. The ETF has returned around 15% for the fiscal year 2012
and pays out a dividend yield of 2.12% (read Three Tech ETFs Still
Going Strong).
The ETF has a volatility of 22.09% as measured by the annualized
standard deviation, which can be considered low especially given
the volatility in the equity market in the previous fiscal year.
This is reflected in our ‘Low’ risk outlook for
the ETF along with a Zacks ETF Rank of 3 or
Hold.
Given the hold ranking, the newest data release will surely play
a huge role in the ETF’s performance to finish off the week. Things
have been going pretty well so far though, so expectations could be
high for XLI heading into the weekend.
Want the latest recommendations from Zacks Investment Research?
Today, you can download 7 Best Stocks for the Next 30
Days. Click to get this free report >>
GENL ELECTRIC (GE): Free Stock Analysis Report
UNION PAC CORP (UNP): Free Stock Analysis Report
UTD TECHS CORP (UTX): Free Stock Analysis Report
SPDR-INDU SELS (XLI): ETF Research Reports
To read this article on Zacks.com click here.
Zacks Investment Research
Want the latest recommendations from Zacks Investment Research?
Today, you can download 7 Best Stocks for the Next 30 Days. Click
to get this free report
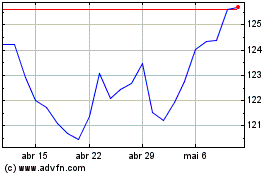
Industrial Select Sector (AMEX:XLI)
Gráfico Histórico do Ativo
De Dez 2024 até Jan 2025

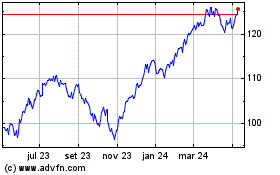
Industrial Select Sector (AMEX:XLI)
Gráfico Histórico do Ativo
De Jan 2024 até Jan 2025
