Dogecoin (DOGE) Mammoth Rally Takes Break, Why Dips Turned Attractive
31 Outubro 2022 - 6:04AM
NEWSBTC
Dogecoin surged over 100% and broke $0.12 against the US Dollar.
DOGE is correcting gains, but dips might be limited below the $0.10
level. DOGE extended its rally and it cleared the $0.1000 and
$0.1200 resistance levels against the US dollar. The price is
trading well above the $0.1000 zone and the 100-day simple moving
average. There was a break above a major bearish trend line with
resistance near $0.070 on the daily chart of the DOGE/USD pair
(data source from Kraken). The pair is correcting gains, but the
bulls might remain active near the $0.10 zone. Dogecoin Rallies To
New Multi-Week High This past week, dogecoin saw a strong bullish
wave from the $0.055 support zone. DOGE rallied significantly above
the $0.070 resistance, outpacing bitcoin and ethereum. There was a
break above a major bearish trend line with resistance near $0.070
on the daily chart of the DOGE/USD pair. The pair rallied over 100%
and broke many hurdles near the $0.10 level. It even climbed above
$0.12 and traded as high as $0.1513. Recently, it started a
downside correction below the $0.135 level. The price traded below
the 23.6% Fib retracement level of the recent surge from the
$0.0551 swing low to $0.1513 high. However, the price is trading
well above the $0.1000 zone and the 100-day simple moving average.
An initial support is near the $0.1100 level. The first key support
is near the $0.1000 level. It is close to the 50% Fib retracement
level of the recent surge from the $0.0551 swing low to $0.1513
high. If there is a downside break below the $0.1000 support, the
price could correct further. The main support is forming near the
$0.0920 and $0.0900 levels. Any more losses could open the doors
for a move towards the $0.0800 level. More Gains in DOGE? If DOGE
price remains stable above the $0.1000 support, there are chances
of more gains. An initial resistance on the upside is near the
$0.1250 level. The first major resistance is near the $0.1320
level. Any more gains above the $0.1320 zone could encourage the
bulls to aim a test the important $0.15 level. Technical Indicators
4-Hours MACD – The MACD for DOGE/USD is now losing momentum in the
bullish zone. 4-Hours RSI (Relative Strength Index) – The RSI for
DOGE/USD is now in the overbought zone. Major Support Levels –
$0.1100, $0.1100 and $0.0920. Major Resistance Levels – $0.1250,
$0.1320 and $0.1500.
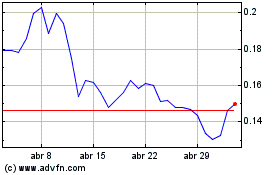
Dogecoin (COIN:DOGEUSD)
Gráfico Histórico do Ativo
De Jun 2024 até Jul 2024

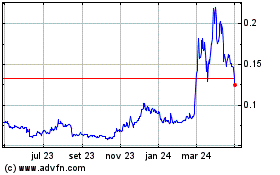
Dogecoin (COIN:DOGEUSD)
Gráfico Histórico do Ativo
De Jul 2023 até Jul 2024
