Wynn Resorts Tops on Strong Growth - Analyst Blog
03 Fevereiro 2012 - 8:00AM
Zacks
The world's third-largest casino
operator in terms of revenue, Wynn Resorts
Ltd. (WYNN) reported fourth quarter 2011 adjusted
earnings of $1.55 per share, breezing past the Zacks Consensus
Estimate of $1.26 and the prior-year quarter earnings of 91 cents.
On a GAAP basis, earnings per share was $1.52 versus 91 cents in
the comparable quarter last year.
Net revenue climbed 8.6% year over
year to $1,343.9 million, driven by solid business in Macau and Las
Vegas.
For full year 2011, thecasino
operator reported an adjusted net income of $701.1 million or $5.58
per share compared with $261.0 million or $2.11 per share in the
prior-year period. For 2011, net sales rose 25.9% to $5,269.8
million.
Macau
Operations
Net revenue at Wynn Macau was
$995.5 million in the quarter, up 9.1% year over year, driven by an
increase in slot machine handle and in both VIP table and mass
market table games.
The table games turnover in the VIP
segment rose 7.3% from the prior-year period to $29.7 billion. VIP
table games win in the quarter was 3.18% based on turnover, above
the expected range of 2.7% to 3.0% as well as the year-ago level of
3.15%.
Table games in the mass market
category jumped 4.4% year over year to $692.3 million. The mass
market table games win rate was 30.4%, which was higher than the
expected range of 26% to 28% and 26.0% recorded in the year-earlier
quarter.
Average daily rate (ADR) at Wynn
Macau was $322, up from $303 in the year-ago quarter. The
property’s occupancy level also leaped to 94.2% from 92.3% in the
prior-year quarter.
Non-gaming revenues at Wynn Macau
perked up 14.6% to $106.0 million from the prior-year quarter,
aided by solid performance across all non-casino segments.
Including Encore, Wynn Resorts currently boasts 504 tables (295 VIP
tables, 198 mass market tables and 11 poker tables) and 930 slot
machines in Macau.
Las Vegas
Operations
Wynn Resorts’ revenue from Las
Vegas operations grew 7.2% year over year to $348.4 million. Net
casino revenue was $145.8 million, rose 4.7% from the prior-year
period. Gross non-casino revenue crept up 6.8% year over year to
$246.6 million, buoyed by improved revenues from all non-gaming
segments.
With the global economy recovering
gradually, Wynn reported an upside in room revenues, which jumped
11.7% year over year to $85.3 million. ADR also rose 6.3% to $250,
but occupancy fell 3.3% to 79.1%. During the quarter, Wynn had 1.0%
of total rooms unavailable because of an air rebalancing project,
versus 9.0% of the rooms due to renovations in the fourth quarter
of 2010.
Balance Sheet
At the end of 2011, Wynn Resorts’
total cash balance was $1.3 billion. Total debt outstanding was
$3.2 billion, including obligations of approximately $2.6 billion
for Wynn Las Vegas and $628.0 million for Wynn Macau.
Our Take
We remain positive on Wynn Resorts’
strong brand equity and strategic positioning to command a premium
rate relative to the overall gaming and lodging industry. Moreover,
we remain encouraged by the company’s healthy balance sheet,
relatively low capital requirements and ability to execute in a
difficult operating environment. With strong momentum in Macau, we
expect the company’s earnings to grow going forward. Additionally,
Wynn Resorts’ has started working on the budget and project scope
for the sole Cotai project in the pipeline that is further expected
to boost its market share in Macau.
On the flip side, the competitive
environment at both at Macau and Las Vegas is heating up. The
company faces stiff competition from peers like Las Vegas
Sands Corp. (LVS) and MGM Resorts
International (MGM).
Accordingly, we have a Zacks #4
Rank (short-term Sell rating) on the shares. We also reiterate our
long-term Outperform recommendation.
LAS VEGAS SANDS (LVS): Free Stock Analysis Report
MGM RESORTS INT (MGM): Free Stock Analysis Report
WYNN RESRTS LTD (WYNN): Free Stock Analysis Report
To read this article on Zacks.com click here.
Zacks Investment Research
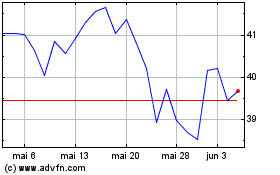
MGM Resorts (NYSE:MGM)
Gráfico Histórico do Ativo
De Set 2024 até Out 2024

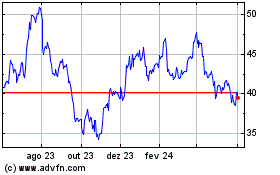
MGM Resorts (NYSE:MGM)
Gráfico Histórico do Ativo
De Out 2023 até Out 2024
