UNITED STATES
SECURITIES AND EXCHANGE COMMISSION
Washington, D.C. 20549
FORM 6-K
REPORT OF FOREIGN PRIVATE ISSUER
PURSUANT TO RULE 13a-16 OR 15d-16 OF
THE SECURITIES EXCHANGE ACT OF 1934
November 2nd, 2023
Commission File Number 001-10888
TotalEnergies SE
(Translation of registrant’s name into English)
2, place Jean Millier
La Défense 6
92400 Courbevoie
France
(Address of principal executive offices)
Indicate by check mark whether the registrant files or will file annual
reports under cover of Form 20-F or Form 40-F.
Form 20-F ☒ Form 40-F ☐
Indicate by check mark if the registrant is submitting the Form 6-K
in paper as permitted by Regulation S-T Rule 101(b)(1): ☐
Note: Regulation S-T Rule 101(b)(1) only permits the submission
in paper of a Form 6-K if submitted solely to provide an attached annual report to security holders.
Indicate by check mark if the registrant is submitting the Form 6-K
in paper as permitted by Regulation S-T Rule 101(b)(7): ☐
Note: Regulation S-T Rule 101(b)(7) only permits the submission
in paper of a Form 6-K if submitted to furnish a report or other document that the registrant foreign private issuer must furnish
and make public under the laws of the jurisdiction in which the registrant is incorporated, domiciled or legally organized (the registrant’s
“home country”), or under the rules of the home country exchange on which the registrant’s securities are traded,
as long as the report or other document is not a press release, is not required to be and has not been distributed to the registrant’s
security holders, and, if discussing a material event, has already been the subject of a Form 6-K submission or other Commission
filing on EDGAR.
TotalEnergies SE is providing on this Form 6-K a description of certain
recent developments relating to its business.
EXHIBIT INDEX
| Exhibit No. |
|
Description |
| |
|
|
| Exhibit 99.1 |
|
United States: TotalEnergies signs a new long-term solar power supply agreement with Saint-Gobain (October 2, 2023). |
| |
|
|
| Exhibit 99.2 |
|
Disclosure of Transactions in Own Shares (October 2, 2023). |
| |
|
|
| Exhibit 99.3 |
|
United States: TotalEnergies and Borealis Start Up Baystar JV Polyethylene Unit (October 3, 2023). |
| |
|
|
| Exhibit 99.4 |
|
Canada: TotalEnergies closes the sale of its 50% interest in Surmont to ConocoPhillips and sells the remainder of its Upstream Canadian assets to Suncor (October 4, 2023). |
| |
|
|
| Exhibit 99.5 |
|
Electric Mobility: TotalEnergies Surpasses Milestone of 1,000 High-Power Chargers in France (October 6, 2023). |
| |
|
|
| Exhibit 99.6 |
|
Disclosure of Transactions in Own Shares (October 9, 2023). |
| |
|
|
| Exhibit 99.7 |
|
Mozambique LNG: TotalEnergies’ response (October 11, 2023). |
| |
|
|
| Exhibit 99.8 |
|
Disclosure of Transactions in Own Shares (October 16, 2023). |
| |
|
|
| Exhibit 99.9 |
|
Scotland: TotalEnergies Commissions Its Biggest Offshore Wind Farm (October 17, 2023). |
| |
|
|
| Exhibit 99.10 |
|
United States: TotalEnergies joins forces with Corio and Rise to develop 3+ GW wind project offshore New York & New Jersey (October 23, 2023). |
| |
|
|
| Exhibit 99.11 |
|
Disclosure of Transactions in Own Shares (October 23, 2023). |
| |
|
|
| Exhibit 99.12 |
|
United States: TotalEnergies Starts Up in Texas a 380 MW Utility-Scale Solar Power Plant with Battery Storage (October 24, 2023). |
| |
|
|
| Exhibit 99.13 |
|
United States: TotalEnergies Awarded a 25-year Contract to Supply 1.4 GW of Renewable Electricity to New York (October 25, 2023). |
| |
|
|
| Exhibit 99.14 |
|
France: TotalEnergies Commissions its LNG Floating Terminal in the Port of Le Havre (October 26, 2023). |
| |
|
|
| Exhibit 99.15 |
|
TotalEnergie’s Third Quarter Results (October 26, 2023). |
| |
|
|
| Exhibit 99.16 |
|
TotalEnergies announces the third interim dividend of €0.74/share for fiscal year 2023, an increase of more than 7% compared to 2022 (October 26, 2023). |
| |
|
|
| Exhibit 99.17 |
|
Germany: TotalEnergies Pursues Its Integrated Power Strategy by Acquiring Renewable Energy Aggregator Quadra Energy (October 26, 2023). |
| |
|
|
| Exhibit 99.18 |
|
Disclosure of Transactions in Own Shares (October 30, 2023). |
| |
|
|
| Exhibit 99.19 |
|
SATORP completes MENA region’s first conversion of used cooking oil into ISCC+ certified sustainable aviation fuel (SAF) (October 30, 2023). |
SIGNATURES
Pursuant to the requirements of the Securities
Exchange Act of 1934, the registrant has duly caused this report to be signed on its behalf by the undersigned, thereunto duly authorized.
| |
TotalEnergies SE |
| |
|
|
| |
|
|
| Date: November 2nd, 2023 |
By: |
/s/ GWENOLA JAN |
| |
|
Name: |
Gwenola Jan |
| |
|
Title: |
Company Treasurer |
Exhibit 99.1
 | PRESS
RELEASE |
United States: TotalEnergies signs a new long-term solar
power supply agreement with Saint-Gobain
Paris/Houston,
October 2, 2023 – TotalEnergies has signed a new 15-year renewable Power Purchase Agreement (PPA) with Saint-Gobain.
This is the second long-term solar power supply agreement designed to help decarbonize the power consumption of the building materials
company’s 125 industrial sites in North America.
By signing this PPA with Saint-Gobain, TotalEnergies
is once again demonstrating its commitment to offering tailor-made renewable energy solutions to businesses worldwide, as it has done
with Air Liquide, Amazon, Merck, Microsoft, Orange and Sasol.
Under the 100 MW
PPA, TotalEnergies will supply clean energy from its Danish Fields Solar farm (Texas), helping offset Saint-Gobain’s North American
Scope 2 CO2 emissions from electricity by 90,000 metric tons per year. With a capacity of 720
MW, TotalEnergies’ solar farm is expected to come online in 2024 and will be the Company’s largest utility-scale operated
solar farm in the United States. This contract includes an upside sharing mechanism, under which the companies share any potential upside
arising from increased market price over the contract term.
“We are truly excited to reinforce our collaboration
with Saint-Gobain with this new clean energy commitment and therefore contribute to their carbon neutrality roadmap,” said Vincent
Stoquart, Senior Vice President, Renewables at TotalEnergies. “TotalEnergies’ growing solar power generation portfolio
in the U.S. provides concrete solutions enabling our industrial customers to decarbonize their electricity consumption. The signing of
upside sharing CPPAs contributes to the objective of profitable growth for our Integrated Power business.”
Commenting on this
agreement, Mark Rayfield, CEO of Saint-Gobain North America, added: “With this agreement, Saint-Gobain North America
will further reduce its CO2 emissions, demonstrating how fast the manufacturing industry can
transform when long term solutions are at hand. This renewable energy project is a new milestone on the way to meeting Saint-Gobain’s
commitment to reduce scope 1 and 2 CO2 emissions by 33% by 2030 - compared to 2017 - and to reach
carbon neutrality by 2050.”
TotalEnergies is one of the top renewable energy
developers in the United States, with a portfolio of large-scale solar, storage, onsite B2B solar distributed generation, onshore and
offshore wind projects that are expected to generate up to 10 GW of renewable power by 2025 and more than 25 GW by 2030.
***
TotalEnergies and renewables electricity
As part of its ambition to get to net zero by 2050,
TotalEnergies is building a portfolio of activities in electricity and renewables. At the end of July 2023, TotalEnergies' gross renewable
electricity generation installed capacity was 19 GW. TotalEnergies will continue to expand this business to reach 35 GW of gross production
capacity from renewable sources and storage by 2025, and then 100 GW by 2030 with the objective of being among the world's top 5 producers
of electricity from wind and solar energy.
About TotalEnergies
TotalEnergies is a global multi-energy company
that produces and markets energies: oil and biofuels, natural gas and green gases, renewables and electricity. Our more than 100,000 employees
are committed to energy that is ever more affordable, cleaner, more reliable and accessible to as many people as possible. Active in nearly
130 countries, TotalEnergies puts sustainable development in all its dimensions at the heart of its projects and operations to contribute
to the well-being of people.
TotalEnergies Contacts
Media Relations: +33 (0)1
47 44 46 99 l presse@totalenergies.com l
@TotalEnergiesPR Investor Relations: +33 (0)1 47 44 46 46 l ir@totalenergies.com
 |
@TotalEnergies |  |
TotalEnergies |  |
TotalEnergies |
 |
TotalEnergies |
Cautionary Note
The terms “TotalEnergies”, “TotalEnergies
company” or “Company” in this document are used to designate TotalEnergies SE and the consolidated entities that are
directly or indirectly controlled by TotalEnergies SE. Likewise, the words “we”, “us” and “our” may
also be used to refer to these entities or to their employees. The entities in which TotalEnergies SE directly or indirectly owns a shareholding
are separate legal entities. TotalEnergies SE has no liability for the acts or omissions of these entities. This document may contain
forward-looking information and statements that are based on a number of economic data and assumptions made in a given economic, competitive
and regulatory environment. They may prove to be inaccurate in the future and are subject to a number of risk factors. Neither TotalEnergies
SE nor any of its subsidiaries assumes any obligation to update publicly any forward-looking information or statement, objectives or trends
contained in this document whether as a result of new information, future events or otherwise. Information concerning risk factors, that
may affect TotalEnergies’ financial results or activities is provided in the most recent Registration Document, the French-language
version of which is filed by TotalEnergies SE with the French securities regulator Autorité des Marchés Financiers (AMF),
and in the Form 20-F filed with the United States Securities and Exchange Commission (SEC).
Exhibit 99.2
Disclosure of Transactions in Own Shares
Paris, October 2, 2023 – In accordance
with the authorization given by the ordinary shareholders’ general meeting on May 26, 2023, to trade on its shares and pursuant
to applicable law on share repurchase, TotalEnergies SE (LEI: 529900S21EQ1BO4ESM68) declares the following purchases of its own shares
(FR0000120271) from September 25 to September 29, 2023:
| Transaction Date |
Total daily volume
(number of shares) |
Daily weighted
average purchase
price of shares
(EUR/share) |
Amount of
transactions (EUR) |
Market (MIC Code) |
| 25/09/2023 |
323,826 |
62.154267 |
20,127,167.80 |
XPAR |
| 25/09/2023 |
238,000 |
62.108633 |
14,781,854.75 |
CEUX |
| 25/09/2023 |
49,000 |
62.087579 |
3,042,291.38 |
TQEX |
| 25/09/2023 |
33,000 |
62.080822 |
2,048,667.11 |
AQEU |
| 26/09/2023 |
473,835 |
61.609020 |
29,192,509.99 |
XPAR |
| 26/09/2023 |
75,000 |
61.659413 |
4,624,455.98 |
CEUX |
| 26/09/2023 |
25,000 |
61.619441 |
1,540,486.03 |
TQEX |
| 26/09/2023 |
25,000 |
61.625784 |
1,540,644.60 |
AQEU |
| 27/09/2023 |
470,273 |
62.395383 |
29,342,863.95 |
XPAR |
| 27/09/2023 |
75,000 |
62.376547 |
4,678,241.03 |
CEUX |
| 27/09/2023 |
25,000 |
62.376854 |
1,559,421.35 |
TQEX |
| 27/09/2023 |
25,000 |
62.368267 |
1,559,206.68 |
AQEU |
| 28/09/2023 |
456,685 |
63.826854 |
29,148,766.82 |
XPAR |
| 28/09/2023 |
75,000 |
63.841139 |
4,788,085.43 |
CEUX |
| 28/09/2023 |
25,000 |
63.843514 |
1,596,087.85 |
TQEX |
| 28/09/2023 |
25,000 |
63.848558 |
1,596,213.95 |
AQEU |
| 29/09/2023 |
461,791 |
62.943205 |
29,066,605.58 |
XPAR |
| 29/09/2023 |
75,000 |
62.958180 |
4,721,863.50 |
CEUX |
| 29/09/2023 |
25,000 |
62.955033 |
1,573,875.83 |
TQEX |
| 29/09/2023 |
25,000 |
62.961062 |
1,574,026.55 |
AQEU |
| Total |
3,006,410 |
62.567426 |
188,103,336.13 |
|
Transaction details
In accordance with Article 5(1)(b) of Regulation (EU) No 596/2014 (the
Market Abuse Regulation) a full breakdown of the individual trades are disclosed on the TotalEnergies website: https://totalenergies.com/investors/shares-and-dividends/total-shares/info/company-share-transactions
About TotalEnergies
TotalEnergies is a global multi-energy company
that produces and markets energies: oil and biofuels, natural gas and green gases, renewables and electricity. Our more than 100,000 employees
are committed to energy that is ever more affordable, cleaner, more reliable and accessible to as many people as possible. Active in nearly
130 countries, TotalEnergies puts sustainable development in all its dimensions at the heart of its projects and operations to contribute
to the well-being of people.
TotalEnergies Contacts
Media Relations:+33 (0)1 47 44 46 99l
presse@totalenergies.com l @TotalEnergiesPR
Investor Relations:+33 (0)1 47 44 46 46 l
ir@totalenergies.com
 |
@TotalEnergies |  |
TotalEnergies |  |
TotalEnergies |
 |
TotalEnergies |
Cautionary Note
The terms “TotalEnergies”, “TotalEnergies
company” or “Company” in this document are used to designate TotalEnergies SE and the consolidated entities that are
directly or indirectly controlled by TotalEnergies SE. Likewise, the words “we”, “us” and “our” may
also be used to refer to these entities or to their employees. The entities in which TotalEnergies SE directly or indirectly owns a shareholding
are separate legal entities. This document may contain forward-looking information and statements that are based on a number of economic
data and assumptions made in a given economic, competitive and regulatory environment. They may prove to be inaccurate in the future and
are subject to a number of risk factors. Neither TotalEnergies SE nor any of its subsidiaries assumes any obligation to update publicly
any forward-looking information or statement, objectives or trends contained in this document whether as a result of new information,
future events or otherwise. Information concerning risk factors, that may affect TotalEnergies’ financial results or activities
is provided in the most recent Universal Registration Document, the French-language version of which is filed by TotalEnergies SE with
the French securities regulator Autorité des Marchés Financiers (AMF), and in the Form 20-F filed with the United States
Securities and Exchange Commission (SEC).
Exhibit
99.3
 |
PRESS RELEASE |
United
States: TotalEnergies and Borealis Start Up Baystar JV
Polyethylene Unit
Paris, October 3, 2023 –TotalEnergies
and Borealis celebrate the start-up of their Baystar joint venture’s new 625,000 metric ton-per-year Borstar® polyethylene (PE)
unit, which more than doubles the current production capacity at Baystar’s site in Bayport, Texas.
The new USD 1.4 billion unit completes the partners’
integrated petrochemicals venture, which includes the expanded Bayport PE facility, and the ethane cracker at the TotalEnergies Platform
in Port Arthur, Texas.
The new PE unit, referred to as Bay 3, increases
the Baystar site’s total production to over one million tons per year, which includes two legacy polyethylene production units.
Bay 3 features the state-of-the-art proprietary Borstar® 3G technology licensed in North America for the first time. Borstar technology
delivers advanced value-added polymers with enhanced sustainability by enabling light-weighting and the incorporation of greater amounts
of post-consumer recycled materials in a variety of end products, serving the energy, infrastructure and consumer products industries.
After the inauguration of the ethane cracker unit
in Port Arthur last year, the start-up of the new PE unit is the second milestone of this joint venture aimed at establishing Baystar
as a fully integrated U.S. petrochemical player. The fruition of this venture also advances TotalEnergies ambition to grow in the United
States,” said Bernard Pinatel, President, Refining & Chemicals, TotalEnergies.
“The arrival of Borealis’ proprietary
Borstar technology in North America by way of Baystar marks, in line with our owners’ strategies, a crucial step for us in becoming
a global leader in advanced and sustainable chemicals and material solutions,” said Borealis CEO, Thomas Gangl. “Expanding
and deepening our footprint through Baystar enables us to better serve customers and partners by offering improved access to Borstar based
products produced right here in North America.”

***
About TotalEnergies
TotalEnergies is a global multi-energy company
that produces and markets energies: oil and biofuels, natural gas and green gases, renewables and electricity. Our more than 100,000 employees
are committed to energy that is ever more affordable, cleaner, more reliable and accessible to as many people as possible. Active in nearly
130 countries, TotalEnergies puts sustainable development in all its dimensions at the heart of its projects and operations to contribute
to the well-being of people.
TotalEnergies Contacts
Media Relations: +33 (0)1 47 44 46 99 l presse@totalenergies.com
l @TotalEnergiesPR
Investor Relations: +33 (0)1 47 44 46 46 l ir@totalenergies.com
|
@TotalEnergies | |
TotalEnergies | |
TotalEnergies |
|
TotalEnergies |
Cautionary Note
The terms “TotalEnergies”,
“TotalEnergies company” or “Company” in this document are used to designate TotalEnergies SE and the
consolidated entities that are directly or indirectly controlled by TotalEnergies SE. Likewise, the words “we”,
“us” and “our” may also be used to refer to these entities or to their employees. The entities in which
TotalEnergies SE directly or indirectly owns a shareholding are separate legal entities. This document may contain forward-looking
information and statements that are based on a number of economic data and assumptions made in a given economic, competitive and
regulatory environment. They may prove to be inaccurate in the future and are subject to a number of risk factors. Neither
TotalEnergies SE nor any of its subsidiaries assumes any obligation to update publicly any forward-looking information or statement,
objectives or trends contained in this document whether as a result of new information, future events or otherwise. Information
concerning risk factors, that may affect TotalEnergies’ financial results or activities is provided in the most recent
Universal Registration Document, the French-language version of which is filed by TotalEnergies SE with the French securities
regulator Autorité des Marchés Financiers (AMF), and in the Form 20-F filed with the United States Securities and
Exchange Commission (SEC).
Exhibit 99.4
|

|
PRESS RELEASE
|
Canada: TotalEnergies closes the sale of its 50% interest
in Surmont to ConocoPhillips and sells the remainder
of its Upstream Canadian assets to Suncor
Paris, October
4, 2023 – TotalEnergies EP Canada Ltd. has finalized today the sale to ConocoPhillips of its 50% interest in the Surmont
oil sands asset and associated midstream commitments. The transaction, for a base amount of C$4.03 billion (about US$3.0 billion) plus
up to C$440 million (about US$330 million) in contingent payments, has an effective date on April 1st, 2023. Including adjustments,
TotalEnergies received a cash payment at closing of C$3.7 billion (about US$2.75 billion). At current WCS (Western Canadian Select) prices
and production levels, TotalEnergies would receive the entirety of the contingent payments within a year.
TotalEnergies has also signed an agreement to sell
to Suncor the entirety of the shares of TotalEnergies EP Canada Ltd., comprising notably its participation in the Fort Hills oil sands
asset and associated midstream commitments. The consideration for this transaction is C$1.47 billion (about US$1.1 billion). Closing is
expected before the end of 2023.
“The disposal
of our Canadian oil sands assets fits our strategy to focus our allocation of capital to Oil & Gas assets with low breakeven. As announced
during our Investor Day on September 27th, proceeds from these divestments will be shared with our shareholders through $1.5
billion of buybacks in 2023, yielding an expected shareholder distribution of around 44% of our cash flow (CFFO) this year”, said
Jean-Pierre Sbraire, Chief Financial Officer of TotalEnergies.
* * *
About TotalEnergies
TotalEnergies is a global multi-energy company
that produces and markets energies: oil and biofuels, natural gas and green gases, renewables and electricity. Our more than 100,000 employees
are committed to energy that is ever more affordable, cleaner, more reliable and accessible to as many people as possible. Active in nearly
130 countries, TotalEnergies puts sustainable development in all its dimensions at the heart of its projects and operations to contribute
to the well-being of people.
TotalEnergies Contacts
Media Relations: +33 (0)1 47 44 46 99 l presse@totalenergies.com l
@TotalEnergiesPR
Investor Relations: +33 (0)1 47 44 46 46 l ir@totalenergies.com
|
@TotalEnergies | |
TotalEnergies | |
TotalEnergies |
|
TotalEnergies |
Cautionary Note
The terms “TotalEnergies”,
“TotalEnergies company” or “Company” in this document are used to designate TotalEnergies SE and the
consolidated entities that are directly or indirectly controlled by TotalEnergies SE. Likewise, the words “we”,
“us” and “our” may also be used to refer to these entities or to their employees. The entities in which
TotalEnergies SE directly or indirectly owns a shareholding are separate legal entities. This document may contain forward-looking
information and statements that are based on a number of economic data and assumptions made in a given economic, competitive and
regulatory environment. They may prove to be inaccurate in the future and are subject to a number of risk factors. Neither
TotalEnergies SE nor any of its subsidiaries assumes any obligation to update publicly any forward-looking information or statement,
objectives or trends contained in this document whether as a result of new information, future events or otherwise. Information
concerning risk factors, that may affect TotalEnergies’ financial results or activities is provided in the most recent
Universal Registration Document, the French-language version of which is filed by TotalEnergies SE with the French securities
regulator Autorité des Marchés Financiers (AMF), and in the Form 20-F filed with the United States Securities and
Exchange Commission (SEC).
Exhibit
99.5
|
|
 |
PRESS RELEASE |
Electric Mobility: TotalEnergies
Surpasses Milestone
of 1,000 High-Power Chargers in France
Paris/Lyon, October 6, 2023 – During
the inauguration of TotalEnergies’ fifth 100% electric service station in France (Relais Garibaldi in Lyon), Chairman and Chief
Executive Officer Patrick Pouyanné announced that the Company has now installed and operates more than 1,000 high-power chargers
(HPC) for electrical vehicles nationwide. This significant milestone in electric mobility makes TotalEnergies the No.1 player in ultra-fast
charging on France’s motorways and expressways.
As part of its strategy to support the development
of electric mobility, TotalEnergies has already installed HPC points at more than180 service stations in France. Its target for 2026 is
to reach 500 stations:
| § | 200 stations on main roads and corridors (motorways and bypasses) |
| § | 300 stations in cities, peri-urban and transit
areas (airports, train stations, tourist zones, etc.), one third of which will be 100% electric, like the station inaugurated today
in Lyon and those in Paris-La Défense, Metz, Courbevoie and Rouen. |
High-power charging (HPC) is a technology that
enables compatible electric vehicles to recharge at a power of over 50 kW and up to 300 kW. Depending on the type of vehicle, this power
enable to restore a range of 100 kilometers in 6 minutes, and recharge around 80% of the battery in around 20 minutes.
Committed to offering electric vehicle drivers
a seamless customer experience, TotalEnergies ensures that its high-power charging stations include comfortable waiting areas equipped
with sanitary and catering facilities, WiFi and access to all major payment options. Staff will also be present at all stations to greet
customers and provide information.
“By installing 1,000 HPC chargers, TotalEnergies
has demonstrated its commitment to help French households transition to electric mobility,” said Patrick Pouyanné, Chairman
and CEO of TotalEnergies. “With close to 250 stations equipped by end-2023, TotalEnergies will offer customers ultra-fasting
charging every 100 kilometers in cities and on motorways, consolidating its position as a leader in this segment in France.”
Beyond its service stations, TotalEnergies operates
around 18,000 charge points in France, spread across local municipalities, corporate fleets, peri-urban locations, parking lots and private
residences.
***
About TotalEnergies and electric mobility
With over 48,000 charge points in operation by
2023, TotalEnergies promotes the development of electric mobility on a large scale by investing significantly in the deployment of charging
infrastructures for electric vehicles, accessible to as many people as possible. The Company designs and develops mobility solutions to
enable its customers to travel with complete peace of mind.
To enable fast charging on highways and on key
traffic locations, the Company has already deployed 300 EV fast-charging hubs and is aiming for 1,000 sites by 2028 in Europe.
TotalEnergies supports its business customers in
their transition to electric mobility by offering them charge point deployment and supervision services, at work or at their employees'
homes. The Company also pursues its deployment in large metropolitan areas around the world, with a portfolio of more than 30,000 charge
points operated or being deployed in Paris, London, Brussels, Ghent, Antwerp, Flanders, Amsterdam and its region, Berlin, Singapore, Madrid.
TotalEnergies also offers charging solutions at
home for individuals, including an energy supply contract and connected charging services. From the production of renewable electricity
to the operation of the charging service, the Company is present across the entire value chain of electric mobility.
About TotalEnergies
TotalEnergies is a global multi-energy company
that produces and markets energies: oil and biofuels, natural gas and green gases, renewables and electricity. Our more than 100,000 employees
are committed to energy that is ever more affordable, cleaner, more reliable and accessible to as many people as possible. Active in nearly
130 countries, TotalEnergies puts sustainable development in all its dimensions at the heart of its projects and operations to contribute
to the well-being of people.
TotalEnergies Contacts
Media Relations: +33 (0)1 47 44 46 99 l presse@totalenergies.com l
@TotalEnergiesPR
Investor Relations: +33 (0)1 47 44 46 46 l ir@totalenergies.com
|
@TotalEnergies | |
TotalEnergies | |
TotalEnergies |
|
TotalEnergies |
Cautionary Note
The terms “TotalEnergies”, “TotalEnergies
company” or “Company” in this document are used to designate TotalEnergies SE and the consolidated entities that are
directly or indirectly controlled by TotalEnergies SE. Likewise, the words “we”, “us” and “our” may
also be used to refer to these entities or to their employees. The entities in which TotalEnergies SE directly or indirectly owns a shareholding
are separate legal entities. This document may contain forward-looking information and statements that are based on a number of economic
data and assumptions made in a given economic, competitive and regulatory environment. They may prove to be inaccurate in the future and
are subject to a number of risk factors. Neither TotalEnergies SE nor any of its subsidiaries assumes any obligation to update publicly
any forward-looking information or statement, objectives or trends contained in this document whether as a result of new information,
future events or otherwise. Information concerning risk factors, that may affect TotalEnergies’ financial results or activities
is provided in the most recent Universal Registration Document, the French-language version of which is filed by TotalEnergies SE with
the French securities regulator Autorité des Marchés Financiers (AMF), and in the Form 20-F filed with the United States
Securities and Exchange Commission (SEC).
Exhibit 99.6

Disclosure of Transactions in Own Shares
Paris, October 9, 2023 – In accordance
with the authorization given by the ordinary shareholders’ general meeting on May 26, 2023, to trade on its shares and pursuant
to applicable law on share repurchase, TotalEnergies SE (LEI: 529900S21EQ1BO4ESM68) declares the following purchases of its own shares
(FR0000120271) from October 2 to October 6, 2023:
| Transaction Date |
Total daily volume
(number of shares) |
Daily weighted
average purchase
price of shares
(EUR/share) |
Amount of
transactions (EUR) |
Market (MIC Code) |
| 02/10/2023 |
446,257 |
62.327508 |
27,814,086.74 |
XPAR |
| 02/10/2023 |
100,000 |
62.269990 |
6,226,999.00 |
CEUX |
| 02/10/2023 |
25,000 |
62.393434 |
1,559,835.85 |
TQEX |
| 02/10/2023 |
25,000 |
62.397212 |
1,559,930.30 |
AQEU |
| 03/10/2023 |
484,567 |
61.315380 |
29,711,409.74 |
XPAR |
| 03/10/2023 |
75,000 |
61.327575 |
4,599,568.13 |
CEUX |
| 03/10/2023 |
25,000 |
61.329586 |
1,533,239.65 |
TQEX |
| 03/10/2023 |
25,000 |
61.328425 |
1,533,210.63 |
AQEU |
| 04/10/2023 |
490,098 |
60.601901 |
29,700,870.48 |
XPAR |
| 04/10/2023 |
75,000 |
60.608255 |
4,545,619.13 |
CEUX |
| 04/10/2023 |
25,000 |
60.623146 |
1,515,578.65 |
TQEX |
| 04/10/2023 |
25,000 |
60.625784 |
1,515,644.60 |
AQEU |
| 05/10/2023 |
493,780 |
59.595053 |
29,426,845.27 |
XPAR |
| 05/10/2023 |
80,000 |
59.599837 |
4,767,986.96 |
CEUX |
| 05/10/2023 |
25,000 |
59.600717 |
1,490,017.93 |
TQEX |
| 05/10/2023 |
25,000 |
59.607313 |
1,490,182.83 |
AQEU |
| 06/10/2023 |
487,239 |
60.013126 |
29,240,735.50 |
XPAR |
| 06/10/2023 |
80,000 |
60.030491 |
4,802,439.28 |
CEUX |
| 06/10/2023 |
25,000 |
60.030205 |
1,500,755.13 |
TQEX |
| 06/10/2023 |
25,000 |
60.035270 |
1,500,881.75 |
AQEU |
| Total |
3,061,941 |
60.757486 |
186,035,837.51 |
|
Transaction details
In accordance with Article 5(1)(b) of Regulation (EU) No 596/2014 (the
Market Abuse Regulation) a full breakdown of the individual trades are disclosed on the TotalEnergies website: https://totalenergies.com/investors/shares-and-dividends/total-shares/info/company-share-transactions
About TotalEnergies
TotalEnergies is a global multi-energy company
that produces and markets energies: oil and biofuels, natural gas and green gases, renewables and electricity. Our more than 100,000 employees
are committed to energy that is ever more affordable, cleaner, more reliable and accessible to as many people as possible. Active in nearly
130 countries, TotalEnergies puts sustainable development in all its dimensions at the heart of its projects and operations to contribute
to the well-being of people.
TotalEnergies Contacts
Media Relations:+33 (0)1 47 44 46 99l presse@totalenergies.com
l @TotalEnergiesPR
Investor Relations:+33 (0)1 47 44 46 46 l ir@totalenergies.com
|
@TotalEnergies | |
TotalEnergies | |
TotalEnergies |
|
TotalEnergies |
Cautionary Note
The terms “TotalEnergies”, “TotalEnergies
company” or “Company” in this document are used to designate TotalEnergies SE and the consolidated entities that are
directly or indirectly controlled by TotalEnergies SE. Likewise, the words “we”, “us” and “our” may
also be used to refer to these entities or to their employees. The entities in which TotalEnergies SE directly or indirectly owns a shareholding
are separate legal entities. This document may contain forward-looking information and statements that are based on a number of economic
data and assumptions made in a given economic, competitive and regulatory environment. They may prove to be inaccurate in the future and
are subject to a number of risk factors. Neither TotalEnergies SE nor any of its subsidiaries assumes any obligation to update publicly
any forward-looking information or statement, objectives or trends contained in this document whether as a result of new information,
future events or otherwise. Information concerning risk factors, that may affect TotalEnergies’ financial results or activities
is provided in the most recent Universal Registration Document, the French-language version of which is filed by TotalEnergies SE with
the French securities regulator Autorité des Marchés Financiers (AMF), and in the Form 20-F filed with the United States
Securities and Exchange Commission (SEC).
Exhibit
99.7
 |
PRESS RELEASE |
Mozambique LNG: TotalEnergies’
response
Paris, October 11, 2023 – Following
the filing of a complaint against TotalEnergies for “manslaughter and a failure to assist people in danger" during the terrorist
attacks that took place in northern Mozambique in March 2021, the Company, which was not provided access to this complaint, would like,
first, to categorically reject these accusations and, second, to detail the emergency assistance provided by the Mozambique LNG teams
and the resources they mobilized to evacuate more than 2,500 people (civilians, personnel, contractors and subcontractors) from the Afungi
site where the Mozambique project is located.
The conflict in the Cabo Delgado province in northern
Mozambique predates gas development in the region and is linked to many factors unrelated to Mozambique LNG.
On March 24, 2021, there was a terrorist attack
in the Cabo Delgado province against the town of Palma, close to the Mozambique LNG project at the Afungi site. The Islamic terrorist
group known as Al-Shabaab subsequently claimed responsibility for the attack. The terrorist attack against the civilian population lasted
for several days. To the best of our knowledge, there exists no official count of the number of dead and missing civilians following the
Palma attack, but this tragic terrorist attack claimed many lives and caused part of the civilian population to flee the area.
Emergency aid provided and resources mobilized
by Mozambique LNG at the time of the terrorist attacks
Mozambique LNG implemented the measures required
by the emergency and following security procedures, including a pre-established evacuation plan. Given the exceptional nature of the situation,
Mozambique LNG evacuated a large number of civilians and provided emergency aid, medical care, and human and material resources to the
civilians sheltering in the entrance to the site.
As soon as the attacks had started and the situation
had been assessed, Mozambique LNG lent its assistance to the Mozambican authorities, namely by supplying fuel for the evacuation and rescue
operations.
The runway at the Afungi site was used by the authorities
of Mozambique and international organizations operating in the area to evacuate people by air.
Mozambique LNG employees distributed food and water
to civilians sheltering at the entrance to the Afungi site.
The Mozambique LNG medical teams were mobilized
to provide emergency medical assistance to injured civilians who were evacuated by air and sea from the Afungi site. The site’s
hospital was also made available. Mozambique LNG also evacuated more than 2,500 people, including many civilians by air and sea, especially
by chartering a ferry for this purpose. The resources mobilized to deal with the situation were quite exceptional for a company.
Regarding the blame made against TotalEnergies
for having refused to supply fuel to the South African private security company DAG, this company was contracted in 2020 by the
government of Mozambique to carry out offensive,
military security missions against terrorist groups in northern Mozambique. Security at the Afungi site was provided by government security
forces. During 2020, several NGOs reported serious crimes against local people supposedly perpetrated by DAG. For these reasons, Mozambique
LNG decided that it would not support the offensive military operations carried out by DAG but has provided its assistance in rescue operations
carried out under the authority of the government security forces.
Concerning the care of Mozambique LNG staff,
contractors and subcontractors during the attacks
The evacuation plan implemented in March 2021 in
the aftermath of the attack on Palma involved all personnel working on the Afungi site, including those of Mozambique LNG’s contractors
and their subcontractors.
It should be noted that, following the intensification
of the terrorist threat, the number of employees of Mozambique LNG, its contractors and their subcontractors was significantly reduced
in early 2021. The remaining mobilized personnel of Mozambique LNG, the contractors and their subcontractors were accommodated on the
Afungi site and were instructed to remain inside the site at all times for security reasons.
According to the information available to Mozambique
LNG, these instructions were passed on by Mozambique LNG’s contractors to their employees and subcontractors, and no contractor
has informed Mozambique LNG of the presence of employees outside the Afungi site. During the attack on Palma, Mozambique LNG ensured the
evacuation of all its personnel and subcontractors’ personnel from the Afungi site, as well as a large number of civilians.
In total, more than 2,500 people, half of whom
were personnel of Mozambique LNG and of its contractors and half civilians fleeing the combat zone, were evacuated from the Afungi site
by sea using a ferry mobilized by Mozambique LNG and by air (plane and helicopter).
Development of the situation following the March 2021 terrorist attacks
Given the deteriorated security situation in the
region, Mozambique LNG decided to withdraw all personnel from the Mozambique LNG project at the Afungi site. The situation led Mozambique
LNG to declare force majeure in April 2021.
The government of Mozambique is responsible for
restoring security: that is the prerogative of a sovereign state. Thanks to the efforts of the Mozambican government, with the support
of the South African Development Community and Rwanda, the security situation has improved significantly in Cabo Delgado since 2021, and
terrorist activities have decreased substantially.
Mozambique LNG monitors the security situation
on an ongoing basis with the assistance of internal and external experts. Several audits have been conducted and have confirmed the significant
improvement in the security situation in the Cabo Delgado region.
The decision to restart the project depends on
the ability to complete the project under good security conditions. This position is shared by all of Mozambique LNG’s partners.
Current activities on site are limited to strengthening security infrastructure and improving access roads.
In addition, Mozambique LNG is implementing a
major program of socio-economic initiatives for the local community to promote local economic development, contribute to the
stabilization of the area, and support local communities. This socio-economic program for Cabo Delgado is part of the Pamoja
Tunaweza initiative. This program followed on from the emergency humanitarian aid that was quickly deployed by Mozambique LNG after
the attacks on Palma, particularly the supply of food.
***
About TotalEnergies
TotalEnergies is a global multi-energy company
that produces and markets energies: oil and biofuels, natural gas and green gases, renewables and electricity. Our more than 100,000 employees
are committed to energy that is ever more affordable, cleaner, more reliable and accessible to as many people as possible. Active in nearly
130 countries, TotalEnergies puts sustainable development in all its dimensions at the heart of its projects and operations to contribute
to the well-being of people.
TotalEnergies Contacts
Media Relations: +33 (0)1 47 44 46 99 l presse@totalenergies.com l @TotalEnergiesPR
Investor Relations: +33 (0)1 47 44 46 46 l
ir@totalenergies.com
|
@TotalEnergies | |
TotalEnergies | |
TotalEnergies |
|
TotalEnergies |
Cautionary Note
The terms “TotalEnergies”, “TotalEnergies
company” or “Company” in this document are used to designate TotalEnergies SE and the consolidated entities that are
directly or indirectly controlled by TotalEnergies SE. Likewise, the words “we”, “us” and “our” may
also be used to refer to these entities or to their employees. The entities in which TotalEnergies SE directly or indirectly owns a shareholding
are separate legal entities. This document may contain forward-looking information and statements that are based on a number of economic
data and assumptions made in a given economic, competitive and regulatory environment. They may prove to be inaccurate in the future and
are subject to a number of risk factors. Neither TotalEnergies SE nor any of its subsidiaries assumes any obligation to update publicly
any forward-looking information or statement, objectives or trends contained in this document whether as a result of new information,
future events or otherwise. Information concerning risk factors, that may affect TotalEnergies’ financial results or activities
is provided in the most recent Universal Registration Document, the French-language version of which is filed by TotalEnergies SE with
the French securities regulator Autorité des Marchés Financiers (AMF), and in the Form 20-F filed with the United States
Securities and Exchange Commission (SEC).
Exhibit 99.8

Disclosure of Transactions
in Own Shares
Paris, October 16, 2023 – In accordance
with the authorization given by the ordinary shareholders’ general meeting on May 26, 2023, to trade on its shares and pursuant
to applicable law on share repurchase, TotalEnergies SE (LEI: 529900S21EQ1BO4ESM68) declares the following purchases of its own shares
(FR0000120271) from October 9 to October 13, 2023:
| Transaction Date |
Total daily volume
(number of shares) |
Daily weighted
average purchase
price of shares
(EUR/share) |
Amount of
transactions (EUR) |
Market (MIC Code) |
| 09/10/2023 |
474,957 |
|
61.415248 |
29,169,601.94 |
XPAR |
| 09/10/2023 |
80,000 |
|
61.445745 |
4,915,659.60 |
CEUX |
| 09/10/2023 |
25,000 |
|
61.442939 |
1,536,073.48 |
TQEX |
| 09/10/2023 |
25,000 |
|
61.440912 |
1,536,022.80 |
AQEU |
| 10/10/2023 |
471,223 |
|
61.508001 |
28,983,984.76 |
XPAR |
| 10/10/2023 |
80,000 |
|
61.497751 |
4,919,820.08 |
CEUX |
| 10/10/2023 |
25,000 |
|
61.489735 |
1,537,243.38 |
TQEX |
| 10/10/2023 |
25,000 |
|
61.490401 |
1,537,260.03 |
AQEU |
| 11/10/2023 |
470,935 |
|
62.443840 |
29,406,989.79 |
XPAR |
| 11/10/2023 |
75,000 |
|
62.445906 |
4,683,442.95 |
CEUX |
| 11/10/2023 |
20,000 |
|
62.466634 |
1,249,332.68 |
TQEX |
| 11/10/2023 |
25,000 |
|
62.472784 |
1,561,819.60 |
AQEU |
| 12/10/2023 |
471,502 |
|
62.330332 |
29,388,876.20 |
XPAR |
| 12/10/2023 |
75,000 |
|
62.319110 |
4,673,933.25 |
CEUX |
| 12/10/2023 |
20,000 |
|
62.325866 |
1,246,517.32 |
TQEX |
| 12/10/2023 |
25,000 |
|
62.327290 |
1,558,182.25 |
AQEU |
| 13/10/2023 |
468,689 |
|
63.157393 |
29,601,175.37 |
XPAR |
| 13/10/2023 |
75,000 |
|
63.159596 |
4,736,969.70 |
CEUX |
| 13/10/2023 |
20,000 |
|
63.155123 |
1,263,102.46 |
TQEX |
| 13/10/2023 |
25,000 |
|
63.161394 |
1,579,034.85 |
AQEU |
| Total |
2,977,306 |
62.165274 |
185,085,042.47 |
|
Transaction details
In accordance with Article 5(1)(b) of Regulation (EU) No 596/2014 (the
Market Abuse Regulation) a full breakdown of the individual trades are disclosed on the TotalEnergies website: https://totalenergies.com/investors/shares-and-dividends/total-shares/info/company-share-transactions
About TotalEnergies
TotalEnergies is a global multi-energy company
that produces and markets energies: oil and biofuels, natural gas and green gases, renewables and electricity. Our more than 100,000 employees
are committed to energy that is ever more affordable, cleaner, more reliable and accessible to as many people as possible. Active in nearly
130 countries, TotalEnergies puts sustainable development in all its dimensions at the heart of its projects and operations to contribute
to the well-being of people.
TotalEnergies Contacts
Media Relations:+33 (0)1 47 44 46 99l
presse@totalenergies.com l @TotalEnergiesPR
Investor Relations:+33 (0)1 47 44 46 46 l
ir@totalenergies.com
|
@TotalEnergies | |
TotalEnergies | |
TotalEnergies |
|
TotalEnergies |
Cautionary Note
The terms “TotalEnergies”, “TotalEnergies
company” or “Company” in this document are used to designate TotalEnergies SE and the consolidated entities that are
directly or indirectly controlled by TotalEnergies SE. Likewise, the words “we”, “us” and “our” may
also be used to refer to these entities or to their employees. The entities in which TotalEnergies SE directly or indirectly owns a shareholding
are separate legal entities. This document may contain forward-looking information and statements that are based on a number of economic
data and assumptions made in a given economic, competitive and regulatory environment. They may prove to be inaccurate in the future and
are subject to a number of risk factors. Neither TotalEnergies SE nor any of its subsidiaries assumes any obligation to update publicly
any forward-looking information or statement, objectives or trends contained in this document whether as a result of new information,
future events or otherwise. Information concerning risk factors, that may affect TotalEnergies’ financial results or activities
is provided in the most recent Universal Registration Document, the French-language version of which is filed by TotalEnergies SE with
the French securities regulator Autorité des Marchés Financiers (AMF), and in the Form 20-F filed with the United States
Securities and Exchange Commission (SEC).
Exhibit 99.9
 |
PRESS RELEASE |
Scotland: TotalEnergies Commissions
Its Biggest Offshore Wind Farm
Paris, October 17th, 2023 –
TotalEnergies and its partner SSE Renewables are pleased to announce that their Seagreen offshore wind farm is now fully operational and
running at its design capacity of 1,075 MW.
Seagreen is a joint venture between TotalEnergies
(51%) and SSE Renewables (49%). It is located in the North Sea, some 27 km off the coast of Angus. It is TotalEnergies’ biggest
operational offshore wind farm worldwide and the world’s deepest fixed bottom wind farm, with its foundation reaching nearly 60
meters below sea level.
The project, which began construction in June 2020,
has been completed in around 3 years for a global investment of around $4 billion, globally in line with the expected capex. The development
and construction were led, with the support of TotalEnergies, by SSE which will now operate the offshore wind farm for its expected 25-year
lifetime.
The 1,075 MW offshore wind farm has the capacity
to generate around 5 terawatt hours (TWh), or enough renewable electricity to power almost 1.6 million homes annually, equivalent to two-thirds
of all Scottish homes. Seagreen will also prevent the emission of over 2 million tons of CO2 from
fossil fuel electricity generation every year.
Consistently with its business model, TotalEnergies
will commercialize, through Seagreen, its share of production through a mix of a long-term contract at guaranteed price, including a 15-year
CfD (Contract for Difference) awarded by the UK Government, and a 15-year private CfD with the SSE Group, and short-term sales on the
wholesale market.
« I am very pleased to see Seagreen generating
at full power, making it TotalEnergies’ biggest offshore wind farm worldwide. This 1 GW project is a new step in delivering our
strategy of building a world-class, cost-competitive portfolio of renewable energy to deliver clean, reliable and affordable power to
our customers. It will positively contribute to achieving our Integrated Power 12% profitability target and our objective of reaching
more than 100 TWh of power generation by 2030, » said Patrick Pouyanné, Chairman and CEO of TotalEnergies. «
Our participation in the project alongside SSE has enabled us to strengthen our offshore wind expertise which will be extremely useful
for our future projects in the United Kingdom, the United-States and Germany. It's also very good news for Scotland, as Seagreen makes
a significant contribution to the country’s net zero ambition for 2045. »
« The Seagreen offshore windfarm is a
fantastic example of the work being done to unleash Scotland’s renewable potential, as we seek to lead the world in the transition
to net zero, » said the First Minister of Scotland, Humza Yousaf. « This significant milestone for Seagreen
is also significant for Scotland, taking us a step closer to creating a net zero energy system that delivers affordable, secure and clean
energy. Delivering on our climate obligations is an absolute priority for the Scottish Government – so too is our unwavering commitment
to a just transition for workers. We are determined to maximize the economic opportunity Scotland’s offshore wind potential presents,
by developing local supply chains, embedding innovation, boosting skills, creating jobs, and benefiting people and communities. »
« This is a big milestone for Seagreen
and for Scotland. It shows that this country not only has world-class renewable resources but also world-class teams able to deliver major
clean energy projects at scale. Seagreen’s ability to power up to 1.6 million homes will make a significant contribution to energy
security and extend Scotland and the UK’s leadership in clean energy generation, » said Alistair Phillips-Davies, Chief
Executive of SSE plc. « But if we are to fully realise this country’s potential we need many more Seagreens and we
look forward to working with governments, partners, investors and local communities to bring more landmark projects like this forward
in the future. »
***
TotalEnergies and offshore wind
TotalEnergies’ portfolio in offshore wind
has a total capacity of more than 13 GW, with most farms bottom-fixed. These projects are located in the United Kingdom (Seagreen, Outer
Dowsing, West of Orkney, Erebus), South Korea (Bada), Taiwan (Yunlin, Haiding 2), France (Eolmed), the United States (Attentive Energy
and North Carolina), and Germany (N-12.1 and 0-2.2). The Company has also been qualified to participate in competitive tenders in the
US, UK, and France, and will participate in tenders in Norway and Poland.
TotalEnergies and electricity
As part of its ambition to get to net zero by 2050,
TotalEnergies is building a world class cost-competitive portfolio combining renewables (solar, onshore and offshore wind) and flexible
assets (CCGT, storage) to deliver clean firm power to its customers. In 2022, TotalEnergies generated more than 33 TWh of electricity,
and had a gross renewable electricity generation installed capacity of 17 GW. TotalEnergies will continue to expand this business to grow
its power generation to more than 100 TWh by 2030, with the objective of being among the world's top 5 producers of electricity from wind
and solar energy.
About TotalEnergies
TotalEnergies is a global multi-energy company
that produces and markets energies: oil and biofuels, natural gas and green gases, renewables and electricity. Our more than 100,000 employees
are committed to energy that is ever more affordable, cleaner, more reliable and accessible to as many people as possible. Active in nearly
130 countries, TotalEnergies puts sustainable development in all its dimensions at the heart of its projects and operations to contribute
to the well-being of people.
TotalEnergies Contacts
Media Relations: +33 (0)1 47 44 46 99 l presse@totalenergies.com
l @TotalEnergiesPR
Investor Relations: +33 (0)1 47 44 46 46 l ir@totalenergies.com
|
@TotalEnergies | |
TotalEnergies | |
TotalEnergies |
|
TotalEnergies |
Cautionary Note
The terms “TotalEnergies”, “TotalEnergies
company” or “Company” in this document are used to designate TotalEnergies SE and the consolidated entities that are
directly or indirectly controlled by TotalEnergies SE. Likewise, the words “we”, “us” and “our” may
also be used to refer to these entities or to their employees. The entities in which TotalEnergies SE directly or indirectly owns a shareholding
are separate legal entities. This document may contain forward-looking information and statements that are based on a number of economic
data and assumptions made in a given economic, competitive and regulatory environment. They may prove to be inaccurate in the future
and are subject to a number of risk factors. Neither TotalEnergies SE nor any of its subsidiaries assumes any obligation to update publicly
any forward-looking information or statement, objectives or trends contained in this document whether as a result of new information,
future events or otherwise. Information concerning risk factors, that may affect TotalEnergies’ financial results or activities
is provided in the most recent Universal Registration Document, the French-language version of which is filed by TotalEnergies SE with
the French securities regulator Autorité des Marchés Financiers (AMF), and in the Form 20-F filed with the United States
Securities and Exchange Commission (SEC).
Exhibit
99.10
 |
PRESS RELEASE |
United States: TotalEnergies
joins forces with Corio and Rise
to develop 3+ GW wind project offshore New York & New Jersey
Paris / New York, October 23, 2023 –
TotalEnergies today announces it partnered with Corio Generation (Corio), an offshore wind developer, and Rise Light & Power (Rise),
a New York-based electricity producer, for the joint development of the Attentive Energy offshore wind project off the coast of
New York and New Jersey.
Corio and Rise took respective stakes of 27.7%
and 16.3% in the Attentive Energy project. Rise will also contribute its assets and interconnection capabilities in New York City
to the project. In exchange, TotalEnergies, which retains the remaining 56%, received a total cash consideration of $420 million. TotalEnergies
had secured, in February 2022, 100% of maritime lease OCS-A 0538 at the New York Bight auction.
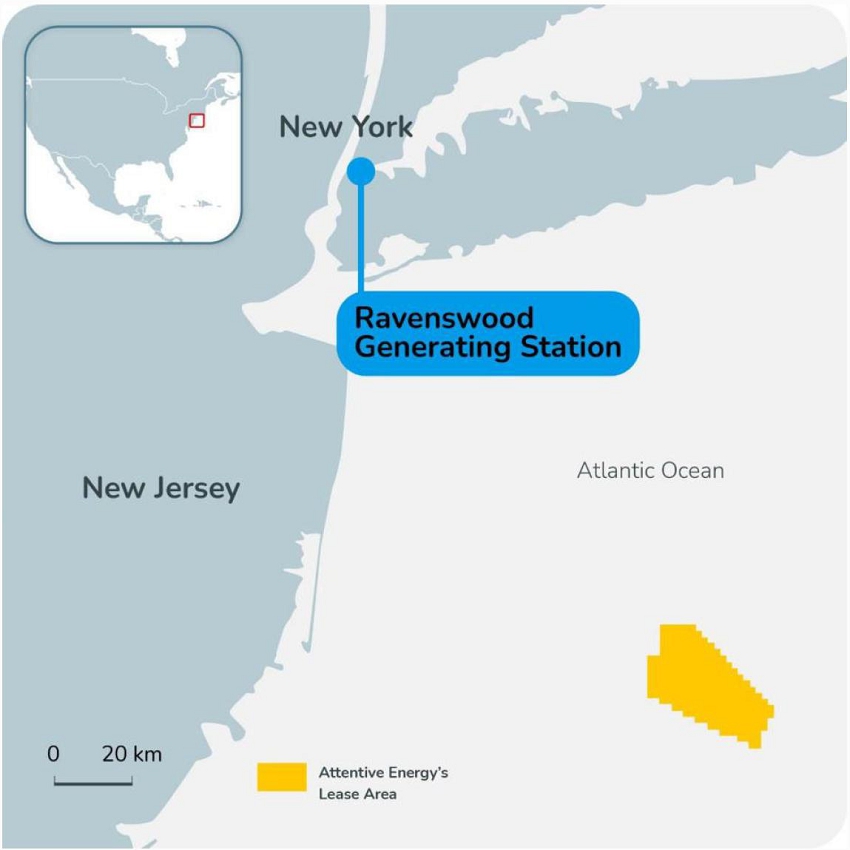
The Attentive Energy project aims to develop
more than 3 gigawatts (GW) of offshore wind located 54 miles from New York State and 42 miles from New Jersey shores. Once built, the
project will provide green electricity for more than a million homes across the two states.
The alliance of three leaders for an integrated and innovative offshore
wind project
Through this partnership, TotalEnergies reinforces
its ability, as operator, to deliver a robust offshore wind project with attractive returns, which will help supply green electricity
to New York City. Under the terms of the agreement, Rise will manage the project’s interconnection at its Ravenswood Generating
Station and begin the retirement of its gas generators. This iconic site, a pillar of New York City's energy system, will be transformed
into a green energy hub where Attentive Energy will base its operations and maintenance activities.
Corio will bring its extensive experience as a
global offshore wind developer. With over 30 GW under development in Europe, Asia-Pacific and the Americas, Corio owns one of the world’s
largest offshore wind project portfolios.
“TotalEnergies is delighted to partner
with Corio and Rise to profitably develop a major offshore wind project that will provide greener electricity to the residents of New
York and New Jersey”, said Vincent Stoquart, Senior Vice President Renewables at TotalEnergies. “This
partnership reinforces TotalEnergies’ capacity to actively develop its presence in the U.S. renewables space where the Company has
a 25 GW portfolio of projects, in operation or development, including 4 GW in offshore wind. We are also happy to contribute, through
the Attentive Energy project, to the reduction of greenhouse gas emissions in New York and New Jersey, and support the U.S. government’s
goal to develop 30 GW of offshore wind in the country by 2030.”
***
TotalEnergies and offshore wind
TotalEnergies’ portfolio in offshore wind
has a total capacity of more than 13 GW, with most farms bottom-fixed. These projects are located in the United Kingdom (Seagreen, Outer
Dowsing, West of Orkney, Erebus), South Korea (Bada), Taiwan (Yunlin, Haiding 2), France (Eolmed), the United States (Attentive Energy
and North Carolina), and Germany (N-12.1 and 0-2.2).
TotalEnergies and electricity
As part of its ambition to get to net zero by
2050, TotalEnergies is building a world class cost-competitive portfolio combining renewables (solar, onshore and offshore wind) and
flexible assets (CCGT, storage) to deliver clean firm power to its customers. In 2022, TotalEnergies generated more than 33 TWh of electricity,
and had a gross renewable electricity generation installed capacity of 17 GW. TotalEnergies will continue to expand this business to
grow its power generation to more than 100 TWh by 2030, with the objective of being among the world's top 5 producers of electricity
from wind and solar energy.
About TotalEnergies
TotalEnergies is a global multi-energy company
that produces and markets energies: oil and biofuels, natural gas and green gases, renewables and electricity. Our more than 100,000 employees
are committed to energy that is ever more affordable, cleaner, more reliable and accessible to as many people as possible. Active in nearly
130 countries, TotalEnergies puts sustainable development in all its dimensions at the heart of its projects and operations to contribute
to the well-being of people.
TotalEnergies Contacts
Media Relations: +33 (0)1 47 44 46 99 l presse@totalenergies.com
l @TotalEnergiesPR
Investor Relations: +33 (0)1 47 44 46 46 l ir@totalenergies.com
|
@TotalEnergies | |
TotalEnergies | |
TotalEnergies |
|
TotalEnergies |
The terms “TotalEnergies”, “TotalEnergies
company” or “Company” in this document are used to designate TotalEnergies SE and the consolidated entities that are
directly or indirectly controlled by TotalEnergies SE. Likewise, the words “we”, “us” and “our” may
also be used to refer to these entities or to their employees. The entities in which TotalEnergies SE directly or indirectly owns a shareholding
are separate legal entities. This document may contain forward-looking information and statements that are based on a number of economic
data and assumptions made in a given economic, competitive and regulatory environment. They may prove to be inaccurate in the future and
are subject to a number of risk factors. Neither TotalEnergies SE nor any of its subsidiaries assumes any obligation to update publicly
any forward-looking information or statement, objectives or trends contained in this document whether as a result of new information,
future events or otherwise. Information concerning risk factors, that may affect TotalEnergies’ financial results or activities
is provided in the most recent Universal Registration Document, the French-language version of which is filed by TotalEnergies SE with
the French securities regulator Autorité des Marchés Financiers (AMF), and in the Form 20-F filed with the United States
Securities and Exchange Commission (SEC).
Exhibit
99.11
Disclosure
of Transactions in Own Shares
Paris,
October 23, 2023 – In accordance with the authorization
given by the ordinary shareholders’ general meeting on May 26, 2023, to trade on its shares and pursuant to applicable law
on share repurchase, TotalEnergies SE (LEI: 529900S21EQ1BO4ESM68) declares the following purchases of its own shares (FR0000120271) from
October 16 to October 20, 2023:
| Transaction Date |
Total daily volume
(number of shares) |
Daily weighted
average purchase
price of shares
(EUR/share) |
Amount of
transactions (EUR) |
Market (MIC Code) |
| 16/10/2023 |
471,728 |
|
63.280795 |
29,851,322.86 |
XPAR |
| 16/10/2023 |
80,000 |
|
63.292387 |
5,063,390.96 |
CEUX |
| 16/10/2023 |
15,000 |
|
63.313399 |
949,700.99 |
TQEX |
| 16/10/2023 |
20,000 |
|
63.320920 |
1,266,418.40 |
AQEU |
| 17/10/2023 |
445,864 |
|
63.183687 |
28,171,331.42 |
XPAR |
| 17/10/2023 |
105,000 |
|
63.228711 |
6,639,014.66 |
CEUX |
| 17/10/2023 |
15,000 |
|
63.188451 |
947,826.77 |
TQEX |
| 17/10/2023 |
20,000 |
|
63.190023 |
1,263,800.46 |
AQEU |
| 18/10/2023 |
446,004 |
|
63.745392 |
28,430,699.81 |
XPAR |
| 18/10/2023 |
100,000 |
|
63.741289 |
6,374,128.90 |
CEUX |
| 18/10/2023 |
15,000 |
|
63.748289 |
956,224.34 |
TQEX |
| 18/10/2023 |
20,000 |
|
63.747807 |
1,274,956.14 |
AQEU |
| 19/10/2023 |
463,225 |
|
63.008134 |
29,186,942.87 |
XPAR |
| 19/10/2023 |
90,000 |
|
62.985772 |
5,668,719.48 |
CEUX |
| 19/10/2023 |
15,000 |
|
62.998863 |
944,982.95 |
TQEX |
| 19/10/2023 |
20,000 |
|
62.993988 |
1,259,879.76 |
AQEU |
| 20/10/2023 |
459,963 |
|
63.156383 |
29,049,599.39 |
XPAR |
| 20/10/2023 |
90,000 |
|
63.162989 |
5,684,669.01 |
CEUX |
| 20/10/2023 |
15,000 |
|
63.163910 |
947,458.65 |
TQEX |
| 20/10/2023 |
20,000 |
|
63.167575 |
1,263,351.50 |
AQEU |
| Total |
2,926,784 |
63.275739 |
185,194,419.31 |
|
Transaction
details
In
accordance with Article 5(1)(b) of Regulation (EU) No 596/2014 (the Market Abuse Regulation) a full breakdown of the individual
trades are disclosed on the TotalEnergies website: https://totalenergies.com/investors/shares-and-dividends/total-shares/info/company-share-transactions
About
TotalEnergies
TotalEnergies
is a global multi-energy company that produces and markets energies: oil and biofuels, natural gas and green gases, renewables and electricity.
Our more than 100,000 employees are committed to energy that is ever more affordable, cleaner, more reliable and accessible to as many
people as possible. Active in nearly 130 countries, TotalEnergies puts sustainable development in all its dimensions at the heart of
its projects and operations to contribute to the well-being of people.
TotalEnergies
Contacts
Media
Relations:+33 (0)1 47 44 46 99 l presse@totalenergies.com l @TotalEnergiesPR
Investor
Relations:+33 (0)1 47 44 46 46 l ir@totalenergies.com
|
@TotalEnergies | |
TotalEnergies | |
TotalEnergies |
|
TotalEnergies |
Cautionary
Note
The
terms “TotalEnergies”, “TotalEnergies company” or “Company” in this document are used to designate
TotalEnergies SE and the consolidated entities that are directly or indirectly controlled by TotalEnergies SE. Likewise, the words “we”,
“us” and “our” may also be used to refer to these entities or to their employees. The entities in which TotalEnergies
SE directly or indirectly owns a shareholding are separate legal entities. This document may contain forward-looking information and
statements that are based on a number of economic data and assumptions made in a given economic, competitive and regulatory environment.
They may prove to be inaccurate in the future and are subject to a number of risk factors. Neither TotalEnergies SE nor any of its subsidiaries
assumes any obligation to update publicly any forward-looking information or statement, objectives or trends contained in this document
whether as a result of new information, future events or otherwise. Information concerning risk factors, that may affect TotalEnergies’
financial results or activities is provided in the most recent Universal Registration Document, the French-language version of which
is filed by TotalEnergies SE with the French securities regulator Autorité des Marchés Financiers (AMF), and in the Form 20-F
filed with the United States Securities and Exchange Commission (SEC).
Exhibit
99.12
 |
PRESS
RELEASE |
United
States: TotalEnergies Starts Up in Texas a 380 MW
Utility-Scale Solar Power Plant with Battery Storage
Paris / Houston,
October 24, 2023 – TotalEnergies has started commercial operations of Myrtle Solar, its utility-scale operated solar
farm in the United States.
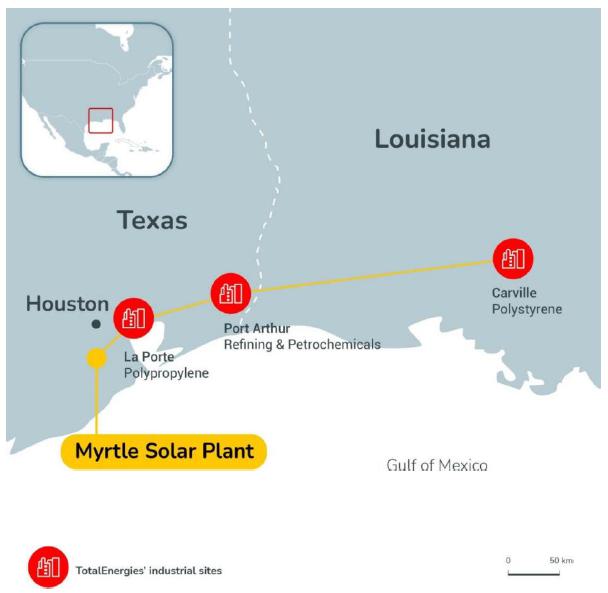
Located south of Houston, Texas, Myrtle has a capacity
of 380 megawatts peak (MWp) of solar production and 225 MWh of co-located batteries. With 705,000 ground-mounted photovoltaic panels installed
over an area equivalent to 1,800 American football fields, Myrtle produces enough green electricity to cover the equivalent consumption
of 70,000 homes.
70% of Myrtle’s capacity will supply green
electricity to the Company’s industrial plants in the U.S. Gulf Coast region. It is part of the Company’s “Go Green”
Project, which will enable the Company to cover, by 2025, the power needs and curtail the Scope 1+2 emissions of its industrial sites
in Port Arthur and La Porte in Texas, and Carville in Louisiana.
The remaining 30% of Myrtle’s capacity will
supply green electricity to Kilroy Realty, a publicly traded real estate company, under a 15-year corporate power purchase agreement (CPPA)
indexed on merchant prices.
In addition to the photovoltaic installations,
the solar power plant also features battery energy storage equipment to meet the need for grid stabilization. With a total capacity of
225 MWh, this storage is made of 114 high-tech Energy Storage Systems (ESS) containers designed and assembled by TotalEnergies' affiliate
Saft, which develops cutting-edge industrial batteries.
The Myrtle project, which benefits from the IRA
(Inflation Reduction Act) Tax Credit mechanisms, will positively contribute to TotalEnergies’ Integrated Power’s profitability
target of 12%.
“We are
very proud to start up Myrtle, TotalEnergies’ largest-to-date operated utility-scale solar farm with storage in the United States.
This startup is another milestone in achieving our goal to build an integrated and profitable position in Texas, where ERCOT is the main
electrical grid operator. Besides, the project will enable the Company to cover the power needs of some of its biggest U.S. industrial
sites with electricity from a renewable source,” said Vincent Stoquart, Senior Vice President, Renewables at TotalEnergies.
“Given the advantages that IRA tax exemptions are generating, we will continue to actively develop our 25 GW portfolio of
projects in operation or development in the United States, to contribute to the Company’s global power generation target of more
than 100 TWh by 2030.”
***
*Myrtle was initially developed by SunChase Power
and Eolian
***
TotalEnergies in the U.S
Operating in the United States since 1957, TotalEnergies
is focused on identifying opportunities to meet growing energy needs while reducing carbon emissions. With a presence in more than 30
U.S. states, the Company is developing an integrated portfolio combining 25 GW of operated and non-operated solar and wind projects, storage,
and trading. It is also the number one U.S. exporter of LNG, a critical partner for intermittent renewable energies.
TotalEnergies and electricity
As part of its ambition to get to net zero by 2050,
TotalEnergies is building a world class cost-competitive portfolio combining renewables (solar, onshore and offshore wind) and flexible
assets (CCGT, storage) to deliver clean firm power to its customers. In 2022, TotalEnergies generated more than 33 TWh of electricity,
and had a gross renewable electricity generation installed capacity of 17 GW. TotalEnergies will continue to expand this business to grow
its power generation to more than 100 TWh by 2030, with the objective of being among the world's top 5 producers of electricity from wind
and solar energy.
About TotalEnergies
TotalEnergies is a global multi-energy company
that produces and markets energies: oil and biofuels, natural gas and green gases, renewables and electricity. Our more than 100,000 employees
are committed to energy that is ever more affordable, cleaner, more reliable and accessible to as many people as possible. Active in nearly
130 countries, TotalEnergies puts sustainable development in all its dimensions at the heart of its projects and operations to contribute
to the well-being of people.
TotalEnergies
Contacts
Media
Relations:+33 (0)1 47 44 46 99 l presse@totalenergies.com l @TotalEnergiesPR
Investor
Relations:+33 (0)1 47 44 46 46 l ir@totalenergies.com
|
@TotalEnergies | |
TotalEnergies | |
TotalEnergies |
|
TotalEnergies |
Cautionary Note
The terms “TotalEnergies”, “TotalEnergies
company” or “Company” in this document are used to designate TotalEnergies SE and the consolidated entities that are
directly or indirectly controlled by TotalEnergies SE. Likewise, the words “we”, “us” and “our” may
also be used to refer to these entities or to their employees. The entities in which TotalEnergies SE directly or indirectly owns a shareholding
are separate legal entities. This document may contain forward-looking information and statements that are based on a number of economic
data and assumptions made in a given economic, competitive and regulatory environment. They may prove to be inaccurate in the future and
are subject to a number of risk factors. Neither TotalEnergies SE nor any of its subsidiaries assumes any obligation to update publicly
any forward-looking information or statement, objectives or trends contained in this document whether as a result of new information,
future events or otherwise. Information concerning risk factors, that may affect TotalEnergies’ financial results or activities
is provided in the most recent Universal Registration Document, the French-language version of which is filed by TotalEnergies SE with
the French securities regulator Autorité des Marchés Financiers (AMF), and in the Form 20-F filed with the United States
Securities and Exchange Commission (SEC).
Exhibit 99.13
 |
PRESS
RELEASE |
United States: TotalEnergies Awarded a 25-year
Contract to
Supply 1.4 GW of Renewable Electricity to New York
New York/Paris,
October 25, 2023 – TotalEnergies and its partners, Corio Generation (Corio) and Rise Light & Power (Rise)
announce that New York State selected their Attentive Energy One project for a 25-year contract to supply 1.4 GW of renewable electricity.
Attentive Energy
One, a joint venture between TotalEnergies (40%), Rise (35%) and Corio (25%), received the provisional award in the State’s
2023 competitive OREC (Offshore Renewable Energy Credits) solicitation, organized by New York State Energy and Research Development Authority
(NYSERDA). The Consortium aims to commission this project in 2029.
NYSERDA has put a particular emphasis on the local
content of the proposal: the Attentive Energy One project will enable the construction of a new General Electric facility to manufacture
offshore wind blades and nacelles and unlock $300 million in investments in various community-focused projects across New York State.
It will in addition turn the Ravenswood gas-fueled power plant owned by Rise, into a clean energy hub at the heart of New York City.
The profitability of this project is ensured by
the guaranteed level of OREC revenue, the benefit of a 40% IRA tax credit, the secured access to New York electricity grid brought by
Rise and the local supply of turbines by General Electric at a competitive set price. Moreover, the contract awarded by NYSERDA will include
an inflation adjustment mechanism to compensate for changes in construction costs until the final investment decision.
“We are
honored that the State of New York chose Attentive Energy One to deliver on the promise of bringing green electricity to hundreds of thousands
of homes and businesses. Together with our partners Corio and Rise, we will mobilize all our expertise to develop a major offshore wind
project that will contribute to New York State’s greenhouse gas emissions reduction targets,” said Vincent Stoquart,
Senior Vice President Renewables at TotalEnergies. “Thanks to this project’s secured offtake price and competitive
advantages such as the 40% IRA tax credit and its very competitive interconnection, Attentive Energy One project will contribute positively
to our Integrated Power profitability target of 12% and to our ambition of more than 100 TWh of power generation by 2030.”
TotalEnergies had secured, in February 2022,
100% of maritime lease OCS-A 0538 at the New York Bight auction. It then partnered with New York-based electricity producer Rise and global
offshore wind developer Corio to join forces in the development of the Attentive Energy offshore wind projects.
The lease’s 3 GW capacity will serve two
projects: Attentive Energy One, which is dedicated to deliver New York State, and Attentive Energy Two, which is dedicated
to supply New Jersey. Together, these two projects aim to provide green electricity to more than a million homes across both states.
***
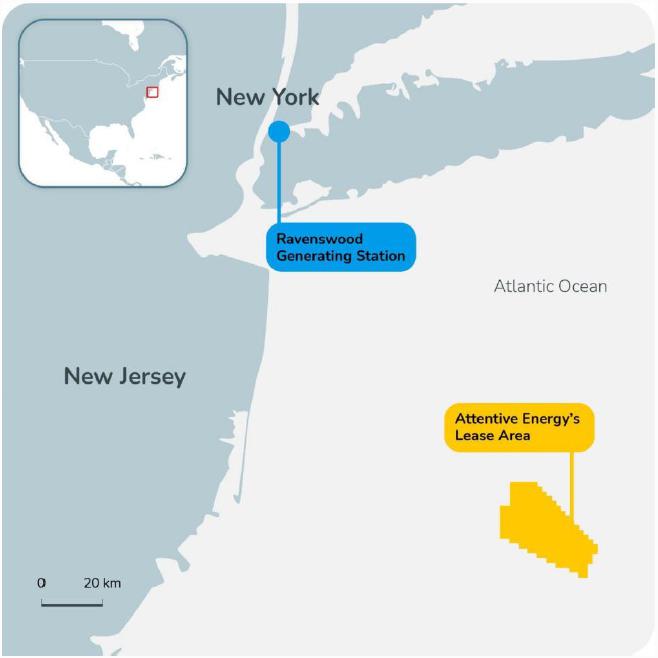
***
TotalEnergies in the U.S
Operating in the United States since 1957, TotalEnergies
is focused on identifying opportunities to meet growing energy needs while reducing carbon emissions. With a presence in more than 30
U.S. states, the Company is developing an integrated portfolio combining 25 GW of operated and non-operated solar and wind projects, storage,
and trading. It is also the number one U.S. exporter of LNG, a critical partner for intermittent renewable energies.
TotalEnergies and electricity
As part of its ambition to get to net zero by 2050,
TotalEnergies is building a world class cost-competitive portfolio combining renewables (solar, onshore and offshore wind) and flexible
assets (CCGT, storage) to deliver clean firm power to its customers. In 2022, TotalEnergies generated more than 33 TWh of electricity,
of which more than 10 TWh came from renewables. TotalEnergies will continue to expand this business to grow its power generation to more
than 100 TWh by 2030, with the objective of being among the world's top players in this sector.
About TotalEnergies
TotalEnergies is a global multi-energy company
that produces and markets energies: oil and biofuels, natural gas and green gases, renewables and electricity. Our more than 100,000 employees
are committed to energy that is ever more affordable, cleaner, more reliable and accessible to as many people as possible. Active in nearly
130 countries, TotalEnergies puts sustainable development in all its dimensions at the heart of its projects and operations to contribute
to the well-being of people.
TotalEnergies
Contacts
Media
Relations:+33 (0)1 47 44 46 99 l presse@totalenergies.com l @TotalEnergiesPR
Investor
Relations:+33 (0)1 47 44 46 46 l ir@totalenergies.com
|
@TotalEnergies | |
TotalEnergies | |
TotalEnergies |
|
TotalEnergies |
Cautionary Note
The terms “TotalEnergies”, “TotalEnergies
company” or “Company” in this document are used to designate TotalEnergies SE and the consolidated entities that are
directly or indirectly controlled by TotalEnergies SE. Likewise, the words “we”, “us” and “our” may
also be used to refer to these entities or to their employees. The entities in which TotalEnergies SE directly or indirectly owns a shareholding
are separate legal entities. This document may contain forward-looking information and statements that are based on a number of economic
data and assumptions made in a given economic, competitive and regulatory environment. They may prove to be inaccurate in the future and
are subject to a number of risk factors. Neither TotalEnergies SE nor any of its subsidiaries assumes any obligation to update publicly
any forward-looking information or statement, objectives or trends contained in this document whether as a result of new information,
future events or otherwise. Information concerning risk factors, that may affect TotalEnergies’ financial results or activities
is provided in the most recent Universal Registration Document, the French-language version of which is filed by TotalEnergies SE with
the French securities regulator Autorité des Marchés Financiers (AMF), and in the Form 20-F filed with the United States
Securities and Exchange Commission (SEC).
Exhibit 99.14
 |
PRESS
RELEASE |
France: TotalEnergies Commissions its
LNG Floating Terminal
in the Port of Le Havre
Paris, October 26,
2023 – TotalEnergies announces the commissioning of the Cape Ann, its floating
storage and regasification unit (FSRU) for liquefied natural gas (LNG) located in the port of Le Havre. The terminal injected its first
megawatt-hours (MWh) of gas into the grid operated by GRTgaz, using LNG from Norway.
TotalEnergies has contracted 50% of the terminal's
annual capacity of around 5 billion cubic meters, to supply it with LNG from its global portfolio. The remaining capacity will be marketed
according to rules approved by the regulator.
Cape Ann in Key Figures
| - | Maximum regasification capacity: 5
billion cubic meters per year, or around 10% of French consumption |
| - | Storage capacity: 142,500 cubic meters |
| - | Vessel dimensions: 283 meters x 43.40 meters |
| - | Deadweight: 112,457 tons |
| - | Date of first launch: June 2010 |
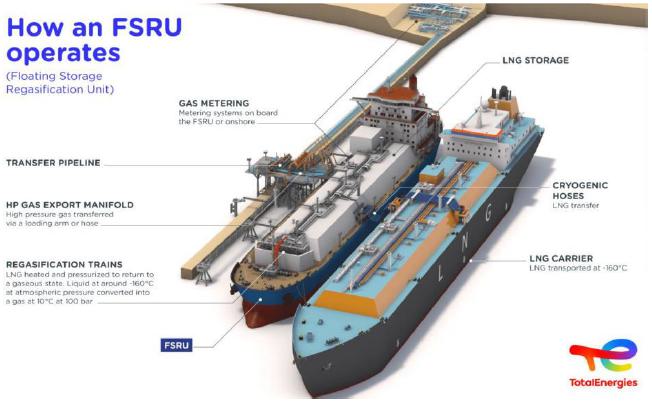
***
TotalEnergies,
the world’s third largest LNG player and Europe’s leading regasification player TotalEnergies is the world’s
third largest LNG player with a market share of around 12% and a global portfolio of about 50 Mt/y thanks to its interests in liquefaction
plants in all geographies. The Company benefits from an integrated position across the LNG value chain, including production, transportation,
access to more than 20 Mt/y of regasification capacity in Europe, trading, and LNG bunkering. TotalEnergies’ ambition is to increase
the share of natural gas in its sales mix to close to 50% by 2030, to reduce carbon emissions and eliminate methane emissions associated
with the gas value chain, and to work with local partners to promote the transition from coal to natural gas.
About TotalEnergies
TotalEnergies is a global multi-energy company
that produces and markets energies: oil and biofuels, natural gas and green gases, renewables and electricity. Our more than 100,000
employees are committed to energy that is ever more affordable, cleaner, more reliable and accessible to as many people as possible.
Active in nearly 130 countries, TotalEnergies puts sustainable development in all its dimensions at the heart of its projects and operations
to contribute to the well-being of people.
TotalEnergies
Contacts
Media
Relations:+33 (0)1 47 44 46 99 l presse@totalenergies.com l @TotalEnergiesPR
Investor
Relations:+33 (0)1 47 44 46 46 l ir@totalenergies.com
|
@TotalEnergies | |
TotalEnergies | |
TotalEnergies |
|
TotalEnergies |
Cautionary Note
The terms “TotalEnergies”, “TotalEnergies
company” or “Company” in this document are used to designate TotalEnergies SE and the consolidated entities that are
directly or indirectly controlled by TotalEnergies SE. Likewise, the words “we”, “us” and “our” may
also be used to refer to these entities or to their employees. The entities in which TotalEnergies SE directly or indirectly owns a shareholding
are separate legal entities. This document may contain forward-looking information and statements that are based on a number of economic
data and assumptions made in a given economic, competitive and regulatory environment. They may prove to be inaccurate in the future
and are subject to a number of risk factors. Neither TotalEnergies SE nor any of its subsidiaries assumes any obligation to update publicly
any forward-looking information or statement, objectives or trends contained in this document whether as a result of new information,
future events or otherwise. Information concerning risk factors, that may affect TotalEnergies’ financial results or activities
is provided in the most recent Registration Document, the French-language version of which is filed by TotalEnergies SE with the French
securities regulator Autorité des Marchés Financiers (AMF), and in the Form 20-F filed with the United States Securities
and Exchange Commission (SEC).
Exhibit
99.15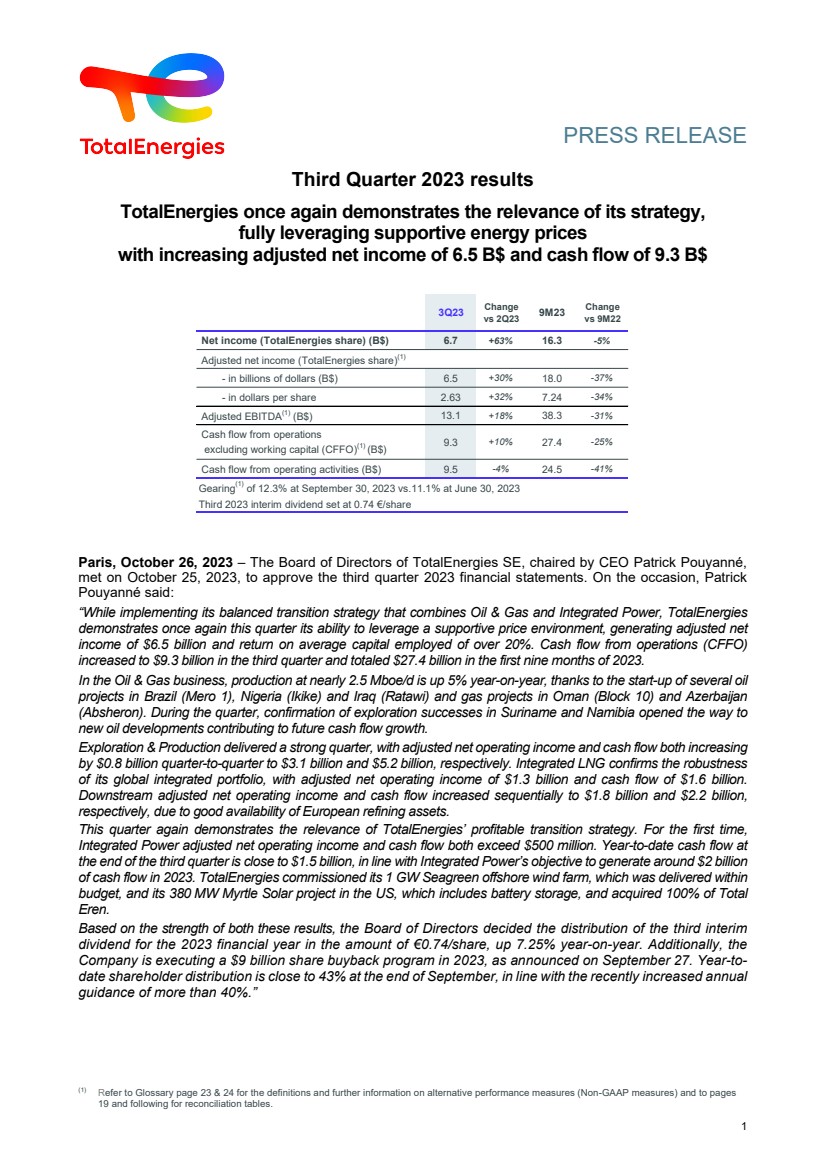
| PRESS RELEASE
Third Quarter 2023 results
TotalEnergies once again demonstrates the relevance of its strategy,
fully leveraging supportive energy prices
with increasing adjusted net income of 6.5 B$ and cash flow of 9.3 B$
1
Paris, October 26, 2023 – The Board of Directors of TotalEnergies SE, chaired by CEO Patrick Pouyanné,
met on October 25, 2023, to approve the third quarter 2023 financial statements. On the occasion, Patrick
Pouyanné said:
“While implementing its balanced transition strategy that combines Oil & Gas and Integrated Power, TotalEnergies
demonstrates once again this quarter its ability to leverage a supportive price environment, generating adjusted net
income of $6.5 billion and return on average capital employed of over 20%. Cash flow from operations (CFFO)
increased to $9.3 billion in the third quarter and totaled $27.4 billion in the first nine months of 2023.
In the Oil & Gas business, production at nearly 2.5 Mboe/d is up 5% year-on-year, thanks to the start-up of several oil
projects in Brazil (Mero 1), Nigeria (Ikike) and Iraq (Ratawi) and gas projects in Oman (Block 10) and Azerbaijan
(Absheron). During the quarter, confirmation of exploration successes in Suriname and Namibia opened the way to
new oil developments contributing to future cash flow growth.
Exploration & Production delivered a strong quarter, with adjusted net operating income and cash flow both increasing
by $0.8 billion quarter-to-quarter to $3.1 billion and $5.2 billion, respectively. Integrated LNG confirms the robustness
of its global integrated portfolio, with adjusted net operating income of $1.3 billion and cash flow of $1.6 billion.
Downstream adjusted net operating income and cash flow increased sequentially to $1.8 billion and $2.2 billion,
respectively, due to good availability of European refining assets.
This quarter again demonstrates the relevance of TotalEnergies’ profitable transition strategy. For the first time,
Integrated Power adjusted net operating income and cash flow both exceed $500 million. Year-to-date cash flow at
the end of the third quarter is close to $1.5 billion, in line with Integrated Power’s objective to generate around $2 billion
of cash flow in 2023. TotalEnergies commissioned its 1 GW Seagreen offshore wind farm, which was delivered within
budget, and its 380 MW Myrtle Solar project in the US, which includes battery storage, and acquired 100% of Total
Eren.
Based on the strength of both these results, the Board of Directors decided the distribution of the third interim
dividend for the 2023 financial year in the amount of €0.74/share, up 7.25% year-on-year. Additionally, the
Company is executing a $9 billion share buyback program in 2023, as announced on September 27. Year-to-date shareholder distribution is close to 43% at the end of September, in line with the recently increased annual
guidance of more than 40%.”
(1) Refer to Glossary page 23 & 24 for the definitions and further information on alternative performance measures (Non-GAAP measures) and to pages
19 and following for reconciliation tables.
3Q23 Change
vs 2Q23 9M23 Change
vs 9M22
Net income (TotalEnergies share) (B$) 6.7 +63% 16.3 -5%
Adjusted net income (TotalEnergies share)(1)
- in billions of dollars (B$) 6.5 +30% 18.0 -37%
- in dollars per share 2.63 +32% 7.24 -34%
Adjusted EBITDA(1) (B$) 13.1 +18% 38.3 -31%
Cash flow from operations
excluding working capital (CFFO)(1) (B$) 9.3 +10% 27.4 -25%
Cash flow from operating activities (B$) 9.5 -4% 24.5 -41%
Gearing(1) of 12.3% at September 30, 2023 vs.11.1% at June 30, 2023
Third 2023 interim dividend set at 0.74 €/share
1 |

| 1. Highlights(2)1
Multi-energy strategy
Launch of GGIP in Iraq: effective entry in the producing Ratawi field on August 16, 2023
Partnership with SONATRACH to increase the production of the Tin Fouyé Tabankort fields, extend to 2024
2 Mt/y of LNG deliveries in France, and develop renewable energy projects in Algeria
Partnership with Petrobras and Casa dos Ventos in renewable energies in Brazil
Upstream
Production start-up of Absheron gas and condensate field, in Azerbaijan
Acquisition of an interest in the Cash-Maple gas discoveries, in Australia, to ensure long-term supply of
Ichthys LNG
Launch of development studies of a 200,000 b/d oil project in Block 58 in Suriname with targeted FID at
the end of 2024
Closing of the sale of Surmont to ConocoPhillips for up to $3.3 billion and disposal of other Canadian assets
to Suncor for around $1.1 billion
Sale to Petronas of a 40% interest in Block 20 in Angola
Sale to ADNOC of a 15% interest in Absheron field in Azerbaijan
Downstream
Start-up of a new polyethylene unit on the Baystar plant, in the US
Integrated LNG
Signature of 27-year LNG offtake contracts with QatarEnergy LNG for 3.5 Mtpa
Launch of the Rio Grande LNG project, in Texas: acquisition of a 16.67% stake in the JV in charge of
developing the 17.5 Mt/y project, acquisition of a 17.5% stake in NextDecade, and signature of a 5.4 Mt/y
offtake agreement for 20 years
Integrated Power
Commissioning of Myrtle Solar in the US, first large solar farm including battery storage
Signature with Saint-Gobain of a Power Purchase Agreement over 15 years, in the US
Commissioning of Seagreen in Scotland, the first offshore windfarm of the Company
Partial farm downs to Corio Generation and Rise Light & Power in a 3 GW wind project offshore New York
and New Jersey, in the US
Agreement with European Energy to develop more than 4 GW of onshore renewable projects
Acquisition of a 50% interest in Rönesans Enerji to develop renewable projects in Turkey
Investment with AGEL in a joint venture in India with more than 1,400 MW of renewable assets
Award of a contract for the installation and operation of 1,100 EV HPC points in Germany
Low carbon molecules
Agreement with Air Liquide for the supply of green and low carbon hydrogen to the Normandy platform
Call for tenders launch for the supply of 500,000 t/y of green hydrogen to decarbonize TotalEnergies’
European refining
Acquisition of an interest in a CO2 storage exploration license, in Norway
Circular economy: first conversion of plastic waste derived oil into certified circular polymers, in Saudi
Arabia, and FID of a new mechanical recycling unit for plastic waste at Grandpuits biorefinery, in France
(2) Some of the transactions mentioned in the highlights remain subject to the agreement of the authorities or to the fulfilment of conditions precedent under
the terms of the agreements.
2 |
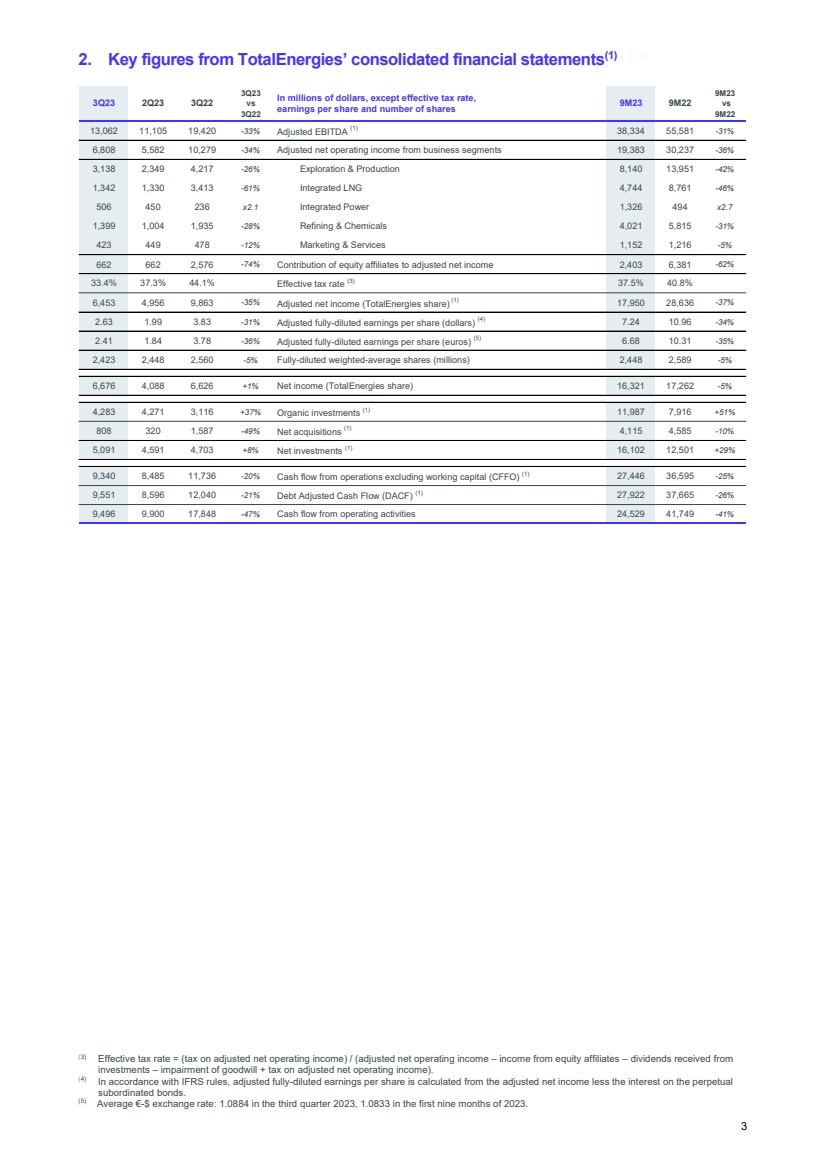
| 2. Key figures from TotalEnergies’ consolidated financial statements(1) (1) (2)
(3) Effective tax rate = (tax on adjusted net operating income) / (adjusted net operating income – income from equity affiliates – dividends received from
investments – impairment of goodwill + tax on adjusted net operating income).
(4) In accordance with IFRS rules, adjusted fully-diluted earnings per share is calculated from the adjusted net income less the interest on the perpetual
subordinated bonds.
(5) Average €-$ exchange rate: 1.0884 in the third quarter 2023, 1.0833 in the first nine months of 2023.
3Q23 2Q23 3Q22
3Q23
vs
3Q22
In millions of dollars, except effective tax rate,
earnings per share and number of shares 9M23 9M22
9M23
vs
9M22
13,062 11,105 19,420 -33% Adjusted EBITDA (1) 38,334 55,581 -31%
6,808 5,582 10,279 -34% Adjusted net operating income from business segments 19,383 30,237 -36%
3,138 2,349 4,217 -26% Exploration & Production 8,140 13,951 -42%
1,342 1,330 3,413 -61% Integrated LNG 4,744 8,761 -46%
506 450 236 x2.1 Integrated Power 1,326 494 x2.7
1,399 1,004 1,935 -28% Refining & Chemicals 4,021 5,815 -31%
423 449 478 -12% Marketing & Services 1,152 1,216 -5%
662 662 2,576 -74% Contribution of equity affiliates to adjusted net income 2,403 6,381 -62%
33.4% 37.3% 44.1% Effective tax rate (3) 37.5% 40.8%
6,453 4,956 9,863 -35% Adjusted net income (TotalEnergies share) (1) 17,950 28,636 -37%
2.63 1.99 3.83 -31% Adjusted fully-diluted earnings per share (dollars) (4) 7.24 10.96 -34%
2.41 1.84 3.78 -36% Adjusted fully-diluted earnings per share (euros) (5) 6.68 10.31 -35%
2,423 2,448 2,560 -5% Fully-diluted weighted-average shares (millions) 2,448 2,589 -5%
6,676 4,088 6,626 +1% Net income (TotalEnergies share) 16,321 17,262 -5%
4,283 4,271 3,116 +37% Organic investments (1) 11,987 7,916 +51%
808 320 1,587 -49% Net acquisitions (1) 4,115 4,585 -10%
5,091 4,591 4,703 +8% Net investments (1) 16,102 12,501 +29%
9,340 8,485 11,736 -20% Cash flow from operations excluding working capital (CFFO) (1) 27,446 36,595 -25%
9,551 8,596 12,040 -21% Debt Adjusted Cash Flow (DACF) (1) 27,922 37,665 -26%
9,496 9,900 17,848 -47% Cash flow from operating activities 24,529 41,749 -41%
3 |
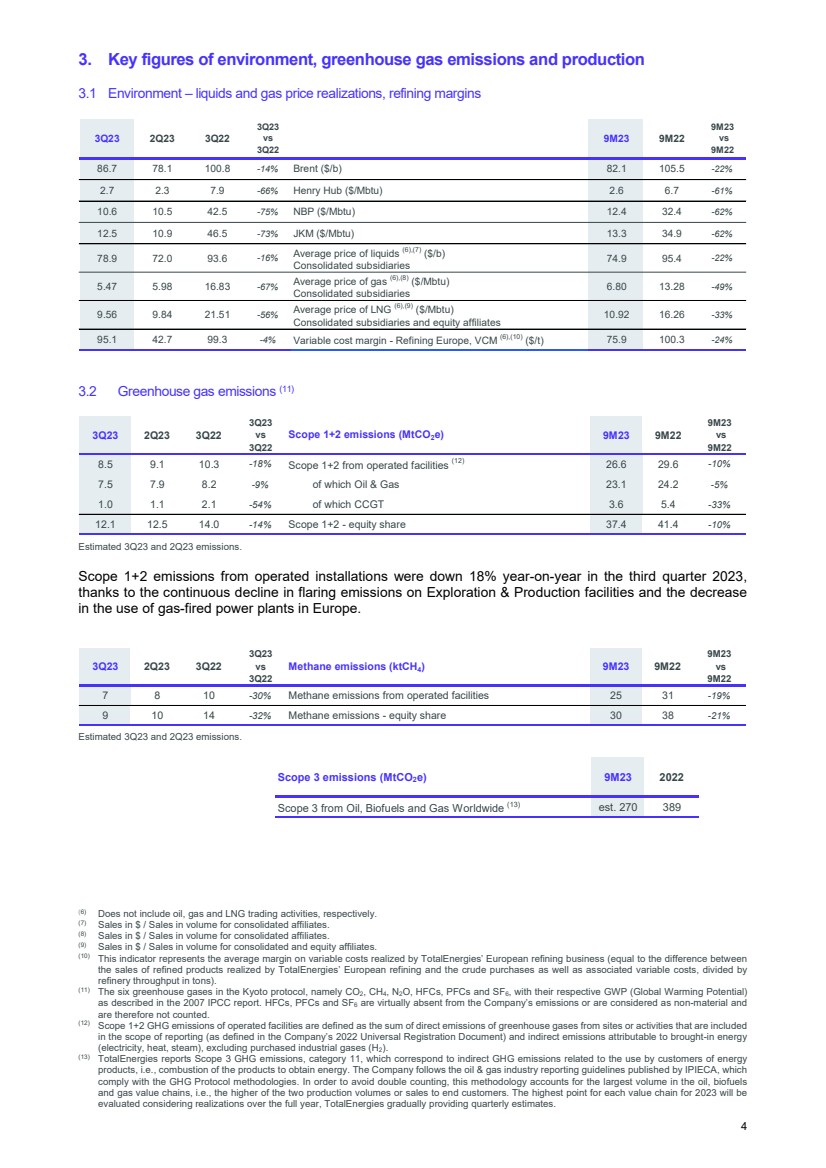
| 3. Key figures of environment, greenhouse gas emissions and production
3.1 Environment – liquids and gas price realizations, refining margins
3.2 Greenhouse gas emissions (11) 1(2
Estimated 3Q23 and 2Q23 emissions.
Scope 1+2 emissions from operated installations were down 18% year-on-year in the third quarter 2023,
thanks to the continuous decline in flaring emissions on Exploration & Production facilities and the decrease
in the use of gas-fired power plants in Europe.
Estimated 3Q23 and 2Q23 emissions.
1
(6) Does not include oil, gas and LNG trading activities, respectively.
(7) Sales in $ / Sales in volume for consolidated affiliates.
(8) Sales in $ / Sales in volume for consolidated affiliates.
(9) Sales in $ / Sales in volume for consolidated and equity affiliates.
(10) This indicator represents the average margin on variable costs realized by TotalEnergies’ European refining business (equal to the difference between
the sales of refined products realized by TotalEnergies’ European refining and the crude purchases as well as associated variable costs, divided by
refinery throughput in tons).
(11) The six greenhouse gases in the Kyoto protocol, namely CO2, CH4, N2O, HFCs, PFCs and SF6, with their respective GWP (Global Warming Potential)
as described in the 2007 IPCC report. HFCs, PFCs and SF6 are virtually absent from the Company’s emissions or are considered as non-material and
are therefore not counted.
(12) Scope 1+2 GHG emissions of operated facilities are defined as the sum of direct emissions of greenhouse gases from sites or activities that are included
in the scope of reporting (as defined in the Company’s 2022 Universal Registration Document) and indirect emissions attributable to brought-in energy
(electricity, heat, steam), excluding purchased industrial gases (H2).
(13) TotalEnergies reports Scope 3 GHG emissions, category 11, which correspond to indirect GHG emissions related to the use by customers of energy
products, i.e., combustion of the products to obtain energy. The Company follows the oil & gas industry reporting guidelines published by IPIECA, which
comply with the GHG Protocol methodologies. In order to avoid double counting, this methodology accounts for the largest volume in the oil, biofuels
and gas value chains, i.e., the higher of the two production volumes or sales to end customers. The highest point for each value chain for 2023 will be
evaluated considering realizations over the full year, TotalEnergies gradually providing quarterly estimates.
3Q23 2Q23 3Q22
3Q23
vs
3Q22
9M23 9M22
9M23
vs
9M22
86.7 78.1 100.8 -14% Brent ($/b) 82.1 105.5 -22%
2.7 2.3 7.9 -66% Henry Hub ($/Mbtu) 2.6 6.7 -61%
10.6 10.5 42.5 -75% NBP ($/Mbtu) 12.4 32.4 -62%
12.5 10.9 46.5 -73% JKM ($/Mbtu) 13.3 34.9 -62%
78.9 72.0 93.6 -16% Average price of liquids (6),(7) ($/b)
Consolidated subsidiaries 74.9 95.4 -22%
5.47 5.98 16.83 -67% Average price of gas (6),(8) ($/Mbtu)
Consolidated subsidiaries 6.80 13.28 -49%
9.56 9.84 21.51 -56% Average price of LNG (6),(9) ($/Mbtu)
Consolidated subsidiaries and equity affiliates 10.92 16.26 -33%
95.1 42.7 99.3 -4% Variable cost margin - Refining Europe, VCM (6),(10) ($/t) 75.9 100.3 -24%
3Q23 2Q23 3Q22
3Q23
vs
3Q22
Scope 1+2 emissions (MtCO2e) 9M23 9M22
9M23
vs
9M22
8.5 9.1 10.3 -18% Scope 1+2 from operated facilities (12) 26.6 29.6 -10%
7.5 7.9 8.2 -9% of which Oil & Gas 23.1 24.2 -5%
1.0 1.1 2.1 -54% of which CCGT 3.6 5.4 -33%
12.1 12.5 14.0 -14% Scope 1+2 - equity share 37.4 41.4 -10%
3Q23 2Q23 3Q22
3Q23
vs
3Q22
Methane emissions (ktCH4
) 9M23 9M22
9M23
vs
9M22
7 8 10 -30% Methane emissions from operated facilities 25 31 -19%
9 10 14 -32% Methane emissions - equity share 30 38 -21%
Scope 3 emissions (MtCO2e) 9M23 2022
Scope 3 from Oil, Biofuels and Gas Worldwide (13) est. 270 389
4 |
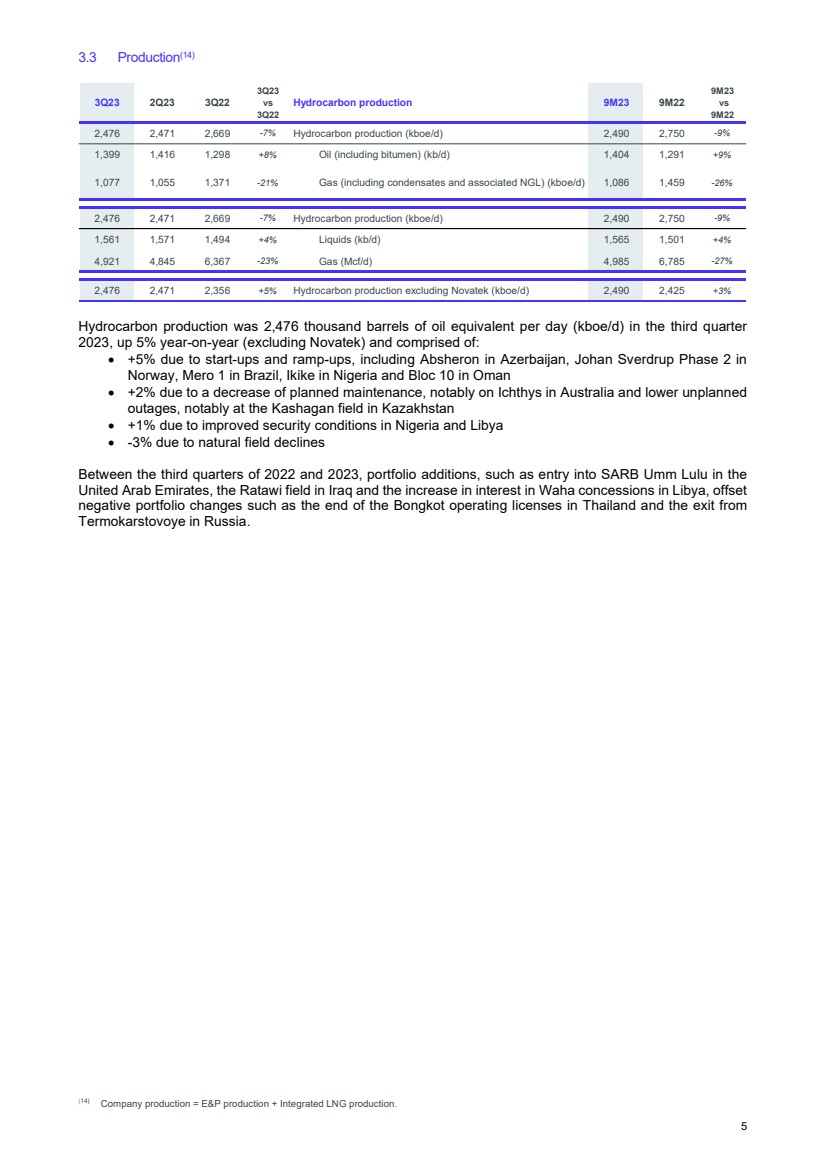
| 3.3 Production(14)1
Hydrocarbon production was 2,476 thousand barrels of oil equivalent per day (kboe/d) in the third quarter
2023, up 5% year-on-year (excluding Novatek) and comprised of:
+5% due to start-ups and ramp-ups, including Absheron in Azerbaijan, Johan Sverdrup Phase 2 in
Norway, Mero 1 in Brazil, Ikike in Nigeria and Bloc 10 in Oman
+2% due to a decrease of planned maintenance, notably on Ichthys in Australia and lower unplanned
outages, notably at the Kashagan field in Kazakhstan
+1% due to improved security conditions in Nigeria and Libya
-3% due to natural field declines
Between the third quarters of 2022 and 2023, portfolio additions, such as entry into SARB Umm Lulu in the
United Arab Emirates, the Ratawi field in Iraq and the increase in interest in Waha concessions in Libya, offset
negative portfolio changes such as the end of the Bongkot operating licenses in Thailand and the exit from
Termokarstovoye in Russia.
(14) Company production = E&P production + Integrated LNG production.
3Q23 2Q23 3Q22
3Q23
vs
3Q22
Hydrocarbon production 9M23 9M22
9M23
vs
9M22
2,476 2,471 2,669 -7% Hydrocarbon production (kboe/d) 2,490 2,750 -9%
1,399 1,416 1,298 +8% Oil (including bitumen) (kb/d) 1,404 1,291 +9%
1,077 1,055 1,371 -21% Gas (including condensates and associated NGL) (kboe/d) 1,086 1,459 -26%
2,476 2,471 2,669 -7% Hydrocarbon production (kboe/d) 2,490 2,750 -9%
1,561 1,571 1,494 +4% Liquids (kb/d) 1,565 1,501 +4%
4,921 4,845 6,367 -23% Gas (Mcf/d) 4,985 6,785 -27%
2,476 2,471 2,356 +5% Hydrocarbon production excluding Novatek (kboe/d) 2,490 2,425 +3%
5 |
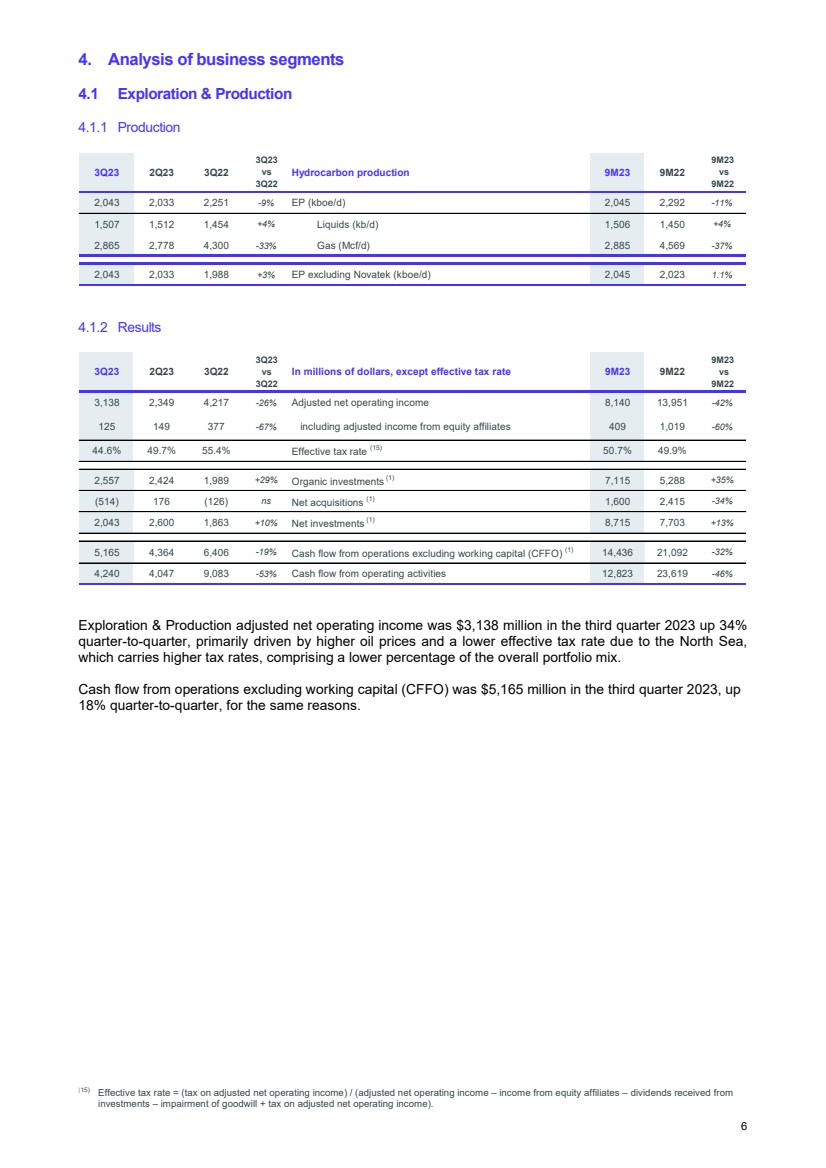
| 4. Analysis of business segments
4.1 Exploration & Production
4.1.1 Production
4.1.2 Results
12
Exploration & Production adjusted net operating income was $3,138 million in the third quarter 2023 up 34%
quarter-to-quarter, primarily driven by higher oil prices and a lower effective tax rate due to the North Sea,
which carries higher tax rates, comprising a lower percentage of the overall portfolio mix.
Cash flow from operations excluding working capital (CFFO) was $5,165 million in the third quarter 2023, up
18% quarter-to-quarter, for the same reasons.
(15) Effective tax rate = (tax on adjusted net operating income) / (adjusted net operating income – income from equity affiliates – dividends received from
investments – impairment of goodwill + tax on adjusted net operating income).
3Q23 2Q23 3Q22
3Q23
vs
3Q22
Hydrocarbon production 9M23 9M22
9M23
vs
9M22
2,043 2,033 2,251 -9% EP (kboe/d) 2,045 2,292 -11%
1,507 1,512 1,454 +4% Liquids (kb/d) 1,506 1,450 +4%
2,865 2,778 4,300 -33% Gas (Mcf/d) 2,885 4,569 -37%
2,043 2,033 1,988 +3% EP excluding Novatek (kboe/d) 2,045 2,023 1.1%
3Q23 2Q23 3Q22
3Q23
vs
3Q22
In millions of dollars, except effective tax rate 9M23 9M22
9M23
vs
9M22
3,138 2,349 4,217 -26% Adjusted net operating income 8,140 13,951 -42%
125 149 377 -67% including adjusted income from equity affiliates 409 1,019 -60%
44.6% 49.7% 55.4% Effective tax rate (15) 50.7% 49.9%
2,557 2,424 1,989 +29% Organic investments (1) 7,115 5,288 +35%
(514) 176 (126) ns Net acquisitions (1) 1,600 2,415 -34%
2,043 2,600 1,863 +10% Net investments (1) 8,715 7,703 +13%
5,165 4,364 6,406 -19% Cash flow from operations excluding working capital (CFFO) (1) 14,436 21,092 -32%
4,240 4,047 9,083 -53% Cash flow from operating activities 12,823 23,619 -46%
6 |
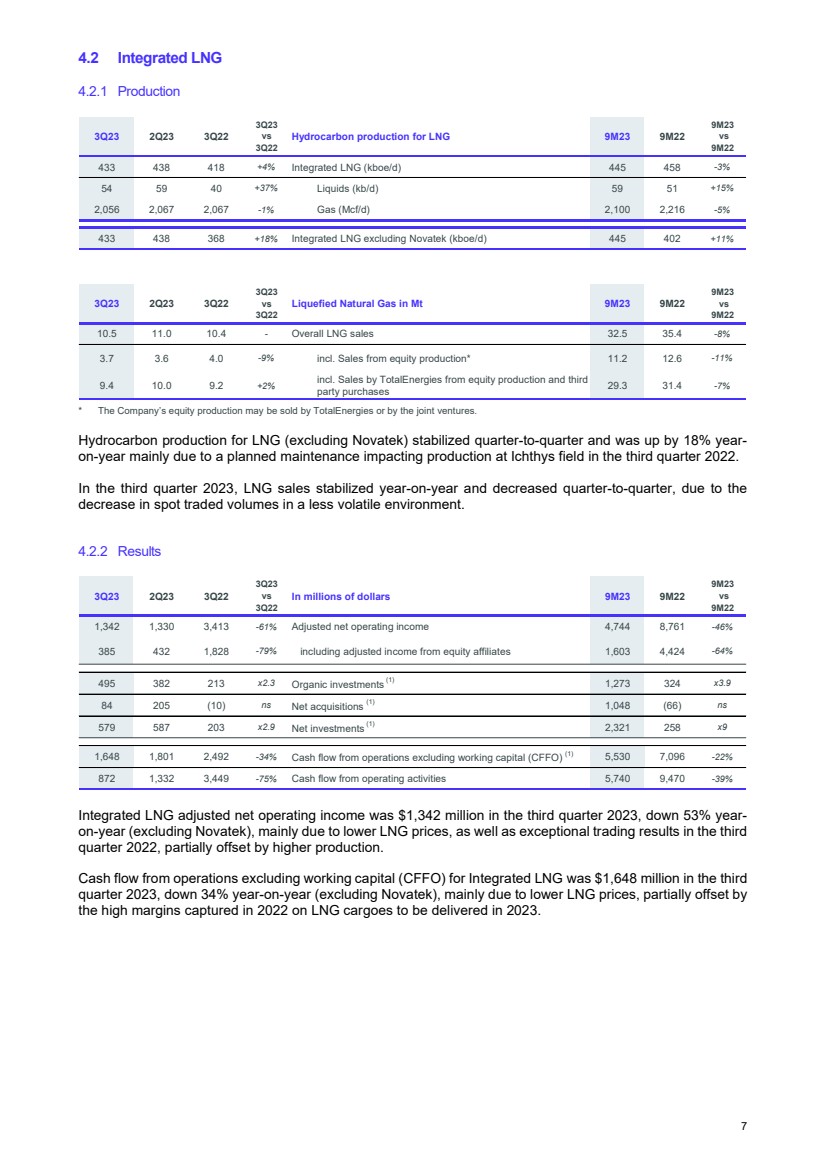
| 4.2 Integrated LNG
4.2.1 Production
* The Company’s equity production may be sold by TotalEnergies or by the joint ventures.
Hydrocarbon production for LNG (excluding Novatek) stabilized quarter-to-quarter and was up by 18% year-on-year mainly due to a planned maintenance impacting production at Ichthys field in the third quarter 2022.
In the third quarter 2023, LNG sales stabilized year-on-year and decreased quarter-to-quarter, due to the
decrease in spot traded volumes in a less volatile environment.
4.2.2 Results
1
Integrated LNG adjusted net operating income was $1,342 million in the third quarter 2023, down 53% year-on-year (excluding Novatek), mainly due to lower LNG prices, as well as exceptional trading results in the third
quarter 2022, partially offset by higher production.
Cash flow from operations excluding working capital (CFFO) for Integrated LNG was $1,648 million in the third
quarter 2023, down 34% year-on-year (excluding Novatek), mainly due to lower LNG prices, partially offset by
the high margins captured in 2022 on LNG cargoes to be delivered in 2023.
3Q23 2Q23 3Q22
3Q23
vs
3Q22
Hydrocarbon production for LNG 9M23 9M22
9M23
vs
9M22
433 438 418 +4% Integrated LNG (kboe/d) 445 458 -3%
54 59 40 +37% Liquids (kb/d) 59 51 +15%
2,056 2,067 2,067 -1% Gas (Mcf/d) 2,100 2,216 -5%
433 438 368 +18% Integrated LNG excluding Novatek (kboe/d) 445 402 +11%
3Q23 2Q23 3Q22
3Q23
vs
3Q22
Liquefied Natural Gas in Mt 9M23 9M22
9M23
vs
9M22
10.5 11.0 10.4 - Overall LNG sales 32.5 35.4 -8%
3.7 3.6 4.0 -9% incl. Sales from equity production* 11.2 12.6 -11%
9.4 10.0 9.2 +2% incl. Sales by TotalEnergies from equity production and third
party purchases 29.3 31.4 -7%
3Q23 2Q23 3Q22
3Q23
vs
3Q22
In millions of dollars 9M23 9M22
9M23
vs
9M22
1,342 1,330 3,413 -61% Adjusted net operating income 4,744 8,761 -46%
385 432 1,828 -79% including adjusted income from equity affiliates 1,603 4,424 -64%
495 382 213 x2.3 Organic investments (1) 1,273 324 x3.9
84 205 (10) ns Net acquisitions (1) 1,048 (66) ns
579 587 203 x2.9 Net investments (1) 2,321 258 x9
1,648 1,801 2,492 -34% Cash flow from operations excluding working capital (CFFO) (1) 5,530 7,096 -22%
872 1,332 3,449 -75% Cash flow from operating activities 5,740 9,470 -39%
7 |
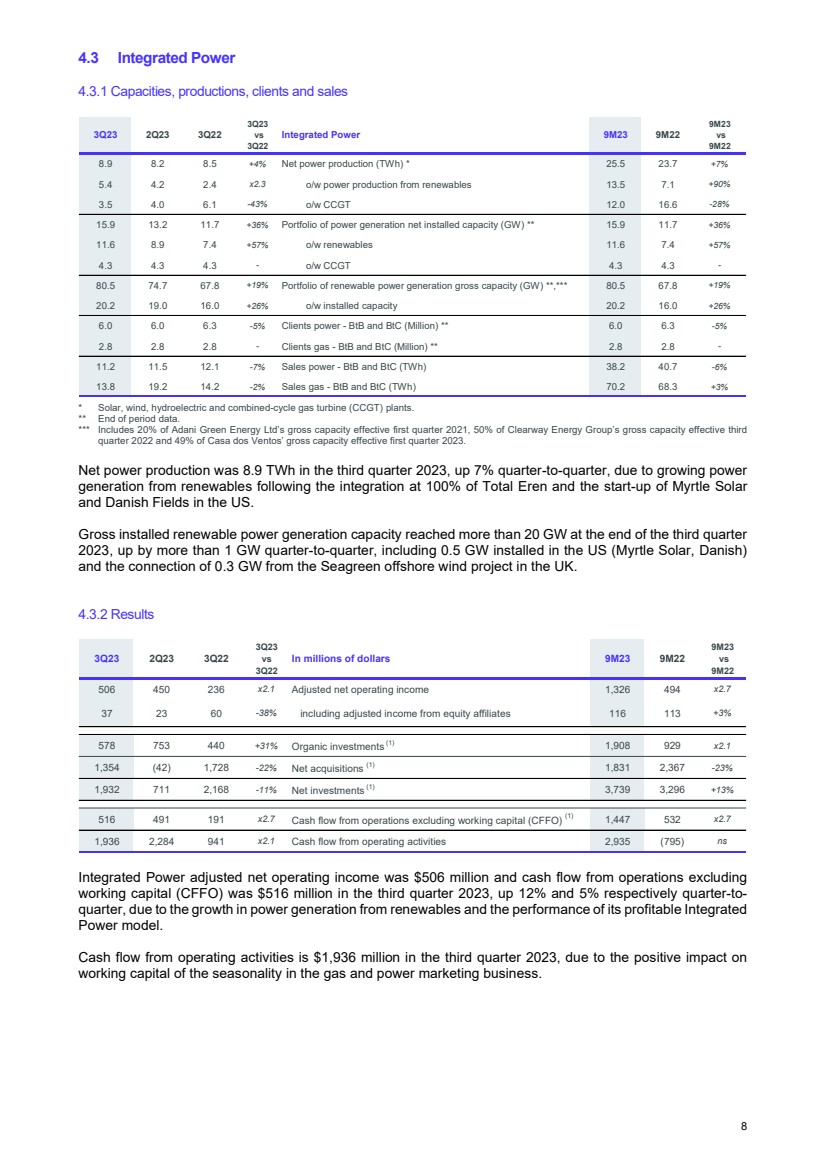
| 4.3 Integrated Power
4.3.1 Capacities, productions, clients and sales
* Solar, wind, hydroelectric and combined-cycle gas turbine (CCGT) plants.
** End of period data.
*** Includes 20% of Adani Green Energy Ltd’s gross capacity effective first quarter 2021, 50% of Clearway Energy Group’s gross capacity effective third
quarter 2022 and 49% of Casa dos Ventos’ gross capacity effective first quarter 2023.
Net power production was 8.9 TWh in the third quarter 2023, up 7% quarter-to-quarter, due to growing power
generation from renewables following the integration at 100% of Total Eren and the start-up of Myrtle Solar
and Danish Fields in the US.
Gross installed renewable power generation capacity reached more than 20 GW at the end of the third quarter
2023, up by more than 1 GW quarter-to-quarter, including 0.5 GW installed in the US (Myrtle Solar, Danish)
and the connection of 0.3 GW from the Seagreen offshore wind project in the UK.
4.3.2 Results
1
Integrated Power adjusted net operating income was $506 million and cash flow from operations excluding
working capital (CFFO) was $516 million in the third quarter 2023, up 12% and 5% respectively quarter-to-quarter, due to the growth in power generation from renewables and the performance of its profitable Integrated
Power model.
Cash flow from operating activities is $1,936 million in the third quarter 2023, due to the positive impact on
working capital of the seasonality in the gas and power marketing business.
3Q23 2Q23 3Q22
3Q23
vs
3Q22
Integrated Power 9M23 9M22
9M23
vs
9M22
8.9 8.2 8.5 +4% Net power production (TWh) * 25.5 23.7 +7%
5.4 4.2 2.4 x2.3 o/w power production from renewables 13.5 7.1 +90%
3.5 4.0 6.1 -43% o/w CCGT 12.0 16.6 -28%
15.9 13.2 11.7 +36% Portfolio of power generation net installed capacity (GW) ** 15.9 11.7 +36%
11.6 8.9 7.4 +57% o/w renewables 11.6 7.4 +57%
4.3 4.3 4.3 - o/w CCGT 4.3 4.3 -
80.5 74.7 67.8 +19% Portfolio of renewable power generation gross capacity (GW) **,*** 80.5 67.8 +19%
20.2 19.0 16.0 +26% o/w installed capacity 20.2 16.0 +26%
6.0 6.0 6.3 -5% Clients power - BtB and BtC (Million) ** 6.0 6.3 -5%
2.8 2.8 2.8 - Clients gas - BtB and BtC (Million) ** 2.8 2.8 -
11.2 11.5 12.1 -7% Sales power - BtB and BtC (TWh) 38.2 40.7 -6%
13.8 19.2 14.2 -2% Sales gas - BtB and BtC (TWh) 70.2 68.3 +3%
3Q23 2Q23 3Q22
3Q23
vs
3Q22
In millions of dollars 9M23 9M22
9M23
vs
9M22
506 450 236 x2.1 Adjusted net operating income 1,326 494 x2.7
37 23 60 -38% including adjusted income from equity affiliates 116 113 +3%
578 753 440 +31% Organic investments (1) 1,908 929 x2.1
1,354 (42) 1,728 -22% Net acquisitions (1) 1,831 2,367 -23%
1,932 711 2,168 -11% Net investments (1) 3,739 3,296 +13%
516 491 191 x2.7 Cash flow from operations excluding working capital (CFFO) (1) 1,447 532 x2.7
1,936 2,284 941 x2.1 Cash flow from operating activities 2,935 (795) ns
8 |
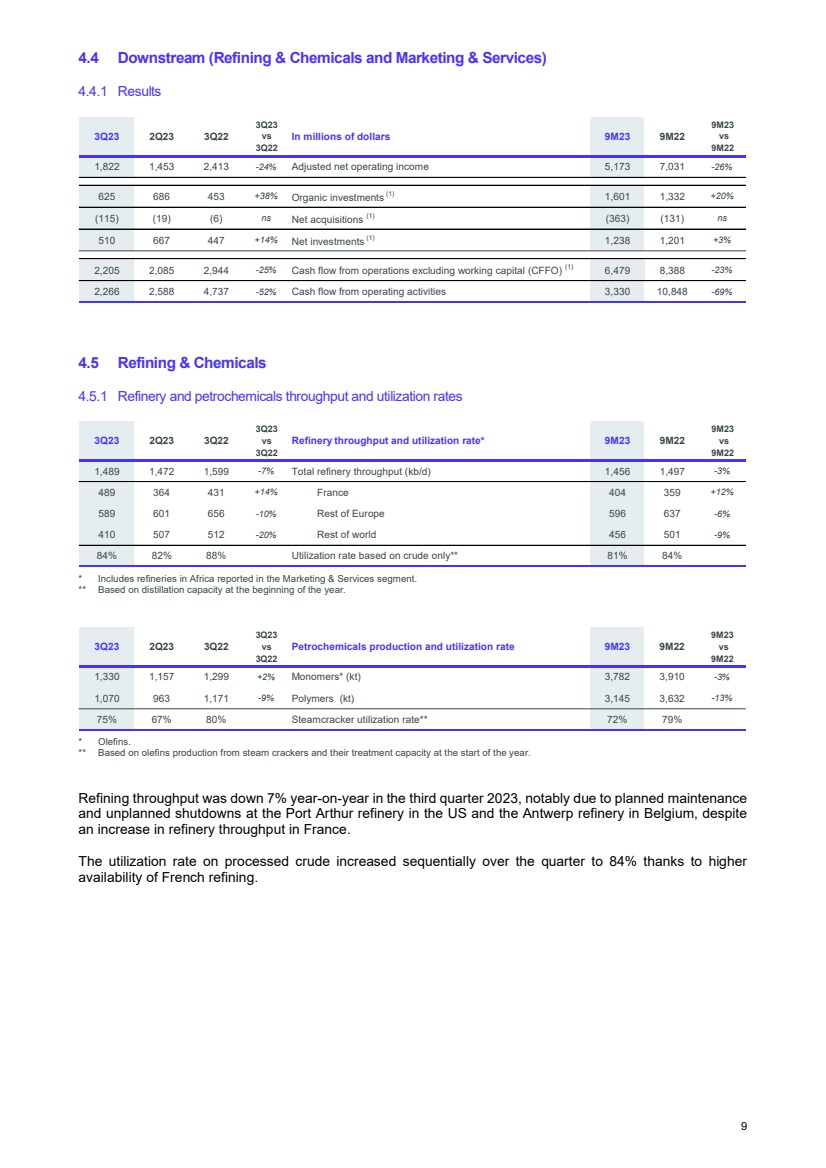
| 4.4 Downstream (Refining & Chemicals and Marketing & Services)
4.4.1 Results
1
4.5 Refining & Chemicals
4.5.1 Refinery and petrochemicals throughput and utilization rates
* Includes refineries in Africa reported in the Marketing & Services segment.
** Based on distillation capacity at the beginning of the year.
* Olefins.
** Based on olefins production from steam crackers and their treatment capacity at the start of the year.
Refining throughput was down 7% year-on-year in the third quarter 2023, notably due to planned maintenance
and unplanned shutdowns at the Port Arthur refinery in the US and the Antwerp refinery in Belgium, despite
an increase in refinery throughput in France.
The utilization rate on processed crude increased sequentially over the quarter to 84% thanks to higher
availability of French refining.
3Q23 2Q23 3Q22
3Q23
vs
3Q22
In millions of dollars 9M23 9M22
9M23
vs
9M22
1,822 1,453 2,413 -24% Adjusted net operating income 5,173 7,031 -26%
625 686 453 +38% Organic investments (1) 1,601 1,332 +20%
(115) (19) (6) ns Net acquisitions (1) (363) (131) ns
510 667 447 +14% Net investments (1) 1,238 1,201 +3%
2,205 2,085 2,944 -25% Cash flow from operations excluding working capital (CFFO) (1) 6,479 8,388 -23%
2,266 2,588 4,737 -52% Cash flow from operating activities 3,330 10,848 -69%
3Q23 2Q23 3Q22
3Q23
vs
3Q22
Refinery throughput and utilization rate* 9M23 9M22
9M23
vs
9M22
1,489 1,472 1,599 -7% Total refinery throughput (kb/d) 1,456 1,497 -3%
489 364 431 +14% France 404 359 +12%
589 601 656 -10% Rest of Europe 596 637 -6%
410 507 512 -20% Rest of world 456 501 -9%
84% 82% 88% Utilization rate based on crude only** 81% 84%
3Q23 2Q23 3Q22
3Q23
vs
3Q22
Petrochemicals production and utilization rate 9M23 9M22
9M23
vs
9M22
1,330 1,157 1,299 +2% Monomers* (kt) 3,782 3,910 -3%
1,070 963 1,171 -9% Polymers (kt) 3,145 3,632 -13%
75% 67% 80% Steamcracker utilization rate** 72% 79%
9 |
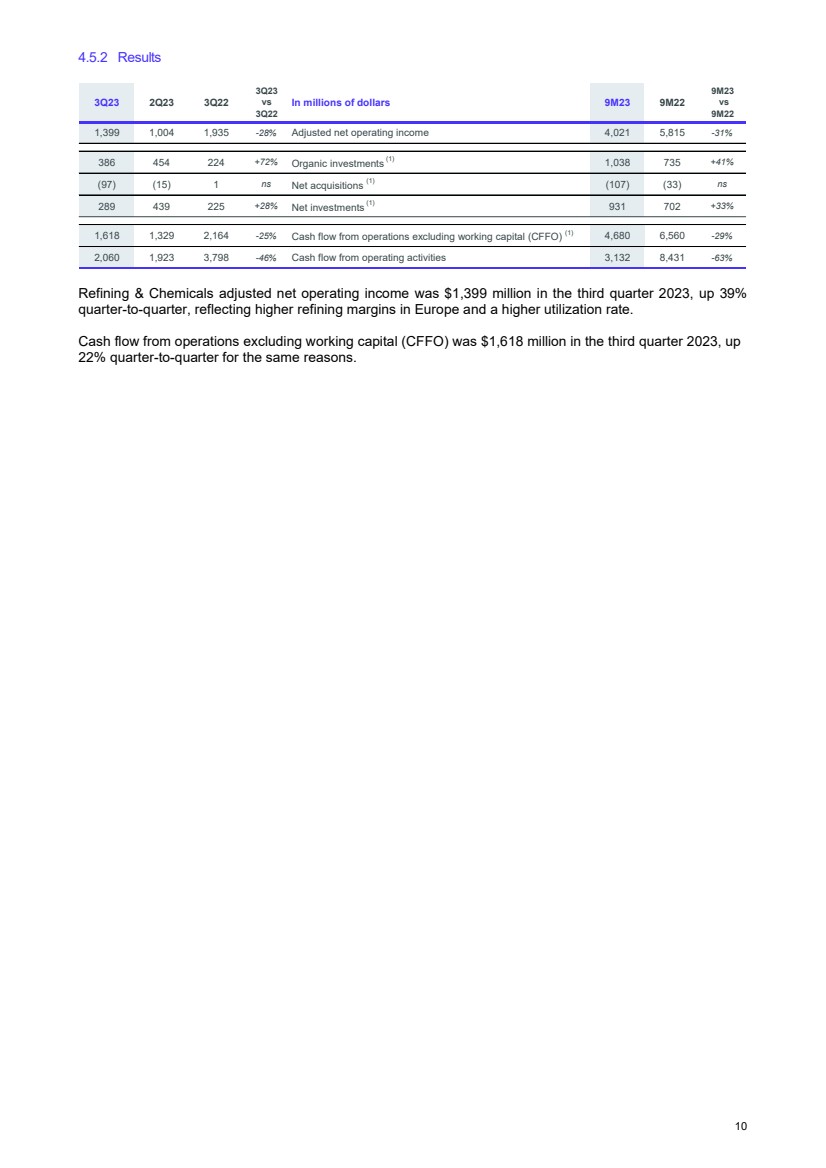
| 4.5.2 Results
1
Refining & Chemicals adjusted net operating income was $1,399 million in the third quarter 2023, up 39%
quarter-to-quarter, reflecting higher refining margins in Europe and a higher utilization rate.
Cash flow from operations excluding working capital (CFFO) was $1,618 million in the third quarter 2023, up
22% quarter-to-quarter for the same reasons.
3Q23 2Q23 3Q22
3Q23
vs
3Q22
In millions of dollars 9M23 9M22
9M23
vs
9M22
1,399 1,004 1,935 -28% Adjusted net operating income 4,021 5,815 -31%
386 454 224 +72% Organic investments (1) 1,038 735 +41%
(97) (15) 1 ns Net acquisitions (1) (107) (33) ns
289 439 225 +28% Net investments (1) 931 702 +33%
1,618 1,329 2,164 -25% Cash flow from operations excluding working capital (CFFO) (1) 4,680 6,560 -29%
2,060 1,923 3,798 -46% Cash flow from operating activities 3,132 8,431 -63%
10 |
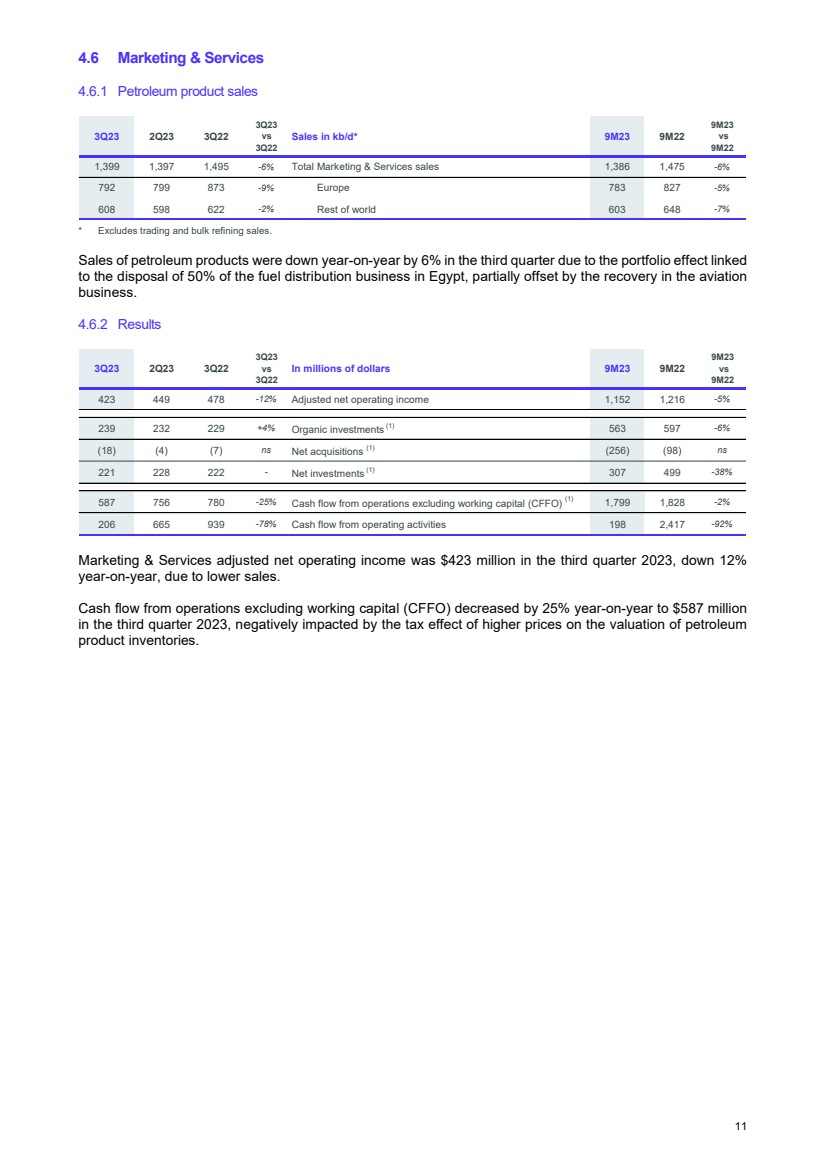
| 4.6 Marketing & Services
4.6.1 Petroleum product sales
* Excludes trading and bulk refining sales.
Sales of petroleum products were down year-on-year by 6% in the third quarter due to the portfolio effect linked
to the disposal of 50% of the fuel distribution business in Egypt, partially offset by the recovery in the aviation
business.
4.6.2 Results
1
Marketing & Services adjusted net operating income was $423 million in the third quarter 2023, down 12%
year-on-year, due to lower sales.
Cash flow from operations excluding working capital (CFFO) decreased by 25% year-on-year to $587 million
in the third quarter 2023, negatively impacted by the tax effect of higher prices on the valuation of petroleum
product inventories.
3Q23 2Q23 3Q22
3Q23
vs
3Q22
Sales in kb/d* 9M23 9M22
9M23
vs
9M22
1,399 1,397 1,495 -6% Total Marketing & Services sales 1,386 1,475 -6%
792 799 873 -9% Europe 783 827 -5%
608 598 622 -2% Rest of world 603 648 -7%
3Q23 2Q23 3Q22
3Q23
vs
3Q22
In millions of dollars 9M23 9M22
9M23
vs
9M22
423 449 478 -12% Adjusted net operating income 1,152 1,216 -5%
239 232 229 +4% Organic investments (1) 563 597 -6%
(18) (4) (7) ns Net acquisitions (1) (256) (98) ns
221 228 222 - Net investments (1) 307 499 -38%
587 756 780 -25% Cash flow from operations excluding working capital (CFFO) (1) 1,799 1,828 -2%
206 665 939 -78% Cash flow from operating activities 198 2,417 -92%
11 |
| 5. TotalEnergies results
5.1 Adjusted net operating income from business segments
Adjusted net operating income from business segments was:
$6,808 million in the third quarter 2023, compared to $5,582 million in the second quarter 2023, due
to higher oil prices and refining margins and a lower effective tax rate for Exploration-Production,
$19,383 million in the first nine months of 2023, compared to $30,237 million in the first nine months
of 2022, due to lower prices of oil, gas and refining margins.
5.2 Adjusted net income(1) (TotalEnergies share)
TotalEnergies adjusted net income was $6,453 million in the third quarter 2023 versus $4,956 million in the
second quarter 2023, mainly due to higher oil prices and refining margins.
Adjustments to net income(1) were $223 million in the third quarter 2023, consisting mainly of:
$1 billion of inventory and changes in fair value effects,
($0.6) billion related to asset impairments notably due to divestments projects of Naphtachimie to
INEOS and the Natref refinery in South Africa as well as client portfolios-related goodwills from gas &
power marketing activities in Belgium, Spain and France.
TotalEnergies’ average tax rate was:
33.4% in the third quarter 2023 versus 37.3% in the second quarter 2023, mainly as a result of the
lower tax rate for Exploration & Production related to the lower relative weight of highly taxed North
Sea assets,
37.5% in the first nine months of 2023 versus 40.8% in the first nine months of 2022, mainly as a result
of the lower relative weight of Exploration & Production in Company results, in line with oil and gas
prices evolution.
5.3 Adjusted earnings per share
Adjusted diluted net earnings per share were:
$2.63 in the third quarter 2023, based on 2,423 million weighted average diluted shares, compared
to $1.99 in the second quarter 2023,
$7.24 in the first nine months of 2023, based on 2,448 million weighted average diluted shares,
compared to $10.96 a year earlier.
As of September 30, 2023, the number of diluted shares was 2,417 million.
As part of its shareholder return policy, TotalEnergies repurchased:
33.9 million shares for cancellation in the third quarter 2023 for $2.1 billion,
98.9 million shares for cancellation in the first nine months of 2023 for $6.1 billion.
5.4 Acquisitions – asset sales
Acquisitions were:
$1,992 million in the third quarter 2023, mainly related to the acquisition of the remaining 70.4% in
Total Eren and the acquisition of an additional 12.4% stake in NextDecade in line with the launch of
Rio Grande LNG project in the US,
$5,730 million in the first nine months of 2023, mainly related to the above items, as well as the
acquisition of a 20% interest in the SARB and Umm Lulu concession in the United Arab Emirates, the
acquisition of a 6.25% stake in the NFE LNG project and 9.375% in NFS LNG project in Qatar, and a
34% stake in a joint venture with Casa dos Ventos in Brazil.
Divestments were:
$1,184 million in the third quarter 2023, notably for the sale of a 40% interest to ADNOC in Bloc 20 in
Angola, of a number of non-conventional assets in Argentina and a partial farm down in an offshore
wind project of the coast of New York and New Jersey in the US,
$1,615 million in the first nine months of 2023, notably for the above items as well as the sale of 50%
of the Marketing & Services subsidiary in Egypt.
12 |
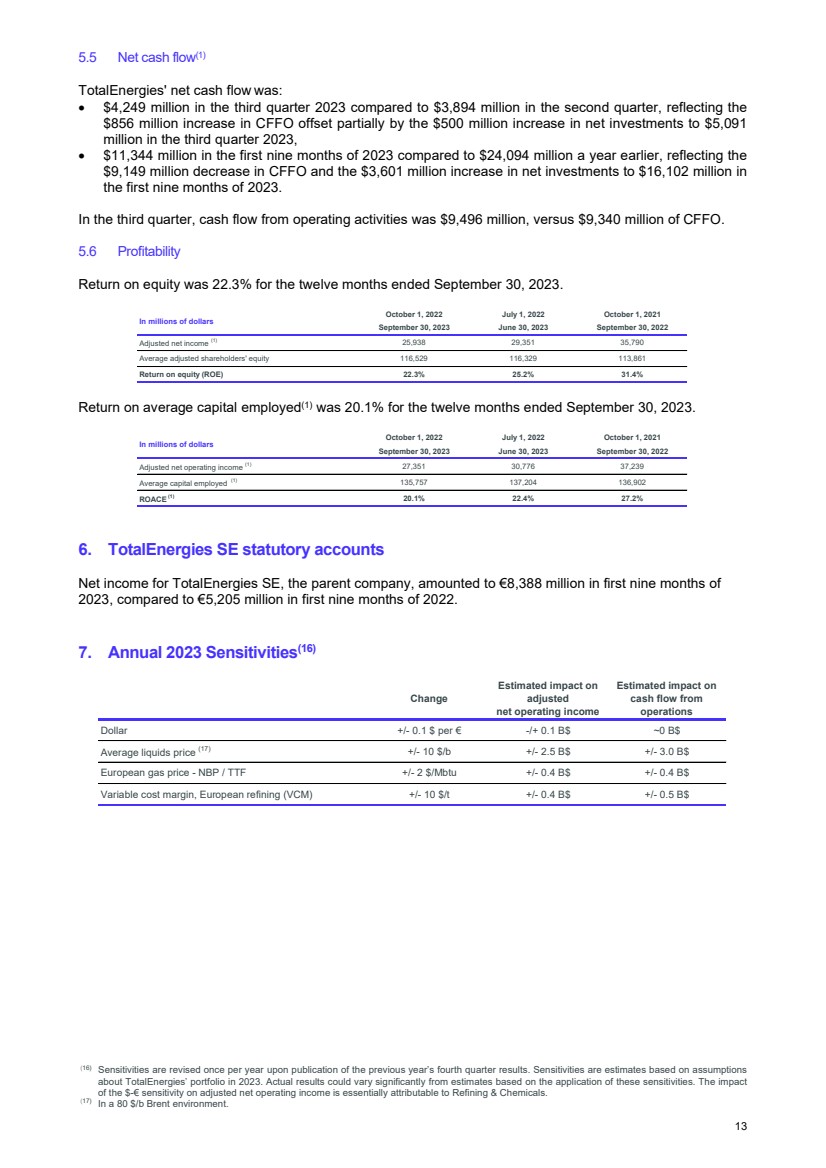
| 5.5 Net cash flow(1)
TotalEnergies' net cash flow was:
$4,249 million in the third quarter 2023 compared to $3,894 million in the second quarter, reflecting the
$856 million increase in CFFO offset partially by the $500 million increase in net investments to $5,091
million in the third quarter 2023,
$11,344 million in the first nine months of 2023 compared to $24,094 million a year earlier, reflecting the
$9,149 million decrease in CFFO and the $3,601 million increase in net investments to $16,102 million in
the first nine months of 2023.
In the third quarter, cash flow from operating activities was $9,496 million, versus $9,340 million of CFFO.
5.6 Profitability
Return on equity was 22.3% for the twelve months ended September 30, 2023.
Return on average capital employed(1) was 20.1% for the twelve months ended September 30, 2023.
6. TotalEnergies SE statutory accounts
Net income for TotalEnergies SE, the parent company, amounted to €8,388 million in first nine months of
2023, compared to €5,205 million in first nine months of 2022.
7. Annual 2023 Sensitivities(16)
123
(16) Sensitivities are revised once per year upon publication of the previous year’s fourth quarter results. Sensitivities are estimates based on assumptions
about TotalEnergies’ portfolio in 2023. Actual results could vary significantly from estimates based on the application of these sensitivities. The impact
of the $-€ sensitivity on adjusted net operating income is essentially attributable to Refining & Chemicals.
(17) In a 80 $/b Brent environment.
Adjusted net income (1)
Average adjusted shareholders' equity
Return on equity (ROE) 22.3% 25.2% 31.4%
In millions of dollars
October 1, 2022 July 1, 2022 October 1, 2021
September 30, 2023 June 30, 2023 September 30, 2022
35,790
113,861
25,938 29,351
116,529 116,329
Adjusted net operating income (1)
Average capital employed (1)
ROACE (1)
27,351 30,776 37,239
In millions of dollars
October 1, 2022 July 1, 2022 October 1, 2021
September 30, 2023 June 30, 2023 September 30, 2022
135,757 137,204 136,902
20.1% 22.4% 27.2%
Change
Estimated impact on
adjusted
net operating income
Estimated impact on
cash flow from
operations
Dollar +/- 0.1 $ per € -/+ 0.1 B$ ~0 B$
Average liquids price (17) +/- 10 $/b +/- 2.5 B$ +/- 3.0 B$
European gas price - NBP / TTF +/- 2 $/Mbtu +/- 0.4 B$ +/- 0.4 B$
Variable cost margin, European refining (VCM) +/- 10 $/t +/- 0.4 B$ +/- 0.5 B$
13 |
| 8. Outlook
Oil prices remain buoyant at around $90/b at the beginning of the fourth quarter, supported by OPEC+ actions
on supply and a tense geopolitical context. The 2 Mb/d increase in petroleum products this year is driven by
emerging countries, notably due to the recovery of the aviation sector and demand from the petrochemical
industry in China.
Despite entering the winter period with high natural gas inventories in Europe, in a tense market, gas prices
remain very reactive to production disruptions.
Given the evolution of oil and gas prices in recent months and the lag effect on price formulas, TotalEnergies
anticipates that its average LNG selling price should be above $10/Mbtu in the fourth quarter 2023.
TotalEnergies expects hydrocarbon production to range between 2.4 and 2.5 Mboe/d in the fourth quarter
2023, which reflects the impact of the sale of its oil sands assets in Canada.
The utilization rate in refineries should be above 80% during the fourth quarter 2023, with the restart of Port
Arthur expected in mid-November.
In the fourth quarter 2023, TotalEnergies anticipates cash proceeds of around $4.1 billion(18) from the Canadian
assets divestments, which could bring back the gearing below 8%. The Company confirms 2023 net
investment guidance between $16 and $17 billion.
* * * *
To listen to the conference call with CEO Patrick Pouyanné and CFO Jean-Pierre Sbraire today at 13:30 (Paris time),
please log on to totalenergies.com or dial +44 (0) 121 281 8004 or +1 (718) 705-8796. The conference replay will be
available on the Company's website totalenergies.com after the event.
* * * *
TotalEnergies contacts
Media Relations: +33 (0)1 47 44 46 99 l presse@totalenergies.com l @TotalEnergiesPR
Investor Relations: +33 (0)1 47 44 46 46 l ir@totalenergies.com
(18) Excluding adjustments and contingent payments.
14 |
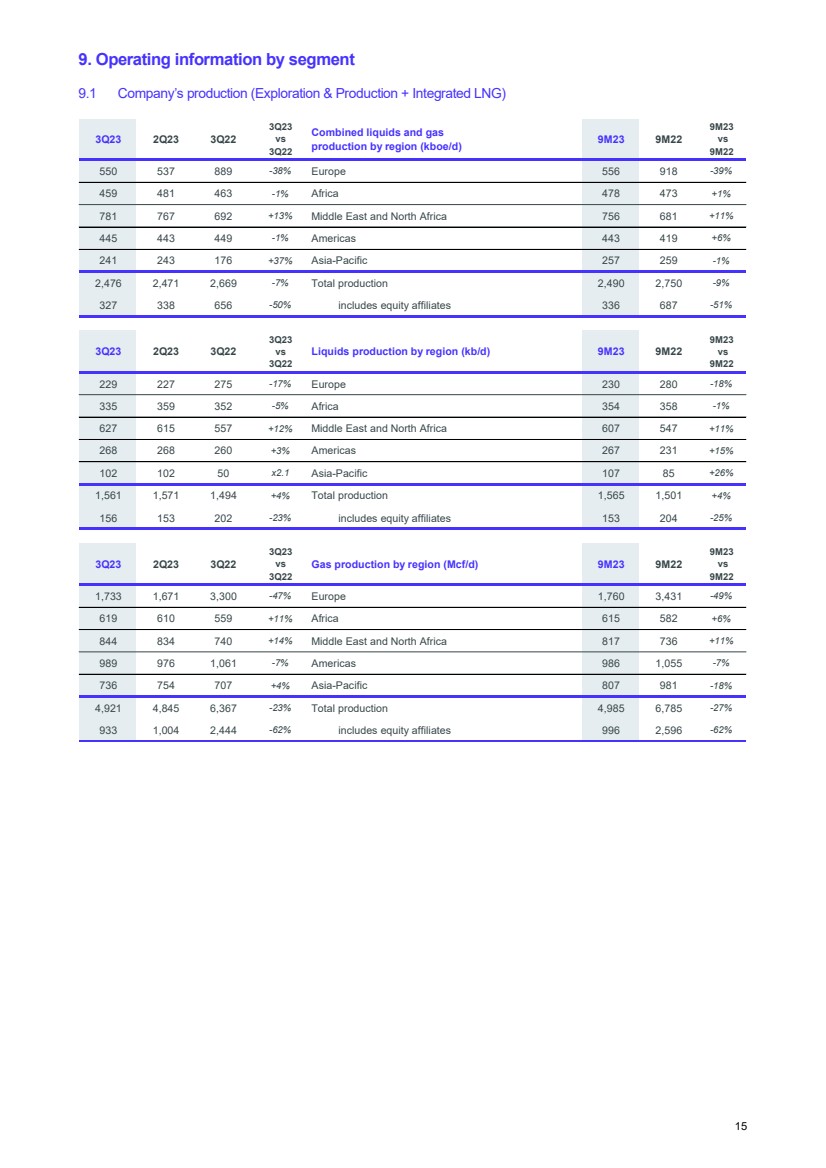
| 9. Operating information by segment
9.1 Company’s production (Exploration & Production + Integrated LNG)
3Q23 2Q23 3Q22
3Q23
vs
3Q22
Combined liquids and gas
production by region (kboe/d) 9M23 9M22
9M23
vs
9M22
550 537 889 -38% Europe 556 918 -39%
459 481 463 -1% Africa 478 473 +1%
781 767 692 +13% Middle East and North Africa 756 681 +11%
445 443 449 -1% Americas 443 419 +6%
241 243 176 +37% Asia-Pacific 257 259 -1%
2,476 2,471 2,669 -7% Total production 2,490 2,750 -9%
327 338 656 -50% includes equity affiliates 336 687 -51%
3Q23 2Q23 3Q22
3Q23
vs
3Q22
Liquids production by region (kb/d) 9M23 9M22
9M23
vs
9M22
229 227 275 -17% Europe 230 280 -18%
335 359 352 -5% Africa 354 358 -1%
627 615 557 +12% Middle East and North Africa 607 547 +11%
268 268 260 +3% Americas 267 231 +15%
102 102 50 x2.1 Asia-Pacific 107 85 +26%
1,561 1,571 1,494 +4% Total production 1,565 1,501 +4%
156 153 202 -23% includes equity affiliates 153 204 -25%
3Q23 2Q23 3Q22
3Q23
vs
3Q22
Gas production by region (Mcf/d) 9M23 9M22
9M23
vs
9M22
1,733 1,671 3,300 -47% Europe 1,760 3,431 -49%
619 610 559 +11% Africa 615 582 +6%
844 834 740 +14% Middle East and North Africa 817 736 +11%
989 976 1,061 -7% Americas 986 1,055 -7%
736 754 707 +4% Asia-Pacific 807 981 -18%
4,921 4,845 6,367 -23% Total production 4,985 6,785 -27%
933 1,004 2,444 -62% includes equity affiliates 996 2,596 -62%
15 |
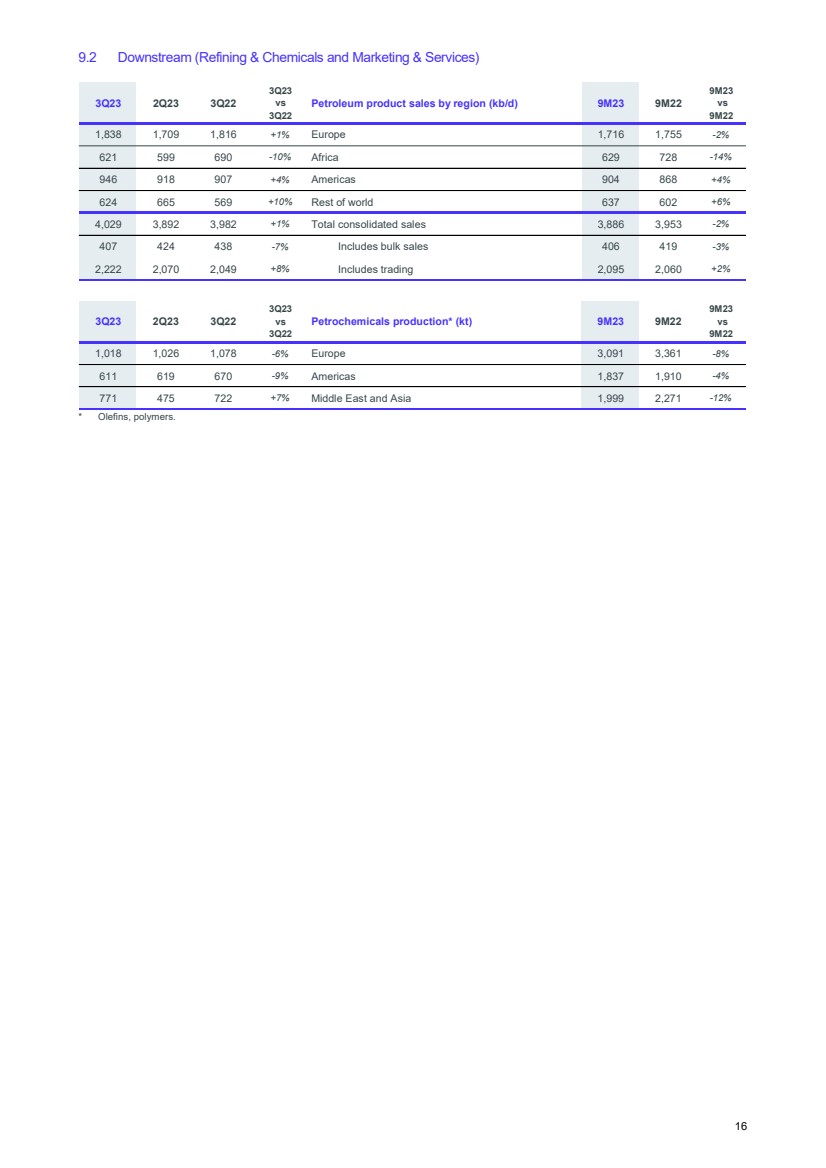
| 9.2 Downstream (Refining & Chemicals and Marketing & Services)
* Olefins, polymers.
3Q23 2Q23 3Q22
3Q23
vs
3Q22
Petroleum product sales by region (kb/d) 9M23 9M22
9M23
vs
9M22
1,838 1,709 1,816 +1% Europe 1,716 1,755 -2%
621 599 690 -10% Africa 629 728 -14%
946 918 907 +4% Americas 904 868 +4%
624 665 569 +10% Rest of world 637 602 +6%
4,029 3,892 3,982 +1% Total consolidated sales 3,886 3,953 -2%
407 424 438 -7% Includes bulk sales 406 419 -3%
2,222 2,070 2,049 +8% Includes trading 2,095 2,060 +2%
3Q23 2Q23 3Q22
3Q23
vs
3Q22
Petrochemicals production* (kt) 9M23 9M22
9M23
vs
9M22
1,018 1,026 1,078 -6% Europe 3,091 3,361 -8%
611 619 670 -9% Americas 1,837 1,910 -4%
771 475 722 +7% Middle East and Asia 1,999 2,271 -12%
16 |
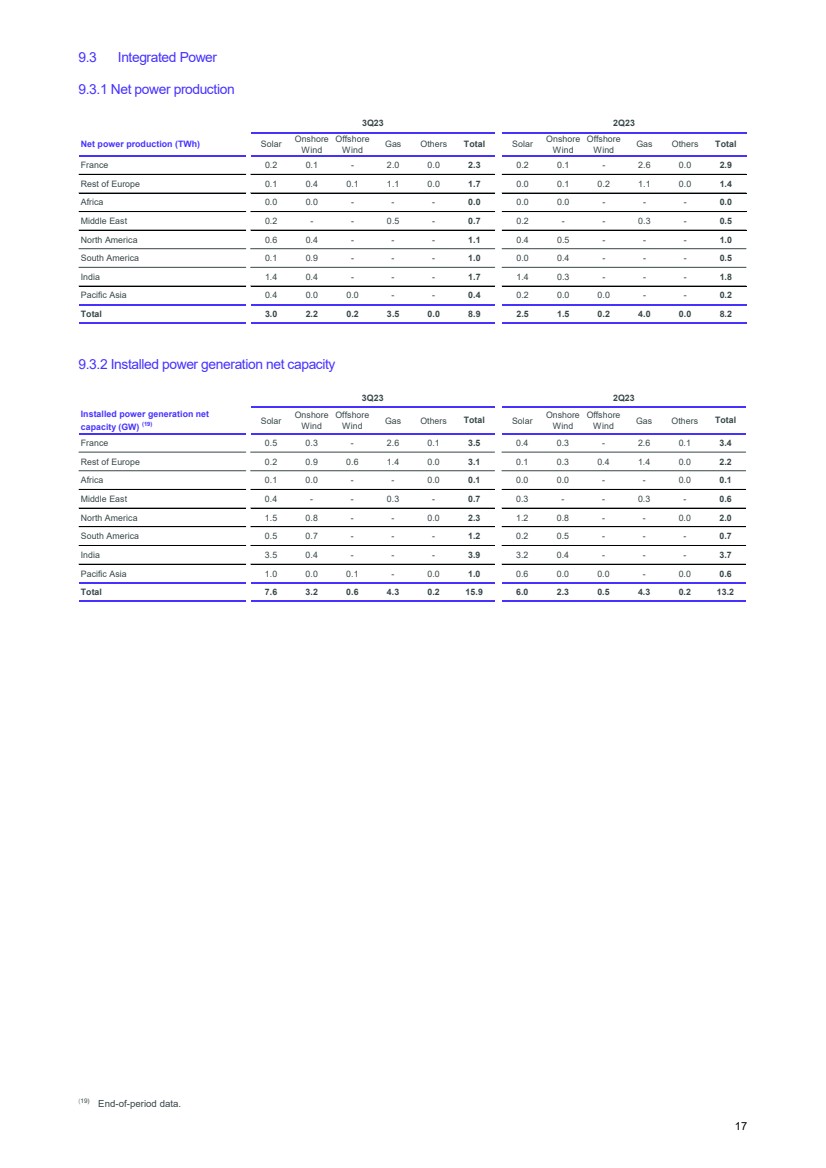
| 9.3 Integrated Power
9.3.1 Net power production
9.3.2 Installed power generation net capacity
1
(19) End-of-period data.
Net power production (TWh) Solar Onshore
Wind
Offshore
Wind Gas Others Total Solar Onshore
Wind
Offshore
Wind Gas Others Total
France 0.2 0.1 - 2.0 0.0 2.3 0.2 0.1 - 2.6 0.0 2.9
Rest of Europe 0.1 0.4 0.1 1.1 0.0 1.7 0.0 0.1 0.2 1.1 0.0 1.4
Africa 0.0 0.0 - - - 0.0 0.0 0.0 - - - 0.0
Middle East 0.2 - - 0.5 - 0.7 0.2 - - 0.3 - 0.5
North America 0.6 0.4 - - - 1.1 0.4 0.5 - - - 1.0
South America 0.1 0.9 - - - 1.0 0.0 0.4 - - - 0.5
India 1.4 0.4 - - - 1.7 1.4 0.3 - - - 1.8
Pacific Asia 0.4 0.0 0.0 - - 0.4 0.2 0.0 0.0 - - 0.2
Total 3.0 2.2 0.2 3.5 0.0 8.9 2.5 1.5 0.2 4.0 0.0 8.2
3Q23 2Q23
Installed power generation net
capacity (GW) (19) Solar Onshore
Wind
Offshore
Wind Gas Others Total Solar Onshore
Wind
Offshore
Wind Gas Others Total
France 0.5 0.3 - 2.6 0.1 3.5 0.4 0.3 - 2.6 0.1 3.4
Rest of Europe 0.2 0.9 0.6 1.4 0.0 3.1 0.1 0.3 0.4 1.4 0.0 2.2
Africa 0.1 0.0 - - 0.0 0.1 0.0 0.0 - - 0.0 0.1
Middle East 0.4 - - 0.3 - 0.7 0.3 - - 0.3 - 0.6
North America 1.5 0.8 - - 0.0 2.3 1.2 0.8 - - 0.0 2.0
South America 0.5 0.7 - - - 1.2 0.2 0.5 - - - 0.7
India 3.5 0.4 - - - 3.9 3.2 0.4 - - - 3.7
Pacific Asia 1.0 0.0 0.1 - 0.0 1.0 0.6 0.0 0.0 - 0.0 0.6
Total 7.6 3.2 0.6 4.3 0.2 15.9 6.0 2.3 0.5 4.3 0.2 13.2
3Q23 2Q23
17 |
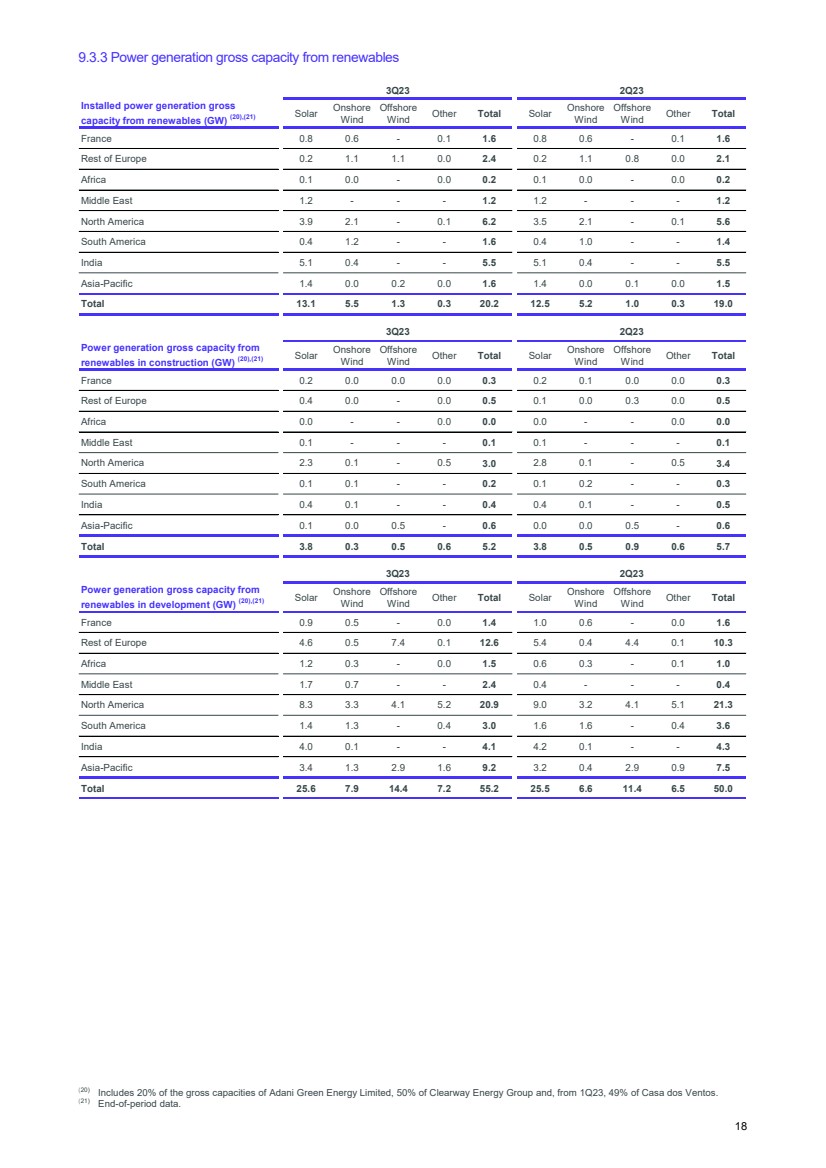
| 9.3.3 Power generation gross capacity from renewables
12
(20) Includes 20% of the gross capacities of Adani Green Energy Limited, 50% of Clearway Energy Group and, from 1Q23, 49% of Casa dos Ventos.
(21) End-of-period data.
Installed power generation gross
capacity from renewables (GW) (20),(21) Solar Onshore
Wind
Offshore
Wind Other Total Solar Onshore
Wind
Offshore
Wind Other Total
France 0.8 0.6 - 0.1 1.6 0.8 0.6 - 0.1 1.6
Rest of Europe 0.2 1.1 1.1 0.0 2.4 0.2 1.1 0.8 0.0 2.1
Africa 0.1 0.0 - 0.0 0.2 0.1 0.0 - 0.0 0.2
Middle East 1.2 - - - 1.2 1.2 - - - 1.2
North America 3.9 2.1 - 0.1 6.2 3.5 2.1 - 0.1 5.6
South America 0.4 1.2 - - 1.6 0.4 1.0 - - 1.4
India 5.1 0.4 - - 5.5 5.1 0.4 - - 5.5
Asia-Pacific 1.4 0.0 0.2 0.0 1.6 1.4 0.0 0.1 0.0 1.5
Total 13.1 5.5 1.3 0.3 20.2 12.5 5.2 1.0 0.3 19.0
Power generation gross capacity from
renewables in construction (GW) (20),(21) Solar Onshore
Wind
Offshore
Wind Other Total Solar Onshore
Wind
Offshore
Wind Other Total
France 0.2 0.0 0.0 0.0 0.3 0.2 0.1 0.0 0.0 0.3
Rest of Europe 0.4 0.0 - 0.0 0.5 0.1 0.0 0.3 0.0 0.5
Africa 0.0 - - 0.0 0.0 0.0 - - 0.0 0.0
Middle East 0.1 - - - 0.1 0.1 - - - 0.1
North America 2.3 0.1 - 0.5 3.0 2.8 0.1 - 0.5 3.4
South America 0.1 0.1 - - 0.2 0.1 0.2 - - 0.3
India 0.4 0.1 - - 0.4 0.4 0.1 - - 0.5
Asia-Pacific 0.1 0.0 0.5 - 0.6 0.0 0.0 0.5 - 0.6
Total 3.8 0.3 0.5 0.6 5.2 3.8 0.5 0.9 0.6 5.7
Power generation gross capacity from
renewables in development (GW) (20),(21) Solar Onshore
Wind
Offshore
Wind Other Total Solar Onshore
Wind
Offshore
Wind Other Total
France 0.9 0.5 - 0.0 1.4 1.0 0.6 - 0.0 1.6
Rest of Europe 4.6 0.5 7.4 0.1 12.6 5.4 0.4 4.4 0.1 10.3
Africa 1.2 0.3 - 0.0 1.5 0.6 0.3 - 0.1 1.0
Middle East 1.7 0.7 - - 2.4 0.4 - - - 0.4
North America 8.3 3.3 4.1 5.2 20.9 9.0 3.2 4.1 5.1 21.3
South America 1.4 1.3 - 0.4 3.0 1.6 1.6 - 0.4 3.6
India 4.0 0.1 - - 4.1 4.2 0.1 - - 4.3
Asia-Pacific 3.4 1.3 2.9 1.6 9.2 3.2 0.4 2.9 0.9 7.5
Total 25.6 7.9 14.4 7.2 55.2 25.5 6.6 11.4 6.5 50.0
3Q23 2Q23
3Q23 2Q23
3Q23 2Q23
18 |
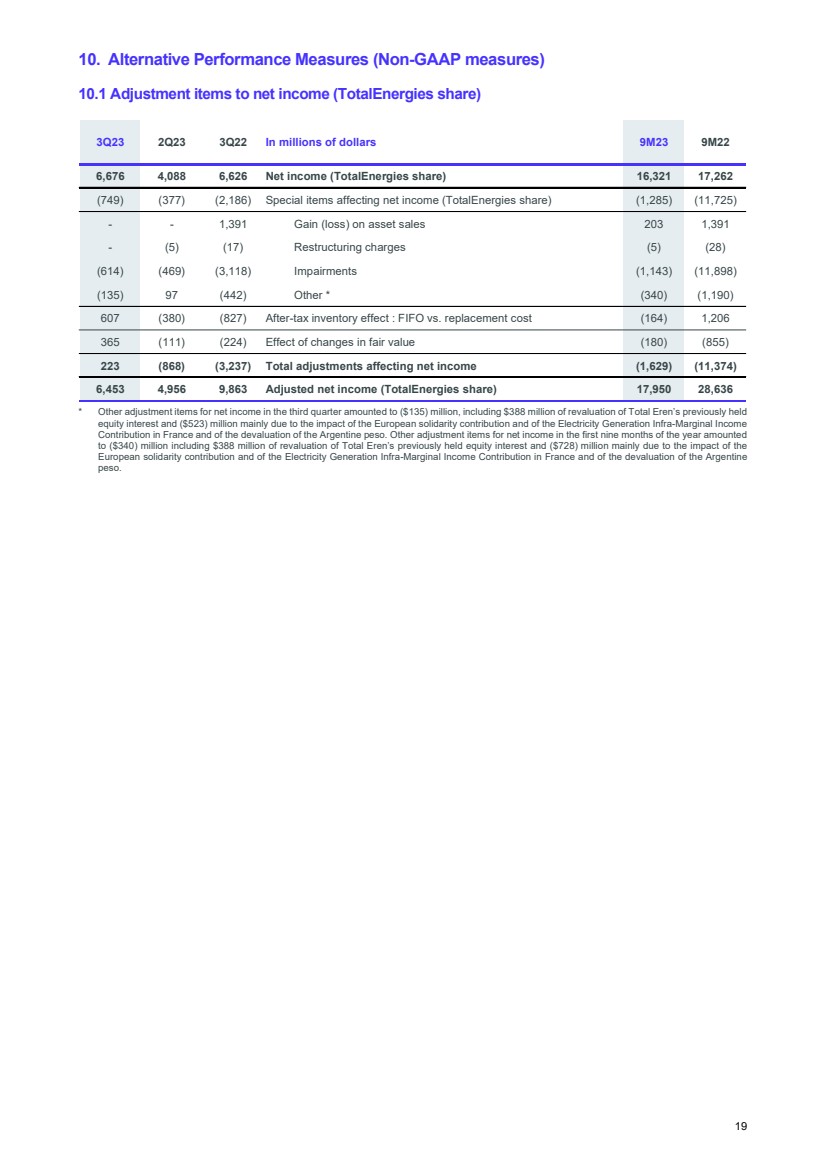
| 10. Alternative Performance Measures (Non-GAAP measures)
10.1 Adjustment items to net income (TotalEnergies share)
* Other adjustment items for net income in the third quarter amounted to ($135) million, including $388 million of revaluation of Total Eren’s previously held
equity interest and ($523) million mainly due to the impact of the European solidarity contribution and of the Electricity Generation Infra-Marginal Income
Contribution in France and of the devaluation of the Argentine peso. Other adjustment items for net income in the first nine months of the year amounted
to ($340) million including $388 million of revaluation of Total Eren’s previously held equity interest and ($728) million mainly due to the impact of the
European solidarity contribution and of the Electricity Generation Infra-Marginal Income Contribution in France and of the devaluation of the Argentine
peso.
3Q23 2Q23 3Q22 In millions of dollars 9M23 9M22
6,676 4,088 6,626 Net income (TotalEnergies share) 16,321 17,262
(749) (377) (2,186) Special items affecting net income (TotalEnergies share) (1,285) (11,725)
- - 1,391 Gain (loss) on asset sales 203 1,391
- (5) (17) Restructuring charges (5) (28)
(614) (469) (3,118) Impairments (1,143) (11,898)
(135) 97 (442) Other * (340) (1,190)
607 (380) (827) After-tax inventory effect : FIFO vs. replacement cost (164) 1,206
365 (111) (224) Effect of changes in fair value (180) (855)
223 (868) (3,237) Total adjustments affecting net income (1,629) (11,374)
6,453 4,956 9,863 Adjusted net income (TotalEnergies share) 17,950 28,636
19 |
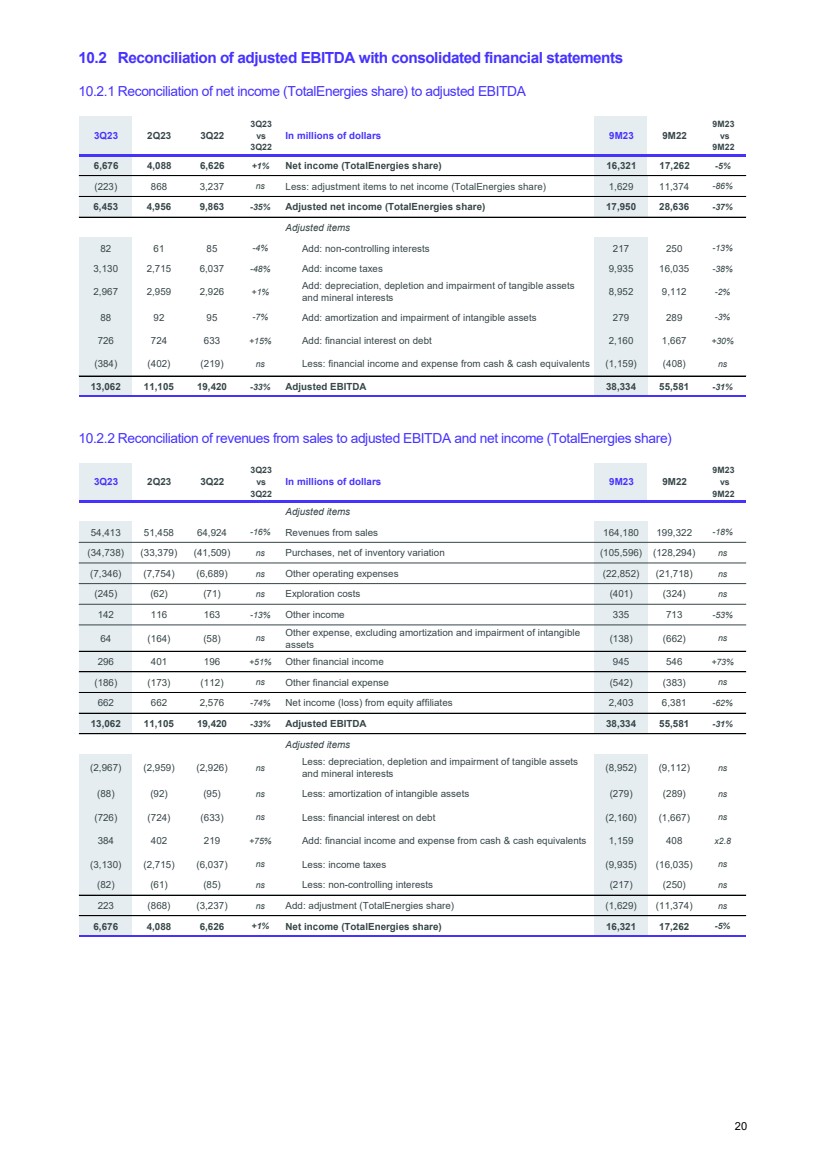
| 10.2 Reconciliation of adjusted EBITDA with consolidated financial statements
10.2.1 Reconciliation of net income (TotalEnergies share) to adjusted EBITDA
10.2.2 Reconciliation of revenues from sales to adjusted EBITDA and net income (TotalEnergies share)
3Q23 2Q23 3Q22
3Q23
vs
3Q22
In millions of dollars 9M23 9M22
9M23
vs
9M22
6,676 4,088 6,626 +1% Net income (TotalEnergies share) 16,321 17,262 -5%
(223) 868 3,237 ns Less: adjustment items to net income (TotalEnergies share) 1,629 11,374 -86%
6,453 4,956 9,863 -35% Adjusted net income (TotalEnergies share) 17,950 28,636 -37%
Adjusted items
82 61 85 -4% Add: non-controlling interests 217 250 -13%
3,130 2,715 6,037 -48% Add: income taxes 9,935 16,035 -38%
2,967 2,959 2,926 +1% Add: depreciation, depletion and impairment of tangible assets
and mineral interests 8,952 9,112 -2%
88 92 95 -7% Add: amortization and impairment of intangible assets 279 289 -3%
726 724 633 +15% Add: financial interest on debt 2,160 1,667 +30%
(384) (402) (219) ns Less: financial income and expense from cash & cash equivalents (1,159) (408) ns
13,062 11,105 19,420 -33% Adjusted EBITDA 38,334 55,581 -31%
3Q23 2Q23 3Q22
3Q23
vs
3Q22
In millions of dollars 9M23 9M22
9M23
vs
9M22
Adjusted items
54,413 51,458 64,924 -16% Revenues from sales 164,180 199,322 -18%
(34,738) (33,379) (41,509) ns Purchases, net of inventory variation (105,596) (128,294) ns
(7,346) (7,754) (6,689) ns Other operating expenses (22,852) (21,718) ns
(245) (62) (71) ns Exploration costs (401) (324) ns
142 116 163 -13% Other income 335 713 -53%
64 (164) (58) ns
Other expense, excluding amortization and impairment of intangible
assets (138) (662) ns
296 401 196 +51% Other financial income 945 546 +73%
(186) (173) (112) ns Other financial expense (542) (383) ns
662 662 2,576 -74% Net income (loss) from equity affiliates 2,403 6,381 -62%
13,062 11,105 19,420 -33% Adjusted EBITDA 38,334 55,581 -31%
Adjusted items
(2,967) (2,959) (2,926) ns
Less: depreciation, depletion and impairment of tangible assets
and mineral interests (8,952) (9,112) ns
(88) (92) (95) ns Less: amortization of intangible assets (279) (289) ns
(726) (724) (633) ns Less: financial interest on debt (2,160) (1,667) ns
384 402 219 +75% Add: financial income and expense from cash & cash equivalents 1,159 408 x2.8
(3,130) (2,715) (6,037) ns Less: income taxes (9,935) (16,035) ns
(82) (61) (85) ns Less: non-controlling interests (217) (250) ns
223 (868) (3,237) ns Add: adjustment (TotalEnergies share) (1,629) (11,374) ns
6,676 4,088 6,626 +1% Net income (TotalEnergies share) 16,321 17,262 -5%
20 |
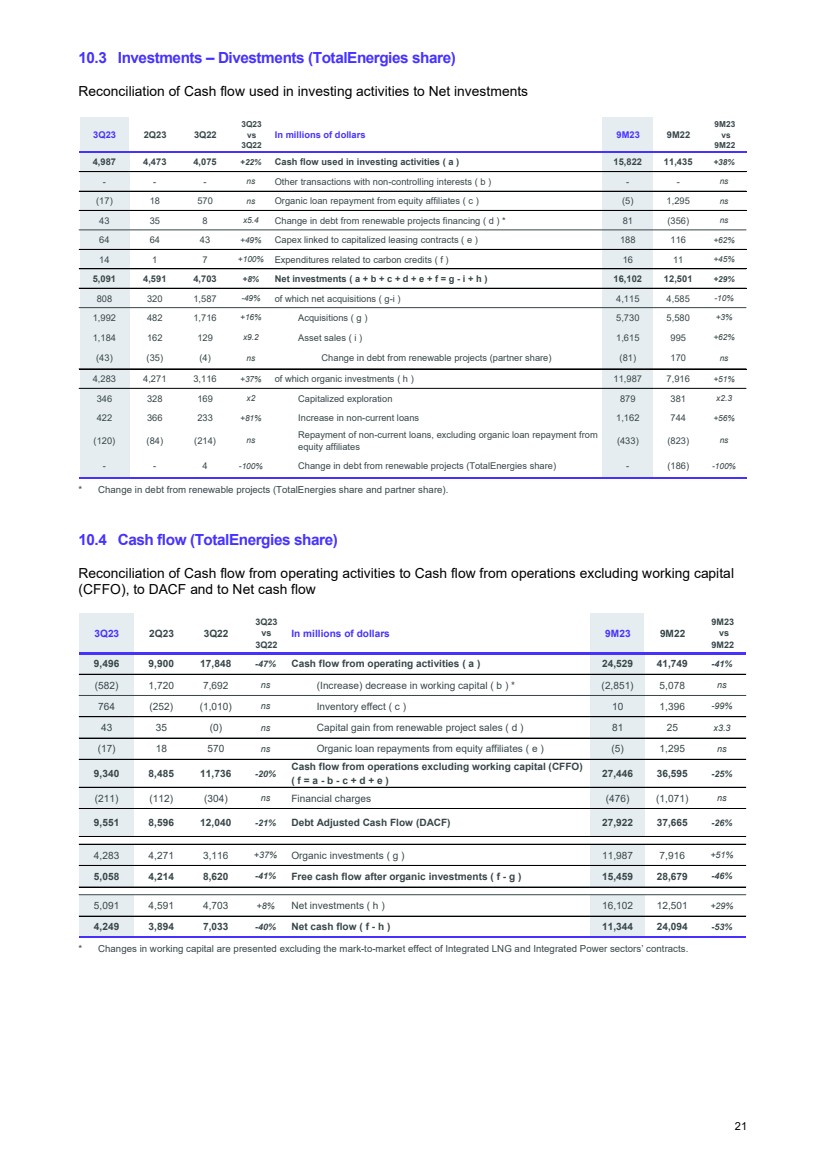
| 10.3 Investments – Divestments (TotalEnergies share)
Reconciliation of Cash flow used in investing activities to Net investments
* Change in debt from renewable projects (TotalEnergies share and partner share).
10.4 Cash flow (TotalEnergies share)
Reconciliation of Cash flow from operating activities to Cash flow from operations excluding working capital
(CFFO), to DACF and to Net cash flow
* Changes in working capital are presented excluding the mark-to-market effect of Integrated LNG and Integrated Power sectors’ contracts.
3Q23 2Q23 3Q22
3Q23
vs
3Q22
In millions of dollars 9M23 9M22
9M23
vs
9M22
4,987 4,473 4,075 +22% Cash flow used in investing activities ( a ) 15,822 11,435 +38%
- - - ns Other transactions with non-controlling interests ( b ) - - ns
(17) 18 570 ns Organic loan repayment from equity affiliates ( c ) (5) 1,295 ns
43 35 8 x5.4 Change in debt from renewable projects financing ( d ) * 81 (356) ns
64 64 43 +49% Capex linked to capitalized leasing contracts ( e ) 188 116 +62%
14 1 7 +100% Expenditures related to carbon credits ( f ) 16 11 +45%
5,091 4,591 4,703 +8% Net investments ( a + b + c + d + e + f = g - i + h ) 16,102 12,501 +29%
808 320 1,587 -49% of which net acquisitions ( g-i ) 4,115 4,585 -10%
1,992 482 1,716 +16% Acquisitions ( g ) 5,730 5,580 +3%
1,184 162 129 x9.2 Asset sales ( i ) 1,615 995 +62%
(43) (35) (4) ns Change in debt from renewable projects (partner share) (81) 170 ns
4,283 4,271 3,116 +37% of which organic investments ( h ) 11,987 7,916 +51%
346 328 169 x2 Capitalized exploration 879 381 x2.3
422 366 233 +81% Increase in non-current loans 1,162 744 +56%
(120) (84) (214) ns
Repayment of non-current loans, excluding organic loan repayment from
equity affiliates (433) (823) ns
- - 4 -100% Change in debt from renewable projects (TotalEnergies share) - (186) -100%
3Q23 2Q23 3Q22
3Q23
vs
3Q22
In millions of dollars 9M23 9M22
9M23
vs
9M22
9,496 9,900 17,848 -47% Cash flow from operating activities ( a ) 24,529 41,749 -41%
(582) 1,720 7,692 ns (Increase) decrease in working capital ( b ) * (2,851) 5,078 ns
764 (252) (1,010) ns Inventory effect ( c ) 10 1,396 -99%
43 35 (0) ns Capital gain from renewable project sales ( d ) 81 25 x3.3
(17) 18 570 ns Organic loan repayments from equity affiliates ( e ) (5) 1,295 ns
9,340 8,485 11,736 -20% Cash flow from operations excluding working capital (CFFO)
( f = a - b - c + d + e ) 27,446 36,595 -25%
(211) (112) (304) ns Financial charges (476) (1,071) ns
9,551 8,596 12,040 -21% Debt Adjusted Cash Flow (DACF) 27,922 37,665 -26%
4,283 4,271 3,116 +37% Organic investments ( g ) 11,987 7,916 +51%
5,058 4,214 8,620 -41% Free cash flow after organic investments ( f - g ) 15,459 28,679 -46%
5,091 4,591 4,703 +8% Net investments ( h ) 16,102 12,501 +29%
4,249 3,894 7,033 -40% Net cash flow ( f - h ) 11,344 24,094 -53%
21 |
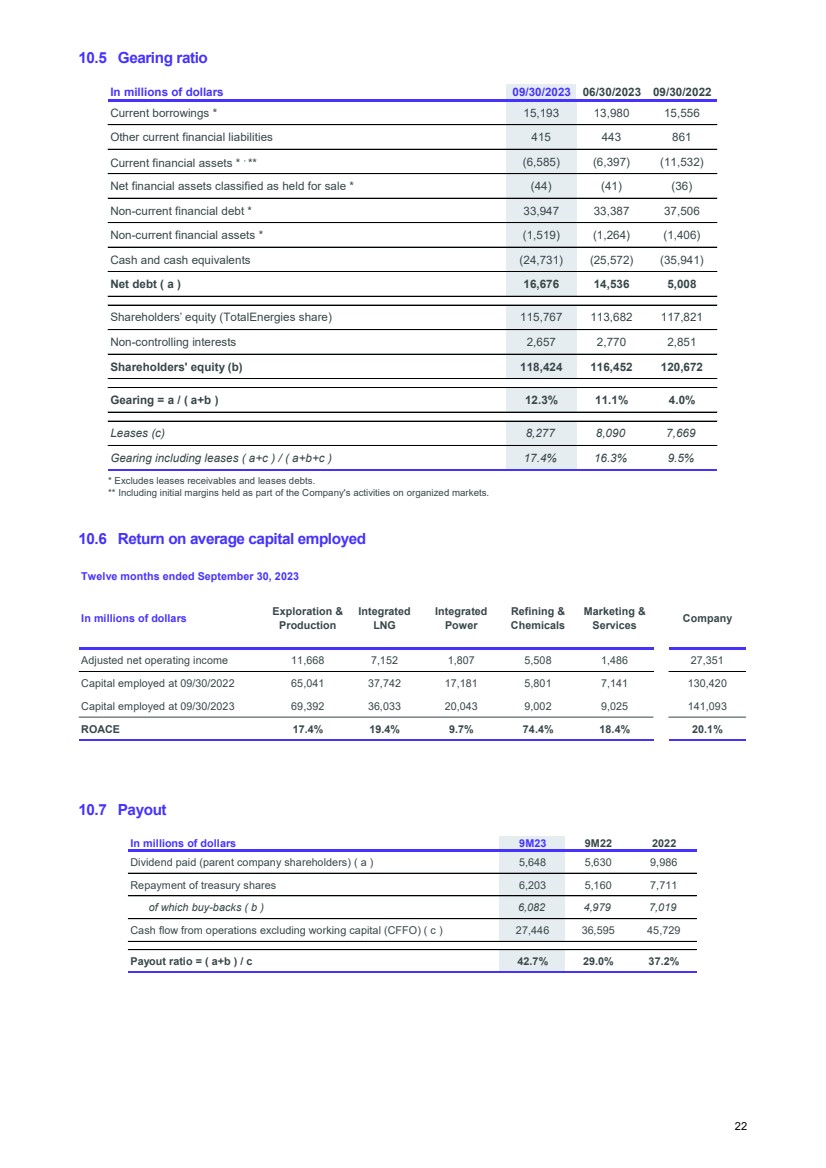
| 10.5 Gearing ratio
* Excludes leases receivables and leases debts.
** Including initial margins held as part of the Company's activities on organized markets.
10.6 Return on average capital employed
10.7 Payout
In millions of dollars 09/30/2023 06/30/2023 09/30/2022
Current borrowings * 15,193 13,980 15,556
Other current financial liabilities 415 443 861
Current financial assets * , ** (6,585) (6,397) (11,532)
Net financial assets classified as held for sale * (44) (41) (36)
Non-current financial debt * 33,947 33,387 37,506
Non-current financial assets * (1,519) (1,264) (1,406)
Cash and cash equivalents (24,731) (25,572) (35,941)
Net debt ( a ) 16,676 14,536 5,008
Shareholders’ equity (TotalEnergies share) 115,767 113,682 117,821
Non-controlling interests 2,657 2,770 2,851
Shareholders' equity (b) 118,424 116,452 120,672
Gearing = a / ( a+b ) 12.3% 11.1% 4.0%
Leases (c) 8,277 8,090 7,669
Gearing including leases ( a+c ) / ( a+b+c ) 17.4% 16.3% 9.5%
Twelve months ended September 30, 2023
In millions of dollars Exploration &
Production
Integrated
LNG
Integrated
Power
Refining &
Chemicals
Marketing &
Services Company
Adjusted net operating income 11,668 7,152 1,807 5,508 1,486 27,351
Capital employed at 09/30/2022 65,041 37,742 17,181 5,801 7,141 130,420
Capital employed at 09/30/2023 69,392 36,033 20,043 9,002 9,025 141,093
ROACE 17.4% 19.4% 9.7% 74.4% 18.4% 20.1%
In millions of dollars 9M23 9M22 2022
Dividend paid (parent company shareholders) ( a ) 5,648 5,630 9,986
Repayment of treasury shares 6,203 5,160 7,711
of which buy-backs ( b ) 6,082 4,979 7,019
Cash flow from operations excluding working capital (CFFO) ( c ) 27,446 36,595 45,729
Payout ratio = ( a+b ) / c 42.7% 29.0% 37.2%
22 |
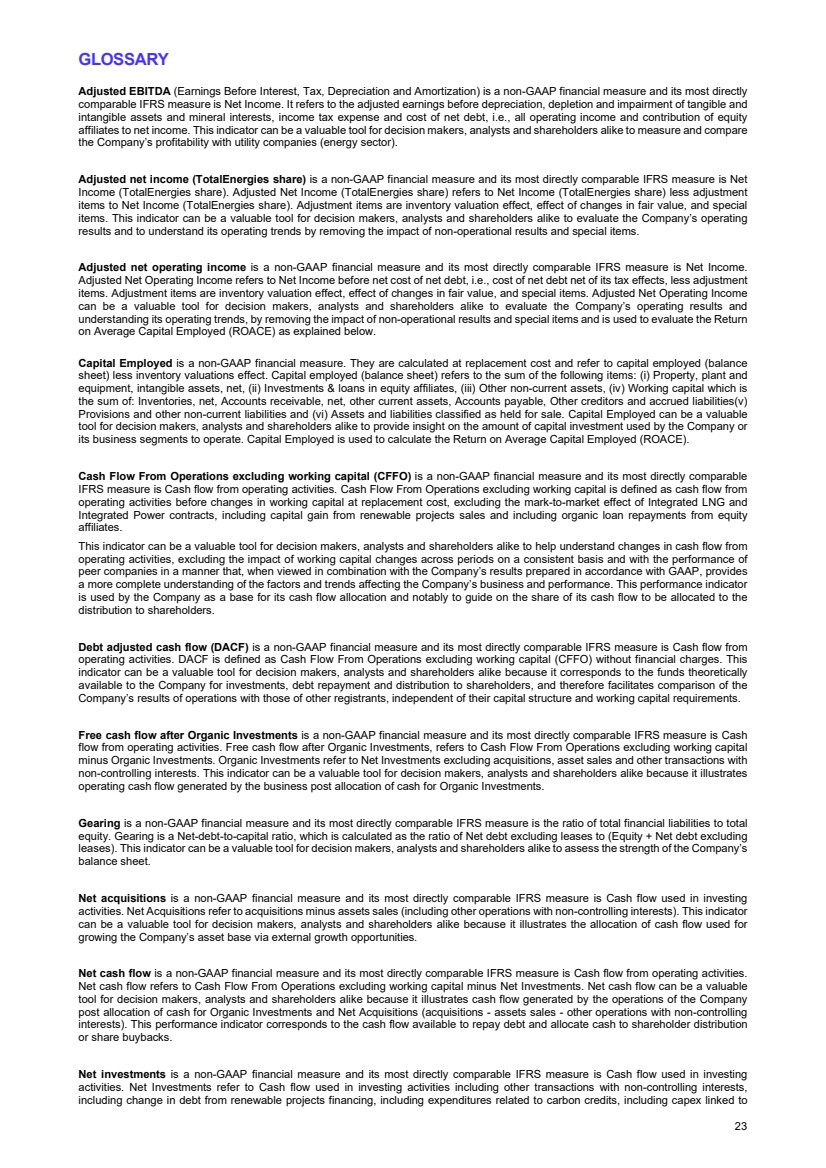
| GLOSSARY
Adjusted EBITDA (Earnings Before Interest, Tax, Depreciation and Amortization) is a non-GAAP financial measure and its most directly
comparable IFRS measure is Net Income. It refers to the adjusted earnings before depreciation, depletion and impairment of tangible and
intangible assets and mineral interests, income tax expense and cost of net debt, i.e., all operating income and contribution of equity
affiliates to net income. This indicator can be a valuable tool for decision makers, analysts and shareholders alike to measure and compare
the Company’s profitability with utility companies (energy sector).
Adjusted net income (TotalEnergies share) is a non-GAAP financial measure and its most directly comparable IFRS measure is Net
Income (TotalEnergies share). Adjusted Net Income (TotalEnergies share) refers to Net Income (TotalEnergies share) less adjustment
items to Net Income (TotalEnergies share). Adjustment items are inventory valuation effect, effect of changes in fair value, and special
items. This indicator can be a valuable tool for decision makers, analysts and shareholders alike to evaluate the Company’s operating
results and to understand its operating trends by removing the impact of non-operational results and special items.
Adjusted net operating income is a non-GAAP financial measure and its most directly comparable IFRS measure is Net Income.
Adjusted Net Operating Income refers to Net Income before net cost of net debt, i.e., cost of net debt net of its tax effects, less adjustment
items. Adjustment items are inventory valuation effect, effect of changes in fair value, and special items. Adjusted Net Operating Income
can be a valuable tool for decision makers, analysts and shareholders alike to evaluate the Company’s operating results and
understanding its operating trends, by removing the impact of non-operational results and special items and is used to evaluate the Return
on Average Capital Employed (ROACE) as explained below.
Capital Employed is a non-GAAP financial measure. They are calculated at replacement cost and refer to capital employed (balance
sheet) less inventory valuations effect. Capital employed (balance sheet) refers to the sum of the following items: (i) Property, plant and
equipment, intangible assets, net, (ii) Investments & loans in equity affiliates, (iii) Other non-current assets, (iv) Working capital which is
the sum of: Inventories, net, Accounts receivable, net, other current assets, Accounts payable, Other creditors and accrued liabilities(v)
Provisions and other non-current liabilities and (vi) Assets and liabilities classified as held for sale. Capital Employed can be a valuable
tool for decision makers, analysts and shareholders alike to provide insight on the amount of capital investment used by the Company or
its business segments to operate. Capital Employed is used to calculate the Return on Average Capital Employed (ROACE).
Cash Flow From Operations excluding working capital (CFFO) is a non-GAAP financial measure and its most directly comparable
IFRS measure is Cash flow from operating activities. Cash Flow From Operations excluding working capital is defined as cash flow from
operating activities before changes in working capital at replacement cost, excluding the mark-to-market effect of Integrated LNG and
Integrated Power contracts, including capital gain from renewable projects sales and including organic loan repayments from equity
affiliates.
This indicator can be a valuable tool for decision makers, analysts and shareholders alike to help understand changes in cash flow from
operating activities, excluding the impact of working capital changes across periods on a consistent basis and with the performance of
peer companies in a manner that, when viewed in combination with the Company’s results prepared in accordance with GAAP, provides
a more complete understanding of the factors and trends affecting the Company’s business and performance. This performance indicator
is used by the Company as a base for its cash flow allocation and notably to guide on the share of its cash flow to be allocated to the
distribution to shareholders.
Debt adjusted cash flow (DACF) is a non-GAAP financial measure and its most directly comparable IFRS measure is Cash flow from
operating activities. DACF is defined as Cash Flow From Operations excluding working capital (CFFO) without financial charges. This
indicator can be a valuable tool for decision makers, analysts and shareholders alike because it corresponds to the funds theoretically
available to the Company for investments, debt repayment and distribution to shareholders, and therefore facilitates comparison of the
Company’s results of operations with those of other registrants, independent of their capital structure and working capital requirements.
Free cash flow after Organic Investments is a non-GAAP financial measure and its most directly comparable IFRS measure is Cash
flow from operating activities. Free cash flow after Organic Investments, refers to Cash Flow From Operations excluding working capital
minus Organic Investments. Organic Investments refer to Net Investments excluding acquisitions, asset sales and other transactions with
non-controlling interests. This indicator can be a valuable tool for decision makers, analysts and shareholders alike because it illustrates
operating cash flow generated by the business post allocation of cash for Organic Investments.
Gearing is a non-GAAP financial measure and its most directly comparable IFRS measure is the ratio of total financial liabilities to total
equity. Gearing is a Net-debt-to-capital ratio, which is calculated as the ratio of Net debt excluding leases to (Equity + Net debt excluding
leases). This indicator can be a valuable tool for decision makers, analysts and shareholders alike to assess the strength of the Company’s
balance sheet.
Net acquisitions is a non-GAAP financial measure and its most directly comparable IFRS measure is Cash flow used in investing
activities. Net Acquisitions refer to acquisitions minus assets sales (including other operations with non-controlling interests). This indicator
can be a valuable tool for decision makers, analysts and shareholders alike because it illustrates the allocation of cash flow used for
growing the Company’s asset base via external growth opportunities.
Net cash flow is a non-GAAP financial measure and its most directly comparable IFRS measure is Cash flow from operating activities.
Net cash flow refers to Cash Flow From Operations excluding working capital minus Net Investments. Net cash flow can be a valuable
tool for decision makers, analysts and shareholders alike because it illustrates cash flow generated by the operations of the Company
post allocation of cash for Organic Investments and Net Acquisitions (acquisitions - assets sales - other operations with non-controlling
interests). This performance indicator corresponds to the cash flow available to repay debt and allocate cash to shareholder distribution
or share buybacks.
Net investments is a non-GAAP financial measure and its most directly comparable IFRS measure is Cash flow used in investing
activities. Net Investments refer to Cash flow used in investing activities including other transactions with non-controlling interests,
including change in debt from renewable projects financing, including expenditures related to carbon credits, including capex linked to
23 |

| capitalized leasing contracts and excluding organic loan repayment from equity affiliates. This indicator can be a valuable tool for decision
makers, analysts and shareholders alike to illustrate the cash directed to growth opportunities, both internal and external, thereby showing,
when combined with the Company’s cash flow statement prepared under IFRS, how cash is generated and allocated for uses within the
organization. Net Investments are the sum of Organic Investments and Net Acquisitions each of which is described in the Glossary.
Organic investments is a non-GAAP financial measure and its most directly comparable IFRS measure is Cash flow used in investing
activities. Organic investments refers to Net Investments, excluding acquisitions, asset sales and other operations with non-controlling
interests. Organic Investments can be a valuable tool for decision makers, analysts and shareholders alike because it illustrates cash flow
used by the Company to grow its asset base, excluding sources of external growth.
Payout is a non-GAAP financial measure. Payout is defined as the ratio of the dividends and share buybacks to the Cash Flow From
Operations excluding working capital. This indicator can be a valuable tool for decision makers, analysts and shareholders as it provides
the portion of the Cash Flow From Operations excluding working capital distributed to the shareholder.
Return on Average Capital Employed (ROACE) is a non-GAAP financial measure. ROACE is the ratio of Adjusted Net Operating
Income to average Capital Employed at replacement cost between the beginning and the end of the period. This indicator can be a
valuable tool for decision makers, analysts and shareholders alike to measure the profitability of the Company’s average Capital Employed
in its business operations and is used by the Company to benchmark its performance internally and externally with its peers.
24 |

| Disclaimer:
The terms “TotalEnergies”, “TotalEnergies company” and “Company” in this document are used to designate TotalEnergies SE and the
consolidated entities directly or indirectly controlled by TotalEnergies SE. Likewise, the words “we”, “us” and “our” may also be used to refer to
these entities or their employees. The entities in which TotalEnergies SE directly or indirectly owns a shareholding are separate and independent
legal entities.
This press release presents the results for the third quarter of 2023 and first nine month of 2023 from the consolidated financial statements of
TotalEnergies SE as of September 30, 2023 (unaudited). The limited review procedures by the Statutory Auditors are underway. The notes to the
consolidated financial statements (unaudited) are available on the website totalenergies.com.
This document may contain forward-looking statements (including forward-looking statements within the meaning of the Private Securities Litigation
Reform Act of 1995), notably with respect to the financial condition, results of operations, business activities and industrial strategy of TotalEnergies.
This document may also contain statements regarding the perspectives, objectives, areas of improvement and goals of TotalEnergies, including
with respect to climate change and carbon neutrality (net zero emissions). An ambition expresses an outcome desired by TotalEnergies, it being
specified that the means to be deployed do not depend solely on TotalEnergies. These forward-looking statements may generally be identified by
the use of the future or conditional tense or forward-looking words such as “envisions”, “intends”, “anticipates”, “believes”, “considers”, “plans”,
“expects”, “thinks”, “targets”, “aims” or similar terminology. Such forward-looking statements included in this document are based on economic
data, estimates and assumptions prepared in a given economic, competitive and regulatory environment and considered to be reasonable by
TotalEnergies as of the date of this document. These forward-looking statements are not historical data and should not be interpreted as assurances
that the perspectives, objectives, or goals announced will be achieved. They may prove to be inaccurate in the future, and may evolve or be
modified with a significant difference between the actual results and those initially estimated, due to the uncertainties notably related to the
economic, financial, competitive and regulatory environment, or due to the occurrence of risk factors, such as, notably, the price fluctuations in
crude oil and natural gas, the evolution of the demand and price of petroleum products, the changes in production results and reserves estimates,
the ability to achieve cost reductions and operating efficiencies without unduly disrupting business operations, changes in laws and regulations
including those related to the environment and climate, currency fluctuations, as well as economic and political developments, changes in market
conditions, loss of market share and changes in consumer preferences, or pandemics such as the COVID-19 pandemic. Additionally, certain
financial information is based on estimates particularly in the assessment of the recoverable value of assets and potential impairments of assets
relating thereto. Neither TotalEnergies SE nor any of its subsidiaries assumes any obligation to update publicly any forward-looking information or
statement, objectives or trends contained in this document whether as a result of new information, future events or otherwise. The information on
risk factors that could have a significant adverse effect on TotalEnergies’ business, financial condition, including its operating income and cash
flow, reputation, outlook or the value of financial instruments issued by TotalEnergies is provided in the most recent version of the Universal
Registration Document which is filed by TotalEnergies SE with the French Autorité des Marchés Financiers and the annual report on Form 20-F
filed with the United States Securities and Exchange Commission (“SEC”).
Financial information by business segment is reported in accordance with the internal reporting system and shows internal segment information
that is used to manage and measure the performance of TotalEnergies. In addition to IFRS measures, certain alternative performance indicators
are presented, such as performance indicators excluding the adjustment items described below (adjusted operating income, adjusted net operating
income, adjusted net income), return on equity (ROE), return on average capital employed (ROACE), gearing ratio, operating cash flow before
working capital changes, the shareholder rate of return. These indicators are meant to facilitate the analysis of the financial performance of
TotalEnergies and the comparison of income between periods. They allow investors to track the measures used internally to manage and measure
the performance of TotalEnergies.
These adjustment items include:
(i) Special items
Due to their unusual nature or particular significance, certain transactions qualifying as "special items" are excluded from the business segment
figures. In general, special items relate to transactions that are significant, infrequent, or unusual. However, in certain instances, transactions such
as restructuring costs or assets disposals, which are not considered to be representative of the normal course of business, may qualify as special
items although they may have occurred in prior years or are likely to occur in following years.
(ii) The inventory valuation effect
In accordance with IAS 2, TotalEnergies values inventories of petroleum products in its financial statements according to the First-In, First-Out
(FIFO) method and other inventories using the weighted-average cost method. Under the FIFO method, the cost of inventory is based on the
historic cost of acquisition or manufacture rather than the current replacement cost. In volatile energy markets, this can have a significant distorting
effect on the reported income. Accordingly, the adjusted results of the Refining & Chemicals and Marketing & Services segments are presented
according to the replacement cost method. This method is used to assess the segments’ performance and facilitate the comparability of the
segments’ performance with those of its main competitors.
In the replacement cost method, which approximates the Last-In, First-Out (LIFO) method, the variation of inventory values in the statement of
income is, depending on the nature of the inventory, determined using either the month-end prices differential between one period and another or
the average prices of the period rather than the historical value. The inventory valuation effect is the difference between the results under the FIFO
and the replacement cost methods.
(iii) Effect of changes in fair value
The effect of changes in fair value presented as an adjustment item reflects, for trading inventories and storage contracts, differences between
internal measures of performance used by TotalEnergies’ Executive Committee and the accounting for these transactions under IFRS.
IFRS requires that trading inventories be recorded at their fair value using period-end spot prices. In order to best reflect the management of
economic exposure through derivative transactions, internal indicators used to measure performance include valuations of trading inventories
based on forward prices.
TotalEnergies, in its trading activities, enters into storage contracts, whose future effects are recorded at fair value in TotalEnergies’ internal
economic performance. IFRS precludes recognition of this fair value effect.
Furthermore, TotalEnergies enters into derivative instruments to risk manage certain operational contracts or assets. Under IFRS, these derivatives
are recorded at fair value while the underlying operational transactions are recorded as they occur. Internal indicators defer the fair value on
derivatives to match with the transaction occurrence.
The adjusted results (adjusted operating income, adjusted net operating income, adjusted net income) are defined as replacement cost results,
adjusted for special items, excluding the effect of changes in fair value.
Euro amounts presented for the fully adjusted-diluted earnings per share represent dollar amounts converted at the average euro-dollar (€-$)
exchange rate for the applicable period and are not the result of financial statements prepared in euros.
Cautionary Note to U.S. Investors – The SEC permits oil and gas companies, in their filings with the SEC, to separately disclose proved, probable
and possible reserves that a company has determined in accordance with SEC rules. We may use certain terms in this press release, such as
“potential reserves” or “resources”, that the SEC’s guidelines strictly prohibit us from including in filings with the SEC. U.S. investors are urged to
consider closely the disclosure in the Form 20-F of TotalEnergies SE, File N° 1-10888, available from us at 2, place Jean Millier – Arche Nord
Coupole/Regnault - 92078 Paris-La Défense Cedex, France, or at our website totalenergies.com. You can also obtain this form from the SEC by
calling 1-800-SEC-0330 or on the SEC’s website sec.gov.
25 |
| TotalEnergies financial statements
Third quarter and nine months 2023 consolidated accounts, IFRS
26 |

| CONSOLIDATED STATEMENT OF INCOME
TotalEnergies
(unaudited)
3
rd quarter 2
nd quarter 3
rd quarter
(M$)(a) 2023 2023 2022
Sales 59,017 56,271 69,037
Excise taxes (4,604) (4,737) (4,075)
Revenues from sales 54,413 51,534 64,962
Purchases, net of inventory variation (33,676) (33,864) (42,802)
Other operating expenses (7,562) (7,906) (6,771)
Exploration costs (245) (62) (71)
Depreciation, depletion and impairment of tangible assets and mineral interests (3,055) (3,106) (2,935)
Other income 535 116 1,693
Other expense (928) (366) (921)
Financial interest on debt (726) (724) (633)
Financial income and expense from cash & cash equivalents 459 510 327
Cost of net debt (267) (214) (306)
Other financial income 311 413 196
Other financial expense (186) (173) (112)
Net income (loss) from equity affiliates 754 267 (108)
Income taxes (3,404) (2,487) (6,077)
Consolidated net income 6,690 4,152 6,748
TotalEnergies share 6,676 4,088 6,626
Non-controlling interests 14 64 122
Earnings per share ($) 2.74 1.65 2.58
Fully-diluted earnings per share ($) 2.73 1.64 2.56
(a) Except for per share amounts.
27 |
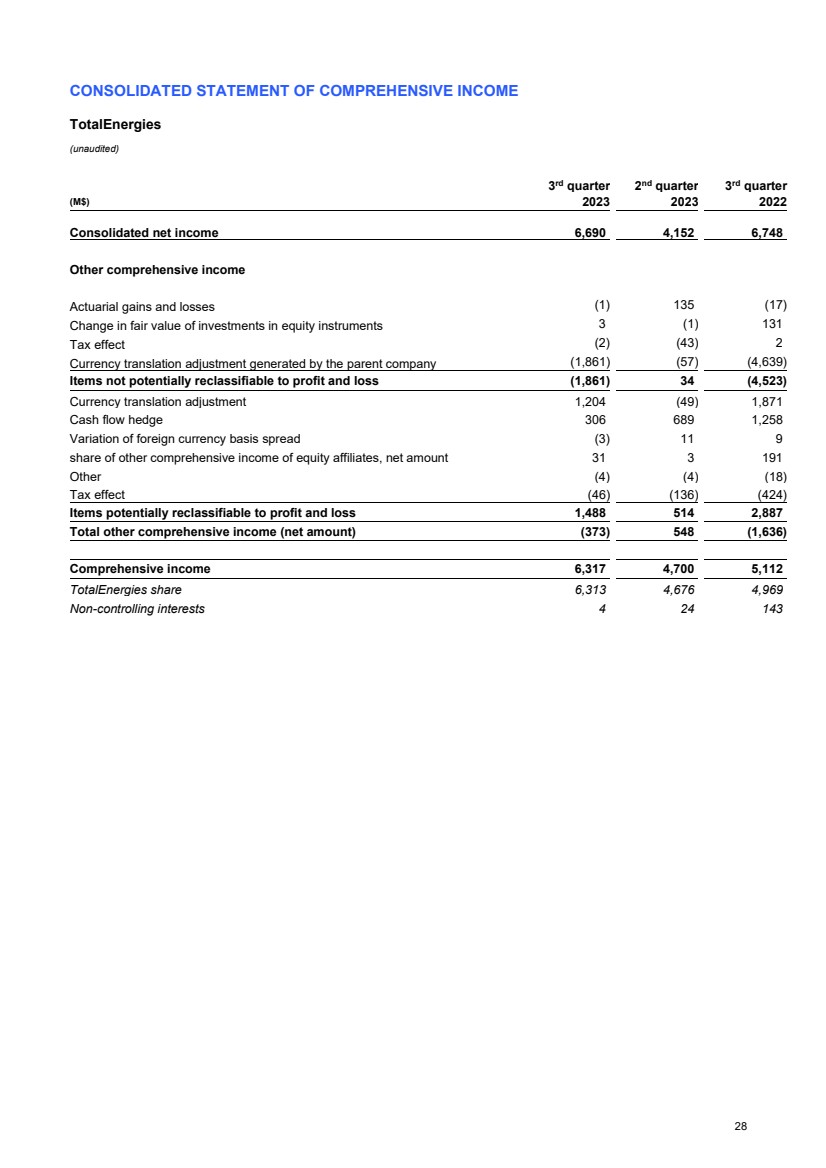
| CONSOLIDATED STATEMENT OF COMPREHENSIVE INCOME
TotalEnergies
(unaudited)
3
rd quarter 2
nd quarter 3
rd quarter
(M$) 2023 2023 2022
Consolidated net income 6,690 4,152 6,748
Other comprehensive income
Actuarial gains and losses (1) 135 (17)
Change in fair value of investments in equity instruments 3 (1) 131
Tax effect (2) (43) 2
Currency translation adjustment generated by the parent company (1,861) (57) (4,639)
Items not potentially reclassifiable to profit and loss (1,861) 34 (4,523)
Currency translation adjustment 1,204 (49) 1,871
Cash flow hedge 306 689 1,258
Variation of foreign currency basis spread (3) 11 9
share of other comprehensive income of equity affiliates, net amount 31 3 191
Other (4) (4) (18)
Tax effect (46) (136) (424)
Items potentially reclassifiable to profit and loss 1,488 514 2,887
Total other comprehensive income (net amount) (373) 548 (1,636)
Comprehensive income 6,317 4,700 5,112
TotalEnergies share 6,313 4,676 4,969
Non-controlling interests 4 24 143
28 |
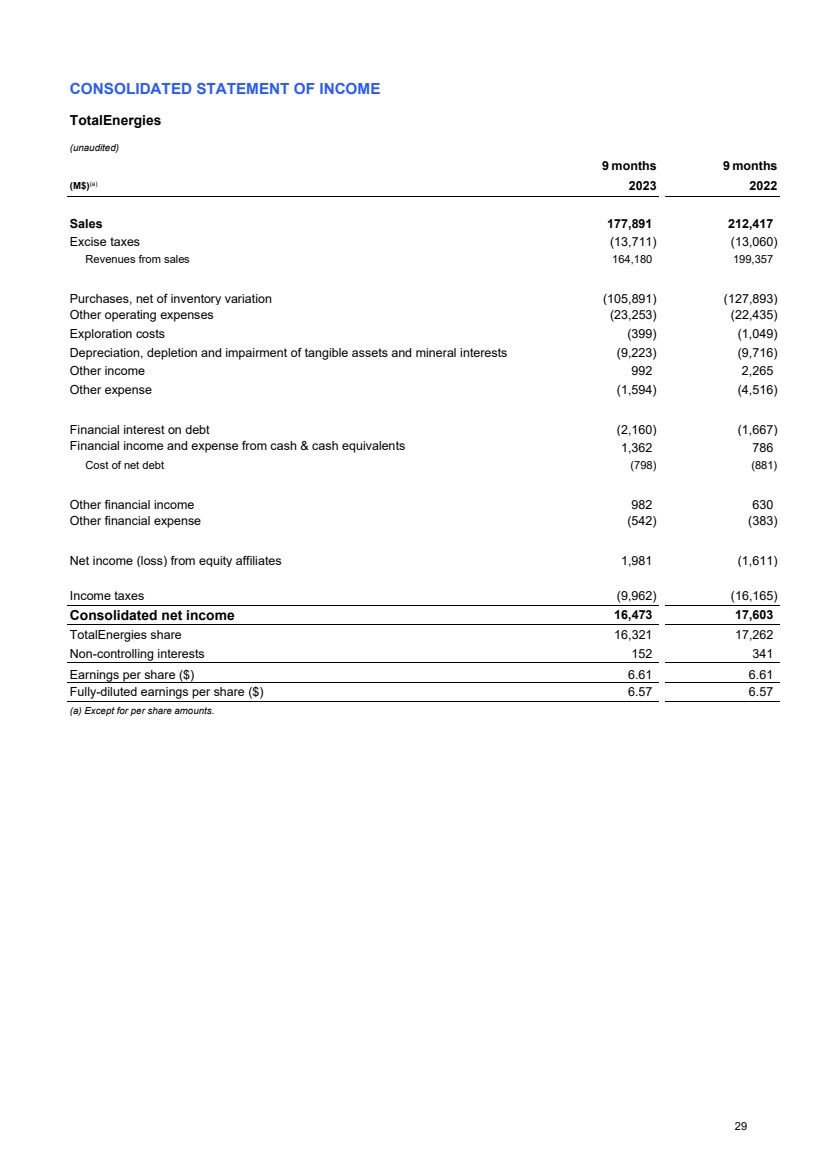
| CONSOLIDATED STATEMENT OF INCOME
TotalEnergies
(unaudited)
9 months 9 months
(M$)(a) 2023 2022
Sales 177,891 212,417
Excise taxes (13,711) (13,060)
Revenues from sales 164,180 199,357
Purchases, net of inventory variation (105,891) (127,893)
Other operating expenses (23,253) (22,435)
Exploration costs (399) (1,049)
Depreciation, depletion and impairment of tangible assets and mineral interests (9,223) (9,716)
Other income 992 2,265
Other expense (1,594) (4,516)
Financial interest on debt (2,160) (1,667)
Financial income and expense from cash & cash equivalents 1,362 786
Cost of net debt (798) (881)
Other financial income 982 630
Other financial expense (542) (383)
Net income (loss) from equity affiliates 1,981 (1,611)
Income taxes (9,962) (16,165)
Consolidated net income 16,473 17,603
TotalEnergies share 16,321 17,262
Non-controlling interests 152 341
Earnings per share ($) 6.61 6.61
Fully-diluted earnings per share ($) 6.57 6.57
(a) Except for per share amounts.
29 |
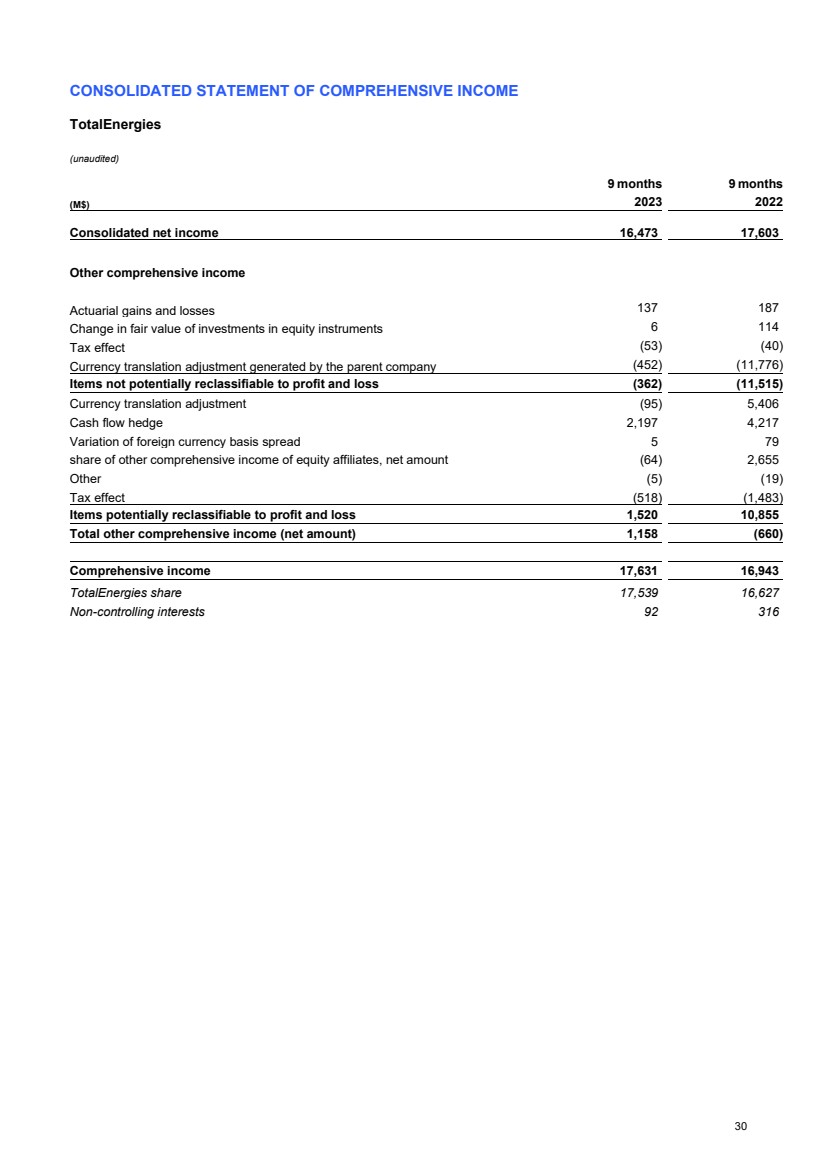
| CONSOLIDATED STATEMENT OF COMPREHENSIVE INCOME
TotalEnergies
(unaudited)
9 months 9 months
(M$) 2023 2022
Consolidated net income 16,473 17,603
Other comprehensive income
Actuarial gains and losses 137 187
Change in fair value of investments in equity instruments 6 114
Tax effect (53) (40)
Currency translation adjustment generated by the parent company (452) (11,776)
Items not potentially reclassifiable to profit and loss (362) (11,515)
Currency translation adjustment (95) 5,406
Cash flow hedge 2,197 4,217
Variation of foreign currency basis spread 5 79
share of other comprehensive income of equity affiliates, net amount (64) 2,655
Other (5) (19)
Tax effect (518) (1,483)
Items potentially reclassifiable to profit and loss 1,520 10,855
Total other comprehensive income (net amount) 1,158 (660)
Comprehensive income 17,631 16,943
TotalEnergies share 17,539 16,627
Non-controlling interests 92 316
30 |

| CONSOLIDATED BALANCE SHEET
TotalEnergies
September 30,
2023
June 30,
2023
December 31,
2022
September
30, 2022
(M$) (unaudited) (unaudited) (unaudited)
ASSETS
Non-current assets
Intangible assets, net 32,911 31,717 31,931 36,376
Property, plant and equipment, net 106,721 104,174 107,101 99,700
Equity affiliates : investments and loans 30,153 30,425 27,889 28,743
Other investments 1,342 1,190 1,051 1,149
Non-current financial assets 2,710 2,494 2,731 2,341
Deferred income taxes 3,535 3,649 5,049 4,434
Other non-current assets 3,991 2,573 2,388 2,930
Total non-current assets 181,363 176,222 178,140 175,673
Current assets
Inventories, net 22,512 18,785 22,936 24,420
Accounts receivable, net 23,598 22,163 24,378 28,191
Other current assets 22,252 23,111 36,070 73,453
Current financial assets 6,892 6,725 8,746 11,688
Cash and cash equivalents 24,731 25,572 33,026 35,941
Assets classified as held for sale 8,656 8,441 568 349
Total current assets 108,641 104,797 125,724 174,042
Total assets 290,004 281,019 303,864 349,715
LIABILITIES & SHAREHOLDERS' EQUITY
Shareholders' equity
Common shares 7,616 7,850 8,163 8,163
Paid-in surplus and retained earnings 123,506 123,511 123,951 131,382
Currency translation adjustment (13,461) (12,859) (12,836) (16,720)
Treasury shares (1,894) (4,820) (7,554) (5,004)
Total shareholders' equity - TotalEnergies share 115,767 113,682 111,724 117,821
Non-controlling interests 2,657 2,770 2,846 2,851
Total shareholders' equity 118,424 116,452 114,570 120,672
Non-current liabilities
Deferred income taxes 11,633 11,237 11,021 12,576
Employee benefits 1,837 1,872 1,829 2,207
Provisions and other non-current liabilities 22,657 21,295 21,402 22,133
Non-current financial debt 41,022 40,427 45,264 44,899
Total non-current liabilities 77,149 74,831 79,516 81,815
Current liabilities
Accounts payable 37,268 32,853 41,346 48,942
Other creditors and accrued liabilities 37,405 38,609 52,275 80,468
Current borrowings 16,876 15,542 15,502 16,923
Other current financial liabilities 415 443 488 861
Liabilities directly associated with the assets classified as held for sale 2,467 2,289 167 34
Total current liabilities 94,431 89,736 109,778 147,228
Total liabilities & shareholders' equity 290,004 281,019 303,864 349,715
31 |
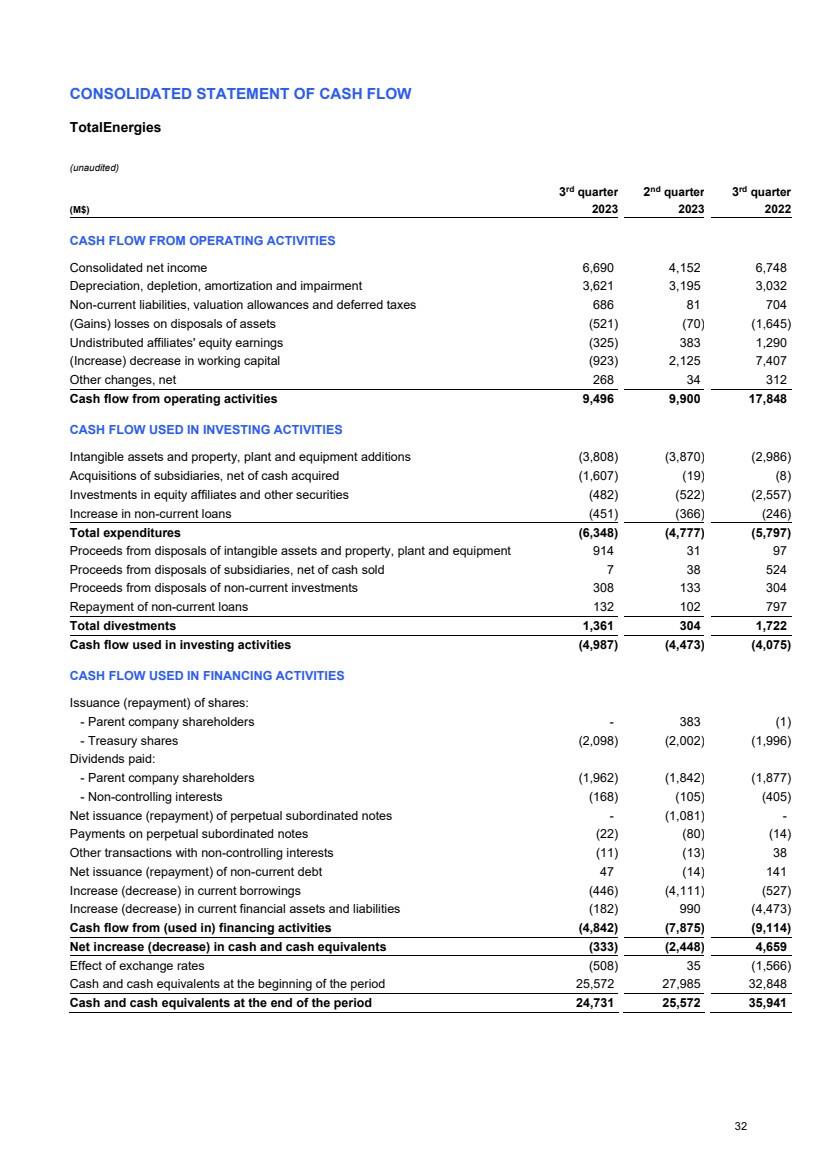
| CONSOLIDATED STATEMENT OF CASH FLOW
TotalEnergies
(unaudited)
3
rd quarter 2
nd quarter 3
rd quarter
(M$) 2023 2023 2022
CASH FLOW FROM OPERATING ACTIVITIES
Consolidated net income 6,690 4,152 6,748
Depreciation, depletion, amortization and impairment 3,621 3,195 3,032
Non-current liabilities, valuation allowances and deferred taxes 686 81 704
(Gains) losses on disposals of assets (521) (70) (1,645)
Undistributed affiliates' equity earnings (325) 383 1,290
(Increase) decrease in working capital (923) 2,125 7,407
Other changes, net 268 34 312
Cash flow from operating activities 9,496 9,900 17,848
CASH FLOW USED IN INVESTING ACTIVITIES
Intangible assets and property, plant and equipment additions (3,808) (3,870) (2,986)
Acquisitions of subsidiaries, net of cash acquired (1,607) (19) (8)
Investments in equity affiliates and other securities (482) (522) (2,557)
Increase in non-current loans (451) (366) (246)
Total expenditures (6,348) (4,777) (5,797)
Proceeds from disposals of intangible assets and property, plant and equipment 914 31 97
Proceeds from disposals of subsidiaries, net of cash sold 7 38 524
Proceeds from disposals of non-current investments 308 133 304
Repayment of non-current loans 132 102 797
Total divestments 1,361 304 1,722
Cash flow used in investing activities (4,987) (4,473) (4,075)
CASH FLOW USED IN FINANCING ACTIVITIES
Issuance (repayment) of shares:
- Parent company shareholders - 383 (1)
- Treasury shares (2,098) (2,002) (1,996)
Dividends paid:
- Parent company shareholders (1,962) (1,842) (1,877)
- Non-controlling interests (168) (105) (405)
Net issuance (repayment) of perpetual subordinated notes - (1,081) -
Payments on perpetual subordinated notes (22) (80) (14)
Other transactions with non-controlling interests (11) (13) 38
Net issuance (repayment) of non-current debt 47 (14) 141
Increase (decrease) in current borrowings (446) (4,111) (527)
Increase (decrease) in current financial assets and liabilities (182) 990 (4,473)
Cash flow from (used in) financing activities (4,842) (7,875) (9,114)
Net increase (decrease) in cash and cash equivalents (333) (2,448) 4,659
Effect of exchange rates (508) 35 (1,566)
Cash and cash equivalents at the beginning of the period 25,572 27,985 32,848
Cash and cash equivalents at the end of the period 24,731 25,572 35,941
32 |

| CONSOLIDATED STATEMENT OF CASH FLOW
TotalEnergies
(unaudited)
9 months 9 months
(M$) 2023 2022
CASH FLOW FROM OPERATING ACTIVITIES
Consolidated net income 16,473 17,603
Depreciation, depletion, amortization and impairment 10,003 10,931
Non-current liabilities, valuation allowances and deferred taxes 1,081 4,669
(Gains) losses on disposals of assets (843) (1,823)
Undistributed affiliates' equity earnings (291) 4,551
(Increase) decrease in working capital (2,217) 4,982
Other changes, net 323 836
Cash flow from operating activities 24,529 41,749
CASH FLOW USED IN INVESTING ACTIVITIES
Intangible assets and property, plant and equipment additions (12,646) (11,593)
Acquisitions of subsidiaries, net of cash acquired (1,762) (90)
Investments in equity affiliates and other securities (2,411) (2,782)
Increase in non-current loans (1,206) (765)
Total expenditures (18,025) (15,230)
Proceeds from disposals of intangible assets and property, plant and equipment 1,013 427
Proceeds from disposals of subsidiaries, net of cash sold 228 675
Proceeds from disposals of non-current investments 490 554
Repayment of non-current loans 472 2,139
Total divestments 2,203 3,795
Cash flow used in investing activities (15,822) (11,435)
CASH FLOW USED IN FINANCING ACTIVITIES
Issuance (repayment) of shares:
- Parent company shareholders 383 370
- Treasury shares (6,203) (5,160)
Dividends paid:
- Parent company shareholders (5,648) (5,630)
- Non-controlling interests (294) (524)
Net issuance (repayment) of perpetual subordinated notes (1,081) -
Payments on perpetual subordinated notes (260) (288)
Other transactions with non-controlling interests (110) 33
Net issuance (repayment) of non-current debt 151 683
Increase (decrease) in current borrowings (5,831) (2,573)
Increase (decrease) in current financial assets and liabilities 2,202 390
Cash flow from (used in) financing activities (16,691) (12,699)
Net increase (decrease) in cash and cash equivalents (7,984) 17,615
Effect of exchange rates (311) (3,016)
Cash and cash equivalents at the beginning of the period 33,026 21,342
Cash and cash equivalents at the end of the period 24,731 35,941
33 |
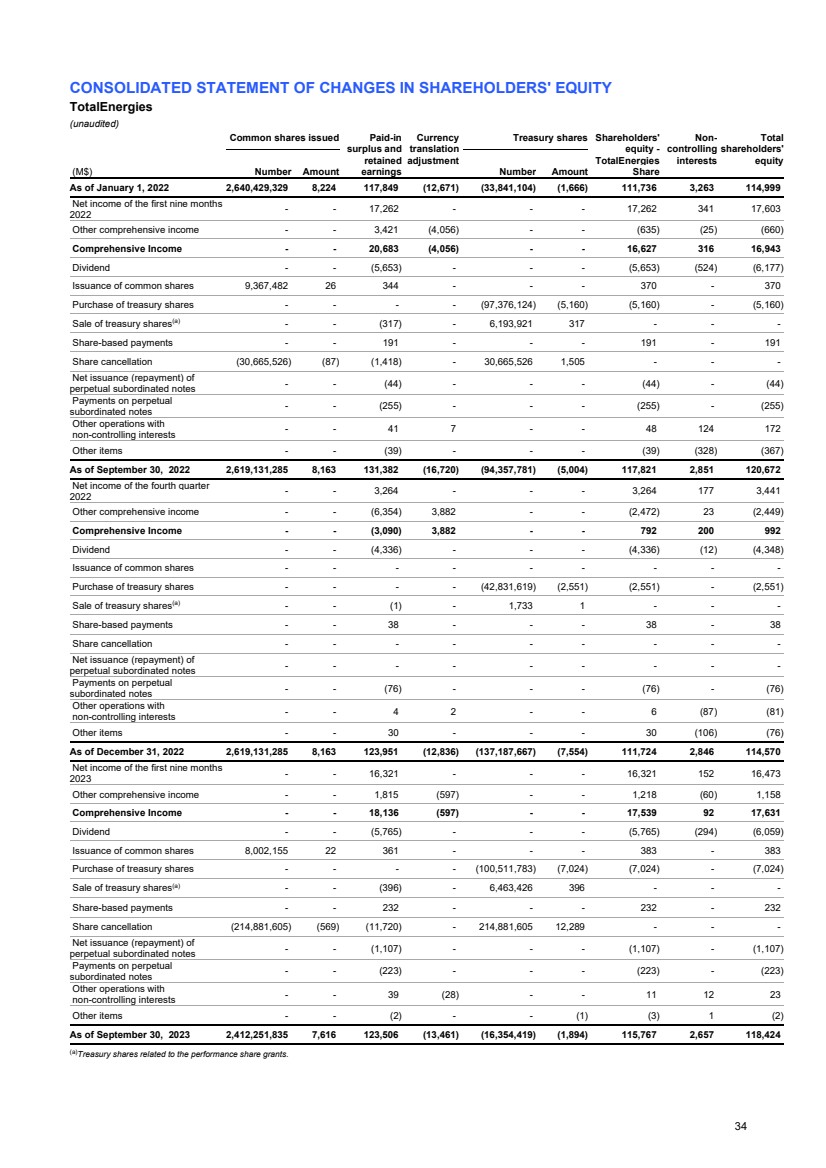
| CONSOLIDATED STATEMENT OF CHANGES IN SHAREHOLDERS' EQUITY
TotalEnergies
(unaudited)
Common shares issued Paid-in
surplus and
retained
earnings
Currency
translation
adjustment
Treasury shares Shareholders'
equity -
TotalEnergies
Share
Non-controlling
interests
Total
shareholders'
equity
(M$) Number Amount Number Amount
As of January 1, 2022 2,640,429,329 8,224 117,849 (12,671) (33,841,104) (1,666) 111,736 3,263 114,999
Net income of the first nine months
2022 - - 17,262 - - - 17,262 341 17,603
Other comprehensive income - - 3,421 (4,056) - - (635) (25) (660)
Comprehensive Income - - 20,683 (4,056) - - 16,627 316 16,943
Dividend - - (5,653) - - - (5,653) (524) (6,177)
Issuance of common shares 9,367,482 26 344 - - - 370 - 370
Purchase of treasury shares - - - - (97,376,124) (5,160) (5,160) - (5,160)
Sale of treasury shares(a)
- - (317) - 6,193,921 317 - - -
Share-based payments - - 191 - - - 191 - 191
Share cancellation (30,665,526) (87) (1,418) - 30,665,526 1,505 - - -
Net issuance (repayment) of
perpetual subordinated notes - - (44) - - - (44) - (44)
Payments on perpetual
subordinated notes - - (255) - - - (255) - (255)
Other operations with
non-controlling interests - - 41 7 - - 48 124 172
Other items - - (39) - - - (39) (328) (367)
As of September 30, 2022 2,619,131,285 8,163 131,382 (16,720) (94,357,781) (5,004) 117,821 2,851 120,672
Net income of the fourth quarter
2022 - - 3,264 - - - 3,264 177 3,441
Other comprehensive income - - (6,354) 3,882 - - (2,472) 23 (2,449)
Comprehensive Income - - (3,090) 3,882 - - 792 200 992
Dividend - - (4,336) - - - (4,336) (12) (4,348)
Issuance of common shares - - - - - - - - -
Purchase of treasury shares - - - - (42,831,619) (2,551) (2,551) - (2,551)
Sale of treasury shares(a)
- - (1) - 1,733 1 - - -
Share-based payments - - 38 - - - 38 - 38
Share cancellation - - - - - - - - -
Net issuance (repayment) of
perpetual subordinated notes - - - - - - - - -
Payments on perpetual
subordinated notes - - (76) - - - (76) - (76)
Other operations with
non-controlling interests - - 4 2 - - 6 (87) (81)
Other items - - 30 - - - 30 (106) (76)
As of December 31, 2022 2,619,131,285 8,163 123,951 (12,836) (137,187,667) (7,554) 111,724 2,846 114,570
Net income of the first nine months
2023 - - 16,321 - - - 16,321 152 16,473
Other comprehensive income - - 1,815 (597) - - 1,218 (60) 1,158
Comprehensive Income - - 18,136 (597) - - 17,539 92 17,631
Dividend - - (5,765) - - - (5,765) (294) (6,059)
Issuance of common shares 8,002,155 22 361 - - - 383 - 383
Purchase of treasury shares - - - - (100,511,783) (7,024) (7,024) - (7,024)
Sale of treasury shares(a)
- - (396) - 6,463,426 396 - - -
Share-based payments - - 232 - - - 232 - 232
Share cancellation (214,881,605) (569) (11,720) - 214,881,605 12,289 - - -
Net issuance (repayment) of
perpetual subordinated notes - - (1,107) - - - (1,107) - (1,107)
Payments on perpetual
subordinated notes - - (223) - - - (223) - (223)
Other operations with
non-controlling interests - - 39 (28) - - 11 12 23
Other items - - (2) - - (1) (3) 1 (2)
As of September 30, 2023 2,412,251,835 7,616 123,506 (13,461) (16,354,419) (1,894) 115,767 2,657 118,424
(a)Treasury shares related to the performance share grants.
34 |
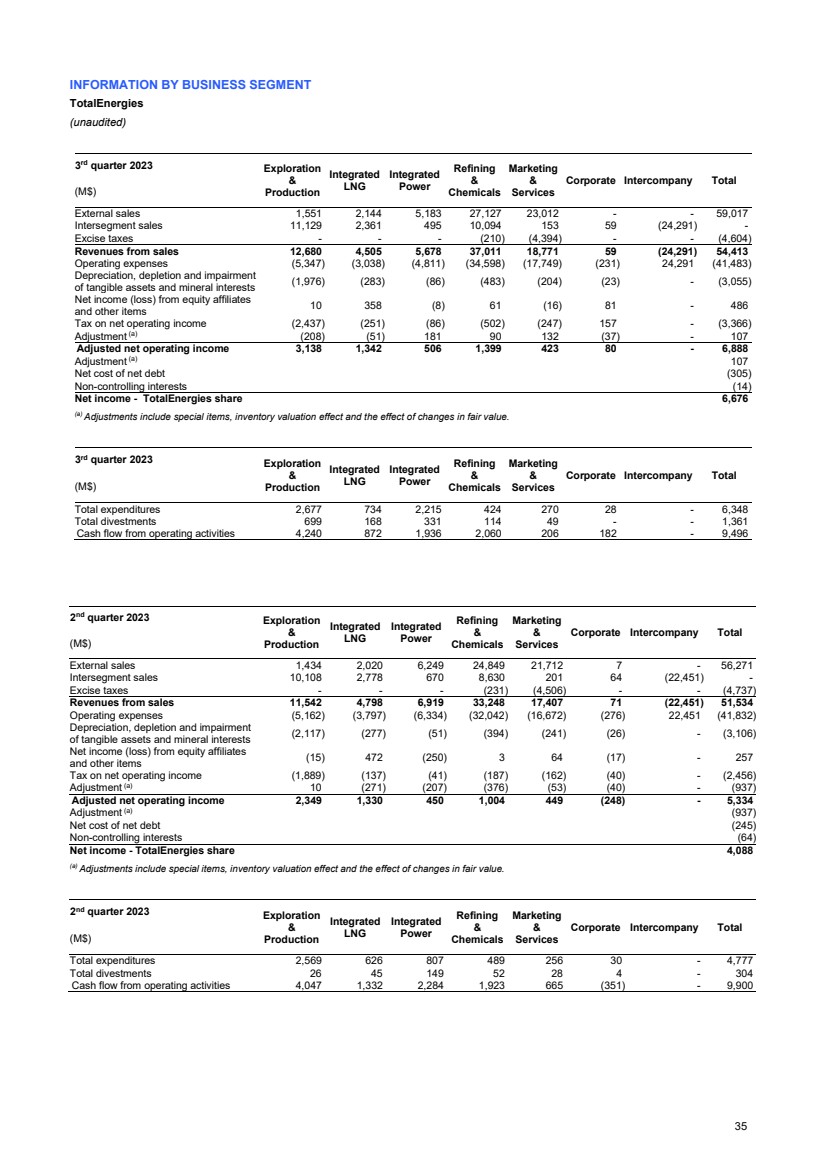
| INFORMATION BY BUSINESS SEGMENT
TotalEnergies
(unaudited)
3
rd quarter 2023 Exploration
&
Production
Integrated
LNG
Integrated
Power
Refining
&
Chemicals
Marketing
&
Services
Corporate Intercompany Total
(M$)
External sales 1,551 2,144 5,183 27,127 23,012 - - 59,017
Intersegment sales 11,129 2,361 495 10,094 153 59 (24,291) -
Excise taxes - - - (210) (4,394) - - (4,604)
Revenues from sales 12,680 4,505 5,678 37,011 18,771 59 (24,291) 54,413
Operating expenses (5,347) (3,038) (4,811) (34,598) (17,749) (231) 24,291 (41,483)
Depreciation, depletion and impairment
of tangible assets and mineral interests (1,976) (283) (86) (483) (204) (23) - (3,055)
Net income (loss) from equity affiliates
and other items 10 358 (8) 61 (16) 81 - 486
Tax on net operating income (2,437) (251) (86) (502) (247) 157 - (3,366)
Adjustment (a) (208) (51) 181 90 132 (37) - 107
Adjusted net operating income 3,138 1,342 506 1,399 423 80 - 6,888
Adjustment (a) 107
Net cost of net debt (305)
Non-controlling interests (14)
Net income - TotalEnergies share 6,676
(a) Adjustments include special items, inventory valuation effect and the effect of changes in fair value.
3
rd quarter 2023 Exploration
&
Production
Integrated
LNG
Integrated
Power
Refining
&
Chemicals
Marketing
&
Services
Corporate Intercompany Total
(M$)
Total expenditures 2,677 734 2,215 424 270 28 - 6,348
Total divestments 699 168 331 114 49 - - 1,361
Cash flow from operating activities 4,240 872 1,936 2,060 206 182 - 9,496
2
nd quarter 2023 Exploration
&
Production
Integrated
LNG
Integrated
Power
Refining
&
Chemicals
Marketing
&
Services
Corporate Intercompany Total
(M$)
External sales 1,434 2,020 6,249 24,849 21,712 7 - 56,271
Intersegment sales 10,108 2,778 670 8,630 201 64 (22,451) -
Excise taxes - - - (231) (4,506) - - (4,737)
Revenues from sales 11,542 4,798 6,919 33,248 17,407 71 (22,451) 51,534
Operating expenses (5,162) (3,797) (6,334) (32,042) (16,672) (276) 22,451 (41,832)
Depreciation, depletion and impairment
of tangible assets and mineral interests (2,117) (277) (51) (394) (241) (26) - (3,106)
Net income (loss) from equity affiliates
and other items (15) 472 (250) 3 64 (17) - 257
Tax on net operating income (1,889) (137) (41) (187) (162) (40) - (2,456)
Adjustment (a) 10 (271) (207) (376) (53) (40) - (937)
Adjusted net operating income 2,349 1,330 450 1,004 449 (248) - 5,334
Adjustment (a) (937)
Net cost of net debt (245)
Non-controlling interests (64)
Net income - TotalEnergies share 4,088
(a) Adjustments include special items, inventory valuation effect and the effect of changes in fair value.
2
nd quarter 2023 Exploration
&
Production
Integrated
LNG
Integrated
Power
Refining
&
Chemicals
Marketing
&
Services
Corporate Intercompany Total
(M$)
Total expenditures 2,569 626 807 489 256 30 - 4,777
Total divestments 26 45 149 52 28 4 - 304
Cash flow from operating activities 4,047 1,332 2,284 1,923 665 (351) - 9,900
35 |
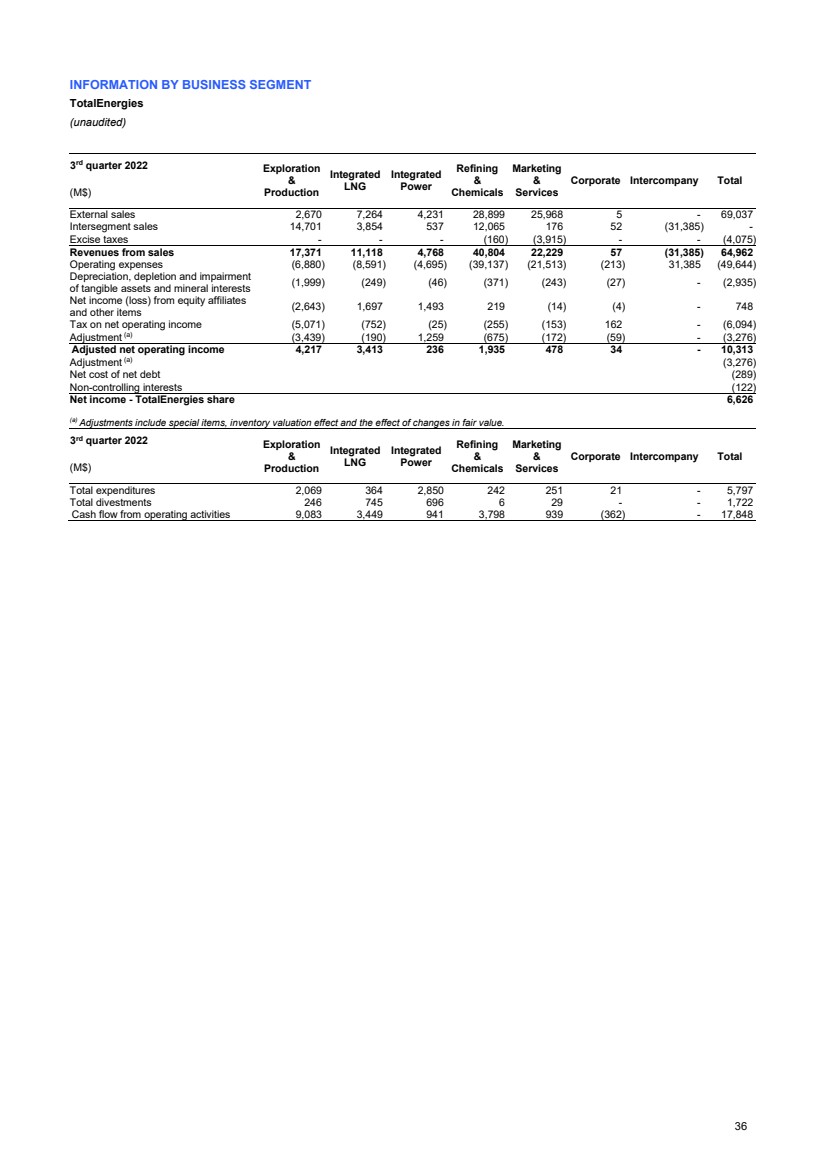
| INFORMATION BY BUSINESS SEGMENT
TotalEnergies
(unaudited)
3
rd quarter 2022 Exploration
&
Production
Integrated
LNG
Integrated
Power
Refining
&
Chemicals
Marketing
&
Services
Corporate Intercompany Total
(M$)
External sales 2,670 7,264 4,231 28,899 25,968 5 - 69,037
Intersegment sales 14,701 3,854 537 12,065 176 52 (31,385) -
Excise taxes - - - (160) (3,915) - - (4,075)
Revenues from sales 17,371 11,118 4,768 40,804 22,229 57 (31,385) 64,962
Operating expenses (6,880) (8,591) (4,695) (39,137) (21,513) (213) 31,385 (49,644)
Depreciation, depletion and impairment
of tangible assets and mineral interests (1,999) (249) (46) (371) (243) (27) - (2,935)
Net income (loss) from equity affiliates
and other items (2,643) 1,697 1,493 219 (14) (4) - 748
Tax on net operating income (5,071) (752) (25) (255) (153) 162 - (6,094)
Adjustment (a) (3,439) (190) 1,259 (675) (172) (59) - (3,276)
Adjusted net operating income 4,217 3,413 236 1,935 478 34 - 10,313
Adjustment (a) (3,276)
Net cost of net debt (289)
Non-controlling interests (122)
Net income - TotalEnergies share 6,626
(a) Adjustments include special items, inventory valuation effect and the effect of changes in fair value.
3
rd quarter 2022 Exploration
&
Production
Integrated
LNG
Integrated
Power
Refining
&
Chemicals
Marketing
&
Services
Corporate Intercompany Total
(M$)
Total expenditures 2,069 364 2,850 242 251 21 - 5,797
Total divestments 246 745 696 6 29 - - 1,722
Cash flow from operating activities 9,083 3,449 941 3,798 939 (362) - 17,848
36 |
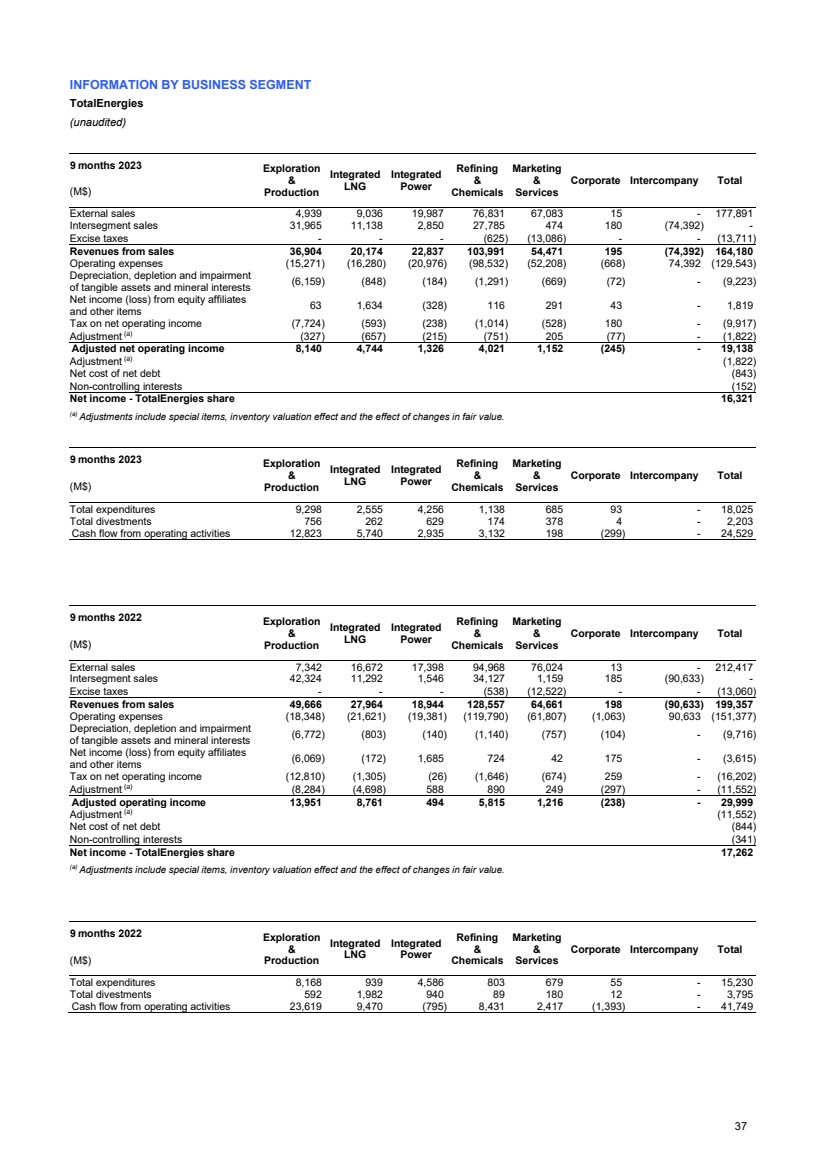
| INFORMATION BY BUSINESS SEGMENT
TotalEnergies
(unaudited)
9 months 2023 Exploration
&
Production
Integrated
LNG
Integrated
Power
Refining
&
Chemicals
Marketing
&
Services
Corporate Intercompany Total
(M$)
External sales 4,939 9,036 19,987 76,831 67,083 15 - 177,891
Intersegment sales 31,965 11,138 2,850 27,785 474 180 (74,392) -
Excise taxes - - - (625) (13,086) - - (13,711)
Revenues from sales 36,904 20,174 22,837 103,991 54,471 195 (74,392) 164,180
Operating expenses (15,271) (16,280) (20,976) (98,532) (52,208) (668) 74,392 (129,543)
Depreciation, depletion and impairment
of tangible assets and mineral interests (6,159) (848) (184) (1,291) (669) (72) - (9,223)
Net income (loss) from equity affiliates
and other items 63 1,634 (328) 116 291 43 - 1,819
Tax on net operating income (7,724) (593) (238) (1,014) (528) 180 - (9,917)
Adjustment (a) (327) (657) (215) (751) 205 (77) - (1,822)
Adjusted net operating income 8,140 4,744 1,326 4,021 1,152 (245) - 19,138
Adjustment (a) (1,822)
Net cost of net debt (843)
Non-controlling interests (152)
Net income - TotalEnergies share 16,321
(a) Adjustments include special items, inventory valuation effect and the effect of changes in fair value.
9 months 2023 Exploration
&
Production
Integrated
LNG
Integrated
Power
Refining
&
Chemicals
Marketing
&
Services
Corporate Intercompany Total
(M$)
Total expenditures 9,298 2,555 4,256 1,138 685 93 - 18,025
Total divestments 756 262 629 174 378 4 - 2,203
Cash flow from operating activities 12,823 5,740 2,935 3,132 198 (299) - 24,529
9 months 2022 Exploration
&
Production
Integrated
LNG
Integrated
Power
Refining
&
Chemicals
Marketing
&
Services
Corporate Intercompany Total
(M$)
External sales 7,342 16,672 17,398 94,968 76,024 13 - 212,417
Intersegment sales 42,324 11,292 1,546 34,127 1,159 185 (90,633) -
Excise taxes - - - (538) (12,522) - - (13,060)
Revenues from sales 49,666 27,964 18,944 128,557 64,661 198 (90,633) 199,357
Operating expenses (18,348) (21,621) (19,381) (119,790) (61,807) (1,063) 90,633 (151,377)
Depreciation, depletion and impairment
of tangible assets and mineral interests (6,772) (803) (140) (1,140) (757) (104) - (9,716)
Net income (loss) from equity affiliates
and other items (6,069) (172) 1,685 724 42 175 - (3,615)
Tax on net operating income (12,810) (1,305) (26) (1,646) (674) 259 - (16,202)
Adjustment (a) (8,284) (4,698) 588 890 249 (297) - (11,552)
Adjusted operating income 13,951 8,761 494 5,815 1,216 (238) - 29,999
Adjustment (a) (11,552)
Net cost of net debt (844)
Non-controlling interests (341)
Net income - TotalEnergies share 17,262
(a) Adjustments include special items, inventory valuation effect and the effect of changes in fair value.
9 months 2022 Exploration
&
Production
Integrated
LNG
Integrated
Power
Refining
&
Chemicals
Marketing
&
Services
Corporate Intercompany Total
(M$)
Total expenditures 8,168 939 4,586 803 679 55 - 15,230
Total divestments 592 1,982 940 89 180 12 - 3,795
Cash flow from operating activities 23,619 9,470 (795) 8,431 2,417 (1,393) - 41,749
37 |
| Non GAAP Financial Measures
38 |

| Alternative Performance Measures (Non-GAAP)
TotalEnergies
(unaudited)
1. Reconciliation of cash flow used in investing activities to Net investments
1.1. Exploration & Production
3
rd
quarter
2
nd
quarter
3
rd
quarter
3
rd quarter 2023
vs
9 months 9 months 9 months 2023
vs
2023 2023 2022 3
rd quarter 2022 (in millions of dollars) 2023 2022 9 months 2022
1,978 2,543 1,823 9% Cash flow used in investing activities (a) 8,542 7,576 13%
- - - ns Other transactions with non-controlling interests (b) - - ns
- - (1) -100% Organic loan repayment from equity affiliates (c) - 22 -100%
- - - ns Change in debt from renewable projects financing (d) * - - ns
51 56 34 50% Capex linked to capitalized leasing contracts (e) 157 94 67%
14 1 7 100% Expenditures related to carbon credits (f) 16 11 45%
2,043 2,600 1,863 10% Net investments (a + b + c + d + e + f = g - i + h) 8,715 7,703 13%
(514) 176 (126) ns of which net acquisitions (g - i) 1,600 2,415 -34%
156 179 96 63% Acquisitions (g) 2,281 2,893 -21%
670 3 222 x3 Asset sales (i) 681 478 42%
- - - ns
Change in debt from renewable projects (partner
share) - - ns
2,557 2,424 1,989 29% of which organic investments (h) 7,115 5,288 35%
343 325 169 x2 Capitalized exploration 872 381 x2.3
32 17 12 x2.7
Increase in non-current loans 93 58 60%
(29) (23) (25) ns
Repayment of non-current loans, excluding organic
loan repayment from equity affiliates (75) (92) ns
- - - ns
Change in debt from renewable projects
(TotalEnergies share) - - ns
*Change in debt from renewable projects (TotalEnergies share and partner share).
1.2. Integrated LNG
3
rd
quarter
2
nd
quarter
3
rd
quarter
3
rd quarter 2023
vs
9 months 9 months 9 months 2023
vs
2023 2023 2022 3
rd quarter 2022 (in millions of dollars) 2023 2022 9 months 2022
566 581 (381) ns Cash flow used in investing activities (a) 2,293 (1,043) ns
- - - ns Other transactions with non-controlling interests (b) - - ns
1 - 578 -100% Organic loan repayment from equity affiliates (c) 2 1,282 -100%
- - - ns Change in debt from renewable projects financing (d) * - - ns
12 6 6 100% Capex linked to capitalized leasing contracts (e) 26 19 37%
- - - ns Expenditures related to carbon credits (f) - - ns
579 587 203 x2.9 Net investments (a + b + c + d + e + f = g - i + h) 2,321 258 x9
84 205 (10) ns of which net acquisitions (g - i) 1,048 (66) ns
204 224 - ns Acquisitions (g) 1,197 4 x299.3
120 19 10 x12 Asset sales (i) 149 70 x2.1
- - - ns
Change in debt from renewable projects
(partner share) - - ns
495 382 213 x2.3 of which organic investments (h) 1,273 324 x3.9
3 3 - ns Capitalized exploration 7 - ns
153 95 133 15% Increase in non-current loans 391 264 48%
(47) (26) (156) ns
Repayment of non-current loans, excluding
organic loan repayment from equity affiliates (111) (592) ns
- - - ns
Change in debt from renewable projects
(TotalEnergies share) - - ns
*Change in debt from renewable projects (TotalEnergies share and partner share).
39 |
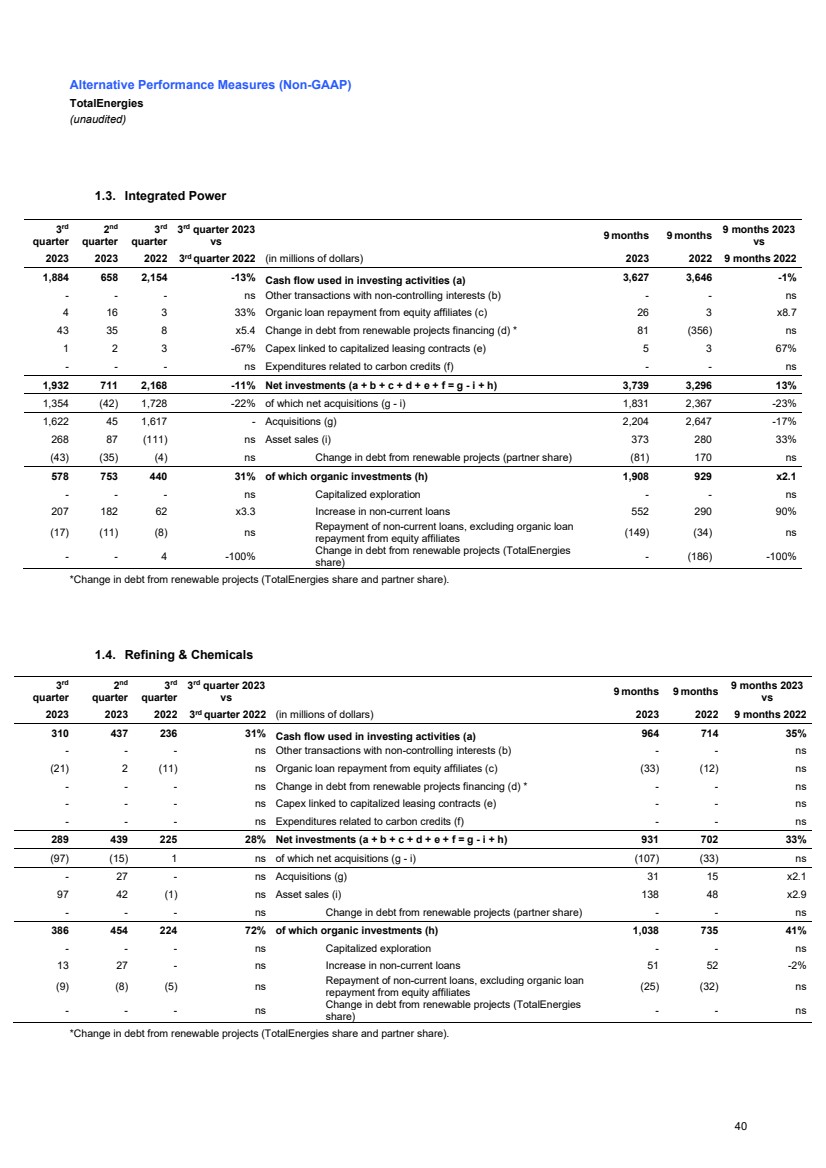
| Alternative Performance Measures (Non-GAAP)
TotalEnergies
(unaudited)
1.3. Integrated Power
3
rd
quarter
2
nd
quarter
3
rd
quarter
3
rd quarter 2023
vs
9 months 9 months 9 months 2023
vs
2023 2023 2022 3
rd quarter 2022 (in millions of dollars) 2023 2022 9 months 2022
1,884 658 2,154 -13% Cash flow used in investing activities (a) 3,627 3,646 -1%
- - - ns Other transactions with non-controlling interests (b) - - ns
4 16 3 33% Organic loan repayment from equity affiliates (c) 26 3 x8.7
43 35 8 x5.4 Change in debt from renewable projects financing (d) * 81 (356) ns
1 2 3 -67% Capex linked to capitalized leasing contracts (e) 5 3 67%
- - - ns Expenditures related to carbon credits (f) - - ns
1,932 711 2,168 -11% Net investments (a + b + c + d + e + f = g - i + h) 3,739 3,296 13%
1,354 (42) 1,728 -22% of which net acquisitions (g - i) 1,831 2,367 -23%
1,622 45 1,617 - Acquisitions (g) 2,204 2,647 -17%
268 87 (111) ns Asset sales (i) 373 280 33%
(43) (35) (4) ns Change in debt from renewable projects (partner share) (81) 170 ns
578 753 440 31% of which organic investments (h) 1,908 929 x2.1
- - - ns Capitalized exploration - - ns
207 182 62 x3.3 Increase in non-current loans 552 290 90%
(17) (11) (8) ns
Repayment of non-current loans, excluding organic loan
repayment from equity affiliates (149) (34) ns
- - 4 -100% Change in debt from renewable projects (TotalEnergies
share) - (186) -100%
*Change in debt from renewable projects (TotalEnergies share and partner share).
1.4. Refining & Chemicals
3
rd
quarter
2
nd
quarter
3
rd
quarter
3
rd quarter 2023
vs
9 months 9 months 9 months 2023
vs
2023 2023 2022 3
rd quarter 2022 (in millions of dollars) 2023 2022 9 months 2022
310 437 236 31% Cash flow used in investing activities (a) 964 714 35%
- - - ns Other transactions with non-controlling interests (b) - - ns
(21) 2 (11) ns Organic loan repayment from equity affiliates (c) (33) (12) ns
- - - ns Change in debt from renewable projects financing (d) * - - ns
- - - ns Capex linked to capitalized leasing contracts (e) - - ns
- - - ns Expenditures related to carbon credits (f) - - ns
289 439 225 28% Net investments (a + b + c + d + e + f = g - i + h) 931 702 33%
(97) (15) 1 ns of which net acquisitions (g - i) (107) (33) ns
- 27 - ns Acquisitions (g) 31 15 x2.1
97 42 (1) ns Asset sales (i) 138 48 x2.9
- - - ns Change in debt from renewable projects (partner share) - - ns
386 454 224 72% of which organic investments (h) 1,038 735 41%
- - - ns Capitalized exploration - - ns
13 27 - ns Increase in non-current loans 51 52 -2%
(9) (8) (5) ns
Repayment of non-current loans, excluding organic loan
repayment from equity affiliates (25) (32) ns
- - - ns
Change in debt from renewable projects (TotalEnergies
share) - - ns
*Change in debt from renewable projects (TotalEnergies share and partner share).
40 |
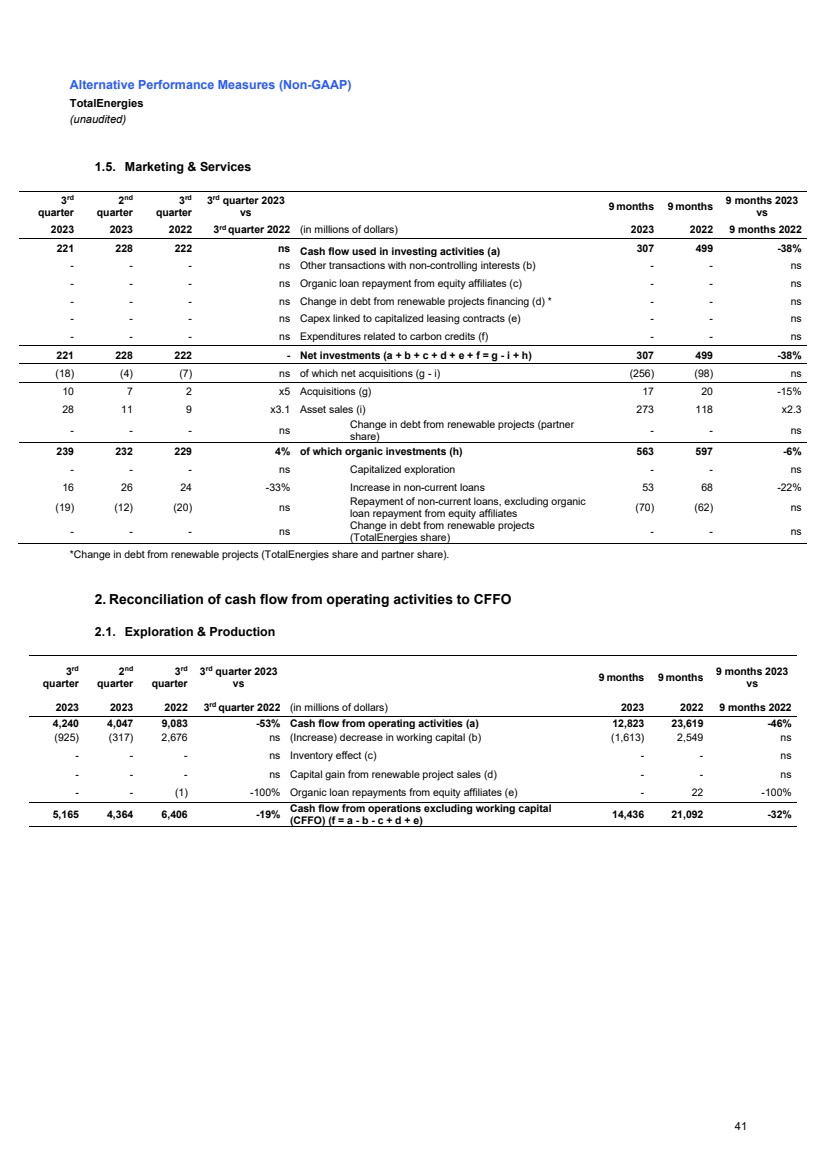
| Alternative Performance Measures (Non-GAAP)
TotalEnergies
(unaudited)
1.5. Marketing & Services
3
rd
quarter
2
nd
quarter
3
rd
quarter
3
rd quarter 2023
vs
9 months 9 months 9 months 2023
vs
2023 2023 2022 3
rd quarter 2022 (in millions of dollars) 2023 2022 9 months 2022
221 228 222 ns Cash flow used in investing activities (a) 307 499 -38%
- - - ns Other transactions with non-controlling interests (b) - - ns
- - - ns Organic loan repayment from equity affiliates (c) - - ns
- - - ns Change in debt from renewable projects financing (d) * - - ns
- - - ns Capex linked to capitalized leasing contracts (e) - - ns
- - - ns Expenditures related to carbon credits (f) - - ns
221 228 222 - Net investments (a + b + c + d + e + f = g - i + h) 307 499 -38%
(18) (4) (7) ns of which net acquisitions (g - i) (256) (98) ns
10 7 2 x5 Acquisitions (g) 17 20 -15%
28 11 9 x3.1 Asset sales (i) 273 118 x2.3
- - - ns
Change in debt from renewable projects (partner
share) - - ns
239 232 229 4% of which organic investments (h) 563 597 -6%
- - - ns Capitalized exploration - - ns
16 26 24 -33% Increase in non-current loans 53 68 -22%
(19) (12) (20) ns
Repayment of non-current loans, excluding organic
loan repayment from equity affiliates (70) (62) ns
- - - ns
Change in debt from renewable projects
(TotalEnergies share) - - ns
*Change in debt from renewable projects (TotalEnergies share and partner share).
2. Reconciliation of cash flow from operating activities to CFFO
2.1. Exploration & Production
3
rd
quarter
2
nd
quarter
3
rd
quarter
3
rd quarter 2023
vs
9 months 9 months 9 months 2023
vs
2023 2023 2022 3
rd quarter 2022 (in millions of dollars) 2023 2022 9 months 2022
4,240 4,047 9,083 -53% Cash flow from operating activities (a) 12,823 23,619 -46%
(925) (317) 2,676 ns (Increase) decrease in working capital (b) (1,613) 2,549 ns
- - - ns Inventory effect (c) - - ns
- - - ns Capital gain from renewable project sales (d) - - ns
- - (1) -100% Organic loan repayments from equity affiliates (e) - 22 -100%
5,165 4,364 6,406 -19% Cash flow from operations excluding working capital
(CFFO) (f = a - b - c + d + e) 14,436 21,092 -32%
41 |
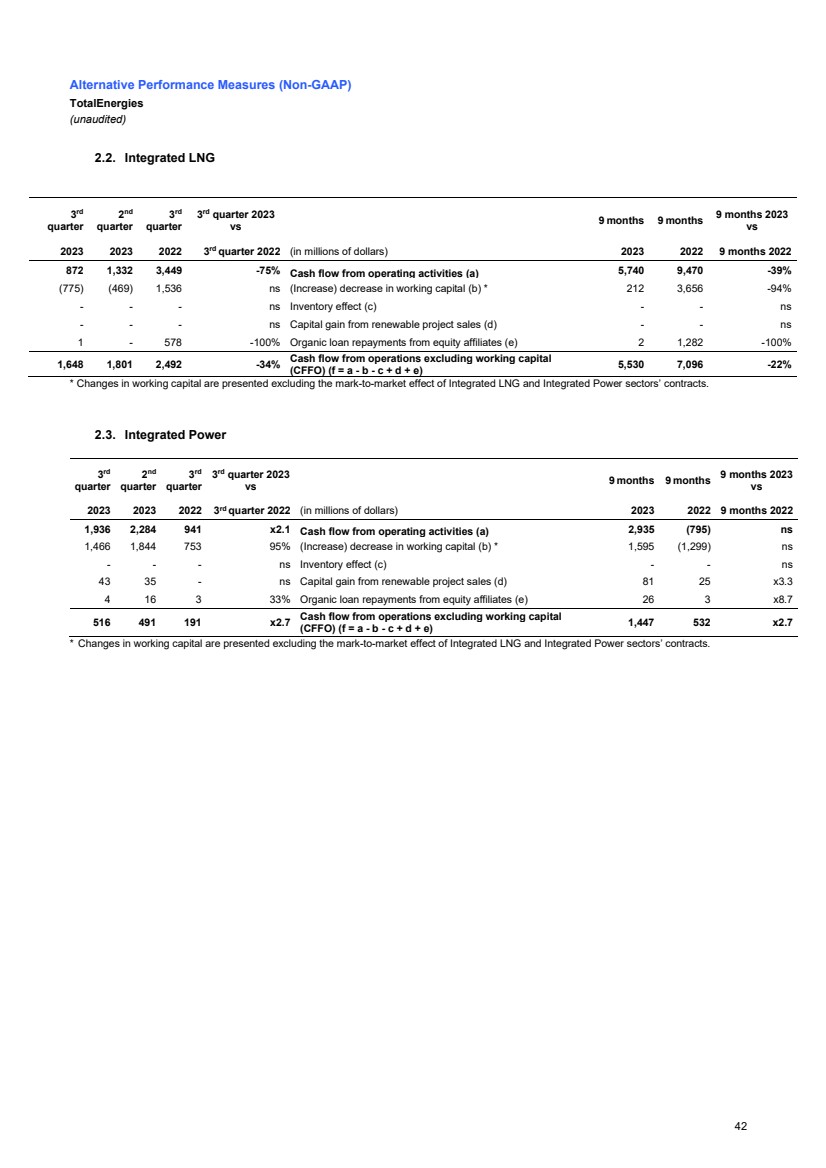
| Alternative Performance Measures (Non-GAAP)
TotalEnergies
(unaudited)
2.2. Integrated LNG
3
rd
quarter
2
nd
quarter
3
rd
quarter
3
rd quarter 2023
vs
9 months 9 months 9 months 2023
vs
2023 2023 2022 3
rd quarter 2022 (in millions of dollars) 2023 2022 9 months 2022
872 1,332 3,449 -75% Cash flow from operating activities (a) 5,740 9,470 -39%
(775) (469) 1,536 ns (Increase) decrease in working capital (b) * 212 3,656 -94%
- - - ns Inventory effect (c) - - ns
- - - ns Capital gain from renewable project sales (d) - - ns
1 - 578 -100% Organic loan repayments from equity affiliates (e) 2 1,282 -100%
1,648 1,801 2,492 -34% Cash flow from operations excluding working capital
(CFFO) (f = a - b - c + d + e) 5,530 7,096 -22%
* Changes in working capital are presented excluding the mark-to-market effect of Integrated LNG and Integrated Power sectors’ contracts.
2.3. Integrated Power
3
rd
quarter
2
nd
quarter
3
rd
quarter
3
rd quarter 2023
vs
9 months 9 months 9 months 2023
vs
2023 2023 2022 3
rd quarter 2022 (in millions of dollars) 2023 2022 9 months 2022
1,936 2,284 941 x2.1 Cash flow from operating activities (a) 2,935 (795) ns
1,466 1,844 753 95% (Increase) decrease in working capital (b) * 1,595 (1,299) ns
- - - ns Inventory effect (c) - - ns
43 35 - ns Capital gain from renewable project sales (d) 81 25 x3.3
4 16 3 33% Organic loan repayments from equity affiliates (e) 26 3 x8.7
516 491 191 x2.7 Cash flow from operations excluding working capital
(CFFO) (f = a - b - c + d + e) 1,447 532 x2.7
* Changes in working capital are presented excluding the mark-to-market effect of Integrated LNG and Integrated Power sectors’ contracts.
42 |
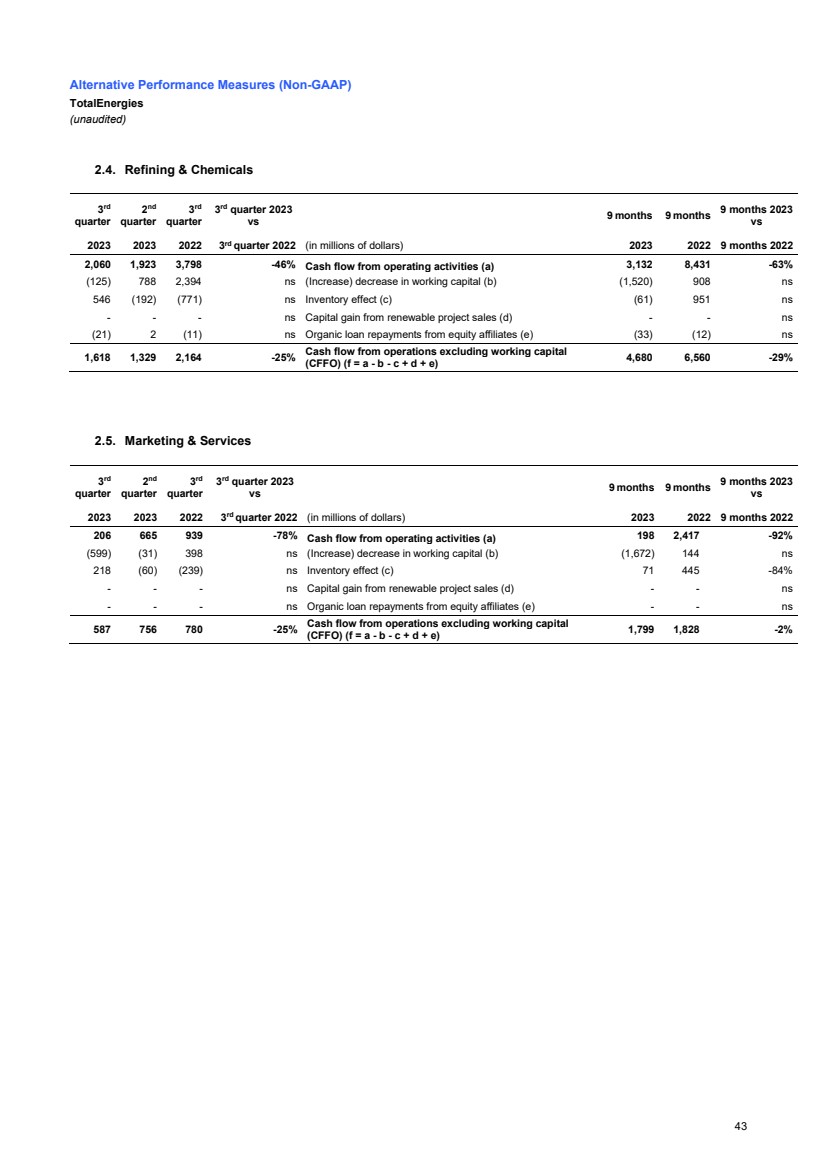
| Alternative Performance Measures (Non-GAAP)
TotalEnergies
(unaudited)
2.4. Refining & Chemicals
3
rd
quarter
2
nd
quarter
3
rd
quarter
3
rd quarter 2023
vs
9 months 9 months 9 months 2023
vs
2023 2023 2022 3
rd quarter 2022 (in millions of dollars) 2023 2022 9 months 2022
2,060 1,923 3,798 -46% Cash flow from operating activities (a) 3,132 8,431 -63%
(125) 788 2,394 ns (Increase) decrease in working capital (b) (1,520) 908 ns
546 (192) (771) ns Inventory effect (c) (61) 951 ns
- - - ns Capital gain from renewable project sales (d) - - ns
(21) 2 (11) ns Organic loan repayments from equity affiliates (e) (33) (12) ns
1,618 1,329 2,164 -25% Cash flow from operations excluding working capital
(CFFO) (f = a - b - c + d + e) 4,680 6,560 -29%
2.5. Marketing & Services
3
rd
quarter
2
nd
quarter
3
rd
quarter
3
rd quarter 2023
vs
9 months 9 months 9 months 2023
vs
2023 2023 2022 3
rd quarter 2022 (in millions of dollars) 2023 2022 9 months 2022
206 665 939 -78% Cash flow from operating activities (a) 198 2,417 -92%
(599) (31) 398 ns (Increase) decrease in working capital (b) (1,672) 144 ns
218 (60) (239) ns Inventory effect (c) 71 445 -84%
- - - ns Capital gain from renewable project sales (d) - - ns
- - - ns Organic loan repayments from equity affiliates (e) - - ns
587 756 780 -25% Cash flow from operations excluding working capital
(CFFO) (f = a - b - c + d + e) 1,799 1,828 -2%
43 |
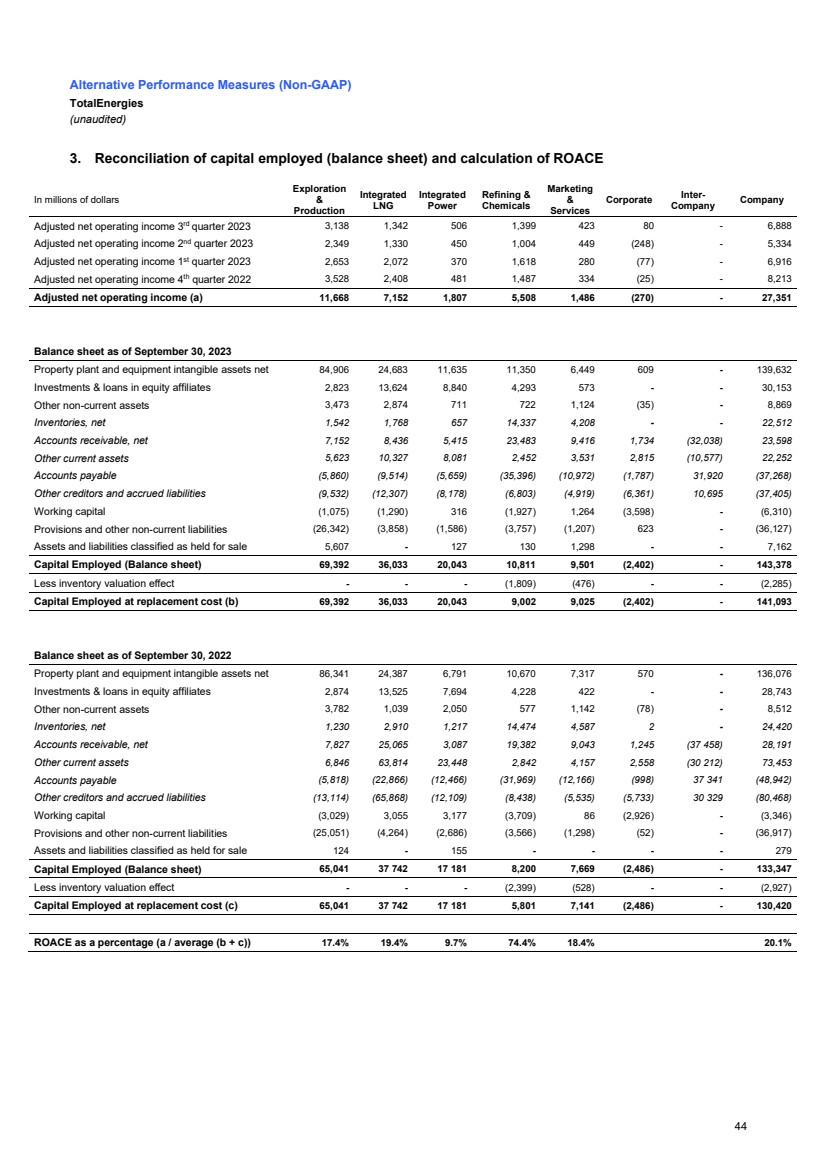
| Alternative Performance Measures (Non-GAAP)
TotalEnergies
(unaudited)
3. Reconciliation of capital employed (balance sheet) and calculation of ROACE
In millions of dollars
Exploration
&
Production
Integrated
LNG
Integrated
Power
Refining &
Chemicals
Marketing
&
Services
Corporate Inter-Company Company
Adjusted net operating income 3rd quarter 2023 3,138 1,342 506 1,399 423 80 - 6,888
Adjusted net operating income 2nd quarter 2023 2,349 1,330 450 1,004 449 (248) - 5,334
Adjusted net operating income 1st quarter 2023 2,653 2,072 370 1,618 280 (77) - 6,916
Adjusted net operating income 4th quarter 2022 3,528 2,408 481 1,487 334 (25) - 8,213
Adjusted net operating income (a) 11,668 7,152 1,807 5,508 1,486 (270) - 27,351
Balance sheet as of September 30, 2023
Property plant and equipment intangible assets net 84,906 24,683 11,635 11,350 6,449 609 - 139,632
Investments & loans in equity affiliates 2,823 13,624 8,840 4,293 573 - - 30,153
Other non-current assets 3,473 2,874 711 722 1,124 (35) - 8,869
Inventories, net 1,542 1,768 657 14,337 4,208 - - 22,512
Accounts receivable, net 7,152 8,436 5,415 23,483 9,416 1,734 (32,038) 23,598
Other current assets 5,623 10,327 8,081 2,452 3,531 2,815 (10,577) 22,252
Accounts payable (5,860) (9,514) (5,659) (35,396) (10,972) (1,787) 31,920 (37,268)
Other creditors and accrued liabilities (9,532) (12,307) (8,178) (6,803) (4,919) (6,361) 10,695 (37,405)
Working capital (1,075) (1,290) 316 (1,927) 1,264 (3,598) - (6,310)
Provisions and other non-current liabilities (26,342) (3,858) (1,586) (3,757) (1,207) 623 - (36,127)
Assets and liabilities classified as held for sale 5,607 - 127 130 1,298 - - 7,162
Capital Employed (Balance sheet) 69,392 36,033 20,043 10,811 9,501 (2,402) - 143,378
Less inventory valuation effect - - - (1,809) (476) - - (2,285)
Capital Employed at replacement cost (b) 69,392 36,033 20,043 9,002 9,025 (2,402) - 141,093
Balance sheet as of September 30, 2022
Property plant and equipment intangible assets net 86,341 24,387 6,791 10,670 7,317 570 - 136,076
Investments & loans in equity affiliates 2,874 13,525 7,694 4,228 422 - - 28,743
Other non-current assets 3,782 1,039 2,050 577 1,142 (78) - 8,512
Inventories, net 1,230 2,910 1,217 14,474 4,587 2 - 24,420
Accounts receivable, net 7,827 25,065 3,087 19,382 9,043 1,245 (37 458) 28,191
Other current assets 6,846 63,814 23,448 2,842 4,157 2,558 (30 212) 73,453
Accounts payable (5,818) (22,866) (12,466) (31,969) (12,166) (998) 37 341 (48,942)
Other creditors and accrued liabilities (13,114) (65,868) (12,109) (8,438) (5,535) (5,733) 30 329 (80,468)
Working capital (3,029) 3,055 3,177 (3,709) 86 (2,926) - (3,346)
Provisions and other non-current liabilities (25,051) (4,264) (2,686) (3,566) (1,298) (52) - (36,917)
Assets and liabilities classified as held for sale 124 - 155 - - - - 279
Capital Employed (Balance sheet) 65,041 37 742 17 181 8,200 7,669 (2,486) - 133,347
Less inventory valuation effect - - - (2,399) (528) - - (2,927)
Capital Employed at replacement cost (c) 65,041 37 742 17 181 5,801 7,141 (2,486) - 130,420
ROACE as a percentage (a / average (b + c)) 17.4% 19.4% 9.7% 74.4% 18.4% 20.1%
44 |
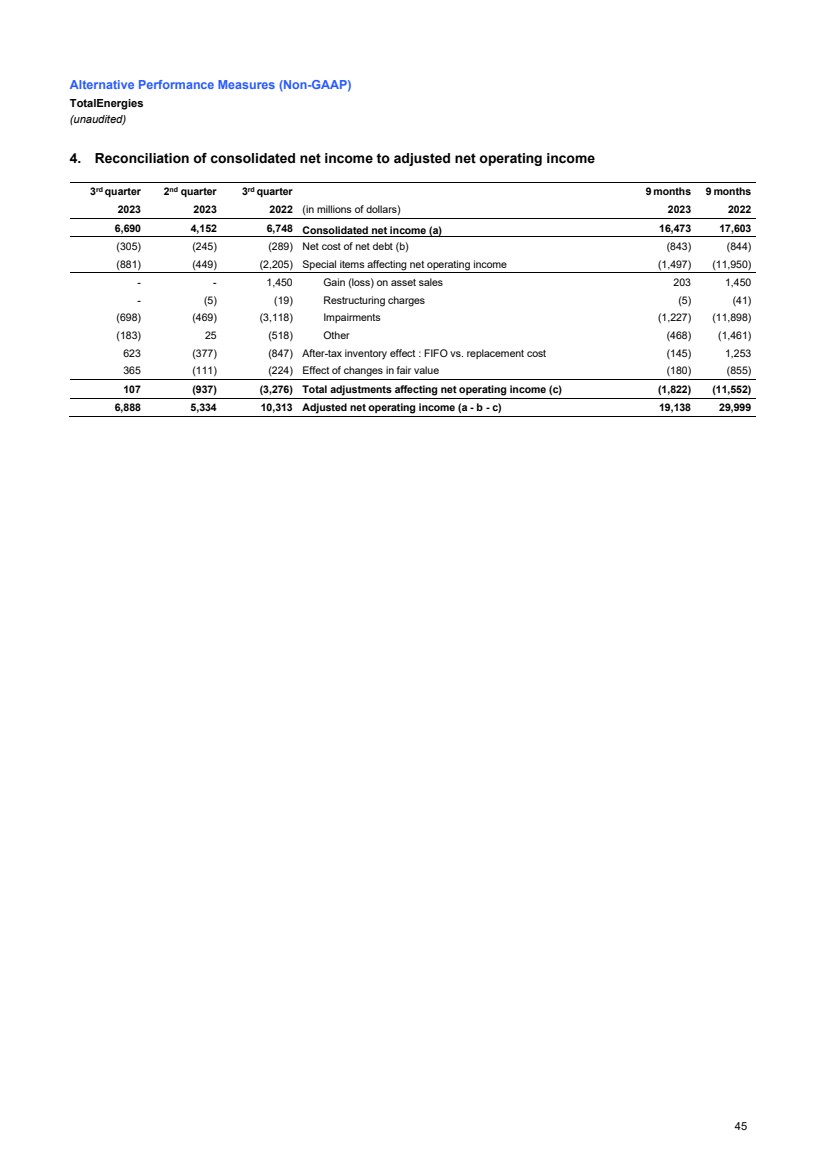
| Alternative Performance Measures (Non-GAAP)
TotalEnergies
(unaudited)
4. Reconciliation of consolidated net income to adjusted net operating income
3
rd quarter 2
nd quarter 3
rd quarter 9 months 9 months
2023 2023 2022 (in millions of dollars) 2023 2022
6,690 4,152 6,748 Consolidated net income (a) 16,473 17,603
(305) (245) (289) Net cost of net debt (b) (843) (844)
(881) (449) (2,205) Special items affecting net operating income (1,497) (11,950)
- - 1,450 Gain (loss) on asset sales 203 1,450
- (5) (19) Restructuring charges (5) (41)
(698) (469) (3,118) Impairments (1,227) (11,898)
(183) 25 (518) Other (468) (1,461)
623 (377) (847) After-tax inventory effect : FIFO vs. replacement cost (145) 1,253
365 (111) (224) Effect of changes in fair value (180) (855)
107 (937) (3,276) Total adjustments affecting net operating income (c) (1,822) (11,552)
6,888 5,334 10,313 Adjusted net operating income (a - b - c) 19,138 29,999
45 |
Exhibit
99.16
 |
PRESS RELEASE |
TotalEnergies announces the
third interim dividend of
€0.74/share for fiscal
year 2023,
an increase of more than 7% compared to
2022
Paris,
26th October 2023 - The Board of Directors meeting on October 25, 2023 under the chairmanship of Mr. Patrick Pouyanné,
Chairman and Chief Executive Officer, decided the distribution of the third 2023 interim dividend of 0.74 €/share, an increase of
7.25% compared to the three interim dividends paid for fiscal year 2022 and identical to the first and second 2023 interims. This increase
is in line with the shareholder return policy confirmed by the Board of Directors in February 2023.
This interim dividend will be paid in
cash exclusively, according to the following timetable:
| |
Shareholders |
ADS holders |
| Ex-dividend date |
March 20, 2024 |
March 18, 2024 |
| Payment date |
April 3, 2024 |
April 15 , 2024 |
_____
About TotalEnergies
TotalEnergies is a global multi-energy
company that produces and markets energies: oil and biofuels, natural gas and green gases, renewables and electricity. Our more than 100,000
employees are committed to energy that is ever more affordable, cleaner, more reliable and accessible to as many people as possible. Active
in nearly 130 countries, TotalEnergies puts sustainable development in all its dimensions at the heart of its projects and operations
to contribute to the well-being of people.
TotalEnergies Contacts
Media Relations:
+33 (0)1 47 44 46 99 l presse@totalenergies.com l @TotalEnergiesPR
Investor
Relations: +33 (0)1 47 44 46 46 l ir@totalenergies.com
|
@TotalEnergies | |
TotalEnergies | |
TotalEnergies |
|
TotalEnergies |
Cautionary Note
The terms “TotalEnergies”,
“TotalEnergies company” or “Company” in this document are used to designate TotalEnergies SE and the consolidated
entities that are directly or indirectly controlled by TotalEnergies SE. Likewise, the words “we”, “us” and “our”
may also be used to refer to these entities or to their employees. The entities in which TotalEnergies SE directly or indirectly owns
a shareholding are separate legal entities. This document may contain forward-looking information and statements that are based on a number
of economic data and assumptions made in a given economic, competitive and regulatory environment. They may prove to be inaccurate in
the future and are subject to a number of risk factors. Neither TotalEnergies SE nor any of its subsidiaries assumes any obligation to
update publicly any forward-looking information or statement, objectives or trends contained in this document whether as a result of new
information, future events or otherwise. Information concerning risk factors, that may affect TotalEnergies’ financial results or
activities is provided in the most recent Universal Registration Document, the French-language version of which is filed by TotalEnergies
SE with the French securities regulator Autorité des Marchés Financiers (AMF), and in the Form 20-F filed with the United
States Securities and Exchange Commission (SEC).
Exhibit 99.17
 |
PRESS RELEASE |
Germany: TotalEnergies Pursues Its
Integrated Power Strategy
by Acquiring Renewable Energy Aggregator Quadra Energy
Paris, October 26, 2023 – TotalEnergies
has signed agreements with the Aloys Wobben Foundation (AWS) to acquire the entire share capital of the German company Quadra Energy.
Founded in 2012 and boasting a “virtual power plant” totaling 9 GW, Quadra Energy is one of the top 3 aggregators of renewable
electricity production in Germany – the largest power market in Europe with the highest renewable growth.
Specializing in the aggregation of renewable electricity,
Quadra Energy purchased production from around 5,000 wind and solar power plants in 2022, and then resold 14 TWh on wholesale markets
and to German resellers and customers. Quadra Energy has also developed since 2021 a portfolio of medium-term contracts for the purchase
of 2 TWh of renewable power and their sale through corporate PPAs.
This acquisition, which is subject to approval
by the relevant authorities, will enable TotalEnergies to further strengthen its integrated power business in Germany. TotalEnergies will
leverage the extensive expertise of Quadra Energy’s 40 staff members, as well as its innovative weather-forecasting platform. These
assets will also enable the Company to strengthen its trading capacity on the intraday markets and to broaden its marketing activities
to offer its German customers competitive corporate PPAs and clean firm power. Finally, Quadra Energy’s in-depth knowledge of local
renewable developers will also make it easier for TotalEnergies to develop its own renewable production capacity in the country, following
its successful bid for a 3 GW offshore wind concession in July.
"We are pleased with the acquisition of Quadra
Energy, and I would like to welcome their teams, who will be an essential component of our presence in Germany’s electricity market,”
said Stéphane Michel, President Gas, Renewables & Power at TotalEnergies. "This agreement will enable us to
speed up the development of our Integrated Power activities in the country – whose electricity market has particularly attractive
fundamentals – in both production, trading, aggregation and marketing of Corporate PPA and clean firm power. This acquisition thus
contributes positively to our profitability target of 12 % ROACE by 2028 for this business segment."
***
TotalEnergies and electricity
As part of its ambition to get to net zero by 2050,
TotalEnergies is building a world class cost-competitive portfolio combining renewables (solar, onshore and offshore wind) and flexible
assets (CCGT, storage) to deliver clean firm power to its customers. In 2022, TotalEnergies generated more than 33 TWh of electricity,
and had a gross renewable electricity generation installed capacity of 17 GW. TotalEnergies will continue to expand this business to grow
its power generation to more than 100 TWh by 2030, with the objective of being among the world's top 5 producers of electricity from wind
and solar energy.
About TotalEnergies
TotalEnergies is a global multi-energy company
that produces and markets energies: oil and biofuels, natural gas and green gases, renewables and electricity. Our more than 100,000
employees are committed to energy that is ever more affordable, cleaner, more reliable and accessible to as many people as possible.
Active in nearly 130 countries, TotalEnergies puts sustainable development in all its dimensions at the heart of its projects and operations
to contribute to the well-being of people.
TotalEnergies
Contacts
Media
Relations:+33 (0)1 47 44 46 99 l presse@totalenergies.com l @TotalEnergiesPR
Investor
Relations:+33 (0)1 47 44 46 46 l ir@totalenergies.com
|
@TotalEnergies | |
TotalEnergies | |
TotalEnergies |
|
TotalEnergies |
Cautionary Note
The terms “TotalEnergies”, “TotalEnergies
company” or “Company” in this document are used to designate TotalEnergies SE and the consolidated entities that are
directly or indirectly controlled by TotalEnergies SE. Likewise, the words “we”, “us” and “our” may
also be used to refer to these entities or to their employees. The entities in which TotalEnergies SE directly or indirectly owns a shareholding
are separate legal entities. This document may contain forward-looking information and statements that are based on a number of economic
data and assumptions made in a given economic, competitive and regulatory environment. They may prove to be inaccurate in the future and
are subject to a number of risk factors. Neither TotalEnergies SE nor any of its subsidiaries assumes any obligation to update publicly
any forward-looking information or statement, objectives or trends contained in this document whether as a result of new information,
future events or otherwise. Information concerning risk factors, that may affect TotalEnergies’ financial results or activities
is provided in the most recent Universal Registration Document, the French-language version of which is filed by TotalEnergies SE with
the French securities regulator Autorité des Marchés Financiers (AMF), and in the Form 20-F filed with the United States
Securities and Exchange Commission (SEC).
Exhibit 99.18
Disclosure of Transactions in Own Shares
Paris, October 30, 2023 – In
accordance with the authorization given by the ordinary shareholders’ general meeting on May 26, 2023, to trade on its shares
and pursuant to applicable law on share repurchase, TotalEnergies SE (LEI: 529900S21EQ1BO4ESM68) declares the following purchases of its
own shares (FR0000120271) from October 23 to October 27, 2023:
| Transaction
Date |
Total
daily volume
(number of shares) |
Daily
weighted
average purchase
price of shares
(EUR/share) |
Amount
of
transactions (EUR) |
Market
(MIC Code) |
| 23/10/2023 |
466,799 |
|
62.393324 |
29,125,141.25 |
XPAR |
| 23/10/2023 |
90,000 |
|
62.391538 |
5,615,238.42 |
CEUX |
| 23/10/2023 |
15,000 |
|
62.394791 |
935,921.87 |
TQEX |
| 23/10/2023 |
20,000 |
|
62.391653 |
1,247,833.06 |
AQEU |
| 24/10/2023 |
385,357 |
|
62.358075 |
24,030,120.71 |
XPAR |
| 24/10/2023 |
170,000 |
|
62.293698 |
10,589,928.66 |
CEUX |
| 24/10/2023 |
15,000 |
|
62.358013 |
935,370.20 |
TQEX |
| 24/10/2023 |
20,000 |
|
62.360600 |
1,247,212.00 |
AQEU |
| 25/10/2023 |
427,339 |
|
61.936825 |
26,468,020.86 |
XPAR |
| 25/10/2023 |
135,000 |
|
61.938500 |
8,361,697.50 |
CEUX |
| 25/10/2023 |
15,000 |
|
61.934253 |
929,013.80 |
TQEX |
| 25/10/2023 |
20,000 |
|
61.937977 |
1,238,759.54 |
AQEU |
| 26/10/2023 |
441,133 |
|
62.274534 |
27,471,352.01 |
XPAR |
| 26/10/2023 |
120,000 |
|
62.272866 |
7,472,743.92 |
CEUX |
| 26/10/2023 |
15,000 |
|
62.293455 |
934,401.83 |
TQEX |
| 26/10/2023 |
20,000 |
|
62.270914 |
1,245,418.28 |
AQEU |
| 27/10/2023 |
645,841 |
|
63.671325 |
41,121,552.21 |
XPAR |
| 27/10/2023 |
300,000 |
|
63.678359 |
19,103,507.70 |
CEUX |
| 27/10/2023 |
50,000 |
|
63.680752 |
3,184,037.60 |
TQEX |
| 27/10/2023 |
25,000 |
|
63.633714 |
1,590,842.85 |
AQEU |
| Total |
3,396,469 |
62.667469 |
212,848,114.24 |
|
Transaction details
In accordance with Article 5(1)(b) of Regulation (EU) No
596/2014 (the Market Abuse Regulation) a full breakdown of the individual trades are disclosed on the TotalEnergies website: https://totalenergies.com/investors/shares-and-dividends/total-shares/info/company-share-transactions
About TotalEnergies
TotalEnergies is a global multi-energy company
that produces and markets energies: oil and biofuels, natural gas and green gases, renewables and electricity. Our more than 100,000 employees
are committed to energy that is ever more affordable, cleaner, more reliable and accessible to as many people as possible. Active in nearly
130 countries, TotalEnergies puts sustainable development in all its dimensions at the heart of its projects and operations to contribute
to the well-being of people.
TotalEnergies
Contacts
Media
Relations:+33 (0)1 47 44 46 99 l presse@totalenergies.com l @TotalEnergiesPR
Investor
Relations:+33 (0)1 47 44 46 46 l ir@totalenergies.com
|
@TotalEnergies | |
TotalEnergies | |
TotalEnergies |
|
TotalEnergies |
Cautionary Note
The terms “TotalEnergies”, “TotalEnergies
company” or “Company” in this document are used to designate TotalEnergies SE and the consolidated entities that are
directly or indirectly controlled by TotalEnergies SE. Likewise, the words “we”, “us” and “our” may
also be used to refer to these entities or to their employees. The entities in which TotalEnergies SE directly or indirectly owns a shareholding
are separate legal entities. This document may contain forward-looking information and statements that are based on a number of economic
data and assumptions made in a given economic, competitive and regulatory environment. They may prove to be inaccurate in the future and
are subject to a number of risk factors. Neither TotalEnergies SE nor any of its subsidiaries assumes any obligation to update publicly
any forward-looking information or statement, objectives or trends contained in this document whether as a result of new information,
future events or otherwise. Information concerning risk factors, that may affect TotalEnergies’ financial results or activities
is provided in the most recent Universal Registration Document, the French-language version of which is filed by TotalEnergies SE with
the French securities regulator Autorité des Marchés Financiers (AMF), and in the Form 20-F filed with the United States
Securities and Exchange Commission (SEC).
Exhibit 99.19
 |
PRESS RELEASE |
SATORP completes
MENA region’s first conversion of used
cooking oil into ISCC+ certified sustainable aviation fuel (SAF)
Paris, October 30, 2023 – SATORP,
platform jointly owned by Aramco (62,5 %) and TotalEnergies (37,5 %), has for the first time in the region successfully converted used
cooking oil through coprocessing into ISCC+ certified Sustainable Aviation Fuel (SAF).
Last August, the platform successfully co-processed
Used Cooking Oil in the Low-Pressure Hydrodesulphurization Unit (LPHDS), producing SAF, meeting all product quality parameters within
the SAF specifications. TotalEnergies contributed thanks to its experience and expertise to this realization.
SATORP has received International Sustainability
and Carbon Certification (ISCC+) to produce SAF. With this certification, the platform will be able to respond the expected rise in SAF
demand in the Kingdom of Saudi Arabia.
The sustainable aviation fuels produced from UCO
reduces CO2 emissions by at least 80% on average over the entire lifecycle, compared with their fossil equivalent.
With this success, TotalEnergies through its platform
located in Jubail keeps developing its portfolio of circular products. SATORP has previously announced converting oil derived from plastic
waste into ISCC+ certified circular polymers.
Francois Good, Senior Vice President, Refining
and Petrochemicals Africa Middle East and Asia at TotalEnergies said: “This project at SATORP is part of TotalEnergies’
aim to produce 1.5 million tons/y of SAF by 2030. Sustainable aviation fuel is essential to reducing the CO2 emissions of air transport,
and its development is fully aligned with the Company's climate ambition to get to net zero by 2050, together with society”
***
About SATORP
The Saudi Aramco TotalEnergies Refining and Petrochemical
Company (SATORP), the first such joint venture between the two energy companies, was established in June 2008 to build a refining
and petrochemical complex in Jubail II industrial city. The refinery, whose capacity increased from 400,000 barrels per day (bpd) of crude
oil at its start-up in 2014 to 460,000 bpd today, is recognized as one of the most efficient in the world.
About TotalEnergies
TotalEnergies is a global multi-energy company
that produces and markets energies: oil and biofuels, natural gas and green gases, renewables and electricity. Our more than 100,000 employees
are committed to energy that is ever more affordable, more sustainable, more reliable and accessible to as many people as possible. Active
in nearly 130 countries, TotalEnergies puts sustainable development in all its dimensions at the heart of its projects and operations
to contribute to the well-being of people.
TotalEnergies Contacts
Media
Relations:+33 (0)1 47 44 46 99 l presse@totalenergies.com l @TotalEnergiesPR
Investor Relations: +33 (0)1 47 44 46 46 l ir@totalenergies.com
|
@TotalEnergies | |
TotalEnergies | |
TotalEnergies |
|
TotalEnergies |
Cautionary Note
The terms “TotalEnergies”, “TotalEnergies
company” or “Company” in this document are used to designate TotalEnergies SE and the consolidated entities that are
directly or indirectly controlled by TotalEnergies SE. Likewise, the words “we”, “us” and “our” may
also be used to refer to these entities or to their employees. The entities in which TotalEnergies SE directly or indirectly owns a shareholding
are separate legal entities. This document may contain forward-looking information and statements that are based on a number of economic
data and assumptions made in a given economic, competitive and regulatory environment. They may prove to be inaccurate in the future and
are subject to a number of risk factors. Neither TotalEnergies SE nor any of its subsidiaries assumes any obligation to update publicly
any forward-looking information or statement, objectives or trends contained in this document whether as a result of new information,
future events or otherwise. Information concerning risk factors, that may affect TotalEnergies’ financial results or activities
is provided in the most recent Universal Registration Document, the French-language version of which is filed by TotalEnergies SE with
the French securities regulator Autorité des Marchés Financiers (AMF), and in the Form 20-F filed with the United States
Securities and Exchange Commission (SEC).
TotalEnergies (NYSE:TTE)
Gráfico Histórico do Ativo
De Jun 2024 até Jul 2024

TotalEnergies (NYSE:TTE)
Gráfico Histórico do Ativo
De Jul 2023 até Jul 2024
