UNITED STATES
SECURITIES AND EXCHANGE COMMISSION
Washington, D.C. 20549
Form 10-K
(Mark One)
☒ ANNUAL REPORT PURSUANT TO SECTION 13
OR 15(d) OF THE SECURITIES EXCHANGE ACT OF 1934
For the fiscal year ended February 29, 2024
OR
☐ TRANSITION REPORT PURSUANT TO SECTION
13 OR 15(d) OF THE SECURITIES EXCHANGE ACT OF 1934
For the transition period from to
Commission file number 0-17249
AURA SYSTEMS, INC.
(Exact name of registrant as specified in its
charter)
| Delaware | | 95-4106894 |
(State or other jurisdiction of
incorporation or organization) | | (I.R.S. Employer
Identification No.) |
20431 North Sea
Lake Forest, CA 92630
(Address of principal executive offices, zip code)
Registrant’s telephone number, including
area code: (310) 643-5300
Name of each exchange on which registered: None
Securities registered pursuant to Section 12(b)
of the Act: None
Securities registered pursuant to Section 12(g)
of the Act: Common Stock
Indicate by check mark if the registrant is a
well-known seasoned issuer, as defined in Rule 405 of the Securities Act. Yes ☐ No ☒
Indicate by check mark if the registrant is not
required to file reports pursuant to Section 13 or Section 15(d) of the Exchange Act. Yes ☐ No ☒
Indicate by check mark whether the registrant
(1) has filed all reports required to be filed by Section 13 or 15(d) of the Securities Exchange Act of 1934 during the preceding 12
months (or for such shorter period that the registrant was required to file such reports), and (2) has been subject to such filing requirements
for the past 90 days. Yes ☒ No ☐
Indicate by check mark whether the registrant
has submitted electronically and posted on its corporate Web site, if any, every Interactive Data File required to be submitted and posted
pursuant to Rule 405 of Regulation S-T (§232.405 of this chapter) during the preceding 12 months (or for such shorter period that
the registrant was required to submit and post such files). Yes ☐ No ☒
Indicate by check mark if disclosure of delinquent
filers pursuant to Item 405 of Regulation S-K is not contained herein, and will not be contained, to the best of registrant’s knowledge,
in definitive proxy or information statements incorporated by reference in Part III of this Form 10-K or any amendment to this Form 10-K.
☐
Indicate by check mark whether the registrant
is a large accelerated filer, an accelerated filer, a non-accelerated filer, a smaller reporting company, or an emerging growth company.
See the definitions of the “large accelerated filer,” “accelerated filer,” “non-accelerated filer,”
and “smaller reporting company” in Rule 12b-2 of the Exchange Act.
| Large accelerated filer | ☐ | Accelerated filer | ☐ |
| Non-accelerated filer | ☒ | Smaller reporting company | ☒ |
| | Emerging growth company | ☐ |
If an emerging growth company, indicate by check
mark if the registrant has elected not to use the extended transition period for complying with any new or revised financial accounting
standards provided pursuant to Section 13(a) of the Exchange Act. ☐
Indicate by check mark whether the registrant
has filed a report on and attestation to its management’s assessment of the effectiveness of its internal control over financial
reporting under Section 404(b) of the Sarbanes-Oxley Act (15 U.S.C. 7262(b)) by the registered public accounting firm that prepared or
issued its audit report. ☐
If securities are registered pursuant to Section
12(b) of the Act, indicate by check mark whether the financial statements of the registrant included in the filing reflect the correction
of an error to previously issued financial statements. ☐
Indicate by check mark whether any of those error
corrections are restatements that required a recovery analysis of incentive-based compensation received by any of the registrant’s
executive officers during the relevant recovery period pursuant to §240.10D-1(b). ☐
Indicate by check mark whether the registrant
is a shell company (as defined in Rule 12b-2 of the Exchange Act). Yes ☐ No ☒
On August 31, 2023, the aggregate market value
of the voting stock held by non-affiliates of the Registrant was $19,201,000. The aggregate market value has been computed by reference
to the last sale price of the stock as quoted on the Pink Sheets quotation system on August 31, 2023. For the purposes of this calculation,
voting stock held by officers, directors, and affiliates has been excluded.
On June 4, 2024, the Registrant had 109,047,248
shares of common stock outstanding.
Documents incorporated by reference: None.
TABLE OF CONTENTS
SPECIAL NOTE REGARDING
FORWARD-LOOKING STATEMENTS
This Report contains forward-looking
statements within the meaning of the federal securities laws. Statements other than statements of historical fact included in this Report,
including the statements under the headings “Management’s Discussion and Analysis of Financial Condition and Results of Operations,”
“Business” and elsewhere in this Report regarding future events or prospects are forward-looking statements. The words “approximates,”
“believes,” “forecast,” “expects,” “anticipates,” “estimates,” “intends,”
“plans,” “would,” “could,” “should,” “seek,” “may,” or other
similar expressions in this Report, as well as other statements regarding matters that are not historical fact, constitute forward-looking
statements. We caution investors that any forward-looking statements presented in this Report are based on the beliefs of, assumptions
made by, and information currently available to, us. Such statements are based on assumptions and the actual outcome will be affected
by known and unknown risks, trends, uncertainties and factors that are beyond our control or ability to predict. Although we believe
that our assumptions are reasonable, they are not guarantees of future performance and some may inevitably prove to be incorrect. As
a result, our actual future results may differ from our expectations, and those differences may be material. Accordingly, investors should
use caution in relying on forward-looking statements to anticipate future results or trends.
Some of the risks and
uncertainties that may cause our actual results, performance or achievements to differ materially from those expressed or implied by
forward-looking statements include the following:
| ● | Our
ability to generate positive cash flow from operations; |
| ● | Our
ability to obtain additional financing to fund our operations; |
| ● | The
impact of economic, political and market conditions on us and our customers; |
| ● | The
impact of unfavorable results of legal proceedings; |
| ● | Our
exposure to potential liability arising from possible errors and omissions, breach of fiduciary
duty, breach of duty of care, waste of corporate assets and/or similar claims that may be
asserted against us; |
| ● | Our
ability to compete effectively against competitors offering different technologies; |
| ● | Our
business development and operating development; |
| ● | Our
expectations of growth in demand for our products; and |
| ● | Other
risks described under the heading “Risk Factors” in Part I, Item 1A of this Annual
Report on Form 10-K |
We do not intend to update
or revise any forward-looking statements, whether as a result of new information, future events or otherwise except to the extent required
by law. You should interpret all subsequent written or oral forward-looking statements attributable to us or persons acting on our behalf
as being expressly qualified by the cautionary statements in this Report. As a result, you should not place undue reliance on these forward-looking
statements.
References in this Report
to “we”, “us”, “the Company,” “Aura” or “Aura Systems” means Aura Systems,
Inc. As used herein, reference to “Fiscal 2024” refers to the fiscal year ending February 29, 2024, “Fiscal 2023”
refers to the fiscal year ending February 28, 2023, “Fiscal 2022” refers to the fiscal year ending February 28, 2022, “Fiscal
2021” refers to the fiscal year ending February 28, 2021, reference to “Fiscal 2020” refers to the fiscal year ended
February 29, 2020, reference to “Fiscal 2019” refers to the fiscal year ended February 28, 2019, reference to “Fiscal
2018” refers to the fiscal year ended February 28, 2018, reference to “Fiscal 2017” refers to the Fiscal year ended
February 28, 2017, reference to “Fiscal 2016” refers to the fiscal year ended February 29, 2016, and reference to “Fiscal
2015” refers to the fiscal year ended February 28, 2015.
PART I
ITEM 1. BUSINESS
Introduction
Aura Systems, Inc. (“Aura”),
is a Delaware corporation founded in 1987. The Company innovated and commercialized the technology for Axial Flux Induction electric
motors and generators. Aura’s axial flux induction motor technology (“AAFIM”) provides an industrial solution that
does not use any permanent magnets, no rare earth elements, is smaller and lighter, uses significant less materials (just copper and
steel), very high efficiency, significantly less copper, highly reliably, very robust, and no scheduled maintenance.
The industrial electric motor
market is expected to grow from an estimated USD 113.3 billion in 2020 to USD 169.1 billion by 2026, at a CAGR of 6.9%
during the forecast period1.
Electric motors are employed
in infrastructure, major structures, and industries all around the world. Each year, almost 30 million motors are sold
for industrial use alone2. Electric motors find application in a variety of equipment throughout industry. Common industrial
applications include: (i) compressors, (ii) fans and blowers, (iii) heavy duty equipment, (iv) HVAC systems, (v) pumps and (vi)
machine tools (lathes and mills, etc.).
The universal global trend
for electrification has created in addition to the industrial demand for motors a very large demand for motors used in electric transportation
for vehicles, planes, and boats (“EV”). In such applications, one or more electric motors are used for propulsion. Most
electric motors currently used for electric mobility employ high energy permanent magnets3 due to their high efficiency and
small size. The magnetic material is usually sintered neodymium–iron–boron (NdFeB) made or processed in China.
It is expected that over
100 million electric motors will be required per year by 2032 to meet the demand for the growing EV market4.
For Electric Vehicle applications,
AAFIM provide efficiencies that are equal to or higher than ones provided by the best high energy permanent magnet solution (“PM”).
AAFIM are smaller, have higher reliability, are more robust, have larger operating speed range, are not limited to 100 degrees C operating
temperature for the equivalent PM machine. In addition, AAFIM costs are significantly lower than the equivalent PM machines.
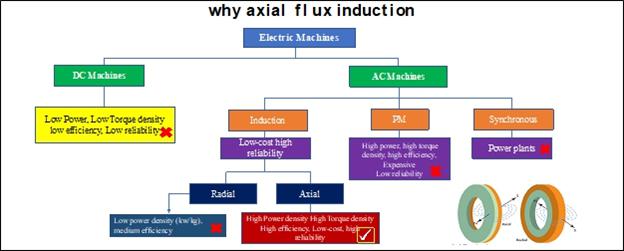
The history of electric machines
reveals that the earliest machines were, in fact, axial flux machines. However, after the first radial flux machines were demonstrated
in the beginning of the 20th century, radial flux machines were accepted as the mainstream configuration. The reason for shelving
the axial flux machines were multifold and can be summarized as follows: (i) strong axial magnetic attraction force between the stator
and the rotor, (ii) fabrication difficulties such as cutting the slots in laminated cores, (iii) high cost involved in manufacturing
the laminated stator core, (iv) difficulties in assembling the machine and keeping a uniform air gap and (v) providing a laminated rotor
that can withstand the large centripetal forces.
| 1 |
Markets & Markets Electric Motor Market Published
Date: November 2020 | Report Code: EP 3882 |
| 2 |
Precedence Research October 6, 2021 |
| 3 |
Will rare earth be eliminated in EV motor-Dr. James
Edmondson November 2, 2020 |
| 4 |
Emerging Electric Motor Technologies for the EV Market
September 28, 2021, Luke Gear |
In recent years there has been great interest
in axial flux topology for numerous industrial, commercial, and electric mobility motor and power generation applications. However, to
date the commercial focus in axial flux motors has been designs using rare earth permanent magnets (“PM”). The use of rare
earth permanent magnets in axial flux topology can be attributed to the historical belief that it is “difficult to manufacture
a laminated rotor with a cage winding for an axial flux machine. If the cage windings are replaced with nonmagnetic high conductivity
(Cu or AL) homogenous disk or steel disk coated with Cu layer, the performance of the machine drastically deteriorates” (Axial
Flux Permanent Magnet Brushless Machines by Jacek F Gieras, Rong-Jie Wang and Maarten K Kamper 2008).
Aura Systems with its
axial flux induction technology solved the issues related to the rotor back in 2002 and has shipped over 11,000 axial flux induction
machines in the 5-15 kW range to numerous military and commercial users. Aura’s proprietary rotor does not require any
laminates and provides the structural integrity to withstand very large centripetal forces while, at the same time, providing the proper
electric and magnetic properties without the usual issues associated with a solid rotor or a steel disk coated with a copper layer.
ID TechEX research forecasts
a huge increase in demand of axial flux motors over the next 10 years, with first applications in high performance vehicles and certain
hybrid applications5.
Aura has during the
last few years optimized its axial flux induction machine technology (no PM) where the performance (efficiency, torque, energy density)
is now equal to or greater than the very best of both axial and radial permanent magnet machines. Of course, this is done using only
copper and steel with aluminum for housing at a fraction of the cost of equivalent PM machines.
Aura’s Axial Flux Induction
technology is the culmination of decades of cutting-edge electromagnetic research and more than $150 million in development by Aura scientists
and engineers. Aura’s axial flux induction technology used for mobile power generation was first used in a combat zone by U.S.
forces in the U.N actions in the Balkans and since then, the U.S. military has used it in combat zones in both Iraq and Afghanistan.
To date the Company shipped over 11,000 systems for mobile power applications in the 5-15 kW range of which over 3,000 systems were for
various military applications.
Aura’s Axial Flux Induction
Machine has inherited advantages such as (i) no rare earth or any other kind of permanent magnets, (ii) significantly less copper (60%
less) than equivalent traditional induction motors, (iii) significantly higher energy density, (iv) fewer overall materials, and (v)
high efficiency. In addition, being an induction machine, Aura’s solution does not have any brushes or commutators and therefore
do not have any potential for sparks.
Aura’s Axial Flux induction
(“AAFIM”) Competitive Edge
| ○ | Performance-
AAFIM provides the highest power density across all other known motor technologies with energy
density of more than 50 kW/liter for machines in the 250-kW range. In addition, Aura’s
solution provides efficiencies that are higher than any other solutions for commercial and
industrial applications. For 250 kW EV applications Aura’s designs show efficiency
of more than 96%. AAFIM solution also has significantly lower rotor inertia than other
solutions. This increases the machine efficiency even further since it requires less input
torque to move the rotor. |
| ○ | Size
and weight-Aura’s solution is significantly smaller in volume and has lower weight
than any known solution for equivalent power rated machines (even includes PM machines).
When compared to traditional radial flux (“RF”) induction machines, AAFIM has
less than 40 % of the weight and more than 40% reduction in volume. The AAFIM pancake design
creates a solution that can be integrated with vehicles and boats for seamless exportable
power. |
| ○ | Cost-AAFIM
provides a significant cost advantage over equivalent induction and PM machines. The cost
advantage comes from (a) the higher energy density which means less materials and (b) in
the case of PM machines significant cost advantage for equivalent machines by just elimination
of the permanent magnets. When compared to radial flux induction, Aura’s solution uses
approximately 60% less copper. Due to the fractional materials used and the simple manufacturing
processes Aura’s high-performance machines are less expensive to manufacture than other
equivalent machines. |
| ○ | Other
Advantages-Aura’s solution is extremely reliable with the only components to wear out
are the bearings. AAFIM do not require any scheduled maintenance and the only materials used
are copper and steel for the active components and aluminum for the housing. These materials
are readily available everywhere and are not controlled by any country or political group.
In addition to the performance, Aura’s rotor lends itself to mass manufacturing. Many
of Aura’s axial flux induction machines have been operating for twenty years and have
shown remarkable reliability. |
| 5 |
Emerging Electric Motor Technologies for the EV Market
September 28, 2021 Luke Gear Electric motors |
After a lengthy development
period, the Company first began commercializing the AuraGen® in late 1999 and early 2000. In 2001, the first commercial
AuraGen® product was a 4-pole machine which, when combined with our proprietary and patented Electronic Control Unit (“ECU”),
generated 5 kW of exportable 120/240 VAC power. We subsequently added a 6-pole configuration and introduced our patented bi-directional
power supply that provided for 8.5 kW watts of exportable power with the capability of providing both alternating (“AC”)
and direct (“DC”) power simultaneously. In Fiscal 2008, the Company introduced an AuraGen® system that generated
up to 17 kW of continuous power by combining two 8.5 kW systems on a single shaft. Starting in July 2019, we began to redesign and upgrade
the ECU and develop new axial flux generator configurations. As a result of such efforts, our redesigned ECU allows us to replace the
old 5 kW solution with a 6.5 kW solution using the same 4-pole generator as well as to upgrade the output of the 6-pole machine from
8.5 kW to 12 kW.
Our more recent efforts have
resulted in our new 10 kW mobile power generator that which is approximately 20% smaller in diameter and 10% smaller in axial length than
the legacy 8.5 kW solution and we have completed the design and are now in the process of fabrication of a 250-kW axial flux motor which
has approximately the same dimensions as our legacy 8.5 kW mobile power solution. This new 250 kW motor has a base speed of 5,000 rpm
and an operating range of up to 20,000 rpm.
In March 2019, stockholders
of the Company represented a majority of the outstanding shares of the Company’s common stock delivered signed written consents
to the Company removing Ronald Buschur, William Anderson and Si Ryong Yu as members of the Company’s Board and electing Ms. Cipora
Lavut, Mr. David Mann, and Dr. Robert Lempert as directors of the Company in their stead. Because of Aura’s refusal to recognize
the legal effectiveness of the consents, in April 2019 the stockholders filed suit in the Court of Chancery of the State of Delaware
pursuant to Section 225 of the Delaware General Corporations Law, seeking an order confirming the validity of the consents. On July
8, 2019 the Court of Chancery entered final judgment in favor of the stockholder plaintiffs, confirming that (a) Ronald Buschur, Si Ryong
Yu and William Anderson had been validly removed by the holders of a majority of the Company’s outstanding stock acting by written
consent (b) Ms. Lavut, Mr. Mann and Dr. Lempert had been validly elected by the holders of a majority of the Company’s outstanding
stock acting by written consent, and (c) the Company’s Board of Directors validly consists of Cipora Lavut, David Mann, Robert
Lempert, Gary Douglas and Salvador Diaz-Versón, Jr. See Item 3, Legal Proceedings for more information. Following this ruling
by the Court of Chancery, the newly confirmed Board of Directors terminated the employment of Melvin Gagerman, who had served as CEO
and CFO of the Company since 2006, and installed Ms. Lavut as President, Mr. Mann as Chief Financial Officer and Dr. Lempert as Secretary
of the Company.
Impact of the COVID-19 Pandemic
As a result of the COVID-19
pandemic, we have experienced varying degrees of business disruptions and periods of closure of our corporate facilities as have our
customers, suppliers, and vendors, resulting in significant adverse impacts to our operating results. Resurgences in certain parts of
the world resulted in further business disruptions periodically throughout Fiscal 2023, Fiscal 2022 and Fiscal 2021. Such disruptions
have continued into Fiscal 2024, impacting our business.
Business Arrangements.
During Fiscal 2018 and Fiscal
2019, the Company’s engineering, manufacturing, sales, and marketing activities were reduced while we focused on renegotiating numerous
financial obligations. During this time, the Company’s agreements with numerous customers, third party vendors, and organizations
and entities material to the operation of the Company business were canceled, delayed or terminated. During Fiscal 2018, the Company successfully
restructured in excess of $30 million of debt. Also, during Fiscal 2018, the Company signed a joint venture agreement with a Chinese company
to build, service and distribute AuraGen® mobile power products in China. Under the Jiangsu Shengfeng joint venture agreement,
the Chinese partner owns 51% of the joint venture and the Company owns 49%. The Chinese partner contributed a total of approximately $9.75
million to the venture principally in the form of facilities, equipment, and approximately $500 of working capital while the Company contributed
$250 in cash as well as a limited license. The limited license sold to the joint venture, however, does not permit the venture to manufacture
the AuraGen® rotor; rather, the joint venture is required to purchase all rotor subassemblies as well as certain software
elements directly from the Company. During Fiscal 2018, Jiangsu Shengfeng placed a $1,000 order with the Company including a $700 advance
payment of which the Company has failed to deliver product in accordance with the order received. On November 20, 2019, the Company reached
a preliminary agreement with Jiangsu Shengfeng regarding the return of $700 previously advanced to the Company. The preliminary agreement
reached consists of a non-interest-bearing promissory note and a payment plan pursuant to which the $700 was to be paid over an 11-month
period beginning March 15, 2020, through February 15, 2021. The preliminary agreement was subject to the JV continuous operation. However,
starting in January 2020 the JV was shut down by the Chinese authority due to the COVID-19 virus. In 2023, the JV was dissolved and liquidated.
As of February 29, 2024, the
unpaid balance of $700 was reported as part of notes payables – related party in the accompanying financial statements. During Fiscal
2020, the Company recorded an impairment expense of $250 to fully write-off the Jiangsu Shengfeng investment due to the uncertainty of
the operation. In 2023 the JV was dissolved and liquidated.
In Fiscal 2020 stockholders
of the Company successfully removed Ronald Buschur, William Anderson and Si Ryong Yu from the Company’s Board of Directors and
elected Ms. Cipora Lavut, Mr. David Mann and Dr. Robert Lempert as directors of the Company in their stead. See Item 3, Legal Proceedings
for more information. Also, in Fiscal 2020, Melvin Gagerman, Aura’s CEO and CFO since 2006, was replaced. In July 2019 Ms. Lavut
succeeded Mr. Gagerman as President and Mr. Mann succeeded Mr. Gagerman as CFO. Dr. Lempert was appointed as Secretary of the Company
by the Board of Directors also in July 2019.
Recent Developments.
As a result of the COVID-19
pandemic, we have experienced varying degrees of business disruptions and periods of closure of our corporate facilities as have our
customers, suppliers, and vendors, resulting in significant adverse impacts to our operating results. Resurgences in certain parts of
the world resulted in further business disruptions periodically throughout Fiscal 2023, Fiscal 2022 and Fiscal 2021. Such disruptions
have continued into Fiscal 2024, impacting our business.
The AuraGen®/VIPER Product Overview:
Markets Served by the AuraGen®/VIPER
Induction Motor Applications
Aura’s axial flux induction
machine can be used as either an electric motor or generator as described above. Due to the inherit advantages of Aura’s axial
flux induction machine, such as (i) no rare earth or any other kind of permanent magnets, (ii) significantly less copper (60% less) than
equivalent traditional induction motors (iii) higher energy density and (iv) fewer overall materials, we believe Aura’s axial flux
induction motor can be used across a wide range of industries and applications. Because even a small percent increase in motor efficiency
translates to a market-wide savings of tens of billions of dollars per year and because Aura’s axial flux motor design is more
efficient than equivalent radial flux induction motors, we believe that with the proper financial resources, over time, we can capture
a reasonable share of the global electric motor market.
Electric motor are the main
users of electricity, accounting for approximately 53% of the global demand for electricity. Over 65% of the energy used to support electric
motors is used for industrial motor systems.6 The industrial electric motor market is expected to grow from
an estimated USD 113.3 billion in 2020 to USD 169.1 billion by 2026, at a CAGR of 6.9% during the forecast period.72.
The increase in global electricity consumption, and the use of electrical equipment and machines in different industries and the renewables
sector are major factors driving growth in the electric motor market during the forecast period.
Electric motors are employed
in infrastructure, major structures, and industries all around the world. Each year, approximal 30 million motors are sold for industrial
use alone.8 Electric motors find application in a variety of equipment throughout industry. Common industrial applications include:
(i) compressors, (ii) fans and blowers, (iii) heavy duty equipment, (iv) HVAC systems, (v) pumps and (vi) machine tools (laths and mills
etc.) Electric motors and generators are one of the most important tools in modern day life.
Numerous studies show a high
potential for energy efficiency improvement in motor systems. Specifically, system optimization approaches which address the entire motor
system demonstrate high potential for energy savings. For most countries the saving potentials for energy efficiency improvements in
motor systems with best available technology lie between 9 and 13 percent of the national industrial electricity demand.9
Aura’s machines
use approximately 60% less copper, are approximately 1/3 the size and weight and are more efficient than the equivalent traditional radial
flux (“RF”) induction machine.
When compared to radial
and axial flux permanent magnet machines, Aura machines are less expensive to manufacture, do not use any rare earths, do not use any
permanent magnets, are not dependent on supply from China, are more robust, have a higher operating speed range, have lower maintenance,
have a longer lifetime, and are generally smaller, lighter and higher in efficiency.
EV applications
The
universal global trend for electrification has created in addition to the industrial demand for motors also a very large demand for motors
used in electric transportation for vehicles, planes, and boats (“EV”). In such applications, one or more electric motors
are used for propulsion. The power to drive the electric motors is generally a battery system or fuel cell. Both batteries and fuel cells
convert some form of fuel to electricity through some chemical process. EVs include, but are not limited to, road and off-road vehicles,
surface and underwater vessels, electric aircraft, and electric spacecraft.
| 6 |
Identification
of Technoeconomic Opportunities with the Use of Premium Efficiency Motors as Alternative for Developing Countries -Julio R. Gómez
etc. Published: October 16, 2020 |
| 7 |
Markets
& Markets Electric Motor Market Published Date: Nov 2020 | Report Code: EP 3882 |
| 8 |
Precedence
Research October 6, 2021 |
| 9 |
Energy
efficiency in electric motor systems- UN industrial Development Organization Venna 2012 |
It is rather interesting
to note that, while electric motors have been around for more than 200 years, technical information on electric motors in EVs is very
scarce and generally only found in niche technology sites. Most EV literature only notes the motor’s relative quietness, its torque
response, its simplicity, and long-term low maintenance requirements. Most of the space dedicated to the powertrain (motor, motor- controller
and some cases a gear box) is focuses, instead, on the battery—its size and weight, where it sits, the range, how long it takes
to fully charge, etc. Yet, the majority function of the battery system is to support the electric motors and its controller.
In addition to the batteries,
the electric motor and supporting power electronics are critical components of EV drivetrain. It is expected that over 100 million electric
motors will be required per year by 2032 to meet the demand for the growing EV market10 (where would all the rare earths come
from to support 100 million motors per year?).
The global Electric
Vehicle Market size is projected to grow from 4 million units in 2021 to 34.76 million units by 2030.11 The AC motor
(most power by alternating current) is expected to witness the fastest growth in the electric motor market during the forecast period.
The global electric powertrain
market (electric motor, plus motor controller plus a gear box) size is projected to surpass around US$ 200 billion by 2027 and growing
at a CAGR 13.8%. The motor/generator component expected to show lucrative growth over the analysis period attributed to the escalated
penetration of plug-in hybrid battery electric vehicle (“PHEV”) and battery electric vehicle (“BEV”) across the
globe.12
There are several key performance
metrics for electric motors. Power and torque density enables improved driving dynamics in a smaller and lighter package, with weight
and space being at a premium in EVs. Another critical area is efficiency. Improving efficiency means that less energy stored in the battery is
wasted when accelerating the vehicle, resulting in improved range from the same battery capacity. Smaller motor system weight will also
contribute to increase in range since less weight needs to be moved.
Most
electric motors currently used for electric mobility employ high energy permanent magnets.13 The magnetic material is usually
sintered neodymium–iron–boron (NdFeB) made or processed in China. Neodymium is one of the rare earth elements. China has
around a third of all rare earth reserves and around 80% of global production.14 In 1987 the Chinese President Deng Xiaoping
famously said, “the middle East has Oil; China has rare earths”. An Oxford Analytics Expert briefing on July 30, 2020,
states that “(i) Permanent Magnets will account for 3⁄4 of rare earth demand by 2030 up from 1⁄4 in 2020 and (ii)Electric
vehicles and offshore wind will drive demand and be most vulnerable to supply shocks”.
Permanent
magnet (“PM”) machines can be extremely light in weight and highly efficient. In PM machines the magnetic field B is fixed
by the magnets and the only way to change this is with a bucking field. These bucking currents result in increase in temperature that
could affect the magnetization of the permanent magnets.
In PM machines the operating
temperature must be kept at below 100oC because at that temperature the magnets start to lose some of their magnetization
and at 180oC they become completely demagnetized. However, in EV applications at low speed, one needs to use a lot of current
(generating high heat) to get the required torque; similarly, at high speeds one needs a lot of current for the bucking fields to reduce
the B field. Thus, PM machines for electric mobility require a very complex cooling system. All the components in the machine are designed
for maximum specifications but operationally the machine is limited by temperature requirements of the magnets. The cost of such machines
is high due to (i) The permanent magnets, (ii) the complex cooling system and (iii) complex controller.
| 10 |
Emerging Electric Motor Technologies for the EV Market
Sep 28, 2021 Luke Gear |
| 11 |
Market & market Electric Vehicle Market May 2021
Report code AT4907 |
| 12 |
Precedence research June 9, 2021 |
| 13 |
Will rare earth be eliminated in EV motor-Dr. James
Edmondson Nov 2-2020 |
| 14 |
Vikendi December 29, 2021 |
In addition to the cost issues,
the permanent magnets are subject to the economic and political control of China. There is always the possible situation that China
economically weaponizes rare earth and stops sending the refined product to the U.S so they cannot be used in weapon systems or commercial
applications such as electric vehicles.15 In the past during political disputes China threatened to cease export of
rare earths.16
As to environmental, rare-earth
magnets used in EV applications are responsible for major environmental pollution. The extraction of rare earths “produce mountains
of toxic waste, with high risk of environmental and health hazards. For every ton of rare earth produced, the mining process yields 13-kg
of dust, 9,600-12,000 cubic meters of waste gas, 75 cubic meters of wastewater, and one ton of radioactive residue. This stems from the
fact that rare earth element ores have metals that, when mixed with leaching pond chemicals, contaminate air,
water, and soil. Most worrying is that rare earth ores are often laced with radioactive thorium and uranium,
which result in especially detrimental health effects. Overall, for every ton of rare earth, 2,000 tons of toxic waste are
produced.”17
Unlike the PM machines,
Aura’s axial flux induction machines do not use any permanent magnets and therefore the controller can change the B fields since
B is proportionate to the voltage divided by the frequency (V/f). Thus, the Aura machine, when operated with a smart inverter, has an
advantage over a PM machine. The Aura machine has a smaller volume, equal or better efficiency, more reliable and a large cost advantage.
This advantage becomes increasingly important as performance is increased.
Mobile and Remote Power Applications
The global generator sales
market was $20.3 billion in 2019 and is estimated to reach $27.16 billion by 2027 (Fortune Business Insight). Most industries dealing
with construction and infrastructure rely on mobile generators to support modern computers, digital sensors and instruments as well as
electrical driven tools. Current automotive alternators cannot supply the existing demanded power for many such applications and thus
the common solution is the use of stand-alone gensets (often referred to a “Auxiliary Power Units” or simply “APUs”).
These APUs, however, (i) consume large amounts of fuel, (ii) are heavy and bulky and accordingly must often be towed on trailers, and
(iii) require constant maintenance. Additionally, traditional APUs are generally not considered to be environmentally friendly power
solutions based on their high fuel consumption, loud operating noise levels, and the emissions they secrete into the air. In comparison,
the AuraGen® system is small and light enough to generally be integrated directly into existing vehicles, does not require
maintenance, nor do they require any set-up or tear-down time. In addition, there is no heavy lifting required and to contact with hot
surfaces. The AuraGen® operation when integrated in a vehicle or a boat is completely seamless and transparent to the
user.
Likewise, for law enforcement,
emergency responders and militaries alike, mobile power is generally a necessity. Indeed, one of the fastest growing segments for mobile
power is the military marketplace for On-Board-Exportable-Power (OBEP), which is electric power on vehicles that can be used to support
non-vehicle functions such as weapon systems and C4I functions (command, control, communication, computers and information).
Currently, most on-board power is provided by APUs. Given the drawbacks of APUs, however, militaries, law enforcement and first responders
all over the world are seeking more efficient integrated power solutions for their vehicles.
In addition, numerous leisure
users are increasingly demanding mobile power for use of air-conditioning, appliances and other amenities.
| 15 |
China Maintains Dominance in Rare Earth Production-National
defense 9/8/21 by Stew Magnuson |
| 16 |
Supercomputers Predict rare earth Market Vulnerability-National
defense 9/9/21 by Stew Magnuson |
| 17 |
Not so “green” technology: the complicated
legacy of rare earth mining 12. Aug. 2021 Harvard International Review |
Beside stand-alone gensets
(often referred to “auxiliary power units” or simply “APU” s), all automotive users rely on integrated alternators
in their vehicles for such things as navigation systems, electric seating, electric windows, sound/ phone systems and lights. In 2019
alone, 87.9 million passenger vehicles were sold globally18 (each one used an alternator). The market for automotive alternators
is presently dominated mainly by four companies: Denso, Valeo, Mitsubishi Electric, and Hitachi Automotive. These companies jointly control
nearly 80% of the global market. The compact size and significant increase in efficiency of the AuraGen® provides
an ideal replacement (fit and form) for high output automotive alternators while offering higher efficiency, longer lifetime and the
flexibility of multi types of voltage both AC and DC. Recently, the Company completed the design and development for a 10-kW alternator
with a diameter of 10 inches and axial length of less than 6 inches. The new 10 kW alternator will provide the full 10 kW power at alternator
speeds of 2,500-13,000 rpm with efficiency higher than 90%.
The AuraGen®
solution increase in efficiency over traditional generators, when combined with our load following architecture and the ability to provide
both AC and VDC simultaneously.
Competition
The Company is involved in
the application of its AuraGen® technology to electric motors and mobile power. Therefore, it faces substantial competition
from companies offering different technologies.
Electric Motors
There are four (4) basic
approaches for electrical machines: (i) the rotor can be electrically excited such that it creates a magnetic field with constant orientation
(as in synchronous machines) that usually uses brushes and or commutators; (ii) the shape of the rotor can induce reluctance variations
in the stator (as in switched reluctance machines); (iii) the rotor can be permanently magnetized with permanent magnets (“PM “)
as in brushless DC machines; and (iv) the rotor field can be induced from the stator due to the rotor’s structure as in induction
machines. Our axial flux technology is an induction machine.
Brushed
machines are machines in which the rotor coil is supplied with current through brushes. Unlike commutators, brushes only
transfer electric current to a moving rotor; commutators also provide switching of the current direction. Large, brushed machines which
are run with DC to the stator windings at synchronous speed are the most common generator in power plants because they also supply reactive
power to the grid. They can be started by the turbine and can generate power at constant speed without a controller. This type of
machine is often referred to in the literature as a “synchronous machine”.
Reluctance
machines have no windings in the rotor, only a ferromagnetic material shaped so that “electromagnets” in the
stator can “grab” the teeth in the rotor resulting in a slight movement. The electromagnets are then turned off, while another
set of electromagnets is turned on to move the stator further. Reluctance machines are also sometimes referred to as “step motors”
as a result of the step-like movement. These machines are suited for low speed and accurate position control. Reluctance machines can
be supplied with PMs in the stator to improve performance. The “electromagnet” is then “turned off” by sending
a negative current to the coil. When the current is positive the magnet and the current cooperate to create a stronger magnetic field,
which will improve the reluctance machine’s maximum torque without increasing the current’s maximum absolute value.
PM
machines have permanent magnets in the rotor which set up a magnetic field. The magnetic field is created by modern PMs
(Neodymium Iron Boron magnets “NeFeB”), which means that PM machines have a higher torque/volume and torque/weight ratio
than machines with rotor coils under continuous operation.
In
general, it is usually possible to overload electric machines for a short time until the current in the coils heats parts of the machine
to a temperature which causes damage. However, PM machines are very sensitive to such overloads because too high of a current in the
coils can create a magnetic field strong enough to demagnetize the magnets. The majority (80%) of NeFeB magnets are produced in China.
Magnax and many other are examples of Companies using such an approach.
| 18 |
Motor Intelligence. Automotive alternator market growth
trends forecast 2021-2026 |
AC induction machine (no PM) is
the most common electrical machine in use today. A changing magnetic field in the stator induces a current in the rotor. The current
in the rotor produces its own magnetic field, which then interacts with the magnetic field of the stator, causing the rotor to turn. The
name induction comes from the fact that current is induced in the rotor by the changing magnetic field of the stator. Radial flux
induction machines have been the workhorse of industry due to their robustness, attractive cost, and ease of control; however, they are
relatively, heavy and bulky. On the other hand, Aura’s axial flux (“AF”) induction machines, have all of the advantages
of the radial flux machines but with the advantage of higher energy density and higher efficiency resulting in a smaller and lighter
machine with equivalent or better performance. Unlike the PM machines, induction machines do not use any permanent magnets and therefore
the controller can change the B fields since B is proportionate to the voltage divided by the frequency (V/f).
Although our axial flux induction
technology provides significant advantages in both cost (significant less copper, steel and aluminum), size/weight and performance, most
of our competitors have far greater financial, technical, and marketing resources than we have. They have larger budgets for research,
new product development and marketing, and have long-standing customer relationships.
Key players in the market
are (i) Nidec Motor Corporation, (ii) ABB Ltd., (iii) Siemens AG, (iv) WEG Electric Corp, (v) Regal Beloit Corporation, (vi) Wolong,
and (vii) Teco Westinghouse.
Generators
There are five basic approaches
used in mobile generators.
Gensets AKA APU.
Portable generators meet the large market need for auxiliary power. Millions of units per year are sold in North America alone,
and millions more are sold across the world to meet market demands for 1 to 20 Kilowatts of portable power. The market for these power
levels addresses the commercial, leisure and residential markets, and is essentially divided into: (a) higher power, higher quality and
higher price commercial level units; and (b) lower power, lower quality and lower price level units. Gensets provide the strongest competition
across the widest marketplace for auxiliary power. Onan, Honda, Generac and Kohler, among others, are well established and respected
brand names in the genset market for higher reliability auxiliary power generation. There are over 40 registered genset-manufacturing
companies in the United States.
Some of the key suppliers
are Caterpillar (US), Cummins (US), Rolls-Royce Holdings (UK), Atlas Copco (Sweden), Mitsubishi Heavy Industries, Ltd. (Japan), Yanmar
(Japan), Generac (US), ABB (Switzerland), Siemens Energy (Germany), Weichai Group (China), Kohler Co. (US), Kirloskar Oil Engines Ltd.
(India), Denyo (Japan), and Sterling & Wilson (India),
High Output Alternators.
There are many High Output Alternator manufacturers. Some of the better-known ones are Delco-Remy, Bosh, Nippon Densu, Hitachi, Mitsubishi
and Prestolite. All alternators provide their rated power at very high RPM and significantly less power at lower RPM. In addition, alternators
are generally only 30% efficient at the low RPM range and increase to 50% efficiency at the high RPM range.
Inverters.
There are many inverter manufacturers across the globe;
the best known one is Xentrex. The pricing of industrial grade sine wave inverters is approximately $400 per kilowatt plus the cost of
a high output alternator (estimated at $1,000) and a good throttle controller (estimated in the range of $250-500).
Permanent-Magnet
Alternators. A number of companies have introduced alternators using exotic rare earth Neodymium (NdFeB) magnets. These
alternators tend to have higher power generation capabilities than regular alternators at lower RPM. Unfortunately, PM machines with
NdFeB magnets are very sensitive to temperature and, unlike the AuraGen®, cannot survive the typical under-the-hood environment
(200oF+). In order to apply such devices for automotive applications one must add an active cooling system to keep the magnets
from demagnetizing at approximately 200oF. In addition, most of the rare earth magnets (NeFeB) are manufactured in China and
are subject to potential political and economic pressure.
In addition to the temperature
challenges of such machines, there are other issues involving active control of the magnetic field. The main disadvantage of PM generators
is the difficulty of output voltage regulation to compensate for speed and load variation due to the lack of a simple means of field
control.
Fuel Cells.
Fuel cells are solid-state devices that produce electricity by combining a fuel containing hydrogen with oxygen. They have a wide
range of applications and can be used in place of the internal combustion engine and traditional lead-acid and lithium-ion batteries.
These systems are generally more expensive. The most widely deployed fuel cells are estimated to cost significantly more per kilowatt
than alternative solutions.
Others
Evans Electric in Australia
has introduced an axial flux machine with a complete conductive rotor. Such a machine was first introduced by Brinner more than 20 years
ago and was abandoned because the rotor lacked the required rigidity to withstand the magnetic and centrifugal forces. The Brinner machine
is cited in Aura’s issued patents.
Numerous companies are introducing
axial flux machines; however, they generally use rare earth NeFeB magnets (made in China) and are thus not induction machines but rather
permanent magnet machines. Some of the better-known companies are YASA, EVO, Magnax and Phi Power.
Most of our competitors have
far greater financial, technical, and marketing resources than we have. They have larger budgets for research, new product development
and marketing, and have long-standing customer relationships. We also compete with many larger and more established companies in the
hiring and retention of qualified personnel. Our financial condition has limited our ability to market the AuraGen®.
The AuraGen®
uses a different technology and because our product is radically different from traditionally available mobile power solutions, users
may require lengthy evaluation periods to gain confidence in the product. OEMs and large fleet users also typically require considerable
time to make changes to their planning and production.
Competitive Advantages of the AuraGen® Axial Flux
Induction technology
As a motor-Aura’s
Axial Flux (“AF”) induction motor/generator is increasingly attracting attention from high impact potential users seeking
advantages over conventional motors, particularly for Electric Vehicle applications. These advantages include (i) compact construction,
(ii) better power to weight ratio, (iii) shorter axial length, (iv) better efficiency, (v) better torque to volume and weight ratio,
(vi) very high utilization of active materials (less than 60% of the copper) and (vii) excellent ventilation and cooling. Induction machines
(i) do not use any rare earth elements and have no permanent magnets. Due to their flat shape, lower weight and compact construction,
Aura’s axial flux motors are ideal for pumps, fans, food processors, HVHC, etc. An axial flux machine is also preferred in applications
where the rotor can be integrated with the rotating part of mechanical loads.
The AuraGen®
motor’s operational range is between -40 and 340-degrees F; therefore, it is suitable to operate in a harsh environment.
As an alternator.
Aura’s induction machine provides significant advantages in power generation, particularly in mobile applications. Its smaller
volume and higher efficiency, when combined with the geometric shape means it can be integrated with existing vehicles and boats. Such
integrated solutions do not require set up time. There are no heavy weights to lift (gensets), usable cargo space is optimized and there
is no need for separate fuel/containers. Remarkably, there is no scheduled maintenance required.
The AuraGen®
alternator’s operational range is between -40- and 340-degrees F; therefore, it is suitable for operating under the hood of a vehicle
where the ambient temperature can easily be above 200 degrees F.
Earth-Forward, Green
Technology. The AuraGen® system is significantly more environmentally friendly than traditional motors and
generators. Because of its extreme efficiency and smaller size, the AuraGen® system utilizes fewer resources and materials
to manufacture (in particular less than 60% of the copper). When used in power generation, the AuraGen® uses a vehicle’s
primary automotive engine, which is already highly regulated for environmental protection. Traditional mobile power solutions, in comparison,
use small, less efficient, auxiliary engines that produce significantly higher levels of emissions per unit of power output than the
automobile engine.
Durability; No Scheduled
Maintenance. The AuraGen® motor/generator solution does not require any scheduled maintenance. The historical
failure rate for Aura’s machines over a 20-year period is less than 0.5%. The bearings are rated for 28,000 hours.
Aura’s axial flux induction
(no PM) can be summarized as:
| ● | Disruptive
since it addresses the entire field of electrical motors and generators by providing a solution
that is smaller, lighter, more efficient, cost less to manufacture and does not use
any permanent magnets. |
| ● | Aura
has demonstrated mass production of this technology with more than 11,000 machines. |
| ● | The
economic value proposition is well defined in terms of cost, performance and size. |
| ● | The
Aura solution provides significant global reduction in the use of raw materials such
as copper, steel, and aluminum. |
| ● | The
higher efficiency of Aura’s motor, when used in a manufacturing environment, can lead
to a noticeable reduction in the global consumption of energy. |
| ● | When
used for mobile power generation, Aura’s technology leads to a significant reduction
in global pollution by being able to reduce and, in many situations, eliminate completely
small diesel and gasoline engines used in power generation. |
| ● | When
used for electric vehicles, the smaller size, weight, and increased efficiency could lead
to an increase in range and/or reduced battery weight. |
| ● | When
used in remote stand-alone diesel power generation such as cell towers, Aura’s increased
efficiency, lower rotor inertia, voltages flexibility and load-following architecture results
in a significant reduction in fuel usage (and, of course, reduced pollution). |
| ● | Aura’s
significantly (65% less) lower rotor inertia and variable speed capabilities make Aura’s
solution ideal for small hydro applications that are currently being ignored because of construction
cost, low head, and slow flow situations. |
Targeted Market
The Company is re-examining
and identifying new key markets to focus on as the Company expands operations.
The global drive for electrification
is in search of better, more effective electric motors. The recent realization by many potential users of such motors that permanent magnet
motors are depending on NeFeB rare earth magnets from China has created a need for alternative to the PM motors. Our axial flux induction
machine is a solution that does not use any magnets and has the required performance characteristic as well as fit and form for numerous
applications.
Electric motors
Electric motors
for industrial applications. We have completed the design of 4 kW and 10 kW machines. The designs show significantly increased
efficiency as compared to equivalent other designs, and in addition they are a fraction of the size and weight, use approximately 50-60%
less copper and cost less to manufacture.
Electric motors for
high end electric cars. We are exploring the use of our axial flux induction machine to be integrated into high end electric cars.
This application would require approximately 250-300-kW machine that will use 800VDC buss system and will operate at up to 20,000 RPM.
We now have a completed design for an axial flux induction (no PM) design with energy density of more than 50 kW per liter (the best other
known design is approximately 40 kW/liter using rare earth permanent magnets) and efficiency of more than 95%. Our design has an active
diameter of approximately 9.45 inches and active axial length of approximately 4.92 inches.
Mobile power generation
Military market.
One focused market for the Company’s VIPER solution is military applications. The global military land vehicles market is expected
to grow by 29% through 2022, increasing to $30.33 billion by 2022.19 While traditional markets for military vehicles such
as the U.S. are choosing to upgrade and maintain existing fleets rather than replace aging vehicles, other regions are looking to purchase
new units, which also provides maintenance and upgrade opportunities. The active number of military vehicles was estimated at over 408,000
in 2012 and is expected to increase to slightly over 418,000 by 2021. New vehicle procurement is expected to decline in western defense
and increase in emerging markets of APAC and the Middle East.
Automotive alternators.
In 2019, 87.9 million units of passenger cars were sold globally,20 each one used an alternator. The market for automotive
alternators is dominated mainly by four companies: Denso, Valeo, Mitsubishi Electric, and Hitachi Automotive. These companies jointly
control nearly 80% of the global market. The compact size and significant increase in efficiency of the AuraGen® provides
an ideal replacement (fit and form) for high output automotive alternators.
Diesel based
cell towers. According to Statista (Technology and telecommunication Thomas Alsop sept 22, 2020), in 2019, there were
395,562 mobile wireless cell sites in the United States, with a large amount of investment going toward 5G-ready cell sites and antennas
as per the source. Phil Marshall, chief research officer at Tolaga Research, estimates the global number of base stations at 6.5 million
sites, while Chinese equipment vendor Huawei puts the number at 7 million. Many of the cell sites are powered by diesel generators. The
AuraGen® solution increase in efficiency over traditional generators, when combined with our load following architecture
and the ability to provide both AC and -48VDC simultaneously makes our solution very attractive to cell towers operators that depend
on diesel power. Our solution has the potential for significant diesel fuel savings in such an application.
Transport Refrigeration
(“TRU”). The main competitors for the all-electric TRU are traditional diesel-based solutions provided by
Thermo-king and Carrier. The diesel based comparable systems provided by Thermo-king and Carrier are somewhat less expensive than our
AuraGen® all-electric solution, however the diesel solutions require frequent maintenance and the utilization of a separate
diesel engine that consumes additional fuel every operating hour. In addition, the diesel solution emits harmful emissions that have
been recognized by the U.S. Environmental Protection Agency, California’s Air Resource Board and others as dangerous pollutants
and are increasingly subject to federal and state regulations. A CARB 2015 report “Technology Assessment Transport refrigeration”
cites and provides an analysis of our solution that can be applied for significant pollution reduction and fuel savings for truck-based
transport refrigeration.
| 19 |
John Keller July 10, 2014, Military and Aerospace Electronics |
| 20 |
Motor Intelligence. Automotive alternator market growth
trends forecast 2021-2026 |
Facilities, Manufacturing Process and Suppliers
During Fiscal 2024 and Fiscal
2023, the Company occupied approximately 18,000 square feet of space in Lake Forest, California. In early Fiscal 2022 the Company consolidated
all its administrative offices and operations into this new modern stand-alone facility. The Lake Forest facility is subject to a lease
agreement with a 66-month lease period effective from February 2021, through August 31, 2026. The monthly base lease rate for the Lake
Forest Facility is currently $24,239 per month with a 3% annual escalation. We expect to expand operations next year that will require
additional space.
As the Company continues
to expand operations, we will need to renew relationships and contracts with our suppliers or locate suitable new suppliers for subassemblies
and other components.
Research and Development
We believe that ongoing research and development is important to the
success of our product in order to utilize the most recent technology, develop additional products and additional uses for existing products,
stay current with changes in vehicle manufacture and design and to maintain an advantage over potential competition. Our engineering,
research and development costs for Fiscal 2024 was approximately $0.8 million compared to approximately $0.9 million in Fiscal 2023. In
Fiscal 2024 we have completed the design for (i) 4 kW motor for water pump applications, (ii) a new optimized 10 kW mobile power solution
smaller and higher efficiency of the older design, and (iii) a 250-kW motor solution for EV applications. In addition, during fiscal 2024
we made significant engineering progress in the design of novel innovative active cooling solutions for very high energy density motors
and generators. We expect to finalize this innovation during the second quarter of 2024.
Patents and Intellectual Property
Our intellectual property
portfolio consists of trademarks, proprietary know-how, trade secrets, and patents. Historically the Company obtained over 70 patents
in electromagnetic and electrooptical technologies.
The basic philosophy followed
by Aura is to build layers of defense to protect the Company’s IP. This is achieved through the development of fundamental patents
and surrounds them with application patents. The detailed fabrication of the rotor is kept as a trade secret since this is a critical
component in Aura’s proprietary intellectual assets.
The challenges of implementing
a patent philosophy are based on cost. Patent maintenance costs are expensive, particularly international patents. In order to maximize
a limited budget, our approach is to first file a number of new US patents. This will provide a year before international patents need
to be filed.
Current active patents are
(i) Patent 8720618 Issued date 5/3/2014, (ii) Patent 6700214 Issued date 3/2/2004, and (iii) Patent 6700802 Issued date 3/2/2004.
We expect over the next 12
months to file new technology patent applications covering:
| 1. | Topology
(several patents) |
Using different number of stators (one
or more) and rotors (one or more) to reach wide range of speed and torque. Also, utilization of optimal topology makes capability to
achieve high power/torque density which is a key component for the electric vehicle (EV) and electric airplane (EA) industries.
Using new laminations, the hysteresis
and eddy current losses decrease. So, a capability is made to increase the efficiency of these machines as the most important parameter
for electric machines evaluation. Moreover, these laminations deliver higher saturation profile to reach high torque density which
is very important for the EV and EA industries.
| 3. | Winding
(several patents) |
New winding patterns can be made to
increase current density for increasing the torque density and the power density.
| 4. | Cooling
system (several patents) |
Development of novel cooling systems
which make better heat dissipation is used to reach highest torque and power density.
| 5. | Vibration
and noise (several patents) |
Implementation of new methods for vibration
and noise reduction is the key component for electric machines which are used in home appliances, EV and EA.
Using newly developed alloys help to
decrease losses, increase efficiency, magnify torque, and power density. The alloy steel used in the stator cores, alloy casting used
for rotor and alloy aluminum used for enclosure have essential influences on the machine performance.
| 7. | Advanced
Automotive alternator |
Current air-cooled automotive alternators
are power limited to around 1.5 kW. A new design using Aura’s axial flux induction will increase the power to 3.5-5 kW at the same
size as current automotive alternators at a lower reduced cost.
| 8. | Integration
of inverter components with motor (2 in 1 integration) |
Higher integration will lead to better
overall efficiency and smaller packaging.
In addition, we also plan
to file specific motor application patents for (i) Drone usage, (ii) Pump usage, (iii) Compressors, (iv) Fans and Blower usage, (v) Machine
tools usage, (vi) Specific 2-and 4-wheel EV usage and (vii) Airplane/air taxi applications.
For mobile power applications
we plan to file a number of patent applications for (i) military usage, (ii) Hybrid APU, (iii) diesel power Cell tower usage, (iv)water
treatment plants and (v) marine usage.
Government Regulation
We are subject to laws and
regulations that affect the Company’s activities, which include, but are not limited to, the areas of labor, intellectual property
and ownership and infringement, tax, import and export requirements, environmental, and health and safety. As we recommence operations,
our operations will again be subject to federal, state and local laws and regulations governing the occupational health and safety of
our employees and wage regulations. For example, we are subject to the requirements of the federal Occupational Safety and Health Act,
as amended, or OSHA, and comparable state laws that protect and regulate employee health and safety. We expect to expend resources to
maintain compliance with OSHA requirements and industry best practices.
Employees
As of the date of this filing,
the Company has a total of eleven (11) full-time employees in research and development, sales, operations and administration. Additionally,
the Company engages independent contractors, on an as-needed basis, to support various areas of the business. During Fiscal 2024 and
Fiscal 2023 we engaged two independent contractors to support engineering developments.
Significant Customers
In Fiscal 2024, one significant
customer, CBOL, accounted for 55% of revenues. In Fiscal 2023, one significant customer, CBOL, accounted for 55% of revenues, however
no customer is considered significant.
Raw Materials
The most important raw materials
we use in manufacturing our products are steel, copper, and aluminum. Raw materials are purchased both domestically and outside the United
States. We have no significant long-term supply contracts. When possible, we maintain a number of sources for our raw materials, which
we believe contribute to our ability to obtain competitive pricing. The cost of some of our raw materials and shipping costs are dependent
on petroleum cost. Higher material prices, cost of petroleum, and costs of sourced products could have an adverse effect on margins.
We enter into standard purchase
agreements with certain foreign and domestic suppliers to source selected products. The terms of these arrangements are customary for
the industry and do not contain any long-term contractual obligations on our behalf.
Available Information
We file annual, quarterly
and current reports and other information with the Securities and Exchange Commission (the “SEC” or the “Commission”).
These materials can be inspected and copied at the SEC’s Public Reference Room at 100 F Street, N.E., Washington, D.C. 20549. Copies
of these materials may also be obtained by mail at prescribed rates from the SEC’s Public Reference Room at the above address.
Information about the Public Reference Room can be obtained by calling the SEC at 1-800-SEC-0330. The SEC also maintains a website at
www.sec.gov that contains reports, proxy and information statements, and other information regarding issuers that file electronically
with the SEC.
On our website, www.aurasystems.com,
we provide free of charge our Annual Report on Form 10-K, Quarterly Reports on Form 10-Q, Current Reports on Form 8-K, and any amendments
thereto, as soon as reasonably practicable after they have been electronically filed or furnished to the SEC. Information contained on
our website is not part of this Annual Report on Form 10-K or our other filings with the SEC.
ITEM 1A. Risk Factors
We have been a party to litigation, a consent
solicitation and a proxy contest with shareholders controlling a majority of the Company’s stock, which is costly and time-consuming
and has had a material adverse effect on our business, results of operations and financial condition and could adversely affect our stock
price.
In March 2019, stockholders
of the Company representing a majority of the outstanding shares of the Company’s common stock delivered signed written consents
to the Company removing Ronald Buschur, William Anderson and Si Ryong Yu as members of the Company’s Board and electing Ms. Cipora
Lavut, Mr. David Mann and Dr. Robert Lempert as directors of the Company. Because of Aura’s refusal to recognize the legal effectiveness
of the consents, on April 8, 2019, the stockholders filed suit in the Court of Chancery of the State of Delaware pursuant to Section 225
of the Delaware General Corporations Law, seeking an order confirming the validity of the consents. On July 8, 2019 the Court of Chancery
entered final judgment in favor of the stockholder plaintiffs, confirming that (a) Ronald Buschur, Si Ryong Yu and William Anderson had
been validly removed by the holders of a majority of the Company’s outstanding stock acting by written consent (b) Ms. Lavut, Mr.
Mann and Dr. Lempert had been validly elected by the holders of a majority of the Company’s outstanding stock acting by written
consent, and (c) the Company’s Board of Directors validly consists of Cipora Lavut, David Mann, Robert Lempert, Gary Douglas and
Salvador Diaz-Versón, Jr. Aura’s refusal to recognize the legal effectiveness of the consents and the decision by the Company’s
former leadership team to utilize corporate resources to vigorously contest the shareholder action has consumed significant financial
resources, temporarily stagnated operations, and resulted in substantial costs, all of which had a material adverse effect on our business,
operating results and financial condition.
Going Concern
The Company’s financial
statements have been prepared under the assumption that the Company will continue as a going concern. As discussed in Note 1 to the financial
statements, during the year ended February 29, 2024, the Company incurred a net loss of $4.2 million, used cash in operations of $3 million,
and at February 29, 2024, had a stockholders’ deficit of $21.5 million. In addition, at February 29, 2024, notes payable and related
accrued interest with an aggregate balance of $6.7 million have reached maturity and are past due. These factors raise substantial doubt
about the Company’s ability to continue as a going concern within one year of the date that the financial statements are issued.
In addition, the Company’s independent registered public accounting firm, in their report on the Company’s February 29, 2024,
audited financial statements, raised substantial doubt about the Company’s ability to continue as a going concern.
Our ability to continue as
a going concern is dependent upon our ability to increase revenues, obtain additional financing, drive further operating efficiencies,
reduce expenditures, and ultimately, create profitable operations. In the event that the Company does not generate sufficient cash flows
from operations and is unable to obtain funding, the Company will be forced to delay, reduce, or eliminate some or all of its discretionary
spending, which could adversely affect the Company’s business prospects, ability to meet long-term liquidity needs or ability to
continue operations. The Company does not have any sufficient committed sources of capital and does not know whether additional financing
will be available when needed on terms that are acceptable, if at all. This going concern statement from our independent public accounting
firm may discourage some investors from purchasing our stock or providing alternative capital financing. The failure to satisfy our capital
requirements will adversely affect our business, financial condition, results of operations and prospects.
The effects of a pandemic or widespread
outbreak of an illness, such as the COVID-19 pandemic, has had and could continue to have a material adverse impact on our business,
results of operations and financial condition.
While the impact of the COVID-19
pandemic on our business has largely abated, uncertainties continue from the ongoing effects of the pandemic and an economic slowdown.
The effects of government agency actions and the Company’s policies and those of third parties to combat future pandemics may negatively
impact productivity and the Company’s ability to market and sell its products, cause disruptions to its supply chain anon d impair
its ability to execute its business development strategy. These and other disruptions in the Company’s operations and the global
economy could negatively impact the Company’s business, operating results and financial condition.
Additional discussion related
to the various risks and uncertainties described above is included elsewhere within this “Risk Factors” section of our Form
10-K.
We derive a substantial portion of our revenues from customers
in industries susceptible to trends and factors affecting those industries, including the COVID-19 pandemic.
Our axial flux induction
technology is geared toward industrial, commercial and EV motor users, and in addition, our mobile power solution is geared to end-markets
such as commercial vehicles, communications, transportation industries, and consumer and industrial equipment markets. Factors negatively
affecting these industries also negatively affect our business, financial condition and results of operations. Any adverse occurrence,
including industry slowdown, recession, costly or constraining regulations, excessive inflation, prolonged disruptions in one or more
of our customers’ production schedules or labor disturbances, that results in significant decline in the volume of sales in these
industries, or in an overall downturn in the business and operations of our customers in these industries, could materially adversely
affect our business, financial condition and results of operations.
As a result of the COVID-19
pandemic, global vehicle production has decreased, and some manufacturers have completely shut down manufacturing operations in some
countries and regions, including the United States and Europe. As a result, we have experienced, and are likely to continue to experience,
delays in the production and distribution of our products and the loss of sales. If the global economic effects caused by the COVID-19
pandemic continue or increase, overall customer demand may continue to decrease which could have a further adverse effect on our business,
results of operations and financial condition.
We will need additional capital in the
future to meet our obligations and financing may not be available. During Fiscal 2024 and Fiscal 2023, the Company increased its engineering
and manufacturing activities, but it still struggled with meeting its financial requirements. If we cannot obtain additional capital,
we will not be able to continue our operations.
As a result of our operating
losses, we have largely financed our operations through sales of our equity securities. Beginning with Fiscal 2017, the Company significantly
reduced its engineering, manufacturing, sales, and marketing activities to focus on renegotiating numerous financial obligations and conserving
cash. For Fiscal 2024 and Fiscal 2023, we had approximately $3 million negative and $3.1 million negative cash flows from operations,
respectively, due primarily to the impact of the COVID-19 pandemic. The Company’s engineering and manufacturing activities remained
limited due to our inability to increase sales and raise significant amounts of new financing. Our ability to continue as a going concern
is directly dependent upon our ability to obtain additional operating capital and generating sufficient operating cash flow. The
impacts of the COVID-19 pandemic, increased interest rates and inflation have caused significant uncertainty and volatility in the credit
markets and there can be no assurance that lenders or investors will make additional commitments to provide financing to us under current
circumstances. As a result of the impacts of the COVID-19 pandemic, we may be required to raise additional capital and our access to and
cost of financing will depend on, among other things, global economic conditions, conditions in the global financing markets, the availability
of sufficient amounts of financing, and our prospects. If we are unable to obtain additional funding as and when we need it, we will not
be able to recommence operations or undertake our planned expansion.
If we do not receive additional financing
when and as needed, we may not be able to continue the research, development and commercialization of our technology and products. In
that case, our business and results of operations would be materially and adversely affected.
Our capital requirements
have been and will continue to be significant. We will require substantial additional funds in excess of our current financial resources
for research, development and commercialization of products, to obtain and maintain patents and other intellectual property rights in
these technologies and products, and for working capital and other purposes, the timing and amount of which are difficult to ascertain.
When and as we need additional funds, such funds may not be available on commercially reasonable terms or at all. If we cannot obtain
additional funding when and as needed, our business and results of operation would be materially and adversely affected.
Our intellectual property rights are valuable,
and any inability or failure to protect them could reduce the value of our products, services and brand, which would have a material
adverse effect on our business.
Our patents, trademarks,
and all of our other intellectual property rights are important assets for us. There are events that are outside of our control that
pose a threat to our intellectual property rights. For example, effective intellectual property protection may not be available in every
country in which our products and services are distributed or made available. Also, the efforts we have taken to protect our proprietary
rights may not be sufficient or effective. Due to our lack of financial resources, we may not be able to adequately protect our technology
portfolio or apply for new patents to extend our intellectual property portfolio. The expiration of patents in our patent portfolio may
also have an adverse effect on our business. Any significant impairment of our intellectual property rights could harm our business and
or our ability to compete. Protecting our intellectual property rights is costly and time consuming and we may need to resort to litigation
to enforce our patent rights or to determine the scope and validity of third-party intellectual property rights and we may not have the
financial resources to pay for such litigation. Some of our competitors may be able to sustain the costs of complex patent litigation
more effectively than we can because they have substantially greater resources.
We seek to obtain patent
protection for our innovations. It is possible, however, that some of these innovations may not be protectable. In addition, given the
costs of obtaining patent protection, we may choose not to protect certain innovations that later turn out to be important. Furthermore,
there is always the possibility, despite our efforts, that the scope of the protection gained will be insufficient or that an issued
patent may be deemed invalid or unenforceable. Our inability or failure to protect our intellectual property rights could have a material
adverse effect on our business by reducing the value of our products, services and brand.
We occasionally become subject to commercial
disputes that could harm our business by distracting our management from the operation of our business, by increasing our expenses and,
if we do not prevail, by subjecting us to potential monetary damages and other remedies.
From time to time, we are
engaged in disputes regarding our commercial transactions. These disputes could result in monetary damages or other remedies that could
adversely impact our financial position or operations. Even if we prevail in these disputes, they may distract our management from operating
our business and the cost of defending these disputes would reduce our operating results.
We have been named as a party in various
legal proceedings, and we may be named in additional litigation, all of which will require significant management time and attention,
result in significant legal expenses and may result in an unfavorable outcome, which could have a material adverse effect on our business,
operating results and financial condition.
We have been and may in the
future become subject to various legal proceedings and claims that arise in or outside the ordinary course of business. Certain current
lawsuits and pending proceedings are described under Part I, Item 3. “Legal Proceedings.”
The results of these lawsuits
and future legal proceedings cannot be predicted with certainty. Also, our insurance coverage may be insufficient or not provide any
coverage at all for certain claims, our assets may be insufficient to cover any amounts that exceed our insurance coverage, and we may
have to pay damage awards or otherwise may enter into settlement arrangements in connection with such claims. Any such payments or settlement
arrangements in current or future litigation could have a material adverse effect on our business, operating results or financial condition.
Even if the plaintiffs’ claims are not successful, current future litigation could result in substantial costs and significantly
and adversely impact our reputation and divert management’s attention and resources, which could have a material adverse effect
on our business, operating results or financial condition. In addition, such lawsuits may make it more difficult to finance our operations.
We have substantial indebtedness and obligations to pay interest.
We currently have, and will
likely continue to have, a substantial amount of indebtedness and obligations to pay interest from various financing and settlement arrangements.
Our indebtedness and interest obligations could, among other things, make it more difficult for us to satisfy our debt obligations, require
us to use a large portion of our cash flow from operations to repay and service our debt or otherwise create liquidity problems, limit
our flexibility to adjust to market conditions, and place us at a competitive disadvantage. As of February 29, 2024, we had total notes
payable debt outstanding plus accrued interest of approximately $19.3 million, of which $11.9 million was short term. As of February
29, 2024, notes payable with an aggregate balance of $5.3 million and accrued interest of $1.4 million are past due,
In March 2022, the
Company reached a settlement that resolved the various claims asserted against us by former director, Robert Kopple, and his
affiliated entities. In July 2017, Mr. Kopple and his affiliates brought suit against the Company relating to more than $13 million
and the current equivalent of more than approximately 23 million warrants, exercisable for seven years at a price of $0.10 per
share, which Mr. Kopple and his affiliated entities (collectively the “Kopple Parties”) claimed to be owed to them
pursuant to various agreements with the Company entered into between 2013-2016. Under the terms of the settlement, the Company
agreed to pay an aggregate amount of $10 million over a period of seven years, including $3 million initial payment in June 2022.
$150,000 was paid in June 2022, and the balance of the initial payment of $2.85 million was extended to May 29, 2023. In exchange
for the extension, the Company paid extension and forbearance fees of $165,000 in cash and accrued deferred forbearance fees of
$430,000. Beginning January 2023, interest accrues on the unpaid balance at a rate of 6%, compounded annually. All amounts,
including all accrued interest and deferred fees, are to be paid no later than eight years from the date of the initial payment. The
Kopple Parties have also received seven-year warrants to purchase up to an aggregate of approximately 3.3 million shares of our
common stock at a price of $0.85 per share. The settlement also provides for standard mutual general release provisions and includes
customary representations, warranties, and covenants, including certain increases in the amount payable to the Kopple Parties and
the right of such parties to enter judgment against the Company if the Company remains in uncured default in its payment obligations
under the settlement. See Item 3. “Legal Proceedings”, “Liquidity and Capital Resources” in “Item 7.
Management’s Discussion and Analysis of Financial Condition and Results of Operations”, and Footnote 9 “Notes
Payable-Related Parties” in the Notes to Financial Statements included
elsewhere in this Annual Report on Form 10-K for additional information regarding the transactions.
During the year ended February
29, 2024, the note was amended multiple times to extend the payment dates of the balance of the initial payment of $2,850, originally
due in June 2022, and the first installment payment of $1,000, originally due in June 2023 (collectively, the “past due principal”).
As a result of these amendments, the Company incurred additional extension and forbearance fees totaling $450 and adjustment to principal
balance of $23 that was recorded as part of interest expense. As of February 29, 2024, outstanding principal balance amounted to $10,938,
including the $3,850 past due principal (see below).
In March 2024, the Company
and Kopple again amended the note payable. The amendment (i) replaced the requirement to pay the $3,850 past due principal balance with
the requirement to pay $2,000 due December 15, 2024, effectively extending the payment of $1,850 to future periods; (ii) increased the
stated interest rate to 10%; (iii) added a fee of $15 monthly until the Company makes a principal payment of $2 million by December 2024;
(iv) effective August 30, 2024, the Company will grant Kopple a conversion right that gives Kopple the option to be able to convert the
note payable into equity of the Company at a conversion price of the lower of $1.00 per share or 50% of the 10 day volume weighted average
price of the Company’s common stock; (v) during Fiscal 2025, will require the Company to pay 20% of all collected revenues within
10 days of the end of each fiscal quarter; (vi) will require the Company to pay Kopple 20% of any amount raised in new capital in the
form of equity, debt or convertible debt above $3.5 million; (vii) reduces the exercise price of the warrants granted to Kopple in March
2022 from $0.85 per share to $0.50 per share; and (vii) extends the warrant expiration date from March 8, 2029, to March 31, 2031.
The Company will account for this amendment in the first quarter ended March 31, 2024, for fiscal year 2025.
We expect to obtain the money
to pay our expenses and pay the principal and interest on our indebtedness from cash flow from our operations and from securities offerings.
Accordingly, our ability to meet our obligations depends on our future performance and capital-raising activities, which will be affected
by financial, business, economic and other factors, many of which are beyond our control. If our cash flow and capital resources prove
inadequate to allow us to pay the principal and interest on our debt and meet our other obligations, we could face substantial liquidity
problems and might be required to dispose of material assets or operations, restructure or refinance our debt, which we may be unable
to do on acceptable terms and forego attractive business opportunities. In addition, the terms of our existing or future debt agreements
may restrict us from pursuing any of these alternatives.
Our business is not diversified. If we
cannot increase market acceptance of our products, modify our products and services, or compete with new technologies, we may never be
profitable.
We currently focus all of
our resources on the successful commercialization of our axial flux induction motors and AuraGen® mobile power family
of products. Because we have elected to focus our business on a single technology line rather than diversifying into other areas, our
success will be dependent upon the commercial success of these products. If we are unable to increase market acceptance of our products,
if we are unable to modify our products and services on a timely basis so that we lose customers, or if new technologies make our technology
obsolete, we may never be profitable.
Most of our competitors are larger and better financed than
we are and have a greater presence in the marketplace. Our business may be adversely affected by industry competition.
Both in the U.S. and internationally,
the industries in which we operate are extremely competitive. We face substantial competition from companies that have a long history
of offering traditional auxiliary power units (portable generators), traditional automotive alternators, and inverters (a device that
inverts battery direct current electricity to alternating current). Most of our competitors have substantially greater financial resources,
spend considerably larger sums than we spend on research, new product development and marketing, and have long-standing customer relationships.
Furthermore, we must compete with many larger and better-established companies in the hiring and retention of qualified personnel. Although
we believe we have significant technological advantages over our competitors, realizing and maintaining such advantages will require
us to develop customer relationships and will also depend on market acceptance of our products. We may not have the financial resources,
technical expertise, or marketing and support capabilities to compete successfully, which would materially and adversely affect our business.
We may not be able to establish an effective
distribution network or strategic OEM relationships; in which case our sales will not increase as expected and our financial condition
and results of operations would be adversely affected.
We are in the very beginning
stages of developing our distribution network and establishing strategic relationships with original equipment manufacturer (OEM) customers.
We may not be able to identify appropriate distributors or OEM customers on a timely basis. The distributors with which we partner may
not focus adequate resources on selling our products or may otherwise be unsuccessful in selling them. In addition, we cannot assure
you that we will be able to establish OEM relationships on favorable terms or at all. The lack of success of distributors or OEM customers
in marketing our products would adversely affect our financial condition and results of operations.
If we are successful in executing our business
plan to grow our business, our failure to efficiently manage our growth could have an adverse effect on our business.
If we are successful in executing
our business plan, we may experience growth in our business that could place a significant strain on our management and other resources.
Our ability to manage this growth will require us to successfully assimilate new employees, improve existing management information systems
and reorganize our operations. If we fail to manage growth efficiently, our business could be adversely affected.
We may experience delays in product shipments
and increased product costs because we depend on third party manufacturers for certain product components. Delays in product shipment
or an inability to replace certain suppliers could have a material adverse effect on our business and results of operations.
We currently do not have
the capability to manufacture most of the AuraGen® components on a commercial scale. Therefore, we rely extensively on
contracts with third party manufacturers for such components. The use of third-party manufacturers increases the risk of delay of shipments
to our customers and increases the risk of higher costs if our manufacturers are not available when required. Our suppliers and manufacturers
may not supply us with a sufficient number of components or components of adequate quality, which would delay production of our product.
We do not currently have written agreements with any suppliers. Furthermore, those suppliers who make certain components may not be easily
replaced. Any of these disruptions in the supply of components could have a material adverse effect on our business or results of
operations. Furthermore, we are monitoring the impact of the COVID-19 pandemic on the operations of the Company, particularly with respect
to possible delays and other disruptions to the supply chain.
Although we generally aim to use standard parts and components
for our products, some of our components are currently available only from limited sources.
We may experience delays
in production of the AuraGen® if we fail to identify alternate vendors, or if any parts supply is interrupted or reduced
or if there is a significant increase in production costs, each of which could materially adversely and affect our business and operations.
We will need to renew sources of component
supplies to meet increases in demand for the AuraGen®. There is no assurance that our suppliers can or will supply the
components to us on favorable terms or at all.
As we recommence our operations
and in order to meet future demand for AuraGen® systems, we will need to renew contracts or form new contracts with our
prior manufacturers and suppliers or locate other suitable manufacturers and suppliers for subassemblies and other components. Recently,
we entered into discussions with several of our prior suppliers and we are in the process of negotiating settlements of old payables
and arranging new supply contracts. Although we believe that there are a number of potential manufacturers and suppliers of the components,
we cannot guarantee that contracts for components can be obtained on favorable terms or at all. Any material adverse change in terms
of the purchase of these components could increase our cost of goods.
We need to invest in tooling to have a
more extensive line of products. If we cannot expand our tooling, it may not be possible for us to expand our operations.
We are currently limited
in the products that we are able to manufacture because of the limitations of our tooling capabilities. In order to have a broader line
of products that address industrial and commercial needs, we must make a significant investment in additional tooling or pursue new alternatives
to replace traditional tooling. We do not currently have the funds required to acquire new tooling or to obtain replacements and no assurances
can be given that we will have the required funds in the future. If we do not acquire the required funds for tooling or replacement tooling,
we may not be able to expand our product line to meet industrial and commercial needs.
We are subject to government regulation
that may restrict our ability to use certain suppliers outside the U.S. or to sell our products into certain countries. If we cannot
obtain the required approval from government agencies, then our business may be adversely affected.
We depend on third party
suppliers for our parts and components, some of which are located outside of the United States. In the event that some of these suppliers
are barred from selling their products in the United States, or cannot meet other U.S. government regulations, we would need to locate
other suppliers, which could delay or prevent us from shipping product to our customers. We use copper, steel and aluminum in our product
and in the event of government regulations or restrictions of these materials we may experience a shortage of these materials to manufacture
our product. Furthermore, U.S. law restricts us from selling products in some potential foreign markets without U.S. government approval.
If we cannot obtain the required approvals from government agencies to obtain materials or contract with suppliers or if we are restricted
by government regulation from selling our products into certain countries, our business may be adversely affected.
We rely on highly skilled personnel and, if we are unable to retain or motivate key personnel
or hire qualified personnel, we may not be able to grow effectively.
Our performance is largely
dependent on the talents and efforts of highly skilled individuals. Our future success depends on our continuing ability to identify,
hire, develop, motivate, and retain highly skilled personnel for all areas of our organization. We are currently in default under
several agreements with various key consultants which may make those parties unwilling to continue to work with the Company. Our continued
ability to compete effectively depends on our ability to attract new employees and to retain and motivate our existing employees and
consultants. The incentives to attract, retain and motivate employees and consultants provided by our ability to pay competitive salaries
and rates as well as offering additional incentives such as stock option grants or by future arrangements may not be as effective as
in the past. If we do not succeed in attracting excellent personnel or retaining or motivating existing personnel, we may be unable to
grow effectively.
Our business is subject to the risks of
earthquakes and other natural catastrophic events, and to interruptions by man-made problems such as computer viruses, terrorism, or
pandemics.
Our corporate headquarters
and our research and development operations are located in the State of California in regions known for seismic activity. A significant
natural disaster, such as an earthquake, in this region could have a material adverse effect on our business, financial condition and
results of operations. In addition, our servers are vulnerable to computer viruses, break-ins, and similar disruptions from unauthorized
tampering with our computer systems. Any such event could have a material adverse effect on our business, financial condition and results
of operations.
Failure to maintain effective internal
controls over financial reporting could adversely affect our business and the market price of our Common Stock.
Pursuant to rules adopted
by the SEC under the Sarbanes-Oxley Act of 2002, we are required to assess the effectiveness of our internal controls over financial
reporting and provide a management report on our internal controls over financial reporting in all annual reports. This report contains,
among other matters, a statement as to whether our internal controls over financial reporting are effective and the disclosure of any
material weaknesses in our internal controls over financial reporting identified by management. Section 404 also requires our independent
registered public accounting firm to audit the effectiveness of our internal control over financial reporting.
As described in ITEM 9A, Controls
and Procedures contained herein in this Annual Report, management has concluded that as of February 29, 2024, its internal controls over
financial reporting were effective. While the Company believes it has addressed and remediated material weaknesses identified in 2022,
there can be no guarantee that other weaknesses in its financial reporting controls will not be identified in the future. Presently, the
Company does not have the financial resources to fully comply with all the requirements of Section 404. If, in the future, we identify
one or more material weaknesses in our internal controls over financial reporting during this continuous evaluation process, our management
may not be able to assert that such internal controls are effective. Therefore, if we are unable to assert that our internal controls
over financial reporting are effective in the future, or if our auditors are unable to attest that our internal controls are effective
or they are unable to express an opinion on the effectiveness of our internal controls, we could lose investor confidence in the accuracy
and completeness of our financial reports, which would have an adverse effect on our business and the market price of our Common Stock.
Trading on the OTC Markets is volatile
and sporadic, which could depress the market price of our common stock and make it difficult for our stockholders to resell their shares.
Our common stock is quoted
on the Pink Sheets of the OTC Markets. Trading in stock quoted on the OTC Markets is often thin and characterized by wide fluctuations
in trading prices, due to many factors, some of which may have little to do with our operations or business prospects. This volatility
could depress the market price of our common stock for reasons unrelated to operating performance. Moreover, the OTC Markets is not a
stock exchange, and trading of securities on the OTC Markets is often more sporadic than the trading of securities listed on a quotation
system like NASDAQ or a stock exchange like the New York Stock Exchange. These factors may result in investors having difficulty reselling
any shares of our common stock.
ITEM 1B. UNRESOLVED STAFF COMMENTS
None
ITEM
1C. CYBERSECURITY.
Risk Management and
Strategy
The Company's policies
and practices are based on frameworks and standards that address risks through a comprehensive, cross-functional approach that assess,
identify, monitor, and mitigate material risks from cybersecurity threats as part of the overall enterprise risk management
("ERM") process. This includes the collection and storage of data, and being responsive to incidents as they occur. Further,
the Company's processes and technology are utilized to develop, implement, and maintain appropriate measures to safeguard information
systems in protecting the integrity, availability, and confidentiality of data. Additionally, the Company engages certain third parties
to assist in network monitoring and control testing, among other functions of similar capacity.
The Company's cybersecurity
program focuses on the following areas:
| ● | Technological
safeguards that are designed to protect the Company's information systems from cybersecurity threats, including the prevention and detection
of systems, access controls, and firewalls, which the Company assesses the vulnerability and cybersecurity threat and makes necessary
improvements. |
| | | |
| ● | Utilization
of third parties as part of the Company's risk-based approach in identifying and overseeing cybersecurity risks. |
| | | |
| ● | The
Company maintains an incident plan that addresses the Company’s response to a cybersecurity event, which is periodically reviewed
and updated. |
While the Company is
working to adopt the National Institute of Standards and Technology ("NIST") cybersecurity framework, the Company's on-going
investment in information systems and utilization of external 3rd parties represents the best means for extensively testing
both the design and operational effectiveness of cybersecurity controls, and to ensure continuity and functionality of the Company's
operating systems.
As of the date of this
report, the Company has not experienced any material cybersecurity events. However, the presence of new or more advanced forms
of cybersecurity threats could have a material and adverse impact on the business, results of operations, and financial position.
For further discussion relating to this topic, see Item 1A. Risk Factors "The Company's information technology systems may
be negatively affected by cybersecurity threats."
Governance
The Audit Committee of
the Board of Director's has the responsibility of overseeing the Company's cybersecurity risks. The Chief Financial Officer provides
periodic updates to the Board of Director's regarding actions taken to mitigate the Company's exposure and protection to cybersecurity
risks. Management routinely evaluates the Company's security processes, procedures, and systems to determine if enhancements are needed
to reduce the possibility of a future cybersecurity event. This includes safeguards implemented by the Company, such as a multi-factor
authentication process for remote access to systems; restricted firewall settings; network monitoring, email phishing tests, and
enhancing the Company's backup recovery strategy, among others.
The IT Director is responsible
for assessing, monitoring, and managing the Company's cybersecurity risks.
The IT Director, along
with members of management, inform the Audit Committee on cybersecurity risks by providing periodic updates regarding (i) Status of ongoing
cybersecurity initiatives and strategies, (ii) The overall state of the Company's security program and potential exposure to risks, and
(iii) Incident reports and learning from any cybersecurity events. Further, the IT Director maintains an open dialog regarding any
significant developments in cybersecurity risks, ensuring the Audit Committee's oversight is proactive and responsive.
In addition to periodic updates to the Audit Committee, the IT Director,
in his capacity, regularly informs the Chief Executive Officer ("CEO") and the Chief Financial Officer ("CFO") regarding
matters related to cybersecurity risks and incidents. This ensures the highest level of management are informed of potential risks
associated with cybersecurity that could have a material and adverse effect on the Company.
ITEM 2. PROPERTIES
Effective February 28, 2021,
the Company vacated its previous Stanton California facility and other temporary storage facilities and consolidated its administrative
offices and operations, including warehousing space, within an approximately 18,000 square feet facility in Lake Forest, California under
a rental agreement that commenced on February 15, 2021, and covers a 66-month rental period effective from February 2021 through August
31, 2026.
ITEM 3. LEGAL PROCEEDINGS
We are subject to
the legal proceedings and claims discussed below as well as certain other legal proceedings and claims that have not been fully resolved
and that have arisen in the ordinary course of business. Our management evaluates our exposure to these claims and proceedings individually
and in the aggregate and evaluates potential losses on such litigation if the amount of the loss is estimable and the loss is probable.
However, the outcome of legal proceedings and claims brought against the Company is subject to significant uncertainty. Although management
considers the likelihood of such an outcome to be remote, if one or more of these legal matters were resolved against the Company for
amounts in excess of management’s expectations, the Company’s financial statements for that reporting period could be materially
adversely affected. The Company settled certain matters subsequent to year end that did not individually or in the aggregate, have a
material impact on the Company’s financial condition or operating results.
In 2017, the Company’s
former COO was awarded approximately $238 in accrued salary and related charges by the California labor board. In August 2021, the Company
reached a settlement by which the Company agreed to pay approximately $330, representing the principal award plus accrued interest. As
of the time of this filing, the Company has paid the full $330 toward the settlement amount.
Between July 2017 and
March 2022, the Company was engaged in litigation with a former director, Robert Kopple, relating to more than $13 million and the
current equivalent of the approximately 23 million warrants, exercisable for seven years at a price of $0.10 per share, which Mr.
Kopple and his affiliated entities (collectively the “Kopple Parties”) claimed should have been originally issued to
them pursuant to various agreements with the Company entered to between 2013-2016. In March 2022, the Company reached a settlement
with the Kopple Parties that resolved all claims asserted against the Company without any admission, concession or finding of any
fault, liability or wrongdoing on the part of the Company. Under the terms of the settlement, the Company agreed to pay an aggregate
amount of $10 million over a period of seven years, including $3 million initial payment to be paid in June 2022. $150 was paid in
June 2022, and the balance of the initial payment of $2.85 million was extended to May 29, 2023, In exchange for the extension, the
Company was required to pay $165 in extension and forbearance fees in cash and $430 in accrued forbearance fees. Beginning in
January 2023, interest accrues on the unpaid balance at a rate of 6%, compounded annually. All amounts, including all accrued
interest and deferred fees, are to be paid no later than eight years from the date of the initial payment. The Kopple Parties have
also received seven-year warrants to purchase up to an aggregate of approximately 3.3 million shares of our common stock at a price
of $0.85 per share. The settlement also provides for standard mutual general release provisions and includes customary
representations, warranties, and covenants, including certain increases in the amount payable to the Kopple Parties and the right of
such parties to enter judgment against the Company if the Company remains in uncured default in its payment obligations under the
settlement.
During the year ended February
29, 2024, the note was amended multiple times to extend the payment dates of the balance of the initial payment of $2,850, originally
due in June 2022, and the first installment payment of $1,000, originally due in June 2023 (collectively, the “past due principal”).
As a result of these amendments, the Company incurred additional extension and forbearance fees totaling $450 and adjustment to principal
balance of $23 that was recorded as part of interest expense. As of February 29, 2024, outstanding principal balance amounted to $10,938,
including the $3,850 past due principal (see below).
In March 2024, the Company
and Kopple again amended the note payable. The amendment (i) replaced the requirement to pay the $3,850 past due principal balance with
the requirement to pay $2,000 due December 15, 2024, effectively extending the payment of $1,850 to future periods; (ii) increased the
stated interest rate to 10%; (iii) added a fee of $15 monthly until the Company makes a principal payment of $2 million by December 2024;
(iv) effective August 30, 2024, the Company will grant Kopple a conversion right that gives Kopple the option to be able to convert the
note payable into equity of the Company at a conversion price of the lower of $1.00 per share or 50% of the 10 day volume weighted average
price of the Company’s common stock; (v) during Fiscal 2025, will require the Company to pay 20% of all collected revenues within
10 days of the end of each fiscal quarter; (vi) will require the Company to pay Kopple 20% of any amount raised in new capital in the
form of equity, debt or convertible debt above $3.5 million; (vii) reduces the exercise price of the warrants granted to Kopple in March
2022 from $0.85 per share to $0.50 per share; and (vii) extends the warrant expiration date from March 8, 2029, to March 31, 2031.
The Company will account for this amendment in the first quarter ended March 31, 2024, for fiscal year 2025.
On March 26, 2019, various
stockholders of the Company controlling a combined total of more than 27.5 million shares delivered a signed written consent to the Company
removing Ronald Buschur as a member of the Company’s Board and electing Cipora Lavut as a director of the Company. On March
27, 2019, those same stockholders delivered a further signed written consent to the Company removing William Anderson and Si Ryong Yu
as members of the Company’s Board and electing Robert Lempert and David Mann as directors of the Company. These written consents
represented a majority of the outstanding shares of the Company’s common stock as of March 26, 2019, and March 27, 2019,
respectively. Because of Aura’s refusal to recognize the legal effectiveness of the consents, on April 8, 2019, the stockholders
filed suit in the Court of Chancery of the State of Delaware pursuant to Section 225 of the Delaware General Corporations Law, seeking
an order confirming the validity of the consents and declaring that Aura’s Board consists of Ms. Lavut, Mr. Mann, Dr. Lempert,
Mr. Douglas and Mr. Diaz-Versón, Jr. On July 8, 2019 the Court of Chancery entered final judgment in favor of the
stockholder plaintiffs, confirming that (a) Ronald Buschur, Si Ryong Yu and William Anderson had been validly removed by the holders
of a majority of the Company’s outstanding stock acting by written consent (b) Ms. Lavut, Mr. Mann and Dr. Lempert had been validly
elected by the holders of a majority of the Company’s outstanding stock acting by written consent, and (c) the Company’s
Board of Directors validly consists of Cipora Lavut, David Mann, Robert Lempert, Gary Douglas and Salvador Diaz-Versón, Jr. As
a result of prior management’s unsuccessful opposition to this stockholders’ action filed in the Court of Chancery, such
stockholders may be potentially entitled to recoup their litigation costs from the Company under Delaware’s corporate benefit doctrine
and/or other legal provisions. To date, no final determination has been made as to the amount of recoupment, if any, to which such stockholders
may be entitled.
In
June 2022, Melvin Gagerman, the Company’s former CEO and CFO whose employment with Aura was permanently terminated in July 2019,
brought suit against the Company for repayment of an allegedly unsecured demand promissory note in the principal amount of $82 which
he claims was entered into in April 2014 and bears interest at a rate of 10% per annum. Despite the fact that, based on Gagerman’s
allegations, the note was issued during a period when he was the Company’s CEO, CFO, Corporate Secretary and Chairman of Aura’s
Board of Directors, Gagerman has stated that he does not possess a copy of the alleged promissory note. The Company disputes that any
amount is presently owed to Gagerman and has filed a cross-complaint against him for, among things, conversion, violation of California
Business& Professions Code §17200, and various breaches of fiduciary duty that the Company believes Gagerman committed against
Aura, including without limitation, Gagerman’s actions in opposing the valid 2019 stockholder consent action.
ITEM 4. MINE SAFETY DISCLOSURES
Not
applicable.
PART II
ITEM 5. MARKET FOR REGISTRANT’S COMMON
EQUITY, RELATED STOCKHOLDER MATTERS AND ISSUER PURCHASES OF EQUITY SECURITIES
Our shares are quoted on
the Pink Sheets operated by OTC Markets, Inc. under the symbol “AUSI”. Set forth below are high and low bid prices for our
common stock for each quarterly period in the two most recent Fiscal years. Such quotations reflect inter-dealer prices, without retail
mark-up, markdown or commissions and may not necessarily represent actual transactions in the common stock. We had approximately 3,410
stockholders of record as of May 31, 2024.
| Period | |
High | | |
Low | |
| Fiscal 2024 | |
| | | |
| | |
| First Quarter ended May 31, 2023 | |
$ | 0.40 | | |
$ | 0.11 | |
| Second Quarter ended August 31, 2023 | |
$ | 0.22 | | |
$ | 0.13 | |
| Third Quarter ended November 30, 2023 | |
$ | 0.20 | | |
$ | 0.15 | |
| Fourth Quarter ended February 29, 2024 | |
$ | 0.23 | | |
$ | 0.14 | |
| | |
| | | |
| | |
| Fiscal 2023 | |
| | | |
| | |
| First Quarter ended May 31, 2022 | |
$ | 0.48 | | |
$ | 0.24 | |
| Second Quarter ended August 31, 2022 | |
$ | 0.45 | | |
$ | 0.20 | |
| Third Quarter ended November 30, 2022 | |
$ | 0.55 | | |
$ | 0.17 | |
| Fourth Quarter ended February 28, 2023 | |
$ | 0.52 | | |
$ | 0.19 | |
On May 30, 2024, the reported
closing sales price for our common stock was $0.4175.
Dividend Policy
We have not paid any dividends
on our common stock, and we do not anticipate paying any dividends on our common stock in the foreseeable future.
Sales of Unregistered Securities
During the year ended February
29, 2024, we issued 9,943,302 shares of common stock, for a total of approximately $2,947,000.
During the year ended February
28, 2023, we issued 11,529,242 shares of common stock, for a total of approximately $3,270,000.
Funds raised were for general
corporate working capital purposes. All such securities were issued and sold in reliance on the exemption from registration contained
in Section 4(2) of the Securities Act of 1933, and the certificates representing such securities contain a restrictive legend reflecting
the limitations on future transfer of those securities. The offer and sale of these securities was made without public solicitation or
advertising. The investors represented to us that they were knowledgeable and sophisticated and were experienced in business and financial
matters so as to be capable of evaluating an investment in our securities and were an “accredited investor” within the meaning
of Regulation D promulgated under the Securities Act of 1933. Each of these investors was afforded full access to information regarding
our business.
Repurchases of Equity Securities
We
did not repurchase any shares of our common stock during the fiscal years ended February 29, 2024, and February 28, 2023.
ITEM 6. [Reserved]
As a smaller reporting
company, we are not required to provide disclosure under this Item 6.
ITEM 7. MANAGEMENT’S DISCUSSION AND
ANALYSIS OF FINANCIAL CONDITION AND RESULTS OF OPERATIONS
Forward Looking Statements.
This Management’s
Discussion and Analysis of Financial Condition and Results of Operations includes forward-looking statements. For cautions about relying
on such forward-looking statements, please refer to the section entitled “Forward Looking Statements” at the beginning of
this Report immediately prior to “Item 1”.
Overview
Our business is based on
the exploitation of our Axial Flux Induction Motor solution and mobile power known as the AuraGen® for commercial and
industrial applications and the VIPER for military applications. Our business model consists of two major components: (i) sales and marketing,
(ii) design and engineering. Our sales and marketing approaches are composed of direct sales in North America and the use of agents and
distributors in other areas. In North America, our primary focus is in (a) mobile exportable power applications, (b) EV motor applications,
(c) U.S. Military applications and (d) industrial/commercial motor as well as mobile power applications. The second component of our
business model is focused on the design of new products and engineering support for the sales activities described above. The engineering
support consists of the introduction of new optimized power levels for electric motors and new features for our AuraGen®/VIPER solution
such as higher power/torque solutions, and different input and output voltages (DC and AC input and output versions).
In Fiscal 2020 stockholders
of the Company successfully removed Ronald Buschur, William Anderson and Si Ryong Yu from the Company’s Board of Directors and
elected Ms. Cipora Lavut, Mr. David Mann and Dr. Robert Lempert as directors of the Company in their stead. See Item 3, Legal Proceedings
for more information. Also, in Fiscal 2020, Melvin Gagerman –– Aura’s CEO and CFO since 2006 –– was replaced.
In July 2019 Ms. Lavut succeeded Mr. Gagerman as President and Mr. Mann succeeded Mr. Gagerman as CFO. Dr. Lempert was appointed as Secretary
of the Company by the Board of Directors also in July 2019. In the second half of Fiscal 2020, the company began significantly increasing
its engineering, manufacturing and marketing activities. From July 8, 2019, the date of the change in management, through the end of
Fiscal 2023, the Company shipped approximately 150 units to. Although our operations were impacted in Fiscal 2023, Fiscal 2022 and Fiscal
2021 by the COVID-19 pandemic, during these periods we continued to expand our engineering and manufacturing capabilities. See “Item
1. Business. Impact of the COVID-19 Pandemic” included elsewhere in this Annual Report on Form 10-K for information regarding the
impact of COVID-19 on our operations. Our engineering, research and development costs for Fiscal 2024 and Fiscal 2023 were approximately
$750 and $850, respectively.
During Fiscal 2018 and Fiscal
2019, the Company’s engineering, manufacturing, sales, and marketing activities were reduced while we focused on renegotiating
numerous financial obligations. During this time, the Company’s agreements with numerous customers, third party vendors, and organizations
and entities material to the operation of the Company business were canceled, delayed or terminated. During Fiscal 2018, the Company
successfully restructured in excess of $30 million of debt. Robert Kopple, our former Vice Chairman of the Board, was the only significant
unsecured note holder that did not executed formal agreements regarding the restructure of his debt. See “Item 3. Legal Proceedings”
included elsewhere in this Annual Report on Form 10-K for information regarding the dispute with Mr. Kopple regarding these transactions.
In March 2022, the Company reached a settlement that resolves the various claims asserted against us by Mr. Kopple and his affiliated
entities. In July 2017, Mr. Kopple and his affiliates brought suit against the Company relating to more than $13 million and the current
equivalent of more than approximately 23 million warrants, exercisable for seven years at a price of $0.10 per share, which Mr. Kopple
and his affiliated entities (collectively the “Kopple Parties”) claimed to be owed to them pursuant to various agreements
with the Company entered into between 2013-2016. Under the terms of the settlement, the Company agreed to pay an aggregate amount of
$10 million over a period of seven years, including $3 million initial payment to be paid in June 2022. $150 was paid in June 2022, and
the balance of the initial payment of $2.85 million was extended to May 29, 2023. In exchange for the extension, the Company was required
to pay $165,000 in extension and forbearance fees in cash and $430 in accrued forbearance fees. Beginning in January 2023, interest accrues
on the unpaid balance at a rate of 6%, compounded annually. All amounts, including all accrued interest and deferred fees, are to be
paid no later than eight years from the date of the initial payment. The Kopple Parties have also received seven-year warrants to purchase
up to an aggregate of approximately 3.3 million shares of our common stock at a price of $0.85 per share. The settlement also provides
for standard mutual general release provisions and includes customary representations, warranties, and covenants, including certain increases
in the amount payable to the Kopple Parties and the right of such parties to enter judgment against the Company if the Company remains
in uncured default in its payment obligations under the settlement.
During the year ended February
29, 2024, the note was amended multiple times to extend the payment dates of the balance of the initial payment of $2,850, originally
due in June 2022, and the first installment payment of $1,000, originally due in June 2023 (collectively, the “past due principal”).
As a result of these amendments, the Company incurred additional extension and forbearance fees totaling $450 and adjustment to principal
balance of $23 that was recorded as part of interest expense. As of February 29, 2024, outstanding principal balance amounted to $10,938,
including the $3,850 past due principal (see below).
In March 2024, the Company
and Kopple again amended the note payable. The amendment (i) replaced the requirement to pay the $3,850 past due principal balance with
the requirement to pay $2,000 due December 15, 2024, effectively extending the payment of $1,850 to future periods; (ii) increased the
stated interest rate to 10%; (iii) added a fee of $15 monthly until the Company makes a principal payment of $2 million by December 2024;
(iv) effective August 30, 2024, the Company will grant Kopple a conversion right that gives Kopple the option to be able to convert the
note payable into equity of the Company at a conversion price of the lower of $1.00 per share or 50% of the 10 day volume weighted average
price of the Company’s common stock; (v) during Fiscal 2025, will require the Company to pay 20% of all collected revenues within
10 days of the end of each fiscal quarter; (vi) will require the Company to pay Kopple 20% of any amount raised in new capital in the
form of equity, debt or convertible debt above $3.5 million; (vii) reduces the exercise price of the warrants granted to Kopple in March
2022 from $0.85 per share to $0.50 per share; and (vii) extends the warrant expiration date from March 8, 2029, to March 31, 2031.
The Company will account for this amendment in the first quarter ended March 31, 2024, for fiscal year 2025.
Critical Accounting Policies and Estimates
Our management’s discussion
and analysis of our financial conditions and results of operations are based upon our financial statements, which have been prepared
in accordance with accounting principles generally accepted in the United States of America. The preparation of financial statements
requires management to make estimates and disclosures on the date of the financial statements. In preparing our financial statements,
we have made our best estimates and judgments of certain amounts included in the financial statements. We use authoritative pronouncements,
historical experience and other assumptions as the basis for making judgments. The full impact of the COVID-19 pandemic is unknown and
cannot be reasonably estimated for these key estimates and assumptions. However, we made appropriate accounting estimates based on the
facts and circumstances available as of the reporting date. To the extent that there are differences between these estimates and actual
results, our financial statements may be materially affected.
Revenue Recognition
The Company recognizes revenue
in accordance with Financial Accounting Standard Board’s (“FASB”) Accounting Standards Codification (“ASC”)
Topic 606, Revenue from Contracts with Customers. To determine revenue recognition under ASC 606, an entity performs the following five-steps
(i) identifies the contract(s) with a customer; (ii) identifies the performance obligations in the contract; (iii) determines the transaction
price; (iv) allocates the transaction price to the performance obligations in the contract; and (v) recognizes revenue when (or as) the
entity satisfies a performance obligation. The Company only applies the five-steps to contracts when it is probable that the entity will
collect the consideration it is entitled to in exchange for the goods or services it transfers to the customer.
In accordance with ASC 606,
we recognize revenue, net of discounts, for our generator sets at time of product delivery to the domestic distributor (i.e. point-in-time),
which also corresponds to the passage of legal title to the customer and the satisfaction of our performance obligations to the customer.
Our payment terms are cash payment due upon delivery and typically includes a 2% price discount off the selling price in accordance with
this policy. Our commercial terms and conditions do not include a right of return for reasons other than a defect in performance or quality.
We offer a 24-month assurance-type warranty covering material and manufacturing defects, which we account for under the guidance of ASC
460, Guarantee.
Inventories
Inventories are valued at
the lower of cost (first-in, first-out) or net realizable value, on an average cost basis. We review the components of inventory on a
regular basis for excess or obsolete inventory based on estimated future usage and sales. When evidence exists that the net realizable
value of inventory is lower than its cost, the difference is recognized as a loss in the period in which it occurs. Once inventory has
been written down, it creates a new cost basis for inventory that may not be subsequently written up.
Leases
The Company determines whether
a contract is, or contains, a lease at inception. Right-of-use assets represent the Company’s right to use an underlying asset
during the lease term, and lease liabilities represent the Company’s obligation to make lease payments arising from the lease.
Right-of-use assets and lease liabilities are recognized at lease commencement based upon the estimated present value of unpaid lease
payments over the lease term. The Company uses its incremental borrowing rate based on the information available at lease commencement
in determining the present value of unpaid lease payments.
Share-Based Compensation
The Company periodically
issues stock options and warrants, and shares of common stock to employees and non-employees in non-capital raising transactions for
services and for financing costs. Share-based compensation cost is measured at the grant date, based on the estimated fair value of the
award, and is recognized as expense over the requisite service period. Recognition of compensation expense for non-employees is in the
same period and manner as if the Company had paid cash for services. The Company periodically issues stock options and warrants, and
shares of common stock to employees and non-employees in non-capital raising transactions for services and for financing costs. Share-based
compensation cost is measured at the grant date, based on the estimated fair value of the award, and is recognized as expense over the
requisite service period. Recognition of compensation expense for non-employees is in the same period and manner as if the Company had
paid cash for services.
COVID-19
The extent of the impact of
the COVID-19 pandemic on our business, financial results and liquidity will depend largely on future developments, including the duration
of the spread of the COVID-19 outbreak within the U.S. and globally, the impact on capital and financial markets and the related impact
on our customers, especially in the commercial vehicle markets. These future developments are outside of our control, are highly uncertain,
and cannot be predicted. If the impact is prolonged, then it can further increase the difficulty of planning for operations and may require
us to take further actions as it relates to costs and liquidity. These and other potential impacts of the COVID-19 pandemic will continue
to adversely impact our results for the first quarter of Fiscal 2025, as well as the full Fiscal year 2025, and that impact could be material.
Results of Operations
Fiscal 2024 compared to Fiscal 2023
Revenues
Revenues in Fiscal 2024 were
approximately $56 as compared to the Fiscal 2023 period of approximately $71, a reduction of approximately 21%. Fiscal 2024 revenues consisted
principally of the delivery of 7 AuraGen®/VIPER systems, 5 of which were to a single distributor customer. Fiscal 2023
revenues consisted principally of the delivery of 9 AuraGen®/VIPER systems, 7 of which were to a single distributor customer.
We believe that the low levels of revenue in both Fiscal 2024 and Fiscal 2023 were the result of the company’s switch in focus to
the development of the new family of improved products.
Cost of Goods
Cost of goods sold was approximately
$193 and $88 in the years ended February 29, 2024, and February 28, 2023, respectively. During Fiscal 2024, the Company recorded an inventory
write-down of $123 to cost of goods sold, which contributed to a negative gross margin of approximately $137 in Fiscal 2024. During Fiscal
2023, we benefited from the utilization of fully reserved inventory to deliver 9 units and recorded material cost at 32% of sales value,
direct labor at 43% of sales value and other overheads at 44% of sales. Additionally, the Company recorded an inventory write-down of
$4,000 to cost of goods sold, which resulted in a negative gross margin of approximately $17,000 in FY 2023. For both FY 2024 and FY
2023, the disproportionate increase in manufacturing overhead costs resulted from higher depreciation and systems costs without an offsetting
increase in production volumes. While both the FY 2024 and FY 2023 periods benefited from the utilization of inventory that was previously
fully reserved, the new design ECU units fabricated in those periods did include the costs of new electronics boards.
Engineering, Research and Development
Engineering, research and
development costs decreased to approximately $750 in Fiscal 2024 from approximately $850 in Fiscal 2023, a decrease of approximately
$100 or 12%. The decrease is a result of the Company’s augmented engineering activities, including (i) successfully recruiting
new additions to the engineering staff; (ii) licensing of modeling and design software tools for the full 12-month period; as well as
(iii) additional expenses incurred in the process of designing, fabricating and testing the new version of our electronic control unit
(“ECU”) for our AuraGen®/VIPER products.
Selling, General and Administrative Expense
Selling, general and administrative
expenses decreased approximately $763, or 29%, to $1,873 in Fiscal 2024 from $2,636 in Fiscal 2023 due to several factors. Most notable
of these was a decrease in legal expenses of approximately $628 as Fiscal 2023 had a lot of legal expenses relating to the Kopple settlement.
There was also a decrease in selling expenses of $100 due to lower sales and a decrease in outside services of $72. This was partially
offset by (i) increased salary and wage-related expenses of approximately $100 due to new hires in the engineering department and (ii)
increased depreciation and software license related costs of approximately $85 associated with equipment and computer systems.
Other Income (Expense) and Interest Expense
Net interest expense increased
significantly to approximately $1,465 in Fiscal 2024 from approximately $727 in Fiscal 2023, an increase of approximately $738, or 102%.
This is principally a result of the settlement of the litigation with Robert Kopple and his affiliates. Under the terms of the settlement,
no interest was to accrue until payment of the initial $3 million, which was extended to May 2023. In exchange for the extensions, the
company recorded $335 of fees which are being categorized as interest, plus note interest of approximately $52. The aggregate Kopple-related
interest in Fiscal 2023 of approximately $387 compares to the Fiscal year 2022 Kopple-related interest of approximately $823, a 53% reduction.
Net Loss
We recorded net losses of
approximately $4,216 and $3,410 in the Fiscal years ended February 29, 2024 and February 28, 2023, respectively, or a decrease of income
of approximately $806 due to several factors as note above: (i) Fiscal 2024 included the higher interest expense of approximately $738;
(ii) decreased operating expenses in selling, marketing and general and administrative of approximately $159; and (iii) increased engineering
and R&D expenses of approximately $239 partially offsetting the other income improvements.
Liquidity and Capital Resources
For the year ended February
29, 2024, we recorded a net loss of $4.2 million. used cash in operations of $3 million, and at February 29, 2024, had a stockholders’
deficit of $21.5 million. In addition, at February 29, 2024, notes payable and related accrued interest with an aggregate balance of $6.7
million have reached maturity and are past due. These conditions raise substantial doubt regarding our ability to continue as a going
concern for a period of at least one year from the date of issuance of these financial statements. In addition, the Company’s independent
registered public accounting firm, in their report on the Company’s February 29, 2024, audited financial statements, raised substantial
doubt about the Company’s ability to continue as a going concern.
The net loss in Fiscal 2024
was approximately $806 higher as compared to Fiscal 2023 due to several offsetting items, but most notably increased interest expense
of approximately $738. Fiscal 2024 also included additional expenditures to ramp up the Company’s engineering, R&D, and administrative
activities. A significant factor in both periods contributing to the negative operating cash flows is the low level of operating activities
caused principally by the company’s switch to the development of new products and the COVID-19 pandemic. As a result of the impacts
of the COVID-19 pandemic, we may be required to raise additional capital and our access to and cost of financing will depend on, among
other things, global economic conditions, conditions in the global financing markets, the availability of sufficient amounts of financing,
and our future prospects. At February 29, 2024, we had cash of approximately $123, compared to cash of approximately $15 at February 28,
2023. Subsequent to February 29, 2024, the Company issued 4,455,600 shares of common stock in exchange for cash proceeds of $1,114. Working
capital deficit at February 29, 2024 was a $14.9 million deficit as compared to an $13.7 million deficit at the end of the prior fiscal
year. The principal reasons for the increase in the deficit is an increase in Accounts Payable of $308 and accrued interest of $767 mostly
relating to the Kopple settlement. The February 28, 2023, financial statements reflect the reclassification to non-current of $7.1 million
of the debt to Robert Kopple and his affiliated entities (collectively the “Kopple Parties”) as a result of the settlement.
Prior to Fiscal 2020, in
order to maintain liquidity, we relied upon external sources of financing, principally equity financing and private indebtedness. We
have no bank line of credit and will require additional debt or equity financing to fund ongoing operations. Based on a cash flow analysis
performed by management, we estimate that we will need an additional $6 million to maintain existing operations for Fiscal 2025 and increase
the volume of shipments to customers. We cannot assure the reader that additional financing will be available nor that the commercial
targets will be met in the amounts required to keep the business operating. The issuance of additional shares of equity in connection
with such financing could dilute the interests of our existing stockholders, and such dilution could be substantial. If we cannot raise
the needed funds, we will also be forced to make further substantial reductions in our operating expenses, which could adversely affect
our ability to implement our current business plan and ultimately our viability as a company.
Between July 2017 and March
2022, the Company was engaged in litigation with a former director, Robert Kopple, relating to more than $13 million and the current
equivalent of the approximately 23 million warrants, exercisable for seven years at a price of $0.10 per share, which Mr. Kopple and
his affiliated entities (collectively the “Kopple Parties”) claimed should have been originally issued to them pursuant to
various agreements with the Company entered to between 2013-2016. In March 2022, the Company reached a settlement with the Kopple Parties
that resolved all claims asserted against the Company without any admission, concession or finding of any fault, liability or wrongdoing
on the part of the Company. Under the terms of the settlement, the Company agreed to pay an aggregate amount of $10 million over a period
of seven years, including $3 million initial payment to be paid in June 2022. $150 was paid in June 2022, and the balance of the initial
payment of $2.85 million was extended to May 29, 2023. In exchange for the extension, the Company was required to pay $165,000 in extension
and forbearance fees in cash and $430,000 in accrued forbearance fees. Beginning in January 2023, interest accrues on the unpaid balance
at a rate of 6%, compounded annually. All amounts, including all accrued interest and deferred fees, are to be paid no later than eight
years from the date of the initial payment. The Kopple Parties have also received seven-year warrants to purchase up to an aggregate
of approximately 3.3 million shares of our common stock at a price of $0.85 per share. The settlement also provides for standard mutual
general release provisions and includes customary representations, warranties, and covenants, including certain increases in the amount
payable to the Kopple Parties and the right of such parties to enter judgment against the Company if the Company remains in uncured default
in its payment obligations under the settlement.
During the year ended February
29, 2024, the note was amended multiple times to extend the payment dates of the balance of the initial payment of $2,850, originally
due in June 2022, and the first installment payment of $1,000, originally due in June 2023 (collectively, the “past due principal”).
As a result of these amendments, the Company incurred additional extension and forbearance fees totaling $450 and adjustment to principal
balance of $23 that was recorded as part of interest expense. As of February 29, 2024, outstanding principal balance amounted to $10,938,
including the $3,850 past due principal (see below).
In March 2024, the Company
and Kopple again amended the note payable. The amendment (i) replaced the requirement to pay the $3,850 past due principal balance with
the requirement to pay $2,000 due December 15, 2024, effectively extending the payment of $1,850 to future periods; (ii) increased the
stated interest rate to 10%; (iii) added a fee of $15 monthly until the Company makes a principal payment of $2 million by December 2024;
(iv) effective August 30, 2024, the Company will grant Kopple a conversion right that gives Kopple the option to be able to convert the
note payable into equity of the Company at a conversion price of the lower of $1.00 per share or 50% of the 10 day volume weighted average
price of the Company’s common stock; (v) during Fiscal 2025, will require the Company to pay 20% of all collected revenues within
10 days of the end of each fiscal quarter; (vi) will require the Company to pay Kopple 20% of any amount raised in new capital in the
form of equity, debt or convertible debt above $3.5 million; (vii) reduces the exercise price of the warrants granted to Kopple in March
2022 from $0.85 per share to $0.50 per share; and (vii) extends the warrant expiration date from March 8, 2029, to March 31, 2031.
The Company will account for this amendment in the first quarter ended March 31, 2024, for fiscal year 2025.
We consider the transactions described above with
Mr. Kopple to be related party transactions.
See “Item 3. Legal
Proceedings” and “Part IV, Item 15, Note 9 and Note 17 to the Financial Statements” included elsewhere in this Annual
Report on Form 10-K for information regarding the dispute and settlement with Mr. Kopple regarding these transactions.
ITEM 7A. QUANTITATIVE
AND QUALITATIVE DISCLOSURES ABOUT MARKET RISK
As a smaller reporting company, we are not required
to provide the information required by this Item 7A.
ITEM 8. FINANCIAL STATEMENTS AND SUPPLEMENTARY DATA
See Index to Financial Statements at page F-1.
ITEM 9. CHANGES IN AND DISAGREEMENTS WITH
ACCOUNTANTS ON ACCOUNTING AND FINANCIAL DISCLOSURE
For the year ended February
29, 2024, there were no disagreements or any reportable events to disclose.
ITEM 9A. CONTROLS AND PROCEDURES
Evaluation of Disclosure Controls and Procedures
We conducted an evaluation
under the supervision and with the participation of our management, including our Chief Executive Officer and Chief Financial Officer,
of the effectiveness of the design and operation of our disclosure controls and procedures. The term “disclosure controls and procedures”,
as defined in Rules 13a-15I and 15d-15(e) under the Securities and Exchange Act of 1934, as amended (“Exchange Act”), means
controls and other procedures of a company that are designed to ensure that information required to be disclosed by the company in the
reports it files or submits under the Exchange Act is recorded, processed, summarized and reported, within the time periods specified
in the Securities and Exchange Commission’s rules and forms. Disclosure controls and procedures also include, without limitation,
controls and procedures designed to ensure that information required to be disclosed by a company in the reports that it files or submits
under the Exchange Act is accumulated and communicated to the company’s management, including its principal executive and principal
financial officers, or persons performing similar functions, as appropriate, to allow timely decisions regarding required disclosure.
Based on this evaluation,
our President and Chief Financial Officer concluded as of February 29, 2024, that our disclosure controls and procedures were effective.
Management’s Annual Report on Internal Control Over Financial
Reporting
The Company’s management
is responsible for establishing and maintaining adequate internal control over financial reporting as defined in Rule 13a-15(f) of the
Securities Exchange Act of 1934. The Company’s internal control over financial reporting is a process designed to provide reasonable
assurance regarding the reliability of financial reporting and the preparation of financial statements for external purposes in accordance
with United States generally accepted accounting principles. Internal control over financial reporting includes policies and procedures
that (i) pertain to the maintenance of records that, in reasonable detail, accurately and fairly reflect the transactions and dispositions
of the assets of the Company; (ii) provide reasonable assurance that transactions are recorded as necessary to permit preparation
of financial statements in accordance with United States generally accepted accounting principles, and that receipts and expenditures
of the Company are being made only in accordance with authorizations of management and directors of the Company; and (iii) provide
reasonable assurance regarding prevention or timely detection of unauthorized acquisitions, use or disposition of the Company’s
assets that could have a material effect on the financial statements.
Management has assessed the
effectiveness of the Company’s internal control over financial reporting as of February 29, 2024. In making these assessments,
management used the criteria set forth by the Committee of Sponsoring Organizations of the Treadway Commission (“COSO”) in
Internal Control-Integrated Framework. Based on these assessments, and on those criteria, the Company’s management concluded that
as of February 29, 2024, the Company’s internal control over financial reporting was effective to provide reasonable assurance
regarding the reliability of financial reporting and the preparation of financial statements for external purposes in accordance with
U.S. generally accepted accounting principles.
Changes in Internal Control Over Financial Reporting
There were no changes in the
Company’s internal control over financial reporting that occurred during the Company’s fiscal year ended February 29, 2024,
that have materially affected, or are reasonably likely to materially affect, the Company’s internal control over financial reporting.
Inherent Limitations on Effectiveness of Controls
The Company does not expect
that its disclosure controls and procedures or its internal control over financial reporting will prevent all errors and all fraud. A
control procedure, no matter how well conceived and operated, can provide only reasonable not absolute assurance that the objectives
of the control procedure are met. Because of the inherent limitations in all control procedures, no evaluation of controls can provide
absolute assurance that all control issues and instances of fraud, if any, within the Company have been detected. These inherent limitations
include the realities that judgments in decision-making can be faulty, and that breakdowns can occur because of simple error or mistake.
Additionally, controls can be circumvented by the individual acts of some persons, by collusion of two or more people, or by management
override of the control. The design of any control procedure also is based in part upon certain assumptions about the likelihood of future
events, and there can be no assurance that any design will succeed in achieving its stated goals under all potential future conditions;
over time, controls may become inadequate because of changes in conditions, or the degree of compliance with the policies or procedures
may deteriorate. Because of the inherent limitations in a cost-effective control procedure, misstatements due to error or fraud may occur
and not be detected.
ITEM 9B. OTHER INFORMATION
None
Item 9C. Disclosure
Regarding Foreign Jurisdictions that Prevent Inspections.
None
PART III
ITEM 10. DIRECTORS, EXECUTIVE OFFICERS AND CORPORATE GOVERNANCE
Directors and Executive Officers
In March 2019, stockholders
of the Company controlling a majority of the outstanding shares of the Company’s common stock delivered signed written consents
to the Company removing Ronald Buschur, William Anderson, and Si Ryong Yu as members of the Company’s Board and electing Ms. Cipora
Lavut, Mr. David Mann, and Dr. Robert Lempert as directors of the Company in their stead. As a result of Aura’s refused to
recognize the legal effectiveness of the consents, in April 2019, stockholders filed suit in the Court of Chancery of the State
of Delaware pursuant to Section 225 of the Delaware General Corporations Law, seeking an order confirming the validity of the consents.
On July 8, 2019 the Court of Chancery entered final judgment in favor of the stockholder plaintiffs, confirming that (a) Ronald Buschur,
Si Ryong Yu and William Anderson had been validly removed by the holders of a majority of the Company’s outstanding stock acting
by written consent (b) Ms. Lavut, Mr. Mann and Dr. Lempert had been validly elected by the holders of a majority of the Company’s
outstanding stock acting by written consent, and (c) the Company’s Board of Directors validly consists of Cipora Lavut, David Mann,
Robert Lempert, Gary Douglas and Salvador Diaz-Versón, Jr. As a result of prior management’s unsuccessful opposition to
this stockholder action filed in the Court of Chancery, such stockholders may be potentially entitled to recoup their litigation costs
from the Company under Delaware’s corporate benefit doctrine and/or other legal provisions. To date, no final determination has
been made as to the amount of recoupment, if any, to which such stockholders may be entitled.
In July 2019 the employment
of Melvin Gagerman was terminated. (See Item 3, Legal Proceedings for more information.) Also in July 2019, the Board of Directors appointed
Ms. Lavut to succeed Mr. Gagerman as President of Aura, appointed Mr. Mann to succeed Mr. Gagerman as Chief Financial Officer of the
Company, and appointed Dr. Lempert Secretary of Aura. In February 2022, the Board of Directors appointed Mr. Steven Willett to succeed
Mr. Mann as the Company’s Chief Financial Officer. Mr. Mann remains on the Board of Directors.
The following table sets
forth the names, ages, and offices of all our current directors and executive officers. Our officers are appointed by, and serve at the
pleasure of, the Board of Directors. The stockholders at the annual meeting elect our directors to serve until the next meeting.
| Name | |
Age | |
Title |
| Gary
Douglas (1) | |
76 | |
Director, Member of the Audit Committee |
| Salvador
Diaz-Verson, Jr. (1) | |
65 | |
Director, Chairman of the Audit Committee |
| David
Mann (2), (3) | |
52 | |
Director, Chairman of the Compensation Committee, Member of the Nominating Committee and Member of
the Audit Committee, former Chief Financial Officer |
| Cipora
Lavut (2) | |
68 | |
President, Chairman of the Board, Member of Nominating Committee and Member of the Compensation Committee |
| Robert
Lempert (2) | |
80 | |
Secretary, Director, Chairman of the Nominating Committee and Member of the Compensation Committee |
| Gary
Campbell (4) | |
57 | |
Chief Financial Officer |
| (1) | Mr.
Douglas and Mr. Diaz-Verson, Jr. were appointed to the Board of Directors on March 29, 2018, by the written consent of stockholders holding
a majority of the Company’s shares. |
| (2) | In
March 2019, stockholders of the Company controlling a combined total of more than 27.5 million shares delivered signed written consents
to the Company electing Ms. Lavut, Mr. Mann and Dr. Lempert to the Company’s Board of Directors. Because of Aura’s refusal
to recognize the legal effectiveness of the consents, in April 2019 the stockholders filed suit in the Court of Chancery of the
State of Delaware seeking an order confirming the validity of the elections. On July 8, 2019, the Court of Chancery entered final judgment
in favor of the stockholder plaintiffs, confirming that Ms. Lavut, Mr. Mann and Dr. Lempert had been validly elected by the holders of
a majority of the Company’s outstanding stock acting by written consent. In July 2019, the Board of Directors appointed Ms. Lavut
President and Chairman of the Board, appointed Mr. Mann as Chief Financial Officer and appointed Dr. Lempert as Secretary. |
| (3) | On
February 14, 2022, Mr. Mann resigned as Chief Financial Officer. |
| (4) | On
August 15, 2023, Mr. Campbell was appointed as Chief Financial Officer. |
Biographical information with respect to our
current directors and executive officer is provided below.
Salvador Diaz-Versón,
Jr. Mr. Diaz-Versón, Jr. was elected as a director on March 29, 2018. Previously, he served as a director of the
Company from 1997-2005 and again from June 2007 until January 2018. Mr. Diaz-Versón, Jr. is the founder, Chairman and President
of Diaz-Verson Capital Investments, Inc., and was a registered investment advisor with the Securities and Exchange Commission until
2009. Mr. Diaz-Versón, Jr. served as President and member of the board of directors of American Family Corporation (AFLAC, INC.)
from 1976 until 1992. Mr. Diaz-Versón, Jr. served as President and Chief Investment Officer of American Family Life Assurance Company,
a subsidiary of AFLAC, Inc. He is currently Chairman of Miramar Securities. Mr. Diaz-Versón, Jr. has received two presidential
appointments to the Christopher Columbus Fellowship Foundation; first by President George H.W. Bush in 1992 and subsequently by
President Clinton in 2000. Mr. Diaz-Versón, Jr. is a trustee of the Florida State University Foundation and is a national
trustee of the Boys and Girls Club of America. He also serves as a trustee of Clark Atlanta University. Mr. Diaz-Versón,
Jr. is a graduate of Florida State University and was selected as a director in view of his lengthy experience in managing companies
and his knowledge of capital investments.
Gary Douglas.
Mr. Douglas was elected as a director on March 29, 2018. Mr. Gary Douglas has a BBA in Management degree, with extensive experience in
cooperate communication and investment banking. He is a principal in Douglas Strategic Communications LLC, a marketing strategy and communications
consultancy, and Ex officio Chairman of Picture Marketing, Inc., a digital marketing company. Mr. Douglas also formally served as Chief
Marketing Officer of O’Melveny Consulting LLP, a unit of a global law firm. He also served as President of SP/Hambros America and
Division President of Geneva Learning Systems and Group Vice President of Business Development for the five Geneva Companies, both SP/Hambros
and The Geneva companies were middle market investment bankers. Mr. Douglas brings to the Board extensive experience in cooperate communication
and investment banking.
Cipora Lavut.
Ms. Lavut was one of Aura’s original founding members. From 1987 to 2002 Ms. Lavut served on Aura’s Board and as
a Senior Vice President. During this period, Ms. Lavut was instrumental to Aura receiving large contracts from The Boeing Company,
Litton Industries and the United States Air Force. Ms. Lavut also provided critical investor relations and marketing support during
this time. Ms. Lavut left Aura in 2002. Ms. Lavut presently provides marketing and business consulting to a variety of retail
and service-oriented businesses. She holds a B.A. Business degree from California State University, Northridge.
Robert Lempert.
Dr. Lempert graduated from the University of Pennsylvania and conducted his residency at the Albert Einstein Medical Center in Philadelphia.
Dr. Lempert also served as a Captain in the U.S. Army and previously served on the Company’s Board from November 28,
2017 (when he was appointed by the then-Board to fill one of the two existing vacancies) until January 11, 2018. Dr. Lempert
has been a significant investor, shareholder and an active advocate of Aura’s technology for more than 20 years.
David Mann.
Mr. Mann has been Vice President of Marketing for Mann Marketing, a manufacturing and import company, since 1990 and the Vice President
of Sales of that company since 2007. From 2000 until 2007, Mr. Mann also served as Vice President of Operations. Mr. Mann has
extensive experience dealing with all aspects of marketing and sales, as well as suppliers in both North America and China. Mr. Mann
has been an investor in the Aura since 2007 and previously served as a director of the Company from November 28, 2017 (when he was
appointed by the then-Board to fill one of the two existing vacancies) until January 11, 2018. Mr. Mann holds a degree in Business
Administration from College St. Laurent, Montreal, Canada.
Gary Campbell.
Mr. Campbell has a BA degree in Business & Finance from University of Western Ontario in Canada. He has obtained a professional CPA
designation in both Canada and the USA. He spent 8 years in audit working for E&Y and Withey Addison in Canada. He has international
business exposure in the reinsurance industry as VP of Finance for American Safety Insurance while living in Bermuda. He served as CFO
for both a private boarding school and a payroll outsourcing company while living in Hawaii. Since moving to California 11 years ago,
he has been doing contract work for many different industries as Controller or fractional CFO. Prior to joining Aura Systems Inc., he
spent 4 years as the Controller for the public company Charlie’s Holdings Inc., which sells its products in 80 different countries.
Delinquent Section 16(a) Reports
Our shares of common stock
are registered under the Securities Exchange Act of 1934, and therefore our executive officers and directors and persons who beneficially
own more than 10% of a registered class of our equity securities to file with the SEC initial statements of beneficial ownership, reports
of changes in ownership and annual reports concerning their ownership of our common shares and other equity securities, on Forms 3, 4
and 5 respectively. Executive officers, directors and greater than 10% stockholders are required by the Securities and Exchange Commission
regulations to furnish us with copies of all Section 16(a) reports they file. Based on our review of the copies of such forms received
by us, and to the best of our knowledge, no executive officers, directors and persons holding greater than 10% of our issued and outstanding
stock have filed the required reports during the years ended February 29, 2024, and February 28, 2023.
Code of Ethics
We have adopted a Code of
Ethics applicable to the Company’s Chief Executive Officer, Chief Financial Officer and all other members of the Company’s
Finance Department. This Code of Ethics is posted on the Company’s website within a broader Code of Business Conduct and Ethics
at www.aurasystems.com in the Investor Relations section. We intend to satisfy the disclosure requirement under Item 10 of Form 8-K regarding
an amendment to, or a waiver from, the provision of our Code of Ethics that applies to our principal executive officer, principal financial
officer, principal accounting officer or controller, or persons performing similar functions and that relates to any element of such
provision of our Code of Ethics by posting such information on our website within four business days of the date of such amendment or
waiver. In the case of a waiver, the nature of the waiver, the name of the person to whom the waiver was granted and the date of the
waiver will also be disclosed.
Family Relationships
None of our directors or executive officers is
related to one another.
Committees of the Board of Directors
The Board maintains the following committees to assist it in discharging
its oversight responsibilities.
Audit Committee. The
Audit Committee does not have a formal charter but is responsible primarily for overseeing the services performed by our independent
registered public accounting firm, evaluating our accounting policies and system of internal controls, and reviewing our annual and quarterly
reports before filing with the Securities and Exchange Commission. The current members of the Audit Committee are Mr. Salvador Diaz Versón
Jr., Mr. David Mann and Mr. Gary Douglas. The Board of Directors has determined that the Audit Committee does not have a member who is
an “audit committee financial expert” as such term is defined by the rules and regulations of the Securities and Exchange
Commission. While the Board recognizes that the Board members serving on the Audit Committee do not meet the qualifications required
of an “audit committee financial expert,” the Board believes that the appointment of a new director to the Board of Directors
and to the Audit Committee at this time is not necessary as the level of financial knowledge and experience of the current member of
the Audit Committee, including such member’s ability to read and understand fundamental financial statements, is sufficient to
adequately discharge the Audit Committee’s responsibilities
Compensation Committee.
The Compensation Committee does not have a formal charter but reviews and recommends to the full Board the amounts and types of compensation
to be paid to the Chairman and Chief Executive Officer; reviews and approves the amounts and types of compensation to be paid to our
other executive officers and the non-employee directors; reviews and approves, on behalf of the Board, salary, bonus and equity guidelines
for our other employees; and administers our equity plans. The Compensation Committee is currently comprised of Mr. David Mann, Ms. Cipora
Lavut and Dr. Robert Lempert.
Nominating Committee.
The Nominating Committee does not have a formal charter but assists the Board in identifying qualified individuals to become directors,
determines the composition of the Board and its committees, monitors the process to assess the Board’s effectiveness and helps
develop and implement our corporate governance guidelines. The Nominating Committee also considers nominees proposed by stockholders.
The Nominating Committee currently consists of Mr. David Mann, Ms. Cipora Lavut and Dr. Robert Lempert.
Director Compensation
Although we do not currently
compensate our directors in cash for their service as members of our Board of Directors, the Board may, in its discretion, elect to compensate
directors for attending Board and Committee meetings and to reimburse directors for out-of-pocket expenses incurred in connection with
attending such meetings. Additionally, our directors are eligible to receive stock options under the 2011 Directors and Executive Officer
Stock Option Plan.
During Fiscal 2024, no stock
compensation was awarded to any of the Company’s directors.
During Fiscal 2023, no stock
compensation was awarded to any of the Company’s directors.
ITEM 11. EXECUTIVE COMPENSATION
The following table sets
forth the compensation earned by or paid to the principal executive officer and the named executive officers during the Fiscal years
ended February 29, 2024 and February 28, 2023.
2022 Summary Compensation Table
| | |
Fiscal | | |
Salary | | |
Option
Awards | | |
Non-Equity
Incentive
Compensation | | |
All
Other
Compensation | | |
Total | |
| Name
and Principal Position | |
Year | | |
($) | | |
($) | | |
($) | | |
($) | | |
($) | |
| Cipora Lavut | |
| 2024 | | |
| 204,713 | (1) | |
| - | | |
| - | | |
| - | | |
| 204,713 | |
| President | |
| 2023 | | |
| 269,315 | (2) | |
| - | | |
| - | | |
| | | |
| 269,315 | |
| | |
| | | |
| | | |
| | | |
| | | |
| | | |
| | |
| Gary Campbell | |
| 2024 | | |
| 94,154 | (3) | |
| - | | |
| - | | |
| - | | |
| 94,154 | |
| Chief Financial Officer | |
| | | |
| | | |
| | | |
| | | |
| | | |
| | |
| (1) |
For Fiscal 2024, Ms. Lavut
has been accruing an annual salary of $250,000 and has been paid $204,713 in cash over the same period, deferring the balance. |
| (2) |
For Fiscal 2023, Ms. Lavut
has been accruing an annual salary of $250,000 and has been paid $269,315 in cash over the same period, as she was paid out a portion
of her previously deferred wages balance. |
| (3) |
For Fiscal 2024, Mr. Campbell
began serving as Chief Financial Officer in August 2023. The amount in the table represents the pro rata compensation received for
the seven-month period since his appointment. |
Outstanding Equity Awards at 2024 Fiscal Year-End
The Board of Directors and
Executive Officers have been granted various options to acquire the Company’s common stock under the Company’s 2011 Directors
and Executive Officers Stock Option Plan (the “2011 Plan”) as detailed in the table below. All of these options were outstanding
as of February 29, 2024.
| | |
Stock
Options &
Warrants
Outstanding | | |
Weighted
Average
Remaining
Contractual Life
in Years | | |
Weighted
Average Exercise
Price of Options
& Warrants
Outstanding | |
| Cipora
Lavut, President and Board Chair | |
| 750,000 | | |
| 2.67 | | |
$ | 0.42 | |
| Salvador Diaz-Verson,
Jr., Director | |
| 750,000 | | |
| 1.77 | | |
$ | 0.61 | |
| Gary Douglas,
Director | |
| 500,000 | | |
| 1.82 | | |
$ | 0.58 | |
| David Mann,
Director | |
| 400,000 | | |
| 2.32 | | |
$ | 0.25 | |
| Robert Lempert,
Director | |
| 360,000 | | |
| 2.26 | | |
$ | 0.25 | |
Option Exercises and Stock Vesting During Fiscal 2024
No stock options were exercised during Fiscal
2024 by the individuals named in the Summary Compensation Table.
No stock options were granted nor was there any
vesting of previously granted stock options during Fiscal 2024 related to the individuals named in the Summary Compensation Table.
Option Exercises and Stock Vesting During Fiscal 2024
No stock options were exercised
during Fiscal 2024 or Fiscal 2023 by the individuals named in the Summary Compensation Table. Also, during Fiscal 2022, stock options
granted in Fiscal 2021 became fully vested. On December 10, 2020, the Board of Directors approved the grant of an aggregate total of
1,000,000 options to acquire the Company’s common stock to four of the five current Board members in varying amounts for services
provided outside of standard Board responsibilities under the Company’s 2011 Plan. The options were granted with pro rata monthly
vesting over a one-year vesting period, with a five-year expiration term, and with an exercise price of $0.25 per option share.
Employment Contracts, Termination of Employment Contracts and Change
in Control Arrangements
We do not currently have
any employment agreements with any of our Named Executive Officers.
Potential Payments to the Named Executive Officers Upon Termination
or Change in Control
None of the named executive
officers is entitled to any payments or benefits upon termination, whether by change in control or otherwise, other than benefits available
generally to all employees.
ITEM 12. SECURITY OWNERSHIP OF CERTAIN BENEFICIAL OWNERS AND
MANAGEMENT
The following table sets
forth, to the extent of our knowledge, certain information regarding our common stock owned as of February 29, 2024 (i) by each person
who is known to be the beneficial owner of more than 5% of our outstanding common stock, (ii) by each of our Directors and the named
executive officers in the Summary Compensation Table, and (iii) by all Directors and current executive officers as a group:
| Beneficial
Ownership Table | |
| |
| Beneficial
Owner (1) | |
Number
of
Shares of
Common
Stock | | |
Percent
of
Common
Stock | |
| Salvador
Diaz-Verson, Jr. (2) | |
| 819,750 | | |
| * | % |
| Gary Douglas
(3) | |
| 500,000 | | |
| * | % |
| Cipora Lavut
(4) | |
| 2,639,660 | | |
| 2.5 | % |
| Robert Lempert
(5) | |
| 507,343 | | |
| * | % |
| David Mann (6) | |
| 1,811,931 | | |
| 1.7 | % |
| Gary Campbell
(7) | |
| 197,453 | | |
| * | % |
| | |
| | | |
| | |
| All current
executive officers and Directors as a group (six) (2) (3) (4) (5) (6) (7) | |
| 6,476,137 | | |
| 6.0 | % |
| | |
| | | |
| | |
| 5% Stockholders | |
| | | |
| | |
| Warren
Breslow (8) | |
| 9,733,163 | | |
| 9.1 | % |
| BetterSea
LLC (9) | |
| 9,179,912 | | |
| 8.8 | % |
| Robert
Kopple (10) | |
| 6,005,469 | | |
| 5.6 | % |
| * |
Less than 1% of outstanding
shares |
| (1) |
Beneficial ownership is determined in accordance with rules of the Securities and Exchange Commission. The calculation of the percentage of beneficial ownership is based upon 104,591,648 shares of common stock outstanding on February 29, 2024. In computing the number of shares beneficially owned by any stockholder and the percentage ownership of such stockholder, shares of common stock which may be acquired by a such stockholder upon exercise or conversion of warrants or options which are currently exercisable or exercisable within 60 days of February 29, 2024, are deemed to be exercised and outstanding. Such shares, however, are not deemed outstanding for purposes of computing the beneficial ownership percentage of any other person. Shares issuable upon exercise of warrants and options which are subject to stockholder approval are not deemed outstanding for purposes of determining beneficial ownership. Except as indicated by footnote, to our knowledge, the persons named in the table above have the sole voting and investment power with respect to all shares of common stock shown as beneficially owned by them. The mailing address for each of the officers and directors is c/o Aura Systems, Inc., 20431 North Sea, Lake Forest, CA 92630. |
| (2) |
Includes 750,000 warrants exercisable within 60 days of February 29, 2024. |
| (3) |
Includes 500,000 warrants exercisable within 60 days of February 29, 2024 |
| (4) |
Includes 750,000 warrants exercisable within 60 days of February 29, 2024. |
| (5) |
Includes warrants to purchase 360,000 shares exercisable within 60 days of February 29, 2024. |
| (6) |
Includes warrants to purchase 400,000 shares exercisable within 60 days of February 29, 2023, as well as 1,411,931 shares, 979,204 of which Mr. Mann has sole dispositive power and approximately 432,727 of which, Mr. Mann holds a power of attorney to vote such shares. |
| (7) |
Includes common shares only as of February 29, 2024. |
| (8) |
Includes the right to convert $3,000,000 and accrued interest of $863,322 convertible note payable to 2,759,516 common shares at a conversion price of $1.40. |
| (9) |
Includes common shares only as of February 29, 2024. |
| (10) |
Includes warrants to purchase 3,331,664 shares exercisable within 60 days of February 29, 2024. |
Securities Authorized for Issuance Under Equity Compensation
Plans as of February 29, 2024
Equity Compensation Plan Information as of February 29, 2024
| | |
a. | | |
b. | | |
c. | |
| Plan
Category | |
Number
of
Securities to be
Issued Upon
Exercise of
Outstanding
Options,
Warrants
and Rights | | |
Weighted
Average
Exercise
Price
for Options,
Warrants
and Rights | | |
Number
of
Securities
For Future
Issuances
Under Equity
Compensation
Plans
(Excluding Securities
Reflected
in
Column (a.) | |
| Equity
compensation plans approved by equity holders | |
| 3,292,857 | | |
$ | 0.48 | | |
| 10,904,394 | |
| Equity
compensation plans not approved by equity holders | |
| 1,500,000 | | |
$ | 0.50 | | |
| - | |
| (1) |
Reflects options under
the 2006 Stock Option Plan and the 2011 Stock Option Plan, of which both were approved by Company shareholders. Additionally, it
includes options which were authorized by the Board but cannot be issued until the proposal for renewal of the employee stock option
plan is approved by the shareholders. The 2006 Stock Option Plan authorizes the Company to grant stock options exercisable for up
to an aggregate number of shares of common stock equal to the greater of (i) 10,000,000 shares of common stock, or (ii) 10% of the
number of shares of common stock outstanding from time to time. The 2011 Stock Option Plan authorizes the Company to grant stock
options or warrants to executive officers and directors exercisable for up to an aggregate number of shares equivalent to 15% of
the number of shares of common stock outstanding from time to time. The numbers in this table are as of February 29, 2024 (See Note
13 to the Financial Statements). |
For additional information regarding options and
warrants, see Note 13 to our financial statements appearing elsewhere in this report.
ITEM 13. CERTAIN RELATIONSHIPS AND RELATED TRANSACTIONS, AND
DIRECTOR INDEPENDENCE
Review and Approval of Related Party Transactions
Our Audit Committee is responsible
for the review and approval of all related party transactions required to be disclosed to the public under SEC rules. This procedure
has been established by our Board of Directors in order to serve the interests of our shareholders. Related party transactions are reviewed
and approved by the Audit Committee on a case-by-case basis. Under existing, unwritten policy no related party transaction can be approved
by the Audit Committee unless it is first determined that the terms of such transaction is on terms no less favorable to us than could
be obtained from an unaffiliated third party on an arms-length basis and is otherwise in our best interest.
Director Independence
Using the definition of “independence”
included in the listing rules of The Nasdaq Stock Market, our Board has determined that Salvador Diaz-Versón, Jr. and Gary Douglas
are both independent directors.
ITEM 14. PRINCIPAL ACCOUNTING FEES AND DISCLOSURES
Weinberg & Company, P.A.
(“Weinberg”) was engaged to be the Company’s principal accountant and auditor in April 2022. The following table sets
forth the aggregate fees billed to us by Weinberg for the year ended February 29, 2024, and for the year ended February 28, 2023:
| | |
Year
Ended | |
| (amounts
in thousands) | |
February
29,
2024 | | |
February
28,
2023 | |
| Audit Fees | |
$ | 89 | | |
$ | 134 | |
| Audit-related fees | |
| - | | |
| - | |
| Tax fees | |
| - | | |
| - | |
| All other fees | |
| - | | |
| - | |
| Total | |
$ | 89 | | |
$ | 134 | |
As defined by the SEC, (i)
“audit fees” are fees for professional services rendered by our principal accountant for the audit of our annual financial
statements and review of financial statements included in our Form 10-K, or for services that are normally provided by the accountant
in connection with statutory and regulatory filings or engagements for those Fiscal years; (ii) “audit-related fees” are
fees for assurance and related services by our principal accountant that are reasonably related to the performance of the audit or review
of our financial statements and are not reported under “audit fees;” (iii) “tax fees” are fees for professional
services rendered by our principal accountant for tax compliance, tax advice, and tax planning; and (iv) “all other fees”
are fees for products and services provided by our principal accountant, other than the services reported under “audit fees,”
“audit-related fees,” and “tax fees.”
Audit Fees
Services provided to us by
Weinberg with respect the audit of our annual financial statements and review of our annual report on Form 10-K for the year ended February
28, 2023, and for reviews of the financial statements which are included in our quarterly reports on Form 10-Q for the first three quarters
of the year ended February 29, 2024.
Audit Related Fees
Weinberg did not provide
any professional services to us during Fiscal 2024 or Fiscal 2023 which would constitute “audit related fees”.
Tax Fees
Weinberg did not provide
any professional services to us during Fiscal 2024 or Fiscal 2023 which would constitute “tax fees”.
All Other Fees
Weinberg did not provide
any professional services to us during Fiscal 2024 or Fiscal 2023 which would constitute “other fees”.
Policy on Audit Committee Pre-Approval of
Audit and Permissible Non-Audit Services of Independent Auditors
Under the SEC’s rules,
the Audit Committee is required to pre-approve the audit and permissible non-audit services performed by the independent registered public
accounting firm in order to ensure that they do not impair the auditors’ independence. The SEC’s rules specify the types
of non-audit services that an independent auditor may not provide to its audit client and establish the Audit Committee’s responsibility
for administration of the engagement of the independent registered public accounting firm.
Consistent with the SEC’s
rules, the Audit Committee pre-approves all audit and permissible non-audit services provided by our independent auditors. These services
may include audit services, audit-related services, tax and other services. Pre-approval is generally provided for up to one year, and
any pre-approval is detailed as to the particular service or category of services and is generally subject to a specific budget. The
independent auditors and management are required to periodically report to the Audit Committee regarding the extent of services provided
by the independent auditors in accordance with this pre-approval, and the fees for the services performed to date. The Audit Committee
may also pre-approve particular services on a case-by-case basis. During Fiscal 2024 and Fiscal 2023 all services provided by Weinberg
were pre-approved by the Audit Committee in accordance with this policy.
There were no hours expended
on the principal accountant’s engagement to audit the registrant’s financial statements for the most recent Fiscal year that
were attributed to work performed by persons other than the principal accountant’s full-time, permanent employees.
PART IV
ITEM 15. EXHIBITS, FINANCIAL STATEMENT SCHEDULES
Documents filed as part of this Form 10-K:
See Index to Financial Statements at page F-1
| 2. |
Financial Statement
Schedules |
See Index to Financial Statements at page F-1
See Exhibit Index
ITEM 16. FORM 10-K SUMMARY
None.
INDEX TO EXHIBITS
Description of Documents
| 3.1 |
|
Amended and Restated Certificate of Incorporation of Aura Systems, Inc. (Incorporated by reference to Exhibit 3.1 to Aura Systems, Inc.’s Form 10-K filed on June 15, 2009) |
| 3.1(a) |
|
Certificate of Amendment to the Amended and Restated Certificate of Incorporation, dated February 14, 2018 (Incorporated by reference to Exhibit 3.1 to Aura Systems, Inc.’s Current Report on Form 8-K filed on February 21, 2018) |
| 3.2 |
|
Amended and Restated Bylaws of Aura Systems, Inc. (Incorporated by reference to Exhibit 3.2 to Aura Systems, Inc.’s Report on Form 10-K filed on June 15, 2009) |
| 10.1* |
|
Aura Systems, Inc. 2006 Stock Option Plan (Incorporated by reference to Exhibit 10.4 to Aura System, Inc.’s Form 10-K filed on March 25, 2008) |
| 10.2* |
|
Form of Aura Systems, Inc. Non-Statutory Stock Option Agreement (Incorporated by reference to Exhibit 10.5 to Aura System, Inc.’s Form 10-K filed on March 25, 2008) |
| 10.3 |
|
Second Amendment to Transaction Documents dated March 14, 2017 among Registrant and those persons who have signed the signature page thereto (Incorporated by reference to Exhibit 10.1 to Aura Systems, Inc.’s Quarterly Report on Form 10-Q filed on October 25, 2017) |
| 10.4 |
|
Third Amendment to Transaction Documents dated April 8, 2017 among Registrant and those persons who have signed the signature page thereto (Incorporated by reference to Exhibit 10.2 to Aura Systems, Inc.’s Quarterly Report on Form 10-Q filed on October 25, 2017) |
| 10.5 |
|
Second Amendment to Debt Refinancing Agreement dated April 9, 2017 by and between Aura Systems, Inc., on the one hand, and Warren Breslow and the Survivor’s Trust Under the Warren L. Breslow Trust, on the other hand (Incorporated by reference to Exhibit 10.3 to Aura Systems, Inc.’s Quarterly Report on Form 10-Q filed on October 25, 2017) |
| 10.6 |
|
First Amendment to Unsecured Convertible Promissory Note dated June 15, 2017 by and between the Survivor’s Trust Under the Warren L. Breslow Trust and the Registrant (Incorporated by reference to Exhibit 10.1 to Aura Systems, Inc.’s Quarterly Report on Form 10-Q filed on October 25, 2017) |
| 10.7 |
|
Agreement entered into on June 19, 2017 between Aura Systems Inc. and BetterSea LLC (Incorporated by reference to Exhibit 10.1 to Aura Systems, Inc.’s Current Report on Form 8-K/A filed on May 9, 2018) |
| 10.11 |
|
Sino-Foreign Cooperative Joint Venture Contract dated January 27, 2017 between Aura Systems, Inc. and Jiangsu AoLunTe Electrical Machinery Industrial Col, Ltd. (Incorporated by reference to Exhibit 10.1 to Aura Systems, Inc.’s Form 8-K filed on February 1, 2017) |
| 10.12* |
|
Aura Systems, Inc. Directors and Executive Officers Stock Option Plan (Incorporated by reference to Exhibit 10.67 to Aura Systems, Inc.’s Form S-1 filed on November 30, 2011) |
| 14.1 |
|
Code of Ethics (Incorporated by reference to Exhibit 14.1 to Aura Systems, Inc.’s Annual Report on Form 10-K filed on June 13, 2018) |
| 31.1 |
|
CEO Certification pursuant to Section 906 of the Sarbanes-Oxley Act of 2002 |
| 31.2 |
|
CFO Certification pursuant to Section 906 of the Sarbanes-Oxley Act of 2002 |
| 32.1 |
|
Certification pursuant to 18 U.S.C. Section 1350 |
| 101.INS |
|
Inline XBRL Instance Document |
| 101.SCH |
|
Inline XBRL Taxonomy Extension Schema Document |
| 101.CAL |
|
Inline XBRL Taxonomy Extension Calculation Linkbase Document |
| 101.DEF |
|
Inline XBRL Taxonomy Extension Definition Linkbase Document |
| 101.LAB |
|
Inline XBRL Taxonomy Extension Label Linkbase Document |
| 101.PRE |
|
Inline XBRL Taxonomy Extension Presentation Linkbase Document |
| 104 |
|
Cover Page Interactive Data File (formatted as Inline XBRL and contained in Exhibit 101) |
| * |
Indicates a management
contract or compensatory plan or arrangement. |
In accordance with SEC Release 33-8238,
Exhibit 32.1 and 32.2 are being furnished and not filed.
Furnished herewith. XBRL (Extensible
Business Reporting Language) information is furnished and not filed or a part of a registration statement or prospectus for purposes
of Sections 11 or 12 of the Securities Act of 1933, as amended, is deemed not filed for purposes of Section 18 of the Securities Exchange
Act of 1934, as amended, and otherwise is not subject to liability under these sections.
Signatures
Pursuant to the requirements of Section 13 or 15 (d) of the Securities
Exchange Act of 1934, the registrant has duly caused this report to be signed on its behalf by the undersigned, thereunto duly authorized.
AURA SYSTEMS, INC.
Dated: June 4, 2024
| By: |
/s/
Cipora Lavut |
|
| |
Cipora Lavut |
|
| |
President |
|
Pursuant to the requirements of the Securities
Exchange Act of 1934, this report has been signed below by the following persons on behalf of the registrant and in the capacities and
on the date indicated.
| Signatures |
|
Title |
|
Date |
| |
|
|
|
|
| /s/ Cipora Lavut |
|
President (Principal Executive Officer), Board Chair |
|
June 4, 2024 |
| Cipora Lavut |
|
|
|
|
| |
|
|
|
|
| /s/ Gary Campbell |
|
Chief Financial Officer (Principal Financial Officer) |
|
June 4, 2024 |
| Gary Campbell |
|
|
|
|
| |
|
|
|
|
| /s/ David Mann |
|
Director |
|
June 4, 2024 |
| David Mann |
|
|
|
|
| |
|
|
|
|
| /s/ Robert Lempert |
|
Director |
|
June 4, 2024 |
| Robert Lempert |
|
|
|
|
| |
|
|
|
|
| /s/ Gary Douglas |
|
Director |
|
June 4, 2024 |
| Gary Douglas |
|
|
|
|
| |
|
|
|
|
| /s/ Salvador Diaz-Verson, Jr. |
|
Director |
|
June 4, 2024 |
| Salvador Diaz-Verson, Jr. |
|
|
|
|
Index to Financial Statements
REPORT OF INDEPENDENT REGISTERED PUBLIC ACCOUNTING
FIRM
To the Stockholders and the Board of Directors
of Aura Systems, Inc.
Opinion on the Financial Statements
We have audited the accompanying balance sheets
of Aura Systems, Inc. (the “Company”) as of February 29, 2024, and February 28, 2023, the related statements of operations,
stockholders’ deficit, and cash flows for the years then ended, and the related notes (collectively referred to as the “financial
statements”). In our opinion, the financial statements present fairly, in all material respects, the financial position of the Company
as of February 29, 2024, and February 28, 2023, and the results of its operations and its cash flows for the years then ended, in conformity
with accounting principles generally accepted in the United States of America.
Going Concern
The accompanying financial statements have been
prepared assuming that the Company will continue as a going concern. As discussed in Note 1 to the financial statements, during the year
ended February 29, 2024, the Company incurred a net loss of $4.2 million, used cash in operations of $3 million, and at February 29, 2024,
had a stockholders’ deficit of $21.5 million. In addition, at February 29, 2024, notes payable and related accrued interest with
an aggregate balance of $6.7 million have reached maturity and are past due. These matters raise substantial doubt about the Company’s
ability to continue as a going concern. Management’s plans in regard to these matters are also described in Note 1 to the financial
statements. The financial statements do not include any adjustments that might result from the outcome of this uncertainty.
Basis for Opinion
These financial statements are the responsibility
of the Company’s management. Our responsibility is to express an opinion on the Company’s financial statements based on our
audits. We are a public accounting firm registered with the Public Company Accounting Oversight Board (United States) (“PCAOB”)
and are required to be independent with respect to the Company in accordance with the U.S. federal securities laws and the applicable
rules and regulations of the Securities and Exchange Commission and the PCAOB.
We conducted our audits in accordance with the
standards of the PCAOB. Those standards require that we plan and perform the audit to obtain reasonable assurance about whether the financial
statements are free of material misstatement, whether due to error or fraud. The Company is not required to have, nor were we engaged
to perform, an audit of its internal control over financial reporting. As part of our audits, we are required to obtain an understanding
of internal control over financial reporting but not for the purpose of expressing an opinion on the effectiveness of the Company’s
internal control over financial reporting. Accordingly, we express no such opinion.
Our audits included performing procedures to
assess the risks of material misstatement of the financial statements, whether due to error or fraud, and performing procedures that
respond to those risks. Such procedures included examining, on a test basis, evidence regarding the amounts and disclosures in the financial
statements. Our audits also included evaluating the accounting principles used and significant estimates made by management, as well
as evaluating the overall presentation of the financial statements. We believe that our audits provide a reasonable basis for our opinion.
Critical Audit Matter
The critical audit matter communicated below
is a matter arising from the current period audit of the financial statements that was communicated or required to be communicated to
the audit committee and that: (1) relates to accounts or disclosures that are material to the financial statements and (2) involved especially
challenging, subjective, or complex judgments. The communication of critical audit matters does not alter in any way our opinion on the
financial statements, taken as a whole, and we are not, by communicating the critical audit matter below, providing a separate opinion
on the critical audit matters or on the accounts or disclosures to which it relates.
Going Concern Analysis
As described in Note 1 to the financial statements,
for the year ended February 29, 2024, the Company recorded a net loss of $4.2 million, used cash in operations of $3 million, and at February
29, 2024, had a stockholders’ deficit of $21.5 million. In addition, at February 29, 2024, notes payable and related accrued interest
with an aggregate balance of $6.7 million have reached maturity and are past due. The conditions described in Note 1 raise substantial
doubt regarding the Company’s ability to continue as a going concern for a period of at least one year from the date of issuance
of the financial statements.
We identified the going concern analysis and
evaluation of the related disclosures as a critical audit matter because of the significant judgements and assumptions made by management
in developing its cash flow forecast and the risk of bias in management’s judgments and assumptions in estimating these cash flows.
There was a high degree of auditor judgement and subjectivity in performing our procedures to evaluate the reasonableness of the cash
flow forecast.
The primary procedures we performed to address
this critical audit matter included:
| ● | We obtained management’s
cash flow forecast and evaluated the reasonableness of the cash flow forecast by comparing
it to historical operating results, considering management’s ability to accurately
forecast and perform sensitivity analysis on revenue, cash expenditures and commitments. |
| ● | We performed sensitivity
analyses on the projected revenue and operating margins used in the Company’s cash
flow forecast to evaluate the impact on the conclusions reached by management. |
| ● | We assessed the appropriateness
and sufficiency of the disclosures included within the financial statements relating to liquidity
and going concern and compared to other audit evidence obtained to determine whether such
information is consistent with the Company’s disclosures. |
We have served as the Company’s auditor
since 2022.
/s/ Weinberg & Company, P.A.
Los Angeles, California
June 4, 2024
AURA SYSTEMS, INC.
BALANCE SHEETS
| | |
February 29,
2024 | | |
February 28,
2023 | |
| (amounts in thousands, except
share data) | |
| | |
| |
| Assets | |
| | |
| |
| Current assets | |
| | |
| |
| Cash and cash equivalents | |
$ | 124 | | |
$ | 15 | |
| Inventories | |
| 20 | | |
| 155 | |
| Prepaid and other current assets | |
| 175 | | |
| 142 | |
| Total current assets | |
| 319 | | |
| 312 | |
| Property and equipment, net | |
| 378 | | |
| 461 | |
| Operating lease right-of-use asset | |
| 607 | | |
| 816 | |
| Security deposit | |
| 160 | | |
| 160 | |
| Total assets | |
$ | 1,464 | | |
$ | 1,749 | |
| | |
| | | |
| | |
| Liabilities
and Shareholders’ Deficit | |
| | | |
| | |
| Current liabilities | |
| | | |
| | |
| Accounts payable and accrued expenses (including $223 and $226 due to related party, respectively) | |
$ | 2,625 | | |
$ | 2,758 | |
| Accrued interest (including $2,076 and $1,145 due to related party, respectively) | |
| 2,598 | | |
| 1,471 | |
| Customer advances | |
| 447 | | |
| 454 | |
| Notes payable, current portion | |
| 119 | | |
| 92 | |
| Convertible notes payable, current portion-past due | |
| 1,508 | | |
| 1,403 | |
| Convertible note payable-related party-past due | |
| 3,020 | | |
| 3,000 | |
| Notes payable-related parties, current portion (includes $700 past due) | |
| 4,632 | | |
| 4,632 | |
| Operating lease liability, current portion | |
| 238 | | |
| 207 | |
| Derivative warrant liability | |
| - | | |
| 9 | |
| Total current liabilities | |
| 15,187 | | |
| 14,026 | |
| | |
| | | |
| | |
| Notes payable, net of current portion | |
| 286 | | |
| 256 | |
| Note payable-related party, net of current portion | |
| 7,088 | | |
| 7,065 | |
| Operating lease liability, net of current
portion | |
| 423 | | |
| 660 | |
| Total liabilities | |
| 22,984 | | |
| 22,007 | |
| | |
| | | |
| | |
| Commitments and contingencies | |
| - | | |
| - | |
| | |
| | | |
| | |
| Shareholders’
deficit | |
| | | |
| | |
| Common stock: $0.0001 par value; 150,000,000 shares authorized; 104,591,648 and 94,648,346 issued and outstanding at February 29, 2024 and February 28, 2023, respectively. | |
| 10 | | |
| 9 | |
| Additional paid-in capital | |
| 457,460 | | |
| 454,507 | |
| Accumulated deficit | |
| (478,990 | ) | |
| (474,774 | ) |
| Total shareholders’ deficit | |
| (21,520 | ) | |
| (20,258 | ) |
| Total
liabilities and shareholders’ deficit | |
$ | 1,464 | | |
$ | 1,749 | |
See accompanying notes to
these financial statements.
AURA SYSTEMS, INC.
STATEMENTS OF OPERATIONS
| | |
Fiscal
Years Ended | |
| | |
February 29,
2024 | | |
February 28,
2023 | |
| (amounts in thousands, except
share and per share data) | |
| | |
| |
| Net revenue | |
$ | 56 | | |
$ | 71 | |
| Cost of goods sold | |
| 193 | | |
| 88 | |
| Gross loss | |
| (137 | ) | |
| (17 | ) |
| Operating expenses: | |
| | | |
| | |
| Engineering, research and development (including $151 and $150 to related party, respectively) | |
| 750 | | |
| 850 | |
| Selling, general and administration | |
| 1,873 | | |
| 2,636 | |
| Total operating expenses | |
| 2,623 | | |
| 3,486 | |
| Loss from operations | |
| (2,760 | ) | |
| (3,503 | ) |
| Other income (expense): | |
| | | |
| | |
| Interest expense, net (including $1,064 and $545 to related parties, respectively) | |
| (1,465 | ) | |
| (727 | ) |
| Gain on extinguishment of derivative warrant liability | |
| - | | |
| 237 | |
| Change in fair value of derivative warrant liability | |
| 9 | | |
| 582 | |
| Other income | |
| - | | |
| 1 | |
| Net loss | |
$ | (4,216 | ) | |
$ | (3,410 | ) |
| | |
| | | |
| | |
Basic and diluted loss per share | |
$ | (0.04 | ) | |
$ | (0.04 | ) |
Basic and diluted weighted-average shares outstanding | |
| 99,379,779 | | |
| 88,947,803 | |
See accompanying notes to
these financial statements.
AURA SYSTEMS INC.
STATEMENTS OF SHAREHOLDERS’ DEFICIT
(in thousands, except share data)
| | |
Common
Stock
Shares | | |
Common
Stock
Amount | | |
Additional
Paid-In
Capital | | |
Accumulated
Deficit | | |
Total
Shareholders’
Deficit | |
| Balance, February 28, 2022 | |
| 83,119,104 | | |
$ | 8 | | |
$ | 450,137 | | |
$ | (471,364 | ) | |
$ | (21,219 | ) |
| | |
| | | |
| | | |
| | | |
| | | |
| | |
| Common shares issued for cash | |
| 11,529,242 | | |
| 1 | | |
| 3,269 | | |
| - | | |
| 3,270 | |
| Fair value of warrants issued for note settlement | |
| - | | |
| - | | |
| 1,051 | | |
| - | | |
| 1,051 | |
| Fair value of warrants issued for services | |
| | | |
| | | |
| 50 | | |
| | | |
| 50 | |
| Net loss | |
| - | | |
| - | | |
| - | | |
| (3,410 | ) | |
| (3,410 | ) |
| Balance, February 28, 2023 | |
| 94,648,346 | | |
| 9 | | |
| 454,507 | | |
| (474,774 | ) | |
| (20,258 | ) |
| | |
| | | |
| | | |
| | | |
| | | |
| | |
| Common shares issued for cash | |
| 9,918,302 | | |
| 1 | | |
| 2,942 | | |
| - | | |
| 2,943 | |
| Common shares issued for services | |
| 25,000 | | |
| - | | |
| 6 | | |
| - | | |
| 6 | |
| Fair value of warrants issued with convertible notes payable | |
| - | | |
| - | | |
| 5 | | |
| - | | |
| 5 | |
| Net loss | |
| | | |
| | | |
| | | |
| (4,216 | ) | |
| (4,216 | ) |
| Balance, February 29, 2024 | |
| 104,591,648 | | |
$ | 10 | | |
$ | 457,460 | | |
$ | (478,990 | ) | |
$ | (21,520 | ) |
See accompanying notes to
these financial statements.
AURA SYSTEMS, INC.
STATEMENTS OF CASH FLOWS
| | |
Fiscal Years Ended | |
| | |
February 29,
2024 | | |
February 28,
2023 | |
| (amounts in thousands) | |
| | |
| |
| Net loss | |
$ | (4,216 | ) | |
$ | (3,410 | ) |
| Adjustments to reconcile net loss to cash used in operating activities | |
| | | |
| | |
| Depreciation | |
| 105 | | |
| 78 | |
| Inventory write-down | |
| 123 | | |
| 4 | |
| Gain on extinguishment of derivative warrant liability, net | |
| - | | |
| (237 | ) |
| Change in fair value of derivative warrant liability | |
| (9 | ) | |
| (582 | ) |
| Common stock issued for services | |
| 6 | | |
| - | |
| Amortization of debt discount | |
| 4 | | |
| - | |
| Common stock warrants issued for services | |
| - | | |
| 50 | |
| Changes in operating assets and liabilities: | |
| | | |
| | |
| | |
| | | |
| | |
| Inventory | |
| 12 | | |
| (15 | ) |
| Prepaid and other current assets | |
| (33 | ) | |
| 114 | |
| Operating lease right-of-use asset | |
| 209 | | |
| 184 | |
| Accounts payable and accrued expenses | |
| (133 | ) | |
| 364 | |
| Accrued interest on notes payable | |
| 1,150 | | |
| 492 | |
| Customer advances | |
| (7 | ) | |
| 14 | |
| Operating lease liability | |
| (206 | ) | |
| (179 | ) |
| Cash used in operating activities | |
| (2,995 | ) | |
| (3,123 | ) |
| | |
| | | |
| | |
| Cash used in investing activities: | |
| | | |
| | |
| Purchase of property and equipment | |
| (22 | ) | |
| (54 | ) |
| | |
| | | |
| | |
| Cash flows from financing activities: | |
| | | |
| | |
| Proceeds from issuance of common stock | |
| 2,943 | | |
| 3,270 | |
| Proceeds from issuance of notes payable | |
| 281 | | |
| - | |
| Principal payments of notes payable | |
| (98 | ) | |
| (228 | ) |
| Cash provided by financing activities | |
| 3,126 | | |
| 3,042 | |
| | |
| | | |
| | |
| Net increase (decrease) in cash and cash equivalents | |
| 109 | | |
| (135 | ) |
| Cash and cash equivalents-beginning of year | |
| 15 | | |
| 150 | |
| Cash and cash equivalents-end of year | |
$ | 124 | | |
$ | 15 | |
| Cash paid for: | |
| | | |
| | |
| Interest | |
$ | 185 | | |
$ | 166 | |
| | |
| | | |
| | |
| Supplemental schedule of non-cash transactions: | |
| | | |
| | |
| Fair value of warrants issued for note payable | |
$ | 5 | | |
$ | - | |
| Fair value of warrants issued for note settlement | |
$ | - | | |
$ | 1,051 | |
See accompanying notes to these financial statements.
AURA SYSTEMS, INC.
NOTES TO FINANCIAL STATEMENTS
Years ended February 29, 2024, and February
28, 2023
(In thousands, except share and per share amounts)
NOTE 1 – ORGANIZATION AND OPERATIONS
Aura Systems, Inc., (“Aura”,
“We” or the “Company”) a Delaware corporation, is engaged in the development, commercialization, and sale of products,
systems, and components, using its patented and proprietary electromagnetic technology. Aura develops and sells AuraGen® axial
flux mobile induction power systems to the industrial, commercial, and defense mobile power generation markets.
Going Concern
The accompanying financial
statements have been prepared assuming that the Company will continue as a going concern. In accordance with Accounting Standards
Codification (“ASC”) 205-40, Going Concern, the Company’s management has evaluated whether there are conditions
and events, considered in the aggregate, that raise substantial doubt about the Company’s ability to continue as a going concern
within one year after the date the accompanying financial statements were issued. During the fiscal year ended February 29, 2024, the
Company incurred a net loss of $4.2 million, used cash in operating activities of $3 million, and at February 29, 2024, had a stockholders
deficit of $21.5 million. In addition, at February 29, 2024, notes payable and related accrued interest with an aggregate balance of $6.7
million have reached maturity and are past due. These factors raise substantial doubts about the Company’s ability to continue as
a going concern within one year of the date that these financial statements are issued. The accompanying financial statements do not include
any adjustments that might be necessary if the Company is unable to continue as a going concern.
Subsequent to February 29,
2024, the Company issued 4,455,600 shares of common stock in exchange for cash proceeds of $1.1 million. The Company’s ability to
continue as a going concern is dependent upon its ability to continue to implement its business plan. During the next twelve months we
intend to continue to attempt to increase the Company’s sale of our AuraGen®/VIPER products both domestically
and internationally and to add to our existing management team. In addition, we plan to continue to rebuild the engineering and sales
teams, and to the extent appropriate, utilize third party contractors to support the operation. No assurance can be given that any future
financing will be available or, if available, that it will be on terms that are satisfactory to the Company. Even if the Company is able
to obtain additional financing, if needed, it may contain undue restrictions on its operations, in the case of debt financing, or cause
substantial dilution for its stockholders, in the case of equity financing. In the event the Company is unable to generate profits and
is unable to obtain financing for its working capital requirements, it may have to curtail its business further or cease business altogether.
NOTE 2 – SUMMARY OF SIGNIFICANT ACCOUNTING POLICIES
Use of Estimates
The preparation of financial
statements in conformity with GAAP requires management to make estimates and assumptions that affect the reported amounts of assets and
liabilities at the date of the financial statements, and the reported amounts of revenue and expenses during the reported periods. Significant
estimates include assumptions made for inventory reserve, impairment testing of long-lived assets, the realizability of deferred tax
assets and the related valuation allowance, assumptions used in valuing derivative liabilities, notes payable, assumptions used in valuing
share-based compensation, and accruals for potential liabilities. Amounts could materially change in the future.
Revenue Recognition
The Company recognizes revenue
in accordance with Financial Accounting Standard Board’s (“FASB”) Accounting Standards Codification (“ASC”)
Topic 606, Revenue from Contracts with Customers. To determine revenue recognition under ASC 606, an entity performs the following
five-steps (i) identifies the contract(s) with a customer; (ii) identifies the performance obligations in the contract; (iii) determines
the transaction price; (iv) allocates the transaction price to the performance obligations in the contract; and (v) recognizes revenue
when (or as) the entity satisfies a performance obligation. The Company only applies the five-steps to contracts when it is probable
that the entity will collect the consideration it is entitled to in exchange for the goods or services it transfers to the customer.
Our primary source of revenue
is the manufacture and delivery of generator sets used primarily in mobile power applications, which represented nearly 100% of our revenues
of $56 and $71 for the fiscal years ended February 29, 2024, and February 28, 2023, respectively. Our principal sales channel is sales
to a domestic distributor.
In accordance with ASC 606,
we recognize revenue, net of discounts, for our generator sets at time of product delivery to the domestic distributor (i.e. point-in-time),
which also corresponds to the passage of legal title to the customer and the satisfaction of our performance obligations to the customer.
Our payment terms are cash payment due upon delivery and typically includes a 2% price discount off the selling price in accordance with
this policy. Our commercial terms and conditions do not include a right of return for reasons other than a defect in performance or quality.
We offer a 24-month assurance-type warranty covering material and manufacturing defects, which we account for under the guidance of ASC
460, Guarantees. We have a limited history of sales and warranty claims, and, as such, we have not recorded a warranty liability
on our balance sheets at February 29, 2024 and February 28, 2023, respectively; however, we expect warranty claims to be immaterial.
Cost of Goods Sold
Cost of goods sold primarily
consists of the salaries of certain employees and contractors, purchase price of consumer products, packaging supplies, inventory reserve
and customer shipping and handling expenses. Shipping costs to receive products from our suppliers are included in our inventory and
recognized as cost of revenue upon sale of products to our customers.
Cash and Cash Equivalents
Cash and equivalents include
cash on hand and cash in time deposits, certificates of deposit and all highly liquid debt instruments with original maturities of three
months or less.
Inventories
Inventories are valued at
the lower of cost (first-in, first-out) or net realizable value, on an average cost basis. We review the components of inventory on a
regular basis for excess or obsolete inventory based on estimated future usage and sales. When evidence exists that the net realizable
value of inventory is lower than its cost, the difference is recognized as a loss in the period in which it occurs. Once inventory has
been written down, it creates a new cost basis for inventory that may not be subsequently written up. During the years ended February
29, 2024, and February 28, 2023, the Company wrote-down inventories of $123 and $4, respectively.
Property and Equipment
Property and equipment are
recorded at historical cost and depreciated on a straight-line basis over their estimated useful lives of approximately three years up
to ten years once the individual assets are placed in service. Leasehold improvements are amortized over the shorter of the useful life
or the remaining period of the applicable lease term.
Management assesses the carrying
value of property and equipment whenever events or changes in circumstances indicate that the carrying value may not be recoverable.
If there is an indication of impairment, management prepares an estimate of future cash flows expected to result from the use of the
asset and its eventual disposition. If these cash flows are less than the carrying amount of the asset, an impairment loss is recognized
to write down the asset to its estimated fair value at that time. At February 29, 2024 and February 28, 2023, management determined there
were no impairments of the Company’s property and equipment.
Impairment of Long-lived Assets
The Company reviews its property
and equipment, right-of-use asset, and other long-lived assets, for impairment whenever events or changes in circumstances indicate that
the carrying amount of an asset group may not be recoverable. Recoverability is measured by a comparison of the carrying amount of an
asset to the estimated undiscounted future cash flows expected to be generated by the asset. If the carrying amount of an asset exceeds
its estimated undiscounted future cash flows, an impairment charge is recognized by the amount by which the carrying amount of the asset
exceeds the fair value of the assets. Fair value is generally determined using the asset’s expected future discounted cash flows
or market value, if readily determinable. For the years ended February 29, 2024, and February 28, 2023, the Company had no impairment
of long-lived assets.
Leases
The Company determines whether
a contract is, or contains, a lease at inception. Right-of-use assets represent the Company’s right to use an underlying asset
during the lease term, and lease liabilities represent the Company’s obligation to make lease payments arising from the lease.
Right-of-use assets and lease liabilities are recognized at lease commencement based upon the estimated present value of unpaid lease
payments over the lease term. The Company uses its incremental borrowing rate based on the information available at lease commencement
in determining the present value of unpaid lease payments.
Customer Advances
Customer advances represent
consideration received from customers under revenue contracts for which the Company has not yet delivered to the customer the ordered
goods or services.
Concentration of Credit and Other Risks
Financial instruments that
potentially subject the Company to concentrations of credit risk consist of cash and accounts receivable. Cash is deposited with a limited
number of financial institutions. The balances held at any one financial institution at times may be in excess of Federal Deposit Insurance
Corporation (“FDIC”) insurance limits of up to $250. We have not experienced any losses in such accounts and believe we are
not exposed to any significant risk on cash and cash equivalents.
During the year ended February
29, 2024, one customer accounted for 55% and one customer accounted for 12% of revenues. During the year ended February 28, 2023, one
customer accounted for 55% and one customer accounted for 10% of revenues.
As of February 29, 2024,
four vendors accounted for 42%, 11%, 11% and 10% of accounts payable. As of February 28, 2023, four vendors accounted for 38%, 13%, 10%
and 10% of accounts payable.
Research and Development
The Company engages in research
and development to stay current with changes in vehicle manufacture and design and to maintain an advantage over potential competition.
Research and development expenses relate primarily to the development, design, and testing of preproduction prototypes and models and
are expensed as incurred. Research and development costs for Fiscal 2024 and 2023 were approximately $750 and $850, respectively.
Share-Based Compensation
The Company periodically
issues stock options and warrants, and shares of common stock to employees and non-employees in non-capital raising transactions for
services and for financing costs. Share-based compensation cost is measured at the grant date, based on the estimated fair value of the
award, and is recognized as expense over the requisite service period. Recognition of compensation expense for non-employees is in the
same period and manner as if the Company had paid cash for services.
Income Taxes
The Company uses an asset
and liability approach for accounting and reporting for income taxes that allows recognition and measurement of deferred tax assets based
upon the likelihood of realization of tax benefits in future years. Under the asset and liability approach, deferred taxes are provided
for the net tax effects of temporary differences between the carrying amounts of assets and liabilities for financial reporting purposes
and the amounts used for income tax purposes. A valuation allowance is provided for deferred tax assets if it is more likely than not
these items will either expire before the Company is able to realize their benefits, or that future deductibility is uncertain. The Company’s
policy is to recognize interest and/or penalties related to income tax matters in income tax expense.
Derivative Warrant Liability
The Company evaluates its
financial instruments to determine if such instruments are derivatives or contain features that qualify as embedded derivatives. For
derivative financial instruments that are accounted for as liabilities, the derivative instrument is initially recorded at its fair value
and is then re-valued at each reporting date, with changes in the fair value reported in the statements of operations. The classification
of derivative instruments, including whether such instruments should be recorded as liabilities or as equity, is evaluated at the end
of each reporting period. Derivative instrument liabilities are classified in the balance sheet as current or non-current based on whether
or not net-cash settlement of the derivative instrument could be required within 12 months of the balance sheet date.
The Company uses Level 3
inputs for its valuation methodology for the derivative liabilities as their fair values were determined by using a Binomial pricing
model. The Company’s derivative liabilities are adjusted to reflect fair value at each reporting date, with any increase or decrease
in the fair value being recorded in the statement of operations.
Fair Value of Financial Instruments
The Company determines the
fair values of its financial instruments based on a fair value hierarchy, which requires an entity to maximize the use of observable
inputs and minimize the use of unobservable inputs when measuring fair value. The classification of a financial asset or liability within
the hierarchy is based upon the lowest level input that is significant to the fair value measurement. Under ASC 820, Fair Value Measurement
and Disclosures (“ASC 820”), the fair value hierarchy prioritizes the inputs into three levels that may be used to measure
fair value:
| |
● |
Level 1 – Quoted
prices (unadjusted) for identical assets and liabilities in active markets; |
| |
● |
Level 2 – Inputs
other than quoted prices in active markets for identical assets and liabilities that are observable either directly or indirectly;
and |
| |
● |
Level 3 – Unobservable
inputs. |
The recorded amounts of inventory,
other current assets, accounts payable, and accrued expenses approximate their fair value due to their short-term nature. The carrying
amounts of notes payable and convertible notes payable approximate their respective fair values because of their current interest rates
payable in relation to current market conditions.
The
following table sets forth by level, within the fair value hierarchy, the Company’s assets and liabilities at fair value as of
February 29, 2024, and February 28, 2023:
| |
|
February
29, 2024 |
|
| |
|
Level
1 |
|
|
Level
2 |
|
|
Level
3 |
|
|
Total |
|
| (amounts in thousands) |
|
|
|
|
|
|
|
|
|
|
|
|
| Liabilities |
|
|
|
|
|
|
|
|
|
|
|
|
| Derivative warrant liability |
|
$ |
- |
|
|
$ |
- |
|
|
$ |
- |
|
|
$ |
- |
|
| Total |
|
$ |
- |
|
|
$ |
- |
|
|
$ |
- |
|
|
$ |
- |
|
| |
|
February
28, 2023 |
|
| |
|
Level
1 |
|
|
Level
2 |
|
|
Level
3 |
|
|
Total |
|
| Liabilities |
|
|
|
|
|
|
|
|
|
|
|
|
| Derivative warrant liability |
|
$ |
- |
|
|
$ |
- |
|
|
$ |
9 |
|
|
$ |
9 |
|
| Total |
|
$ |
- |
|
|
$ |
- |
|
|
$ |
9 |
|
|
$ |
9 |
|
The Company estimated the
fair value of the derivative warrant liability using the Binomial Model (see Note 12).
Reclassifications
Certain February 28, 2023 balances have been reclassified to
conform with the February 29, 2024 presentation. In presenting the Company’s balance sheet at February 28, 2023, the Company originally
presented accrued interest of $1,389 and accrued payroll and other expenses of $441, totaling $1,830 as a separate line item
called Accrued Expenses. In addition, $82 of accrued interest was included in notes payable-related parties, current portion. In
presenting the Company’s balance sheet at February 29, 2024, the Company has reclassified the balance of accrued interest of $1,471 as
a separate line item, and the balance of accrued payroll and other expenses of $441 as part of accounts payable and accrued expense
and reduced notes payable-related parties, current portion by $82.
Earnings (loss) per share
The Company’s earnings
(loss) per share amounts have been computed based on the weighted-average number of shares of common stock outstanding for the period.
Basic earnings (loss) per share is computed by dividing net earnings (loss) available to common shareholders by the weighted average
number of shares of common stock outstanding during the period. Diluted earnings (loss) per share is computed by dividing net earnings
(loss) available to common shareholders by the weighted average number of shares of common stock assuming all potential shares had been
issued, and the additional shares of common stock were dilutive. Diluted earnings (loss) per share reflects the potential dilution, using
the as-if-converted method for convertible debt, and the treasury stock method for options and warrants, which could occur if all potentially
dilutive securities were exercised.
The following information
sets forth the computation of basic and diluted net increase in the Company’s net assets per share resulting from operations for
the years ended February 29, 2024, and February 28, 2023:
| | |
Year
Ended
February 29, | |
| | |
2024 | | |
2023 | |
| (amounts in thousands, except
share and per share data) | |
| | |
| |
| Numerator | |
| | |
| |
| Net loss | |
| (4,216 | ) | |
| (3,410 | ) |
| | |
| | | |
| | |
| Denominator | |
| | | |
| | |
| Denominator for basic weighted average share | |
| 99,380,061 | | |
| 88,947,803 | |
| Earnings (loss)
per share | |
| | | |
| | |
| Basic loss per share: | |
| (0.04 | ) | |
| (0.04 | ) |
| Diluted loss per share | |
| (0.04 | ) | |
| (0.04 | ) |
For the years ended February
29, 2024, and February 28, 2023, the calculations of basic and diluted loss per share are the same because potential dilutive securities
would have had an anti-dilutive effect. The potentially dilutive securities consisted of the following:
| | |
February 29,
2024 | | |
February 28,
2023 | |
| Warrants | |
| 3,521,664 | | |
| 3,564,764 | |
| Options | |
| 4,250,000 | | |
| 4,792,857 | |
| Convertible notes | |
| 4,685,445 | | |
| 3,907,187 | |
| Total | |
| 12,457,109 | | |
| 12,264,808 | |
COVID-19
The
aftermath of the pandemic has had a significant negative impact on our overall operations including revenues, productivity, and liquidity.
The pandemic has resulted in labor shortages, disruptions in the chain of supply, and higher material costs. We believe that COVID-19
will be an ongoing challenge for years to come and to adapt will require us to further globalize our vendors, engineering, and customers.
The Company’s business is directly dependent upon, and correlates closely with, the marketing levels and ongoing business activities
of its existing customers and suppliers. The extent to which COVID-19 may impact the Company’s business activities and capital raising
efforts will depend on future developments, which are uncertain and cannot be predicted.
Inflation
The continuing impact
of higher inflation, the actions by the Federal Reserve to address inflation, create uncertainty about the future economic environment
which will continue to evolve and, we believe, has impacted the Company’s business in 2024 and may continue to impact its business
in 2025. The implications of higher government deficits and debt, tighter monetary policy, and potentially higher long-term interest rates
may drive a higher cost of capital for the business and an increase in the Company’s operating expenses.
Segments
Under
ASC 280, Segment Reporting, operating segments are defined as components of an enterprise where discrete financial information
is available that is evaluated regularly by the chief operating decision maker (“CODM”), in deciding how to allocate resources
and in assessing performance. The Company’s operating segment consists of one component, and the Company’s Chief Executive
Officer, who is also the CODM, makes decisions and manages the Company’s operations as a single operating segment.
Recently Issued Accounting Pronouncements
In September 2016, the FASB
issued ASU 2016-13, Measurement of Credit Losses on Financial Instruments. ASU 2016-13 requires entities to use a forward-looking
approach based on current expected credit losses (“CECL”) to estimate credit losses on certain types of financial instruments,
including trade receivables. This may result in the earlier recognition of allowances for losses. The Company adopted ASU 2016-13 on
March 1, 2023, and there was no impact of the new guidance and related codification improvements to the Company’s financial position,
results of operations and cash flows.
Other recent accounting pronouncements
and guidance issued by the FASB, including its Emerging Issues Task Force, the American Institute of Certified Public Accountants, and
the Securities and Exchange Commission (the “SEC”) did not or are not believed by management to have a material impact on
the Company’s present or future financial statements.
NOTE 3 – INVENTORIES
Inventories consisted of
the following:
| | |
February 29,
2024 | | |
February 28,
2023 | |
| (amounts in thousands) | |
| | |
| |
| Raw materials | |
$ | 13 | | |
$ | 114 | |
| Work-in-process | |
| 6 | | |
| 22 | |
| Finished goods | |
| 1 | | |
| 19 | |
| | |
| | | |
| | |
| Total inventory | |
$ | 20 | | |
$ | 155 | |
NOTE 4 – PREPAID AND OTHER CURRENT ASSETS
Prepaid and other current
assets consisted of the following:
| | |
February 29,
2024 | | |
February 28,
2023 | |
| (amounts in thousands) | |
| | |
| |
| Prepaid annual software licenses | |
$ | 158 | | |
$ | 92 | |
| Vendor advances | |
| 9 | | |
| 8 | |
| Prepaid insurance | |
| 2 | | |
| 11 | |
| Other prepaid expenses | |
| 6 | | |
| 31 | |
| Total prepaid and other current assets | |
$ | 175 | | |
$ | 142 | |
NOTE 5 – PROPERTY AND EQUIPMENT, NET
Property and equipment consisted
of the following:
| | |
February
29, | |
| | |
2024 | | |
2023 | |
| (amounts in thousands) | |
| | |
| |
| Leasehold improvements | |
$ | 57 | | |
$ | 57 | |
| Machinery and equipment | |
| 301 | | |
| 301 | |
| Vehicle | |
| 96 | | |
| 96 | |
| Computer equipment | |
| 80 | | |
| 80 | |
| Computer software | |
| 22 | | |
| - | |
| Furniture and fixtures | |
| 20 | | |
| 20 | |
| | |
| 576 | | |
| 554 | |
| Less accumulated depreciation and amortization | |
| (198 | ) | |
| (93 | ) |
| | |
$ | 378 | | |
$ | 461 | |
Depreciation expense for the
years ended February 29, 2024, and February 28, 2023 was $105 and $78, respectively.
NOTE 6 – CONVERTIBLE NOTES PAYABLE
Convertible notes payable
consisted of the following:
| | |
February 29,
2024 | | |
February 28,
2023 | |
| (amounts in thousands) | |
| | |
| |
| Convertible notes payable -past due | |
$ | 1,509 | | |
$ | 1,403 | |
| Unamortized debt discount | |
| (1 | ) | |
| - | |
| Net | |
| 1,508 | | |
| 1,403 | |
| Non-current | |
| - | | |
| - | |
| Current | |
$ | 1,508 | | |
$ | 1,403 | |
In
Fiscal 2013 and 2014, the Company issued six convertible notes payable in the aggregate of $4,000. The notes are unsecured, bear interest
at 5% per annum and are convertible to shares of common stock at a conversion price of $1.40 per share, as adjusted. The notes were originally
due in 2014 to 2017 and were all amended in 2018 and the maturity date for all the notes was changed to January 11, 2023. As of February
28, 2023, outstanding balance of the convertible notes payable amounted to $1,403
During
the year ended February 29, 2024, the Company issued convertible notes payable in the aggregate of $106 in exchange for cash. The notes
are unsecured, bear interest at 10% per annum and are convertible to shares of common stock at a conversion price of $0.20 per share and
matured in March 2024. As part of the offering, the Company also granted the note holders warrants to purchase 50,000 shares of common
stock. The warrants are exercisable at $0.50 per share, will expire in 1.5 years from grant date and with an estimated fair value of $5
using the BlackScholes Option Pricing Model. The Company accounted the fair value of the warrants as a debt discount and is being amortized
to interest expense over the term of the convertible notes payable.
As
of February 29, 2024, the outstanding balance of the convertible notes payable amounted to $1,509 and unamortized debt discount of $1,
for a net balance of $1,508. As of February 29, 2024, the convertible notes of $1,403 have reached maturity and are past due. As of the
date of this report, the entire convertible notes payable of $1,509 are past due and the Company is in negotiations with the noteholders
to convert or settle these convertible notes payable.
NOTE 7 – CONVERTIBLE NOTE PAYABLE-RELATED
PARTY
Convertible note payable
– related party consisted of the following:
| | |
February 29, 2024 | | |
February 28, 2023 | |
| (amounts in thousands) | |
| | |
| |
| Convertible note payable -past due | |
$ | 3,020 | | |
$ | 3,000 | |
| Non-current | |
| - | | |
| - | |
| Current | |
$ | 3,020 | | |
$ | 3,000 | |
On
January 24, 2017, the Company entered into a debt refinancing agreement with a former director and current shareholder of the Company.
As part of the agreement, the Company issued a $3,000 convertible note. The convertible note is unsecured, bears interest at 5% per annum,
was due February 2, 2023, and is convertible into shares of common stock at a conversion price of $1.40 per share, as adjusted. As of
February 28, 2023, the outstanding balance of the convertible note payable amounted to $3 million.
During
the year ended February 29, 2024, the Company issued convertible note payable of $20 in exchange for cash. The note is unsecured, bear
interest at 10% per annum and are convertible to shares of common stock at a conversion price of $0.20 per share and matured in March
2024. As part of the offering, the Company also granted the note holder warrants to purchase 10,000 shares of common stock. The warrants
are exercisable at $0.50 per share, will expire in 1.5 years from grant date and with de minimis fair value using the BlackScholes Option
Pricing Model.
As
of February 29, 2024, the convertible note of $3,020, of which, $3,000 is past due. As of the date of this report, the entire convertible
notes payable of $3,020 are past due and the Company is in negotiations with the noteholders to convert or settle these convertible notes
payable.
NOTE 8 – NOTES PAYABLE
Notes payable consisted of
the following:
| | |
February 29, 2024 | | |
February 28, 2023 | |
| (amounts in thousands) | |
| | |
| |
| Secured notes payable | |
| | |
| |
| (a) Note payable-EID loan | |
$ | 150 | | |
$ | 150 | |
| (b) Notes payable-vehicle and equipment | |
| 106 | | |
| 188 | |
| (c) Notes payable-software license | |
| 139 | | |
| - | |
| | |
| | | |
| | |
| Unsecured notes payable | |
| | | |
| | |
| (d) Note payable-other | |
| 10 | | |
| 10 | |
| Total | |
$ | 405 | | |
$ | 348 | |
| Current | |
| (119 | ) | |
| (92 | ) |
| Non-current | |
| 286 | | |
| 256 | |
(a) Economic Injury Disaster (EID) Loan
Entities negatively impacted
by the COVID-19 pandemic were eligible to apply for loans sponsored by the United States Small Business Administration (“SBA”)
Economic Injury Disaster Loan (“EID Loan”) program. On July 1, 2020, the Company received a $150 loan under this program.
The proceeds can be used to fund payroll, healthcare benefits, rent and other qualifying expenses, and the loan is not subject to a loan
forgiveness provision. The loan is due July 1, 2050, interest accrues at 3.75% per annum, and is secured by the assets of the Company.
(b) Notes payable-vehicle and equipment
During Fiscal 2022, the Company
purchased two pieces of equipment and a vehicle for approximately $329 as a part of its efforts to expand its operations and research
and development capacities. The Company made down payments aggregating $41 with the balance financed by two notes payable aggregating
to approximately $288. The notes are secured by the equipment and vehicle purchased. One note is due in 36 equal monthly payments of
approximately $6 each, including interest at 2.9% per annum. The second note is due in 72 equal monthly payments of approximately $1.5
each, including interest at 10.9% interest per annum. As of February 29, 2024, the balance of the notes was approximately $106.
(c) Note payable-software license
During Fiscal 2024, the Company obtained a loan
of $155,000 from a financing institution to finance the use of a third-party software license by the Company. The note payable is secured
by tangible and intangible assets of the Company, bears interest at an average rate of 8% per annum and will mature in September 2026.
As of February 29, 2024, the balance of the loan was approximately $139.
(d) Other notes payable
Demand promissory notes as of February 29, 2024,
and February 28, 2023, are for one individual issued in September 2015 that is payable on demand with an interest rate of 10% per annum.
NOTE 9 – NOTES PAYABLE-RELATED PARTIES
Notes payable-related parties
consisted of the following:
| | |
February 29,
2024 | | |
February 28,
2023 | |
| (amounts in thousands) | |
| | |
| |
| Unsecured notes payable | |
| | |
| |
| (a) Notes payable - Kopple (restructured) | |
$ | 10,915 | | |
$ | 10,915 | |
| | |
| | | |
| | |
| (b) Note payable- Gagerman | |
| 82 | | |
| 82 | |
| | |
| | | |
| | |
| | |
| | | |
| | |
| | |
| | | |
| | |
| (c) Note payable-Jiangsu Shengfeng-past due | |
| 700 | | |
| 700 | |
| | |
| | | |
| | |
| Total | |
$ | 11,720 | | |
$ | 11,697 | |
| Non-current | |
| (7,088 | ) | |
| (7,065 | ) |
| Current | |
$ | 4,632 | | |
$ | 4,632 | |
(a) Kopple Notes
In fiscals 2013 through 2018,
the Company issued notes payable to Robert Kopple and associated entities (collectively “Kopple”) in the aggregate of $6,107.
Robert Kopple is the former Vice-Chairman of the Company’s Board of Directors and is a current shareholder in the Company. The notes
were unsecured, bear interest at rates ranging from 5% and 15% per annum and were due in fiscal 2014 through fiscal 2018. Beginning in
2017, Kopple brought suit against the Company for repayment of the notes. As of February 28, 2022, the outstanding balance of the Kopple
notes payable and accrued interest amounted to approximately $12,141.
On March 14, 2022, the Company
reached an agreement with Kopple to resolve all remaining litigation between them, including all amounts owed to Kopple under the notes.
Under the terms of the settlement, the Company agreed to issue a new note and pay Kopple an aggregate amount of $10,000 to be paid in
installment, of which, $3,000 was due in June 2022, and the remaining $7,000 to be annually for seven years at $1,000 per year. Additionally,
the settlement agreement granted Kopple warrants exercisable into 3,331,664 shares of the Company’s common stock at a price of $0.85
per share. The Company used the Black-Scholes option pricing model to compute the fair value of the warrants of $1,051.
The settlement provides for
certain increases in the amounts payable to Kopple and the right of such parties to enter judgement against the Company if the Company
remains in uncured default in its payment obligations. Interest on the new note also began accruing in January 2023 at 6% per annum. The
Company is also subject to certain affirmative and negative covenants such as periodic submission of financial statements to Kopple and
restrictions on future financing and investing activities, as defined in the agreement, including the covenant to not create any indebtedness
that is senior in right of payment to the Kopple debt. Management believes such covenants are normal for this type of transaction and
that management believes meeting these covenants will not affect the operations of the Company.
The Company assessed the settlement
with Kopple under ASC 470 and determined that the guidance under troubled debt restructuring should apply as the Company was experiencing
financial difficulties and Kopple granted a concession. Per ASC 470-60, the carrying value of the restructured note remains the same as
before the restructuring, reduced only by the fair value of the warrants issued in connection with the transaction. The Company determined
that the future undiscounted cash flows of the restructured new Kopple note exceeded the carrying value, and accordingly, no gain was
recognized, and no adjustment was made to the carrying value of the debt, other than the adjustment for the fair value of the warrants.
In June 2022, the first installment
of $3,000 became due, of which $150 was paid and $2,850 is still outstanding. Subsequently, the note was amended several
times to extend the payment date of the remaining balance of $2,850 of the initial payment, and the Company incurred extension and
forbearance fees totaling $335 that was recorded as part of interest expense. In January 2023, pursuant to the terms of the amended note
payable, the Company started accruing interest on the outstanding note balance at a rate of 6% per annum, compounded annually. As
of February 28, 2023, outstanding principal balance amounted to $10,915.
During the year ended
February 29, 2024, the note was amended multiple times to extend the payment dates of the balance of the initial payment of $2,850,
originally due in June 2022, and the first installment payment of $1,000, originally due in June 2023 (collectively, the “past
due principal”) for a total installment due of $3,850. As a result of these amendments, the Company incurred additional extension and forbearance fees totaling
$450 and adjustment to principal balance of $23 that was recorded as part of interest expense. As of February 29, 2024,
outstanding principal balance amounted to $10,938, including the $3,850 past due principal (see below).
In March 2024, the Company
and Kopple again amended the note payable. The amendment (i) replaced the requirement to pay the $3,850 past due principal balance with
the requirement to pay $2,000 due December 15, 2024, effectively extending the payment of $1,850 to future periods; (ii) increased the
stated interest rate to 10%; (iii) added a fee of $15 monthly until the Company makes a principal payment of $2 million by December 2024;
(iv) effective August 30, 2024, the Company will grant Kopple a conversion right that gives Kopple the option to be able to convert the
note payable into equity of the Company at a conversion price of the lower of $1.00 per share or 50% of the 10 day volume weighted average
price of the Company’s common stock; (v) during Fiscal 2025, will require the Company to pay 20% of all collected revenues within
10 days of the end of each fiscal quarter; (vi) will require the Company to pay Kopple 20% of any amount raised in new capital in the
form of equity, debt or convertible debt above $3.5 million; (vii) reduces the exercise price of the warrants granted to Kopple in March
2022 from $0.85 per share to $0.50 per share; and (vii) extends the warrant expiration date from March 8, 2029, to March 31, 2031.
The Company will account for this amendment in the first quarter ended March 31, 2024, for fiscal year 2025.
(b) Note payable-Gagerman
Melvin
Gagerman, the Company’s former CEO and CFO whose employment was permanently terminated in July 2019, claims that in April 2014
the Company issued an unsecured demand promissory note to him in the amount of $82 that bears interest at a rate of 10% per annum. Gagerman
claims that this note has not been repaid to date and is now owed.
In
June 2022, Gagerman brought suit against the Company for repayment of this alleged note. Despite the fact that, based on Gagerman’s
allegations, the note was issued during a period when Gagerman was the Company’s CEO, CFO, Corporate Secretary and Chairman of
the Company’s Board of Directors, Gagerman has stated that he does not possess a copy of the alleged promissory note. The Company
disputes that any amount is presently owed to Gagerman. Additionally, the Company has filed a cross-complaint against Gagerman for, among
things, conversion, violation of California Business & Professions Code §17200, and various breaches of fiduciary duty that
the Company believes Gagerman committed against the Company.
Based
on Gagerman’s claims, as of February 29, 2024, and February 28, 2023, the outstanding balance of the Gagerman notes payable and
accrued interest would amount to approximately $172 and $164, respectively. As of February 29, 2024, and February 28, 2023, despite the
fact that the Company disputes Gagerman’s claims, under the guidance of ASC 450 - Contingencies, the Company has recorded
the amount being claimed by Gagerman.
(c) Jiangsu Shengfeng
Note
On November 20, 2019, the
Company reached an agreement with a former joint venture partner Jiangsu Shengfeng regarding the return of $700 that had been advanced
to the Company in prior years. As a result, in November 2019, and the Company issued a non-interest-bearing promissory note for $700 to
be paid over an 11-month period beginning March 15, 2020, through February 15, 2021. As of February 29, 2024, and 2023, the principal
due was $700, respectively, and was past due.
NOTE 10 – ACCRUED INTEREST
Accrued interest consisted
of the following:
| | |
February 29,
2024 | | |
February 28,
2023 | |
| (amounts in thousands) | |
| | |
| |
| Accrued interest-convertible notes payable (past due) | |
$ | 425 | | |
$ | 354 | |
| Accrued interest-convertible notes payable related party (past due) | |
| 863 | | |
| 713 | |
| Accrued interest-notes payable – related party | |
| 1288 | | |
| 363 | |
| Accrued interest-notes payable and other | |
| 22 | | |
| 41 | |
| | |
$ | 2,598 | | |
$ | 1,471 | |
NOTE 11 – LEASES
In February 2021, the Company
consolidated our administrative and production operations, including warehousing, within an approximately 18 square foot facility in
Lake Forest, California. The Lake Forest facility lease is for 66-months effective February 2021 through August 31, 2026. The initial
monthly base rental rate was approximately $22 per month and escalates 3% each year to approximately $26 per month in 2026. The lease
liability was determined by discounting the future lease payments under the lease terms using a 10% per annum discount rate to arrive
at the current lease liability.
Operating lease right-of-use (“ROU”)
assets and liabilities are recognized at commencement date based on the present value of lease payments over the lease term. ROU assets
represent our right to use an underlying asset for the lease term and lease liabilities represent the Company’s obligation to make
lease payments arising from the lease. Generally, the implicit rate of interest in arrangements is not readily determinable and the Company
utilizes its incremental borrowing rate in determining the present value of lease payments. The operating lease ROU asset includes any
lease payments made and excludes lease incentives.
The components of lease expense
and supplemental cash flow information related to leases for the period are as follows:
| | | Year ended
February 29,
2024 | | | Year ended
February 28,
2023 | |
| (amounts in thousands) | | | | | | |
| Lease Cost | | | | | | |
| Operating lease cost (included in general and administration in the Company’s statement of operations) | | $ | 285 | | | $ | 279 | |
| | | | | | | | | |
| Other Information | | | | | | | | |
| Cash paid for amounts included in the measurement of lease liabilities for the years ended February 29, 2024, and 2023, respectively | | $ | 285 | | | $ | 274 | |
| Weighted average remaining lease term – operating leases (in years) | | | 2.5 | | | | 3.5 | |
| Average discount rate – operating leases | | | 10.0 | % | | | 10.0 | % |
The supplemental balance
sheet information related to leases for the period is as follows:
| | |
At
February 29,
2024 | |
| Operating leases | |
| |
| Long-term right-of-use assets | |
$ | 607 | |
| | |
| | |
| Short-term operating lease liabilities | |
$ | 238 | |
| Long-term operating lease liabilities | |
| 423 | |
| Total operating lease liabilities | |
$ | 661 | |
Maturities of the Company’s lease liability is as follows:
| Year
Ending February 28: | |
Operating
Lease | |
| 2025 | |
$ | 291 | |
| 2026 | |
| 299 | |
| 2027 | |
| 155 | |
| Total lease payments | |
| 745 | |
| Less: Imputed interest/present value discount | |
| (84 | ) |
| Present value of lease liabilities | |
$ | 661 | |
NOTE 12 – DERIVATIVE WARRANT LIABILITY
The Company issued warrants
in prior years that include a fundamental transaction provision that could give rise to an obligation to pay cash to the warrant holder.
The Company determined that the warrants do not satisfy the criteria for classification as equity instruments due to the existence of
the cash settlement feature that is not within the sole control of the Company, and the warrants are accounted for as liabilities in accordance
with ASC 815. The fair value of the warrants is remeasured at each reporting period, and the change in the fair value is recognized in
earnings in the accompanying statements of operations. The warrant liability will ultimately be converted into the Company’s equity
when the warrants are exercised or will be extinguished on the expiration of the outstanding warrants.
The following tables summarize
the derivative warrant liability:
| | |
February
29,
2024 | | |
February
28,
2023 | |
| (amounts
in thousands, except share and per share data) | |
| | |
| |
| Stock price | |
$ | 0.16 | | |
$ | 0.25 | |
| Risk free interest rate | |
| 5.2 | % | |
| 4.7 | % |
| Expected volatility | |
| 178 | % | |
| 190 | % |
| Expected life in years | |
| 0.4 | | |
| 0.97 | |
| Expected dividend yield | |
| 0 | % | |
| 0 | % |
| Number of warrants | |
| 10,000 | | |
| 113,100 | |
| Fair value of derivative warrant liability | |
$ | - | | |
$ | 9 | |
| | |
Number of
Warrants
Outstanding | | |
Fair Value
of
Derivative
Warrant
Liability | |
| (amounts in thousands, except share data) | |
| | | |
| | |
| February 28, 2022 | |
| 4,800,834 | | |
$ | 828 | |
| Change in fair value of derivative warrant liability | |
| - | | |
| (582 | ) |
| Gain on extinguishment on expiration of warrants | |
| (4,687,734 | ) | |
| (237 | ) |
| February 28, 2023 | |
| 113,100 | | |
$ | 9 | |
| Gain on extinguishment on expiration of warrants | |
| (103,100 | ) | |
| (9 | ) |
| February 29, 2024 | |
| 10,000 | | |
$ | - | |
NOTE 13 – STOCKHOLDERS’ DEFICIT
Common Stock
On February 29, 2024, and
February 28, 2023, the Company had 150,000,000 shares of $0.0001 par value common stock authorized for issuance.
During the year ended February
29, 2024, the Company issued 9,918,302 shares of common stock for net proceeds of approximately $2,943 in cash and services. In addition,
the Company also issued 25,000 shares of common stock for services rendered with a fair value of $6.
During the year ended February 28, 2023, the Company issued 11,529,242
shares of common stock for net proceeds of approximately $3,270 in cash.
Stock Options
In October 2011, the Company’s
shareholders approved the 2011 Director and Executive Officers Stock Option Plan (the “2011 Plan”). Under the 2011 Plan, the
Company may grant options, or warrants, for up to 15% of the number of shares of Common Stock of the Company outstanding from time to
time. Pursuant to this plan, the Board or a committee of the Board may grant an option to any person who is elected or appointed a director
or executive officer of the Company. The exercise price of each option shall be at least equal to the fair market value of such shares
on the date of grant, and the term of the options may not be greater than five years. A summary of the Company’s stock option activity
is as follows:
| | |
Number of
Shares | | |
Exercise
Price | | |
Weighted
Average
Intrinsic
Value | |
| (amounts in thousands, except share and per share data) | |
| | | |
| | | |
| | |
| Total options, February 28, 2022 | |
| 5,059,769 | | |
$ | 0.55 | | |
$ | 360 | |
| Granted | |
| - | | |
| - | | |
| - | |
| Exercised | |
| - | | |
| - | | |
| - | |
| Expired | |
| (266,912 | ) | |
| 1.40 | | |
| - | |
| Total options, February 28, 2023 | |
| 4,792,857 | | |
$ | 0.48 | | |
$ | 394 | |
| Granted | |
| - | | |
| - | | |
| - | |
| Exercised | |
| - | | |
| - | | |
| - | |
| Expired | |
| (542,857 | ) | |
| 1.40 | | |
| - | |
| Total options, February 29, 2024 | |
| 4,250,000 | | |
$ | 0.37 | | |
$ | - | |
| Exercisable, February 29, 2024 | |
| 4,250,000 | | |
$ | 0.37 | | |
$ | - | |
The exercise prices and information
related to options under the 2011 Plan outstanding on February 29, 2024, are as follows:
| Range of Exercise Price | | Stock
Options Outstanding | | | Stock
Options Exercisable | | | Weighted Average Remaining Contractual Life | | | Weighted Average Exercise
Price of
Options Outstanding | | | Weighted Average Exercise Price of Options Exercisable | |
| $0.25 to $1.40 | | | 4,250,000 | | | | 4,250,000 | | | | 1.67 | | | $ | 0.37 | | | $ | 0.37 | |
Warrants
| | |
Number
of
Warrants | | |
Exercise
Price | |
| Outstanding, February 28, 2022 | |
| 4,800,834 | | |
$ | 1.40 | |
| Granted | |
| 3,451,664 | | |
| 0.82 | |
| Exercised | |
| - | | |
| - | |
| Expired | |
| (4,687,734 | ) | |
| 1.40 | |
| Outstanding, February 28, 2023 | |
| 3,564,764 | | |
$ | 0.86 | |
| Granted | |
| 60,000 | | |
| 0.50 | |
| Exercised | |
| - | | |
| - | |
| Expired | |
| (103,100 | ) | |
| 1.40 | |
| Outstanding, February 29, 2024 | |
| 3,521,664 | | |
$ | 0.83 | |
There was no intrinsic value
as of February 29, 2024, as the exercise prices of these warrants were greater than the market price of the Company’s stock. The
exercise prices and information related to the warrants under the 2011 Plan outstanding on February 29, 2024, are as follows:
| Range of Exercise Price | | Stock
Warrants
Outstanding | | | Stock
Warrants
Exercisable | | | Weighted
Average
Remaining
Contractual
Life | | | Weighted
Average
Exercise
Price of
Warrants
Outstanding | | | Weighted
Average
Exercise
Price of
Warrants
Exercisable | |
| $0.50 to $1.40 | | | 3,521,664 | | | | 3,521,664 | | | | 4.9 | | | $ | 0.83 | | | $ | 0.83 | |
The fair values of warrants
issued during the year ended February 29, 2024, and February 28, 2023, were computed using various option pricing models including Black-Scholes
model (notes payable warrants) and binomial model (services warrants) using the weighted average assumptions as set forth in the table
below:
| | | Weighted
Average
Assumptions
for
Warrants
Issued
During the
Fiscal
2024 | | | Weighted
Average
Assumptions
for
Warrants
Issued
During the
Fiscal
2023 | |
| Exercise Price | | $ | 0.50 | | | $ | 0.84 | |
| Share Price | | $ | 0.164 | | | $ | 0.341 | |
| Volatility % | | | 160 | % | | | 224.6 | % |
| Risk-Free Rate | | | 4.9 | % | | | 2.04 | % |
| Expected Term (yrs.) | | | 1.5 | | | | 6.9 | |
| Dividend Rate | | | 0 | % | | | 0 | % |
NOTE 14 – INCOME TAXES
For the years ended February 29, 2024, and February 28, 2023, the Company
had no income tax expense.
| | |
FY2024 | | |
FY2023 | |
| Current: | |
| | |
| |
| Federal | |
$ | - | | |
$ | - | |
| State | |
| - | | |
| - | |
| Total current | |
$ | - | | |
$ | - | |
| | |
| | | |
| | |
| Deferred: | |
| | | |
| | |
| Federal | |
$ | - | | |
$ | - | |
| State | |
| - | | |
| - | |
| Total deferred | |
$ | - | | |
$ | - | |
| | |
| | | |
| | |
| Total Provision | |
$ | - | | |
$ | - | |
For the years ended
February 29, 2024 and February 28, 2023, a reconciliation of the effective income tax rate to the U.S. statutory rate is as
follows:
| | |
FY2024 | | |
FY2023 | |
| Federal tax benefit at statutory rate | |
| 21 | % | |
| 21 | % |
| State tax benefit, net of federal benefit | |
| 7 | % | |
| 7 | % |
| Change in valuation allowance | |
| (28 | )% | |
| (28 | )% |
| Total | |
| 0 | % | |
| 0 | % |
As of February 29, 2024,
and February 28, 2023, the following table summarizes our deferred tax asset:
| | |
FY2024 | | |
FY2023 | |
| (amounts in thousands) | |
| | |
| |
| Deferred tax asset | |
| | |
| |
| Net operating loss carryforwards | |
$ | 39,374 | | |
$ | 42,141 | |
| Gross deferred tax assets | |
| 39,374 | | |
| 42,141 | |
| Valuation allowance | |
| (39,374 | ) | |
| (42,141 | ) |
| Net deferred tax asset (liability) | |
$ | - | | |
$ | - | |
The provisions of ASC Topic
740, Accounting for Income Taxes, require an assessment of both positive and negative evidence when determining whether it is more likely
than not that deferred tax assets are recoverable. For the years ended February 29, 2024, and February 28, 2023, based on all available
objective evidence, including the existence of cumulative losses, the Company determined that it was more likely than not that the net
deferred tax assets were not fully realizable. Accordingly, the Company established a full valuation allowance against its net deferred
tax assets. The Company intends to maintain a full valuation allowance on net deferred tax assets until sufficient positive evidence exists
to support reversal of the valuation allowance. During the years ended February 29, 2024, and February 28, 2023, the valuation allowance
decreased by $2.7 million and $2.7 million, respectively.
At February 29, 2024, the
Company had available Federal and state net operating loss carryforwards (“NOL”s) to reduce future taxable income. For Federal
purposes the amounts available were approximately $144.7 million and for state purposes the amounts available were approximately $102.5
million. The Federal carryforwards expire on various dates through 2044 and the state carryforwards expire on various dates through 2044.
Due to restrictions imposed by Internal Revenue Code Section 382 regarding substantial changes in ownership of companies with loss carryforwards,
the utilization of the Company’s NOL may be limited as a result of changes in stock ownership.
The Company’s operations
are based in California, and it is subject to Federal and California state income tax. Tax years after 2017 are open to examination by
United States and state tax authorities.
The Company follows the guidance
of ASC 740, which requires companies to determine whether it is “more likely than not” that a tax position will be sustained
upon examination by the appropriate taxing authorities before any tax benefit can be recorded in the financial statements. ASC 740 also
provides guidance on the recognition, measurement, classification and interest and penalties related to uncertain tax positions. As of
February 29, 2024, and February 28, 2023, no liability for unrecognized tax benefits was required to be recorded or disclosed.
Our continuing practice is
to recognize interest and/or penalties related to income tax matters in income tax expense. As of February 29, 2024, and February 28,
2023, we have no accrued interest and penalties related to uncertain tax positions.
We are subject to taxation
in the U.S. and California. Our tax years for 2014 and forward are subject to examination by our tax authorities. We are not currently
under examination by any tax authority.
The Company has failed to
file its California tax returns for the years ended February 28, 2015, through February 29, 2024, due to its inability to pay the minimum
annual franchise tax payment of eight hundred dollars. The balance of accrued income taxes related to unpaid California franchise tax
of $5.6 represents six years of minimum taxes due.
NOTE 15 – RELATED PARTY TRANSACTIONS
As of February 29, 2024, and
February 28, 2023, Bettersea LLC (“Bettersea”) was an 8.8% and 9.7%, respectively, shareholder in the Company. For the years
ended February 29, 2024, and February 28, 2023, the Company incurred total fees to Bettersea of $151 and $150, respectively, for consulting
services. As of February 29, 2024, and February 28, 2023, a total of approximately $223 and $226, respectively, was due to Bettersea and
included in accounts payable and accrued expenses.
As of February 29, 2024, and
February 28, 2023, accrued expenses includes accrued payroll due to officers and shareholders of $213 and $141, respectively.
NOTE 16 – CONTINGENCIES
The Company is subject to
legal proceedings and claims that have arisen in the ordinary course of business. Our management evaluates our exposure to these claims
and proceedings individually and in the aggregate and evaluates potential losses on such litigation if the amount of the loss is estimable
and the loss is probable. However, the outcome of legal proceedings and claims brought against the Company is subject to significant
uncertainty. Although management considers the likelihood of such an outcome to be remote, if one or more of these legal matters were
resolved against the Company for amounts in excess of management’s expectations, the Company’s financial statements for that
reporting period could be materially adversely affected.
In June 2022 Melvin Gagerman
(the Company’s former CEO, CFO and Secretary) brought suit against the Company alleging approximately $150,000 being owed to him
pursuant to an April 2014 promissory note. The Company denies that any amount is owed to Mr. Gagerman and has filed a cross-complaint
against Mr. Gagerman in that action alleging, among other things, breach of fiduciary duty, conversion and violations of various California
Business and Professions Codes. Trial in this case is currently scheduled for October 2024. In March 2023, Mr. Gagerman offered to settle
the matter for $120,000 but the Company has rejected that offer (See Note 9).
On March 26, 2019, various
stockholders of the Company controlling a combined total of more than 27.5 million shares delivered a signed written consent to the Company
removing Ronald Buschur as a member of the Company’s Board and electing Cipora Lavut as a director of the Company. On March
27, 2019, those same stockholders delivered a further signed written consent to the Company removing William Anderson and Si Ryong Yu
as members of the Company’s Board and electing Robert Lempert and David Mann as directors of the Company. These written consents
represented a majority of the outstanding shares of the Company’s common stock as of March 26, 2019, and March 27, 2019,
respectively. Because of Aura’s refusal to recognize the legal effectiveness of the consents, on April 8, 2019, the stockholders
filed suit in the Court of Chancery of the State of Delaware pursuant to Section 225 of the Delaware General Corporations Law, seeking
an order confirming the validity of the consents and declaring that Aura’s Board consists of Ms. Lavut, Mr. Mann, Dr. Lempert,
Mr. Douglas and Mr. Diaz-Versón, Jr. On July 8, 2019 the Court of Chancery entered final judgment in favor of the
stockholder plaintiffs, confirming that (a) Ronald Buschur, Si Ryong Yu and William Anderson had been validly removed by the holders of
a majority of the Company’s outstanding stock acting by written consent (b) Ms. Lavut, Mr. Mann and Dr. Lempert had been validly
elected by the holders of a majority of the Company’s outstanding stock acting by written consent, and (c) the Company’s Board
of Directors validly consists of Cipora Lavut, David Mann, Robert Lempert, Gary Douglas and Salvador Diaz-Versón, Jr. As a result
of prior management’s unsuccessful opposition to this stockholders’ action filed in the Court of Chancery, such stockholders
may be potentially entitled to recoup their litigation costs from the Company under Delaware’s corporate benefit doctrine and/or
other legal provisions. To date, no final determination has been made as to the amount of recoupment, if any, to which such stockholders
may be entitled.
NOTE 17 – SUBSEQUENT EVENTS
Subsequent to February 29,
2024, the Company issued 4,455,600 shares of common stock in exchange for cash proceeds of $1.1 million.
--02-28
NONE
0.04
0.04
88947803
99379779
false
FY
0000826253
true
0000826253
2023-03-01
2024-02-29
0000826253
2023-08-31
0000826253
2024-06-04
0000826253
2024-02-29
0000826253
2023-02-28
0000826253
us-gaap:RelatedPartyMember
2024-02-29
0000826253
us-gaap:RelatedPartyMember
2023-02-28
0000826253
2022-03-01
2023-02-28
0000826253
us-gaap:CommonStockMember
2022-02-28
0000826253
us-gaap:AdditionalPaidInCapitalMember
2022-02-28
0000826253
us-gaap:RetainedEarningsMember
2022-02-28
0000826253
2022-02-28
0000826253
us-gaap:CommonStockMember
2022-03-01
2023-02-28
0000826253
us-gaap:AdditionalPaidInCapitalMember
2022-03-01
2023-02-28
0000826253
us-gaap:RetainedEarningsMember
2022-03-01
2023-02-28
0000826253
us-gaap:CommonStockMember
2023-02-28
0000826253
us-gaap:AdditionalPaidInCapitalMember
2023-02-28
0000826253
us-gaap:RetainedEarningsMember
2023-02-28
0000826253
us-gaap:CommonStockMember
2023-03-01
2024-02-29
0000826253
us-gaap:AdditionalPaidInCapitalMember
2023-03-01
2024-02-29
0000826253
us-gaap:RetainedEarningsMember
2023-03-01
2024-02-29
0000826253
us-gaap:CommonStockMember
2024-02-29
0000826253
us-gaap:AdditionalPaidInCapitalMember
2024-02-29
0000826253
us-gaap:RetainedEarningsMember
2024-02-29
0000826253
2023-12-01
2024-02-29
0000826253
us-gaap:CommonStockMember
us-gaap:SubsequentEventMember
2024-03-01
2024-03-31
0000826253
srt:MinimumMember
2024-02-29
0000826253
srt:MaximumMember
2024-02-29
0000826253
ausi:CustomerOneMember
us-gaap:SalesRevenueNetMember
us-gaap:CustomerConcentrationRiskMember
2023-03-01
2024-02-29
0000826253
ausi:CustomerTwoMember
us-gaap:SalesRevenueNetMember
us-gaap:CustomerConcentrationRiskMember
2023-03-01
2024-02-29
0000826253
ausi:CustomerOneMember
us-gaap:SalesRevenueNetMember
us-gaap:CustomerConcentrationRiskMember
2022-03-01
2023-02-28
0000826253
ausi:CustomerTwoMember
us-gaap:SalesRevenueNetMember
us-gaap:CustomerConcentrationRiskMember
2022-03-01
2023-02-28
0000826253
us-gaap:AccountsPayableMember
us-gaap:SupplierConcentrationRiskMember
ausi:VendorOneMember
2023-03-01
2024-02-29
0000826253
us-gaap:AccountsPayableMember
us-gaap:SupplierConcentrationRiskMember
ausi:VendorTwoMember
2023-03-01
2024-02-29
0000826253
us-gaap:AccountsPayableMember
us-gaap:SupplierConcentrationRiskMember
ausi:VendorThreeMember
2023-03-01
2024-02-29
0000826253
us-gaap:AccountsPayableMember
us-gaap:SupplierConcentrationRiskMember
ausi:VendorFourMember
2023-03-01
2024-02-29
0000826253
ausi:OneVendorsMember
us-gaap:AccountsPayableMember
us-gaap:SupplierConcentrationRiskMember
ausi:VendorThreeMember
2022-03-01
2023-02-28
0000826253
us-gaap:AccountsPayableMember
us-gaap:SupplierConcentrationRiskMember
ausi:VendorTwoMember
2022-03-01
2023-02-28
0000826253
us-gaap:AccountsPayableMember
us-gaap:SupplierConcentrationRiskMember
ausi:VendorThreeMember
2022-03-01
2023-02-28
0000826253
us-gaap:AccountsPayableMember
us-gaap:SupplierConcentrationRiskMember
ausi:VendorFourMember
2022-03-01
2023-02-28
0000826253
2023-02-28
2023-02-28
0000826253
us-gaap:RelatedPartyMember
2023-02-28
0000826253
2024-02-29
2024-02-29
0000826253
us-gaap:RelatedPartyMember
2024-02-29
0000826253
us-gaap:FairValueInputsLevel1Member
2024-02-29
0000826253
us-gaap:FairValueInputsLevel2Member
2024-02-29
0000826253
us-gaap:FairValueInputsLevel3Member
2024-02-29
0000826253
us-gaap:FairValueInputsLevel1Member
2023-02-28
0000826253
us-gaap:FairValueInputsLevel2Member
2023-02-28
0000826253
us-gaap:FairValueInputsLevel3Member
2023-02-28
0000826253
us-gaap:FairValueInputsLevel3Member
2023-03-01
2024-02-29
0000826253
us-gaap:FairValueInputsLevel3Member
2022-03-01
2023-02-28
0000826253
us-gaap:WarrantMember
2023-03-01
2024-02-29
0000826253
us-gaap:WarrantMember
2022-03-01
2023-02-28
0000826253
us-gaap:StockOptionMember
2023-03-01
2024-02-29
0000826253
us-gaap:StockOptionMember
2022-03-01
2023-02-28
0000826253
us-gaap:ConvertibleDebtMember
2023-03-01
2024-02-29
0000826253
us-gaap:ConvertibleDebtMember
2022-03-01
2023-02-28
0000826253
us-gaap:LeaseholdImprovementsMember
2024-02-29
0000826253
us-gaap:LeaseholdImprovementsMember
2023-02-28
0000826253
us-gaap:MachineryAndEquipmentMember
2024-02-29
0000826253
us-gaap:MachineryAndEquipmentMember
2023-02-28
0000826253
us-gaap:VehiclesMember
2024-02-29
0000826253
us-gaap:VehiclesMember
2023-02-28
0000826253
us-gaap:ComputerEquipmentMember
2024-02-29
0000826253
us-gaap:ComputerEquipmentMember
2023-02-28
0000826253
us-gaap:ComputerSoftwareIntangibleAssetMember
2024-02-29
0000826253
us-gaap:ComputerSoftwareIntangibleAssetMember
2023-02-28
0000826253
us-gaap:FurnitureAndFixturesMember
2024-02-29
0000826253
us-gaap:FurnitureAndFixturesMember
2023-02-28
0000826253
ausi:ConvertibleNoteMember
2024-02-29
0000826253
ausi:ConvertibleNoteMember
2023-03-01
2024-02-29
0000826253
us-gaap:CommonStockMember
2024-02-29
0000826253
us-gaap:WarrantMember
2024-02-29
0000826253
us-gaap:RelatedPartyMember
2017-01-24
0000826253
ausi:ConvertibleNoteMember
us-gaap:RelatedPartyMember
2017-01-24
2017-01-24
0000826253
ausi:ConvertibleNoteMember
us-gaap:RelatedPartyMember
2024-02-29
0000826253
us-gaap:RelatedPartyMember
2023-03-01
2024-02-29
0000826253
ausi:ConvertibleNoteMember
us-gaap:RelatedPartyMember
2023-03-01
2024-02-29
0000826253
ausi:EconomicInjuryDisasterEIDLoanMember
2020-07-01
0000826253
ausi:VehicleAndEquipmentMember
2022-02-28
0000826253
ausi:SecondNoteMember
ausi:VehicleAndEquipmentMember
2022-02-28
0000826253
ausi:OneNoteMember
ausi:VehicleAndEquipmentMember
2022-02-28
0000826253
ausi:OneNoteMember
us-gaap:VehiclesMember
2022-02-28
0000826253
ausi:SecondNoteMember
ausi:VehicleAndEquipmentMember
2024-02-29
0000826253
ausi:SecondNoteMember
us-gaap:VehiclesMember
2024-02-29
0000826253
ausi:FinancingInstitutionMember
2023-03-01
2024-02-29
0000826253
ausi:NotesPayablesoftwareLicenseMember
2024-02-29
0000826253
ausi:SecuredNotesPayableMember
ausi:NotePayableEIDLoanMember
2024-02-29
0000826253
ausi:SecuredNotesPayableMember
ausi:NotePayableEIDLoanMember
2023-02-28
0000826253
ausi:SecuredNotesPayableMember
ausi:NotesPayableVehicleAndEquipmentMember
2024-02-29
0000826253
ausi:SecuredNotesPayableMember
ausi:NotesPayableVehicleAndEquipmentMember
2023-02-28
0000826253
ausi:SecuredNotesPayableMember
ausi:NotesPayablesoftwareLicenseMember
2024-02-29
0000826253
ausi:UnsecuredNotesPayableMember
ausi:NotePayableOtherMember
2024-02-29
0000826253
ausi:UnsecuredNotesPayableMember
ausi:NotePayableOtherMember
2023-02-28
0000826253
ausi:RobertKoppleMember
2023-03-01
2024-02-29
0000826253
srt:MinimumMember
ausi:RobertKoppleMember
2024-02-29
0000826253
srt:MaximumMember
ausi:RobertKoppleMember
2024-02-29
0000826253
ausi:RobertKoppleMember
2022-02-28
0000826253
ausi:RobertKoppleMember
2022-03-14
2022-03-14
0000826253
ausi:RobertKoppleMember
2022-06-30
0000826253
ausi:RobertKoppleMember
2024-02-29
0000826253
ausi:RobertKoppleMember
2022-03-14
0000826253
ausi:KoppleNotesMember
2022-06-22
2022-06-22
0000826253
2022-06-22
2022-06-22
0000826253
ausi:RobertKoppleMember
2022-06-22
2022-06-22
0000826253
ausi:RobertKoppleMember
2023-02-28
0000826253
ausi:RobertKoppleMember
2024-03-31
0000826253
2023-12-31
0000826253
ausi:KoppleNotesMember
2024-02-29
0000826253
ausi:KoppleNotesMember
2023-03-01
2024-02-29
0000826253
srt:ScenarioForecastMember
2024-12-01
2024-12-31
0000826253
srt:ScenarioForecastMember
2024-12-15
2024-12-15
0000826253
2024-12-15
2024-12-15
0000826253
srt:ScenarioForecastMember
2024-12-31
0000826253
srt:ScenarioForecastMember
ausi:KoppleNotesMember
2024-08-31
0000826253
2022-03-01
2022-03-31
0000826253
ausi:KoppleNotesMember
2024-02-29
0000826253
2022-03-31
0000826253
ausi:GagermanNotesMember
2014-04-30
0000826253
2014-04-30
0000826253
ausi:GagermanMember
2024-02-29
0000826253
ausi:GagermanMember
2023-02-28
0000826253
ausi:JiangsuShengfengMember
2019-11-01
2019-11-20
0000826253
ausi:JiangsuShengfengMember
2019-11-20
0000826253
ausi:JiangsuShengfengMember
2023-03-01
2024-02-29
0000826253
ausi:UnsecuredNotesPayableMember
ausi:KoppleMember
us-gaap:RelatedPartyMember
2024-02-29
0000826253
ausi:UnsecuredNotesPayableMember
ausi:KoppleMember
us-gaap:RelatedPartyMember
2023-02-28
0000826253
ausi:UnsecuredNotesPayableMember
ausi:GagermanMember
us-gaap:RelatedPartyMember
2024-02-29
0000826253
ausi:UnsecuredNotesPayableMember
ausi:GagermanMember
us-gaap:RelatedPartyMember
2023-02-28
0000826253
ausi:UnsecuredNotesPayableMember
ausi:JiangsuShengfengPastDueMember
us-gaap:RelatedPartyMember
2024-02-29
0000826253
ausi:UnsecuredNotesPayableMember
ausi:JiangsuShengfengPastDueMember
us-gaap:RelatedPartyMember
2023-02-28
0000826253
2021-02-28
0000826253
ausi:TwoZeroTwoSixMember
2023-03-01
2024-02-29
0000826253
ausi:DerivativeWarrantLiabilitiesMember
ausi:MeasurementInputStockPriceMember
2024-02-29
0000826253
ausi:DerivativeWarrantLiabilitiesMember
ausi:MeasurementInputStockPriceMember
2023-02-28
0000826253
ausi:DerivativeWarrantLiabilitiesMember
us-gaap:MeasurementInputRiskFreeInterestRateMember
2024-02-29
0000826253
ausi:DerivativeWarrantLiabilitiesMember
us-gaap:MeasurementInputRiskFreeInterestRateMember
2023-02-28
0000826253
ausi:DerivativeWarrantLiabilitiesMember
us-gaap:MeasurementInputPriceVolatilityMember
2024-02-29
0000826253
ausi:DerivativeWarrantLiabilitiesMember
us-gaap:MeasurementInputPriceVolatilityMember
2023-02-28
0000826253
ausi:DerivativeWarrantLiabilitiesMember
us-gaap:MeasurementInputExpectedTermMember
2024-02-29
0000826253
ausi:DerivativeWarrantLiabilitiesMember
us-gaap:MeasurementInputExpectedTermMember
2023-02-28
0000826253
ausi:DerivativeWarrantLiabilitiesMember
us-gaap:MeasurementInputExpectedDividendRateMember
2024-02-29
0000826253
ausi:DerivativeWarrantLiabilitiesMember
us-gaap:MeasurementInputExpectedDividendRateMember
2023-02-28
0000826253
ausi:DerivativeWarrantLiabilitiesMember
ausi:MeasurementInputNumberOfWarrantsMember
2024-02-29
0000826253
ausi:DerivativeWarrantLiabilitiesMember
ausi:MeasurementInputNumberOfWarrantsMember
2023-02-28
0000826253
ausi:DerivativeWarrantLiabilitiesMember
ausi:MeasurementInputFairValueOfDerivativeWarrantLiabilityMember
2023-02-28
0000826253
ausi:DerivativeWarrantsMember
2022-02-28
0000826253
ausi:DerivativeWarrantLiabilityMember
2022-02-28
0000826253
ausi:DerivativeWarrantsMember
2022-03-01
2023-02-28
0000826253
ausi:DerivativeWarrantLiabilityMember
2022-03-01
2023-02-28
0000826253
ausi:DerivativeWarrantsMember
2023-02-28
0000826253
ausi:DerivativeWarrantLiabilityMember
2023-02-28
0000826253
ausi:DerivativeWarrantsMember
2023-03-01
2024-02-29
0000826253
ausi:DerivativeWarrantLiabilityMember
2023-03-01
2024-02-29
0000826253
ausi:DerivativeWarrantsMember
2024-02-29
0000826253
us-gaap:CommonStockMember
2024-02-29
2024-02-29
0000826253
us-gaap:CommonStockMember
2023-02-28
2023-02-28
0000826253
ausi:DirectorsAndOfficers2011PlanMember
2022-02-28
0000826253
ausi:DirectorsAndOfficers2011PlanMember
2022-03-01
2023-02-28
0000826253
ausi:DirectorsAndOfficers2011PlanMember
2023-02-28
0000826253
ausi:DirectorsAndOfficers2011PlanMember
2023-03-01
2024-02-29
0000826253
ausi:DirectorsAndOfficers2011PlanMember
2024-02-29
0000826253
srt:MinimumMember
ausi:OptionsMember
2024-02-29
0000826253
srt:MaximumMember
ausi:OptionsMember
2024-02-29
0000826253
ausi:OptionsMember
2023-03-01
2024-02-29
0000826253
ausi:OptionsMember
2024-02-29
0000826253
srt:MinimumMember
us-gaap:WarrantMember
2024-02-29
0000826253
srt:MaximumMember
us-gaap:WarrantMember
2024-02-29
0000826253
ausi:BetterseaMember
2023-03-01
2024-02-29
0000826253
ausi:BetterseaMember
2022-03-01
2023-02-28
0000826253
ausi:BetterseaMember
2024-02-29
0000826253
ausi:BetterseaMember
2023-02-28
0000826253
2022-06-01
2022-06-30
0000826253
2019-03-26
iso4217:USD
xbrli:shares
iso4217:USD
xbrli:shares
xbrli:pure
ausi:Day
utr:sqft
I, Cipora Lavut, certify, as of the
date hereof, pursuant to 18 U.S.C. Section 1350, as adopted pursuant to Section 906 of the Sarbanes-Oxley Act of 2002, that the Annual
Report of Aura Systems, Inc. on Form 10-K for the fiscal year ended February 29, 2024 fully complies with the requirements of Section
13(a) or 15(d) of the Securities Exchange Act of 1934 and that information contained in such Form 10-K fairly presents in all material
respects the financial condition and results of operations of Aura Systems, Inc. at the dates and for the periods indicated.
I, Gary Campbell, certify, as of the date
hereof, pursuant to 18 U.S.C. Section 1350, as adopted pursuant to Section 906 of the Sarbanes-Oxley Act of 2002, that the Annual Report
of Aura Systems, Inc. on Form 10-K for the fiscal year ended February 29, 2024 fully complies with the requirements of Section 13(a) or
15(d) of the Securities Exchange Act of 1934 and that information contained in such Form 10-K fairly presents in all material respects
the financial condition and results of operations of Apple Inc. at the dates and for the periods indicated.
A signed original of this written
statement required by Section 906 has been provided to Aura Systems, Inc. and will be retained by Aura Systems, Inc. and furnished to
the Securities and Exchange Commission or its staff upon request.