Regulatory News:
Total Gabon (Paris:EC):
Main Financial Indicators
Q1 18
Q1 17
Q1 18vs.Q1 17
Average Brent price $/b
66.8 53.7
+24% Average Total Gabon crude price(1) $/b
61.7 48.7 +27%
Crude oil production from fieldsoperated
by Total Gabon
kb/d (2)
24.0 53.7 -55% Crude
oil production from Total Gabon interests(3) kb/d
35.7 46.0 -22% Sales volumes(1) Mb(4)
2.93 3.79 -23% Revenue(5) $M
208 210 -1% Funds generated from
operations(6) $M
33 86 -62%
Capital expenditure $M
30 17
+76% Net income (loss)(7) $M
23 5
x5
(1) Excluding profit oil reverting to the Gabonese Republic as
per production sharing contracts.
(2) kb/d: Thousand barrels per day
(3) Including profit oil reverting to the Gabonese Republic as
per production sharing contracts.
(4) Mb: Million barrels.
(5) Revenue from hydrocarbon sales and services (transportation,
processing and storage). As from December 31th 2017, the Company’s
financial statements are prepared in accordance with International
Financial Reporting Standards (IFRS). Following the application of
IAS 18 – Revenue, profit oil reverting to the Gabonese Republic is
now included in revenue. This reclassification, which was also
applied to Q1 17 revenue, has no impact on net income.
(6) Funds generated from operations = operating cash flow +
gains (losses) on disposals of assets + working capital
changes.
(7) The Company’s financial statements are prepared in
accordance with International Financial Reporting Standards (IFRS).
Various items taken into account in the calculation of Q1 17 net
income have been adjusted as a result of the adoption of IFRS. A
summary of these adjustments is provided in Appendix 1.
First Quarter 2018 Results
Selling Prices
Reflecting the higher Brent price, the selling price of the
Mandji and Rabi Light crude oil grades marketed by Total Gabon
averaged $61.7 per barrel, up 27% compared to first quarter
2017.
Production
Total Gabon’s equity share of operated and non-operated oil
production(1) was 35,700 barrels per day in first quarter 2018, a
decline of 22% compared to first quarter 2017, due mainly to:
- the sale of mature assets to Perenco on
October 31, 2017;
- compression issues on the Anguille and
Torpille fields;
- the natural decline of fields.
This was partly offset by:
- The impact of the acquisition of an
additional 50% in the Baudroie-Mérou license in June 2017.
Revenue
Revenue amounted to $208 million in first quarter 2018,
stable compared to first quarter 2017, with the price effect
offsetting lower volumes.
Funds Generated From Operations
Funds generated from operations amounted to $33 million, down
62% compared to first quarter 2017, mainly due to the increase in
working capital (price effect on receivables, cost reduction effect
on payables).
Capital Expenditure
Capital expenditure amounted to $30 million in first
quarter 2018, up 76% compared to first quarter 2017, and included
the commencement of an onshore drilling campaign, integrity works
offshore (Anguille, Torpille, Grondin) and onshore (Cap Lopez
terminal), and geoscience and development studies.
Net Income
Net income amounted to $23 million in first quarter 2018, a
significant improvement from $5 million in first quarter 2017
thanks primarily to a positive price effect, the Company's
cost-cutting program, lower depreciation and reduced financial
expenses due to the Company’s debt reimbursement.
First Quarter 2018 Highlights
Board of Directors Meeting of March 27, 2018
The Board of Directors approved on March 27, 2018 the accounts
for the year ending December 31, 2017 and decided that it will
recommend at the Annual Meeting on May 22, 2018 that shareholders
approve the payment of a dividend of $5.5 per share, for a total
payout of $24.75 million. This represents an increase of 22% from
the previous year’s dividend of $4.5 per share.
APPENDIX 1: IMPACT OF ADOPTING IFRS ON THE Q1 17 INCOME
STATEMENT
Information on Options Retained in First-Time
Adoption
The move from the Organization for the Harmonization of Business
Law in Africa (OHADA) accounting standard to International
Financial Reporting Standards (IFRS) was conducted in accordance
with IFRS 1 - First-time Adoption of International Financial
Reporting Standards. As an affiliate that became a first-time
adopter later than its parent, the Company chose to measure its
assets and liabilities as the carrying amount in the consolidated
financial statements of Total S.A.
Summary of the Main Impacts on the Q1 17 Income
Statement
Net income (OHADA) 11
Unit-of-production
method - IAS 16 note 1 (3) Exceptional depreciation -
IAS 16 note 1 (3) Site restoration - IAS 16
note 2 (1) Measurement of oil and gas
inventories - IAS 2 note 3 (1) Deferred taxes - IAS
12 note 4 2
Total adjustments
(6)
Net income (IFRS)
5
Notes
In terms of measurement, Q1 17 net income was primarily impacted
by the application of IAS 16 - Property, Plant and Equipment, as
well as by the recognition of deferred taxes.
Note 1 – Property, Plant and Equipment
Development costs for the drilling of development wells and for
the construction of production facilities are capitalized, together
with borrowing costs incurred during the period of construction and
present value of estimated and future costs of asset retirement
obligations. The depletion rate is equal to the ratio between oil
and gas production for the period and proved developed reserves
(unit-of-production method). Previously, the Company determined
depreciation using the straight-line method.
Note 2 – Asset Retirement (Site Restoration)
Under IAS 16 - Property, Plant and Equipment, an item of
property, plant and equipment should initially be recorded at cost.
Cost includes the estimated costs of dismantling and removing the
item and restoring the site on which it is located if such an
obligation exists when the asset is recognized. A corresponding
asset retirement obligation is recorded in liabilities.
Changes in the liability for an asset retirement obligation due
to the passage of time are measured by applying a risk-free
discount rate to the amount of the liability.
Note 3 – Oil and gas inventories
Over- or underliftings of hydrocarbons are valued based on the
entitlement method, under which production is valued at the selling
price at the date of the preparation on of the financial
statements. Previously, any such difference between volumes sold
and entitlement volumes, based on net working interest, was valued
at production cost.
Note 4 – Deferred Taxes
Under the deferred tax method, both current tax expense (or
income) and deferred tax expense (or income) relating to the
current or previous periods are disclosed in the financial
statements.
Current taxes, calculated according to tax regulations, are
recognized in the statement of income and the balance sheet.
Deferred income taxes are recognized on a separate line. In
accordance with IAS 12 – Income Taxes and the “comprehensive
balance sheet method,” deferred income taxes are recorded based on
the temporary differences between the carrying amounts of assets
and liabilities recorded in the balance sheet and their tax bases.
Permanent differences do not give rise to deferred taxes.
1 Including profit oil reverting to the Gabonese Republic as per
production sharing contracts.
Total GabonSociété anonyme
incorporated in Gabon with a Board of Directors and share
capital of $76,500,000Headquarters: Boulevard Hourcq,
Port-Gentil, BP 525, Gabonese
Republicwww.total.gaRegistered in Port-Gentil:
2000 B 00011
View source
version on businesswire.com: https://www.businesswire.com/news/home/20180514005890/en/
Total GabonFlorent Cailletflorent.caillet@total.com
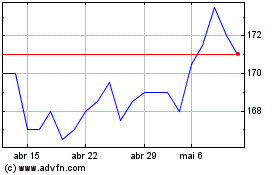
TotalEnergies EP Gabon (EU:EC)
Gráfico Histórico do Ativo
De Jan 2025 até Fev 2025

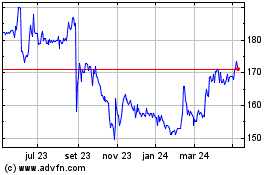
TotalEnergies EP Gabon (EU:EC)
Gráfico Histórico do Ativo
De Fev 2024 até Fev 2025
