UNITED STATES
SECURITIES AND EXCHANGE COMMISSION
WASHINGTON, D.C. 20549
FORM 10-Q
(Mark One)
☒ QUARTERLY REPORT PURSUANT TO SECTION 13
or 15(d) OF THE SECURITIES EXCHANGE ACT OF 1934.
For the quarterly period ended September 30,
2023
☐ TRANSITION REPORT PURSUANT TO SECTION 13
OR 15(d) OF THE SECURITIES EXCHANGE ACT OF 1934.
For the transition period from ____________ to
____________
Commission File Number 001-34260
CHINA GREEN AGRICULTURE, INC.
(Exact name of registrant as specified in its charter)
| Nevada | | 36-3526027 |
| (State or other jurisdiction of | | (IRS Employer |
| incorporation or organization) | | Identification No.) |
3rd floor, Borough A, Block A. No. 181, South Taibai
Road, Xi’an, Shaanxi province, PRC 710065
(Address of principal executive offices) (Zip Code)
+86-29-88266368
(Issuer’s telephone number, including area
code)
Indicate by check mark whether
the issuer (1) filed all reports required to be filed by Section 13 or 15(d) of the Securities Exchange Act of 1934 during the preceding
12 months (or for such shorter period that the registrant was required to file such reports), and (2) has been subject to such filing
requirements for the past 90 days. Yes ☒ No ☐
Indicate by check mark whether
the registrant has submitted electronically and posted on its corporate Web site, if any, every Interactive Data File required to be submitted
and posted pursuant to Rule 405 of Regulation S-T (§232.405 of this chapter) during the preceding 12 months (or for such shorter
period that the registrant was required to submit and post such files). Yes ☒ No ☐
Indicate by check mark whether
the registrant is a large accelerated filer, an accelerated filer, a non-accelerated filer, smaller reporting company, or an emerging
growth company. See the definitions of “large accelerated filer,” “accelerated filer,” “smaller reporting
company,” and “emerging growth company” in Rule 12b-2 of the Exchange Act.
| | Large accelerated filer | ☐ | | Accelerated filer | ☐ |
| | Non-accelerated filer | ☒ | | Smaller reporting company | ☒ |
| | | | Emerging growth company | ☐ |
If an emerging growth company,
indicate by check mark if the registrant has elected not to use the extended transition period for complying with any new or revised financial
accounting standards provided pursuant to Section 13(a) of the Exchange Act. ☐
Indicate by check mark whether
the registrant is a shell company (as defined in Rule 12b-2 of the Exchange Act). Yes ☐ No ☒
Securities registered pursuant
to Section 12(b) of the Act:
| Title of each class | | Trading Symbol(s) | | Name of each exchange on which registered |
| Common Stock | | CGA | | NYSE |
APPLICABLE ONLY TO CORPORATE ISSUERS:
Indicate the number of shares
outstanding of each of the issuer’s classes of common stock, as of the latest practicable date: 13,380,914 shares of common stock,
$0.001 par value, as of November 20, 2023.
TABLE OF CONTENTS
INFORMATION RELATING TO FORWARD-LOOKING STATEMENTS
In addition to historical information, this report
contains forward-looking statements within the meaning of Section 27A of the Securities Act and Section 21E of the Exchange Act. You can
identify such forward-looking statements by terms such as “anticipates,” “believes,” “could,” “estimates,”
“expects,” “intends,” “may,” “plans,” “potential,” “predicts,”
“projects,” “should,” “would” and similar expressions intended to identify forward-looking statements.
Forward-looking statements reflect our current views with respect to future events and are based on assumptions and subject to risks and
uncertainties. Given these uncertainties, you should not place undue reliance on these forward-looking statements. These forward-looking
statements may include, among other things, statements relating to:
| |
● |
our expectations regarding the market for our products and services; |
| |
● |
our expectations regarding the continued growth of our industry; |
| |
● |
our beliefs regarding the competitiveness of our products; |
| |
● |
our expectations regarding the expansion of our manufacturing capacity; |
| |
● |
our expectations with respect to increased revenue growth and our ability to maintain profitability resulting from increases in our production volumes; |
| |
● |
our future business development, results of operations and financial condition; |
| |
● |
competition from other fertilizer and plant producers; |
| |
● |
the loss of any member of our management team; |
| |
● |
our ability to integrate acquired subsidiaries and operations into existing operations; |
| |
● |
market conditions affecting our equity capital; |
| |
● |
our ability to successfully implement our selective acquisition strategy; |
| |
● |
changes in general economic conditions; |
| |
● |
changes in accounting rules or the application of such rules; |
| |
● |
any failure to comply with the periodic filing and other requirements of The New York Stock Exchange, or NYSE, for continued listing, |
| |
● |
any failure to identify and remediate the material weaknesses or other deficiencies in our internal control and disclosure control over financial reporting; |
Also, forward-looking statements represent our
estimates and assumptions only as of the date of this report. You should read this report and the documents that we reference in this
report, or that we filed as exhibits to this report, in their entirety and with the understanding that our actual future results may be
materially different from what we expect.
Except as required by law, we assume no obligation
to update any forward-looking statements publicly, or to update the reasons actual results could differ materially from those anticipated
in any forward-looking statements, even if new information becomes available in the future.
PART I – FINANCIAL INFORMATION
Item 1. Financial Statements
CHINA GREEN AGRICULTURE, INC. AND SUBSIDIARIES
UNAUDITED CONDENSED CONSOLIDATED BALANCE SHEETS
(UNAUDITED)
| | |
September 30,
2023 | | |
June 30,
2023 | |
| | |
| | |
| |
| ASSETS | |
| | |
| |
| Current Assets | |
| | |
| |
| Cash and cash equivalents | |
$ | 67,285,823 | | |
$ | 71,142,188 | |
| Digital assets | |
| 41,564 | | |
| 210,342 | |
| Accounts receivable, net | |
| 19,908,132 | | |
| 16,455,734 | |
| Inventories, net | |
| 42,595,553 | | |
| 46,455,131 | |
| Prepaid expenses and other current assets | |
| 2,668,186 | | |
| 2,603,489 | |
| Amount due from related parties | |
| - | | |
| 27,560 | |
| Advances to suppliers, net | |
| 14,685,085 | | |
| 14,332,715 | |
| Total Current Assets | |
| 147,184,343 | | |
| 151,227,159 | |
| | |
| | | |
| | |
| Plant, property and equipment, net | |
| 17,519,818 | | |
| 16,690,245 | |
| Other assets | |
| 9,734 | | |
| 9,784 | |
| Other non-current assets | |
| 4,605,489 | | |
| 5,092,721 | |
| Intangible assets, net | |
| 13,439,658 | | |
| 13,563,635 | |
| Deferred Tax Asset | |
| 102,233 | | |
| 97,820 | |
| Total Assets | |
$ | 182,861,275 | | |
$ | 186,681,364 | |
| | |
| | | |
| | |
| LIABILITIES AND STOCKHOLDERS’ EQUITY | |
| | | |
| | |
| Current Liabilities | |
| | | |
| | |
| Accounts payable | |
$ | 1,979,494 | | |
$ | 2,100,449 | |
| Customer deposits | |
| 5,669,071 | | |
| 5,489,781 | |
| Accrued expenses and other payables | |
| 15,117,943 | | |
| 14,929,427 | |
| Amount due to related parties | |
| 5,625,161 | | |
| 5,439,209 | |
| Taxes payable | |
| 27,033,499 | | |
| 27,070,961 | |
| Short term loans | |
| 3,756,540 | | |
| 5,346,640 | |
| | |
| | | |
| | |
| Total Current Liabilities | |
| 59,181,708 | | |
| 60,376,467 | |
| | |
| | | |
| | |
| Long-term Liabilities | |
| | | |
| | |
| Long-term loans | |
| 932,280 | | |
| 937,040 | |
| Total Liabilities | |
$ | 60,113,988 | | |
| 61,313,507 | |
| | |
| | | |
| | |
| Commitments and Contingencies | |
| - | | |
| - | |
| | |
| | | |
| | |
| Stockholders’ Equity | |
| | | |
| | |
| Preferred Stock, $.001 par value, 20,000,000 shares authorized, 0 shares issued and outstanding as of September 30, 2023 and June 30, 2023, respectively | |
| - | | |
| - | |
| Common stock, $.001 par value, 115,197,165 shares authorized, 13,380,914 and 13,380,914 shares issued and outstanding as of September 30, 2023 and June 30, 2023, respectively | |
| 13,381 | | |
| 13,381 | |
| Additional paid-in capital | |
| 242,090,576 | | |
| 242,090,576 | |
| Statutory reserve | |
| 26,732,603 | | |
| 26,728,079 | |
| Retained earnings | |
| (118,302,403 | ) | |
| (116,513,686 | ) |
| Accumulated other comprehensive loss | |
| (27,786,870 | ) | |
| (26,950,493 | ) |
| Total Stockholders’ Equity | |
| 122,747,287 | | |
| 125,367,857 | |
| | |
| | | |
| | |
| Total Liabilities and Stockholders’ Equity | |
$ | 182,861,275 | | |
$ | 186,681,364 | |
The accompanying notes are an integral part of
these unaudited condensed consolidated financial statements.
CHINA GREEN AGRICULTURE, INC. AND SUBSIDIARIES
UNAUDITED CONDENSED CONSOLIDATED STATEMENTS
OF OPERATIONS AND
COMPREHENSIVE LOSS
(UNAUDITED)
| | |
Three Months Ended
September 30, | |
| | |
2023 | | |
2022 | |
| Sales | |
| | |
| |
| Jinong | |
$ | 9,288,758 | | |
$ | 12,148,002 | |
| Gufeng | |
| 10,421,274 | | |
| 12,578,822 | |
| Yuxing | |
| 2,342,716 | | |
| 2,870,501 | |
| Antaeus | |
| 345,114 | | |
| - | |
| Net sales | |
| 22,397,862 | | |
| 27,597,325 | |
| Cost of goods sold | |
| | | |
| | |
| Jinong | |
| 6,606,614 | | |
| 8,760,170 | |
| Gufeng | |
| 8,995,321 | | |
| 11,254,877 | |
| Yuxing | |
| 1,877,527 | | |
| 2,397,469 | |
| Antaeus | |
| 268,546 | | |
| - | |
| Cost of goods sold | |
| 17,748,008 | | |
| 22,412,516 | |
| Gross profit | |
| 4,649,854 | | |
| 5,184,809 | |
| Operating expenses | |
| | | |
| | |
| Selling expenses | |
| 1,879,155 | | |
| 2,437,354 | |
| General and administrative expenses | |
| 4,556,606 | | |
| 3,285,115 | |
| Total operating expenses | |
| 6,435,761 | | |
| 5,722,469 | |
| Loss from operations | |
| (1,785,907 | ) | |
| (537,660 | ) |
| Other income (expense) | |
| | | |
| | |
| Other (expense) | |
| 9,783 | | |
| 27,790 | |
| Interest income | |
| 55,072 | | |
| 64,000 | |
| Interest expense | |
| (67,554 | ) | |
| (82,244 | ) |
| Total other (expense) | |
| (2,699 | ) | |
| 9,546 | |
| Loss before income taxes | |
| (1,788,606 | ) | |
| (528,114 | ) |
| Provision for income taxes | |
| (4,413 | ) | |
| - | |
| Net loss | |
$ | (1,784,193 | ) | |
| (528,114 | ) |
| | |
| | | |
| | |
| Other comprehensive loss | |
| | | |
| | |
| Foreign currency translation loss | |
| (836,377 | ) | |
| (10,920,158 | ) |
| Comprehensive loss | |
$ | (2,620,570 | ) | |
$ | (11,448,272 | ) |
| | |
| | | |
| | |
| Basic weighted average shares outstanding | |
| 13,380,914 | | |
| 12,930,752 | |
| Basic net loss per share | |
$ | (0.13 | ) | |
$ | (0.04 | ) |
| | |
| | | |
| | |
| Diluted weighted average shares outstanding | |
| 13,380,914 | | |
| 12,930,752 | |
| Diluted net loss per share | |
$ | (0.13 | ) | |
$ | (0.04 | ) |
The accompanying notes are an integral part of
these unaudited condensed consolidated financial statements.
CHINA GREEN AGRICULTURE, INC. AND SUBSIDIARIES
UNAUDITED CONDENSED CONSOLIDATED STATEMENTS
OF STOCKHOLDERS’ EQUITY
FOR THE THREE MONTHS ENDED SEPTEMBER 30, 2023
AND 2022
(UNAUDITED)
| | |
Number Of | | |
Common | | |
Additional
Paid In | | |
Statutory | | |
Retained | | |
Accumulated
Other
Comprehensive | | |
Total
Stockholders’ | |
| | |
Shares | | |
Stock | | |
Capital | | |
Reserve | | |
Earnings | | |
Loss | | |
Equity | |
| BALANCE, JUNE 30, 2023 | |
| 13,380,914 | | |
$ | 13,381 | | |
$ | 242,090,576 | | |
$ | 26,728,079 | | |
$ | (116,513,686 | ) | |
$ | (26,950,493 | ) | |
$ | 125,367,857 | |
| | |
| | | |
| | | |
| | | |
| | | |
| | | |
| | | |
| | |
| Net loss | |
| | | |
| | | |
| | | |
| | | |
| (1,784,193 | ) | |
| | | |
| (1,784,193 | ) |
| Issuance of stock | |
| | | |
| | | |
| | | |
| | | |
| | | |
| | | |
| - | |
| | |
| | | |
| | | |
| | | |
| | | |
| | | |
| | | |
| | |
| Transfer to statutory reserve | |
| | | |
| | | |
| | | |
| 4,524 | | |
| (4,524 | ) | |
| | | |
| - | |
| | |
| | | |
| | | |
| | | |
| | | |
| | | |
| | | |
| | |
| Other comprehensive loss | |
| | | |
| | | |
| | | |
| | | |
| | | |
| (836,377 | ) | |
| (836,377 | ) |
| | |
| | | |
| | | |
| | | |
| | | |
| | | |
| | | |
| | |
| BALANCE, SEPTEMBER 30, 2023 | |
| 13,380,914 | | |
$ | 13,381 | | |
$ | 242,090,576 | | |
$ | 26,732,603 | | |
$ | (118,302,403 | ) | |
$ | (27,786,870 | ) | |
$ | 122,747,287 | |
| | |
Number Of | | |
Common | | |
Additional
Paid In | | |
Statutory | | |
Retained | | |
Accumulated
Other
Comprehensive | | |
Total
Stockholders’ | |
| | |
Shares | | |
Stock | | |
Capital | | |
Reserve | | |
Earnings | | |
Loss | | |
Equity | |
| BALANCE, JUNE 30, 2022 | |
| 12,141,467 | | |
$ | 12,141 | | |
$ | 224,676,686 | | |
$ | 26,870,968 | | |
$ | (103,374,589 | ) | |
$ | (13,414,442 | ) | |
$ | 134,770,764 | |
| | |
| | | |
| | | |
| | | |
| | | |
| | | |
| | | |
| | |
| Net loss | |
| | | |
| | | |
| | | |
| | | |
| (528,114 | ) | |
| | | |
| (528,114 | ) |
| Issuance of stock | |
| 1,117,142 | | |
| 1,117 | | |
| 16,756,013 | | |
| | | |
| | | |
| | | |
| 16,757,130 | |
| Transfer to statutory reserve | |
| | | |
| | | |
| | | |
| 119.594 | | |
| (119,594 | ) | |
| | | |
| - | |
| | |
| | | |
| | | |
| | | |
| | | |
| | | |
| | | |
| | |
| Other comprehensive loss | |
| | | |
| | | |
| | | |
| | | |
| | | |
| (10,920,158 | ) | |
| (10,920,158 | ) |
| | |
| | | |
| | | |
| | | |
| | | |
| | | |
| | | |
| | |
| BALANCE, SEPTEMBER 30, 2022 | |
| 13,258,609 | | |
$ | 13,259 | | |
$ | 241,432,699 | | |
$ | 26,990,562 | | |
$ | (104,022,298 | ) | |
$ | (24,334,600 | ) | |
$ | 140,079,622 | |
The accompanying notes are an integral part of
these unaudited condensed consolidated financial statements.
CHINA GREEN AGRICULTURE, INC. AND SUBSIDIARIES
UNAUDITED CONDENSED CONSOLIDATED STATEMENTS
OF CASH FLOWS
(UNAUDITED)
| | |
Three Months Ended
September 30, | |
| | |
2023 | | |
2022 | |
| | |
| | |
| |
| Cash flows from operating activities | |
| | |
| |
| Net loss | |
$ | (1,784,193 | ) | |
$ | (528,114 | ) |
| Adjustments to reconcile Net loss to net cash provided by (used in) operating activities | |
| | | |
| | |
| Depreciation and amortization | |
| 656,959 | | |
| 662,177 | |
| Provision for losses on accounts receivable | |
| (538,416 | ) | |
| - | |
| Inventories impairment | |
| 2,379,234 | | |
| 1,735,860 | |
| Changes in operating assets | |
| | | |
| | |
| Digital assets | |
| 168,777 | | |
| - | |
| Accounts receivable | |
| (3,024,768 | ) | |
| (347,169 | ) |
| Amount due from related parties | |
| 27,631 | | |
| (5,167 | ) |
| Other current assets | |
| (77,657 | ) | |
| (8,349,885 | ) |
| Inventories | |
| 1,272,227 | | |
| (7,691,110 | ) |
| Advances to suppliers | |
| (426,393 | ) | |
| 12,793,200 | |
| Other assets | |
| 464,911 | | |
| 491,281 | |
| Deferred tax assets | |
| (4,413 | ) | |
| - | |
| Changes in operating liabilities | |
| | | |
| | |
| Accounts payable | |
| (112,632 | ) | |
| 71,479 | |
| Customer deposits | |
| 208,770 | | |
| (1,510,592 | ) |
| Amount due to related parties | |
| - | | |
| (11,177 | ) |
| Tax payables | |
| (47,678 | ) | |
| 61,229 | |
| Accrued expenses and other payables | |
| 211,131 | | |
| 381,397 | |
| Interest payable | |
| - | | |
| (748,919 | ) |
| Net cash used in operating activities | |
| (626,510 | ) | |
| (2,995,510 | ) |
| Cash flows from investing activities | |
| | | |
| | |
| Purchase of plant, property, and equipment | |
| (1,507,026 | ) | |
| (228,541 | ) |
| Sales of discontinued operations | |
| - | | |
| 912,425 | |
| Net cash (used in) provided by investing activities | |
| (1,507,026 | ) | |
| 683,884 | |
| | |
| | | |
| | |
| Cash flows from financing activities | |
| | | |
| | |
| Proceeds from the sale of common stock | |
| - | | |
| 16,757,130 | |
| Proceeds from loans | |
| - | | |
| 1,167,904 | |
| Repayment of loans | |
| (1,574,960 | ) | |
| - | |
| Advance from related party | |
| 191,000 | | |
| 100,000 | |
| Net cash (used in) provided by financing activities | |
| (1,383,960 | ) | |
| 18,025,034 | |
| | |
| | | |
| | |
| Effect of exchange rate change on cash and cash equivalents | |
| (338,869 | ) | |
| (3,651,176 | ) |
| Net (decrease) increase in cash and cash equivalents | |
| (3,856,365 | ) | |
| 12,062,232 | |
| | |
| | | |
| | |
| Cash and cash equivalents, beginning balance | |
| 71,142,188 | | |
| 57,770,303 | |
| Cash and cash equivalents, ending balance | |
$ | 67,285,823 | | |
$ | 69,832,535 | |
| | |
| | | |
| | |
| Supplement disclosure of cash flow information | |
| | | |
| | |
| Interest expense paid | |
$ | 67,554 | | |
$ | 82,244 | |
| Income taxes paid | |
$ | 60,650 | | |
$ | 84,622 | |
The accompanying notes are an integral part of
these unaudited condensed consolidated financial statements.
CHINA GREEN AGRICULTURE, INC. AND SUBSIDIARIES
NOTES TO UNAUDITED CONDENSED CONSOLIDATED FINANCIAL
STATEMENTS
NOTE 1 – ORGANIZATION AND DESCRIPTION OF BUSINESS
China Green Agriculture, Inc. (the “Company”,
“Parent Company” or “Green Nevada”), through its subsidiaries, is engaged in the research, development, production,
distribution and sale of humic acid-based compound fertilizer, compound fertilizer, blended fertilizer, organic compound fertilizer, slow-release
fertilizers, highly concentrated water-soluble fertilizers and mixed organic-inorganic compound fertilizer and the development, production,
and distribution of agricultural products.
Unless the context indicates otherwise, as used
in this Report, the following are the references herein of all the subsidiaries of the Company (i) Green Agriculture Holding Corporation
(“Green New Jersey”), a wholly-owned subsidiary of Green Nevada, incorporated in the State of New Jersey; (ii) Shaanxi TechTeam
Jinong Humic Acid Product Co., Ltd. (“Jinong”), a wholly-owned subsidiary of Green New Jersey organized under the laws of
the PRC; (iii) Xi’an Hu County Yuxing Agriculture Technology Development Co., Ltd. (“Yuxing”), a Variable Interest
Entity (“VIE”) in the in the PRC controlled by Jinong through a series of contractual agreements; (iv) Beijing Gufeng Chemical
Products Co., Ltd., a wholly-owned subsidiary of Jinong in the PRC (“Gufeng”), (v) Beijing Tianjuyuan Fertilizer Co., Ltd.,
Gufeng’s wholly-owned subsidiary in the PRC (“Tianjuyuan”), and (vi)Antaeus Tech, Inc. (“Antaeus”),
a wholly-owned subsidiary of Green Nevada incorporated in the State of Delaware.
On June 30, 2016 the Company, through its wholly-owned
subsidiary Jinong, entered into strategic acquisition agreements and a series of contractual agreements with the shareholders of the following
six companies that are organized under the laws of the PRC and would be deemed VIEs: Shaanxi Lishijie Agrochemical Co., Ltd. (“Lishijie”),
Songyuan Jinyangguang Sannong Service Co., Ltd. (“Jinyangguang”), Shenqiu County Zhenbai Agriculture Co., Ltd. (“Zhenbai”),
Weinan City Linwei District Wangtian Agricultural Materials Co., Ltd. (“Wangtian”), Aksu Xindeguo Agricultural Materials Co.,
Ltd. (“Xindeguo”), and Xinjiang Xinyulei Eco-agriculture Science and Technology co., Ltd. (“Xinyulei”). On January
1, 2017, the Company, through its wholly owned subsidiary Jinong, entered into strategic acquisition agreements and a series of contractual
agreements with the shareholders of the following two companies that are organized under the laws of the PRC and would be deemed VIEs,
Sunwu County Xiangrong Agricultural Materials Co., Ltd. (“Xiangrong”), and Anhui Fengnong Seed Co., Ltd. (“Fengnong”).
On November 30, 2017, the Company, through its
wholly owned subsidiary Jinong, discontinued the strategic acquisition agreements and the series of contractual agreements with the shareholders
of Zhenbai.
On June 2, 2021, the Company, through its wholly
owned subsidiary Jinong, discontinued the strategic acquisition agreements and the series of contractual agreements with the shareholders
of Xindeguo, Xinyulei and Xiangrong.
On December 1, 2021, the Company, through its
wholly owned subsidiary Jinong, discontinued the strategic acquisition agreements and the series of contractual agreements with the shareholders
of Lishijie.
On December 31, 2021, the Company, through its
wholly owned subsidiary Jinong, discontinued the strategic acquisition agreements and the series of contractual agreements with the shareholders
of Fengnong.
On March 31, 2022, the Company, through its wholly
owned subsidiary Jinong, discontinued the strategic acquisition agreements and the series of contractual agreements with the shareholders
of Jinyangguang and Wangtian.
On March 13, 2023, the Company established Antaeus
Tech Inc. (“Antaeus”) in the State of Delaware. In April 2023, Antaeus started to purchase digital assets mining machines
and to mine Bitcoin in West Texas.
Our current corporate structure is set forth in the following diagram:
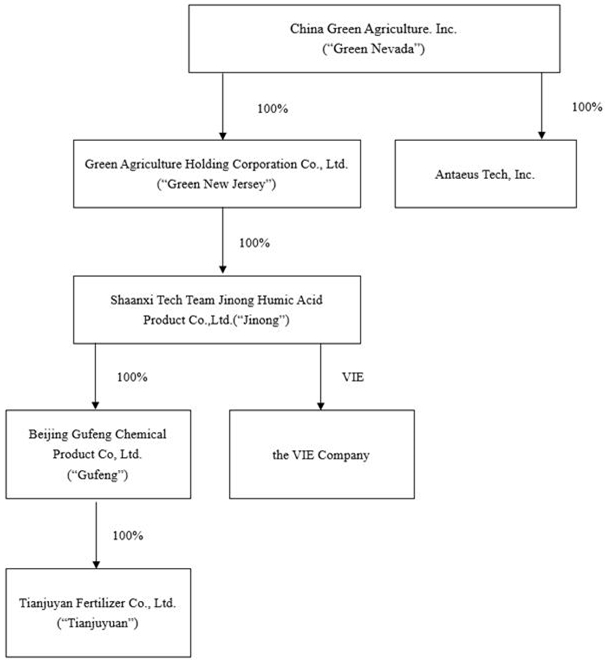
Yuxing may also collectively be referred to
as “the VIE Company”.
NOTE 2 – BASIS OF PRESENTATION AND SUMMARY OF SIGNIFICANT
ACCOUNTING POLICIES
Principle of consolidation
The accompanying consolidated financial statements
include the accounts of the Company and its wholly owned subsidiaries, Green New Jersey, Jinong, Gufeng, Tianjuyuan, Yuxing and Antaeus.
All significant inter-company accounts and transactions have been eliminated in consolidation.
For purposes of comparability, certain prior period
amounts have been reclassified to conform to the current year presentation in accordance with accounting principles generally accepted
in the United States of America (“GAAP”).
Effective June 16, 2013, Yuxing was converted
from being a wholly owned foreign enterprise 100% owned by Jinong to a domestic enterprise 100% owned one natural person, who is not affiliated
to the Company (“Yuxing’s Owner”). Effective the same day, Yuxing’s Owner entered into a series of contractual
agreements with Jinong pursuant to which Yuxing became the VIE of Jinong.
VIE assessment
A VIE is an entity (1) that has total equity at
risk that is not sufficient to finance its activities without additional subordinated financial support from other entities, (2) where
the group of equity holders does not have the power to direct the activities of the entity that most significantly impact the entity’s
economic performance, or the obligation to absorb the entity’s expected losses or the right to receive the entity’s expected
residual returns, or both, or (3) where the voting rights of some investors are not proportional to their obligations to absorb the expected
losses of the entity, their rights to receive the expected residual returns of the entity, or both, and substantially all of the entity’s
activities either involve or are conducted on behalf of an investor that has disproportionately few voting rights. In order to determine
if an entity is considered a VIE, the Company first performs a qualitative analysis, which requires certain subjective decisions regarding
its assessments, including, but not limited to, the design of the entity, the variability that the entity was designed to create and pass
along to its interest holders, the rights of the parties, and the purpose of the arrangement. If the Company cannot conclude after a qualitative
analysis whether an entity is a VIE, it performs a quantitative analysis. The qualitative analysis considered the design of the entity,
the risks that cause variability, the purpose for which the entity was created, and the variability that the entity was designed to pass
along to its variable interest holders. When the primary beneficiary could not be identified through a qualitative analysis, we used internal
cash flow models to compute and allocate expected losses or expected residual returns to each variable interest holder based upon the
relative contractual rights and preferences of each interest holder in the VIE’s capital structure.
Use of estimates
The preparation of consolidated financial statements
in conformity with accounting principles generally accepted in the United States of America requires management to make estimates and
assumptions that affect the reported amounts of assets and liabilities and disclosure of contingent assets and liabilities at the date
of the consolidated financial statements and the amount of revenues and expenses during the reporting periods. Management makes these
estimates using the best information available at the time the estimates are made. However, actual results and outcomes may differ from
management’s estimates and assumptions due to risks and uncertainties.
Leases
The Company determines if an arrangement is a
lease or contains a lease at inception. Operating lease right-of-use assets and lease liabilities are recognized at commencement based
on the present value of lease payments over the lease term. As the implicit rate is typically not readily determinable in the Company’s
lease agreements, the Company uses its incremental borrowing rate as of the lease commencement date to determine the present value of
the lease payments. The incremental borrowing rate is based on the Company’s specific rate of interest to borrow on a collateralized
basis, over a similar term and in a similar economic environment as the lease. Lease expense is recognized on a straight-line basis over
the lease term. Leases with an initial term of 12 months or less are not recognized on the balance sheet; the Company recognizes lease
expense for these leases on a straight-line basis over the lease term. Additionally, the Company accounts for lease and non-lease components
as a single lease component for its identified asset classes. As of September 30, 2023, the Company does not have any material leases
for the implementation of ASC 842.
Cash and cash equivalents and concentration of cash
For statement of cash flows purposes, the Company
considers all cash on hand and in banks, certificates of deposit with state owned banks in the PRC and banks in the United States, and
other highly-liquid investments with maturities of three months or less, when purchased, to be cash and cash equivalents. The Company
maintains large sums of cash in three major banks in China. The aggregate cash in such accounts and on hand as of September 30, 2023 and
June 30, 2023 were $67,166,687 and $69,091,838, respectively. There is no insurance securing these deposits in China. In addition,
the Company also had $119,136 and $2,050,350 in cash in three banks in the United States as of September 30, 2023 and June 30, 2023, respectively.
Cash overdraft as of balance sheet date will be reflected as liabilities in the balance sheet. The Company has not experienced any losses
in such accounts and believes it is not exposed to any significant risks on its cash in bank accounts.
Digital Assets
Digital assets are included
in current assets in the condensed consolidated balance sheets. Digital assets are accounted for as indefinite-lived intangible assets,
and are initially measured in accordance with FASB Accounting Standards Codification (“ASC”) Topic 350 – Intangibles-Goodwill
and Other. The Company measures gains or losses on the disposition of digital assets in accordance with the first-in-first-out (“FIFO”)
method of accounting.
Digital assets are not
amortized, but are assessed for impairment annually, or more frequently, when events or changes in circumstances occur indicating that
it is more likely than not that the indefinite-lived intangible asset is impaired. Whenever the exchange-traded price of digital assets
declines below its carrying value, the Company has determined that an impairment exists and records an impairment equal to the amount
by which the carrying value exceeds the fair value.
As of September
30, 2023, the Company held Bitcoin as digital assets with amount of $41,564. Bitcoin is classified on our balance sheet as a current asset
due to the Company’s ability to sell it in a highly liquid marketplace and its intent to liquidate its Bitcoin to support operations
when needed. As of September 30, 2023, the Company determined that there were no impairments of its digital assets.
Accounts receivable
Management regularly reviews the composition of
accounts receivable and analyzes customer credit worthiness, current economic trends and changes in customer payment patterns to evaluate
the adequacy of these reserves at each year-end. Accounts considered uncollectible are provisioned for /written off based upon management’s
assessment. As of September 30, 2023, and June 30, 2023, the Company had accounts receivable of $19,908,132 and $16,455,734, net of allowance
for doubtful accounts of $50,913,569 and $54,708,486, respectively. The impact of COVID-19 caused the difficulty of accounts receivable
collection from 2020 as numerous distributors encountered significant difficulties and/or hardships in their businesses amid the pandemic.
The company recorded bad debt expense in the amount of $(538,416) and $0 for the three months ended September 30, 2023 and 2022, respectively.
The Company adopts no policy to accept product returns after the sales delivery.
Inventories
Inventory is valued at the lower of cost (determined
on a weighted average basis) or market. Inventories consist of raw materials, work in process, finished goods and packaging materials.
The Company reviews its inventories regularly for possible obsolete goods and establishes reserves when determined necessary. As of September
30, 2023, and 2022, the Company had no reserve for obsolete goods. The company confirmed the loss of $2.4 million and $1.7 million of
inventories for the three months ended September 30, 2023 and 2022, respectively.
Intangible Assets
The Company records intangible assets acquired
individually or as part of a group at fair value. Intangible assets with definitive lives are amortized over the useful life of the intangible
asset, which is the period over which the asset is expected to contribute directly or indirectly to the entity’s future cash flows.
The Company evaluates intangible assets for impairment at least annually and more often whenever events or changes in circumstances indicate
that the carrying value may not be recoverable. Whenever any such impairment exists, an impairment loss will be recognized for the amount
by which the carrying value exceeds the fair value. The Company has not recorded impairment of intangible assets as of September 30,
2023 and 2022, respectively.
Customer deposits
Payments received before all the relevant criteria
for revenue recognition are satisfied are recorded as customer deposits. When all revenue recognition criteria are met, the customer deposits
are recognized as revenue. As of September 30, 2023, and June 30, 2023, the Company had customer deposits of $5,669,071 and $5,489,781,
respectively.
Earnings per share
Basic earnings per share is computed based on
the weighted average number of shares of common stock outstanding during the period. Diluted earnings per share is computed based on
the weighted average number of shares of common stock plus the effect of dilutive potential common shares outstanding during the period
using the treasury stock method. Dilutive potential common shares include outstanding stock options and stock awards.
The components of basic and diluted earnings per share consist of the
following:
| | |
Three Months Ended | |
| | |
September 30, | |
| | |
2023 | | |
2022 | |
| Net loss for Basic Earnings Per Share | |
$ | (1,784,193 | ) | |
$ | (528,114 | ) |
| Basic Weighted Average Number of Shares | |
| 13,380,914 | | |
| 12,930,752 | |
| Net loss Per Share – Basic | |
$ | (0.13 | ) | |
$ | (0.04 | ) |
| Net loss for Diluted Earnings Per Share | |
$ | (1,784,193 | ) | |
$ | (528,114 | ) |
| Diluted Weighted Average Number of Shares | |
| 13,380,914 | | |
| 12,930,752 | |
| Net loss Per Share – Diluted | |
$ | (0.13 | ) | |
$ | (0.04 | ) |
Recent accounting pronouncements
The Company has evaluated all recently issued accounting pronouncements
and does not believe any such pronouncements currently have, and does not expect such pronouncements to have, a material impact on the
Condensed Consolidated Financial Statements on a prospective basis.
NOTE 3 – GOING CERCERN
The Company’s financial statements are prepared
assuming that the Company will continue as a going concern. The Company has incurred operating losses and had negative operating cash
flows during the reporting period from July 1, 2023 through September 30, 2023 and may continue to incur operating losses and generate
negative cash flows as the Company implements its future business plan. If the situation exists, there could be substantial doubt about
the Company’s ability to continue as going concern.
To meet its working capital needs through the
next twelve months and to fund the growth of the Company, the Company may consider plans to raise additional funds through the issuance
of equity or borrow loan from local bank. The ability of the Company to continue as a going concern is dependent upon its ability to successfully
execute its new business strategy and eventually attain profitable operations.
The accompanying financial statements do not include
any adjustments to reflect the recoverability and classification of recorded asset amounts and classification of liabilities that might
be necessary should the Company be unable to continue as going concern.
NOTE 4 – INVENTORIES
Inventories consisted of the following:
| | |
September 30, | | |
June 30, | |
| | |
2023 | | |
2023 | |
| Raw materials | |
$ | 7,377,961 | | |
$ | 11,617,989 | |
| Supplies and packing materials | |
$ | 407,456 | | |
$ | 410,904 | |
| Work in progress | |
$ | 170,203 | | |
$ | 172,248 | |
| Finished goods | |
$ | 34,639,933 | | |
$ | 34,253,990 | |
| Total | |
$ | 42,595,553 | | |
$ | 46,455,131 | |
The company confirmed the loss of $2.4 million
and $1.7 million of inventories for the three months ended September 30, 2023 and 2022, respectively.
NOTE 5 – PROPERTY, PLANT AND EQUIPMENT
Property, plant and equipment consisted of the following:
| | |
September 30, | | |
June 30, | |
| | |
2023 | | |
2023 | |
| Building and improvements | |
$ | 36,877,178 | | |
$ | 37,065,465 | |
| Auto | |
| 2,703,358 | | |
| 2,716,931 | |
| Machinery and equipment | |
| 18,522,972 | | |
| 18,608,254 | |
| Others | |
| 1,502,600 | | |
| - | |
| Total property, plant and equipment | |
| 59,606,108 | | |
| 58,390,650 | |
| Less: accumulated depreciation | |
| (42,086,290 | ) | |
| (41,700,404 | ) |
| Total | |
$ | 17,519,818 | | |
$ | 16,690,246 | |
For the three months ended September 30, 2023,
total depreciation expense was $601,458, decreased $2,072, or 0.3%, from $603,530 for the three months ended September 30, 2022.
NOTE 6 – INTANGIBLE ASSETS AND DIGITAL ASSETS
Intangible assets consisted of the following:
| | |
September 30, | | |
June 30, | |
| | |
2023 | | |
2023 | |
| Land use rights, net | |
$ | 7,767,607 | | |
$ | 7,862,624 | |
| Technology patent, net | |
| - | | |
| - | |
| Customer relationships, net | |
| - | | |
| - | |
| Non-compete agreement | |
| - | | |
| - | |
| Trademarks | |
| 5,672,051 | | |
| 5,701,011 | |
| Total | |
$ | 13,439,658 | | |
$ | 13,563,635 | |
LAND USE RIGHT
On September 25, 2009, Yuxing was granted a land
use right for approximately 88 acres (353,000 square meters or 3.8 million square feet) by the People’s Government and Land &
Resources Bureau of Hu County, Xi’an, Shaanxi Province. The fair value of the related intangible asset was determined to be the
respective cost of RMB73,184,895 (or $10,033,649). The intangible asset is being amortized over the grant period of 50 years using the
straight-line method.
On August 13, 2003, Tianjuyuan was granted a certificate
of Land Use Right for a parcel of land of approximately 11 acres (42,726 square meters or 459,898 square feet) at Ping Gu District, Beijing.
The purchase cost was recorded at RMB1,045,950 (or $143,400). The intangible asset is being amortized over the grant period of 50 years.
On August 16, 2001, Jinong received a land use
right as a contribution from a shareholder, which was granted by the People’s Government and Land & Resources Bureau of Yangling
District, Shaanxi Province. The fair value of the related intangible asset at the time of the contribution was determined to be RMB7,285,099
(or $998,787). The intangible asset is being amortized over the grant period of 50 years.
The Land Use Rights consisted of the following:
| | |
September 30, | | |
June 30, | |
| | |
2023 | | |
2023 | |
| Land use rights | |
$ | 11,032,436 | | |
| 11,088,765 | |
| Less: accumulated amortization | |
| (3,264,829 | ) | |
| (3,226,141 | ) |
| Total land use rights, net | |
$ | 7,767,607 | | |
| 7,862,624 | |
TECHNOLOGY PATENT
On August 16, 2001, Jinong was issued a technology
patent related to a proprietary formula used in the production of humic acid. The fair value of the related intangible asset was determined
to be the respective cost of RMB 5,875,068 (or $805,472) and is being amortized over the patent period of 10 years using the straight-line
method. This technology patent has been fully amortized.
On July 2, 2010, the Company acquired Gufeng and
its wholly-owned subsidiary Tianjuyuan. The fair value of the acquired technology patent was estimated to be RMB9,200,000 (or $1,261,320)
and is amortized over the remaining useful life of six years using the straight-line method. As of September 30, 2023, this technology
patent is fully amortized.
The technology know-how consisted of the following:
| | |
September 30, | | |
June 30, | |
| | |
2023 | | |
2023 | |
| Technology know-how | |
$ | 2,066,792 | | |
$ | 2,077,344 | |
| Less: accumulated amortization | |
| (2,066,792 | ) | |
| (2,077,344 | ) |
| Total technology know-how, net | |
$ | - | | |
$ | - | |
CUSTOMER RELATIONSHIPS
On July 2, 2010, the Company acquired Gufeng and
its wholly-owned subsidiary Tianjuyuan. The fair value of the acquired customer relationships was estimated to be RMB65,000,000 (or $8,911,500)
and is amortized over the remaining useful life of ten years.
| | |
September 30, | | |
June 30, | |
| | |
2023 | | |
2023 | |
| Customer relationships | |
$ | 8,911,500 | | |
$ | 8,957,000 | |
| Less: accumulated amortization | |
| (8,911,500 | ) | |
| (8,957,000 | ) |
| Total customer relationships, net | |
$ | - | | |
$ | - | |
NON-COMPETE AGREEMENT
On July 2, 2010, the Company acquired Gufeng and
its wholly-owned subsidiary Tianjuyuan. The fair value of the acquired non-compete agreement was estimated to be RMB1,320,000 (or $180,972)
and is amortized over the remaining useful life of five years using the straight-line method.
| | |
September 30, | | |
June 30, | |
| | |
2023 | | |
2023 | |
| Non-compete agreement | |
$ | 180,972 | | |
$ | 181,896 | |
| Less: accumulated amortization | |
| (180,972 | ) | |
| (181,896 | ) |
| Total non-compete agreement, net | |
$ | - | | |
$ | - | |
TRADEMARKS
On July 2, 2010, the Company acquired Gufeng and
its wholly-owned subsidiary Tianjuyuan. The preliminary fair value of the acquired trademarks was estimated to be RMB41, 371,630 (or $5,672,051)
and is subject to an annual impairment test.
AMORTIZATION EXPENSE
Estimated amortization expenses of intangible
assets for the next five twelve months periods ended September 30, are as follows:
| Twelve Months Ended on September 30, | |
Expense
($) | |
| 2024 | |
| 286,798 | |
| 2025 | |
| 247,300 | |
| 2026 | |
| 228,983 | |
| 2027 | |
| 220,306 | |
| 2028 | |
| 220,306 | |
DIGITAL ASSETS
On March 13, 2023, the Company established Antaeus
Tech Inc. (“Antaeus”) in the State of Delaware. In April 2023, Antaeus started to purchase digital assets mining machines
and to mine Bitcoin in West Texas. As of September 30, 2023, the company held digital assets with amount of $41,564.
NOTE 7 – OTHER NON-CURRENT ASSETS
Other non-current assets mainly include advance
payments related to leasing land for use by the Company. As of September 30, 2023, the balance of other non-current assets was $4,605,489,
which was the lease fee advances for agriculture lands that the Company engaged in Shiquan County from 2025 to 2027.
In March 2017, Jinong entered into a lease agreement
for approximately 3,400 mu, and 2600-hectare agriculture lands in Shiquan County, Shaanxi Province. The lease was from April 2017 and
was renewable for every ten-year period up to 2066. The aggregate leasing fee was approximately RMB 13 million per annum, The Company
had made 10-year advances of leasing fee per lease terms. The Company has amortized $0.5 million and $0.5 million as expenses for the
three months ended September 30, 2023 and 2022, respectively.
Estimated amortization expenses of the lease advance
payments for the next four twelve-month periods ended September 30 and thereafter are as follows:
| Twelve months ending September 30, | |
| |
| 2024 | |
$ | 1,840,568 | |
| 2025 | |
$ | 1,840,568 | |
| 2026 | |
$ | 1,840,568 | |
| 2027 | |
$ | 924,354 | |
NOTE 8 – ACCRUED EXPENSES AND OTHER PAYABLES
Accrued expenses and other payables consisted of the following:
| | |
September 30, | | |
June 30, | |
| | |
2023 | | |
2023 | |
| Payroll and welfare payable | |
$ | 165,186 | | |
$ | 188,222 | |
| Accrued expenses | |
| 10,135,859 | | |
| 9,805,444 | |
| Other payables | |
| 4,701,917 | | |
| 4,820,193 | |
| Other levy payable | |
| 114,981 | | |
| 115,568 | |
| Total | |
$ | 15,117,943 | | |
$ | 14,929,427 | |
NOTE 9 – AMOUNT DUE TO RELATED PARTIES
At the end of December 2015, Yuxing entered into
a sales agreement with the Company’s affiliate, 900LH.com Food Co., Ltd. (“900LH.com”, previously announced as Xi’an
Gem Grain Co., Ltd) pursuant to which Yuxing is to supply various vegetables to 900LH.com for its incoming seasonal sales at the holidays
and year ends (the “Sales Agreement”). The contingent contracted value of the Sales Agreement is RMB 25,500,000 (approximately
$3,496,050). For the three months ended September 30, 2023 and 2022, Yuxing hadn’t sold any products to 900LH.com.
The amount due from 900LH.com to Yuxing was $0
and $27,560 as of September 30, 2023 and June 30, 2023, respectively.
As of September 30, 2023, and June 30, 2023, the
amount due to related parties was $5,625,161 and $5,439,209, respectively. As of September 30, 2023, and June 30, 2023, $959,700
and $964,600, respectively were amounts that Gufeng borrowed from a related party, Xi’an Techteam Science& Technology Industry
(Group) Co. Ltd., a company controlled by Mr. Zhuoyu Li, Chairman and CEO of the Company, representing unsecured, non-interest-bearing
loans that are due on demand. These loans are not subject to written agreements. As of September 30, 2023, and June 30, 2023,
$2,336,693 and $2,261,693, respectively were advances from Mr. Zhuoyu Li, Chairman and CEO of the Company. The advances were unsecured
and non-interest-bearing. As of September 30, 2023, and June 30, 2023, $116,000 and $0, respectively were advances from Mr. Zhibiao Pan,
Co-CEO of the Company. The advances were unsecured and non-interest-bearing.
As of September 30, 2023, and June 30, 2023, the
Company’s subsidiary, Jinong, owed 900LH.com $990 and $995, respectively.
On July 1, 2022, Jinong signed an office lease
with Kingtone Information Technology Co., Ltd. (“Kingtone Information”), of which Mr. Zhuoyu Li, Chairman and CEO of the Company,
served as Chairman. Pursuant to the lease, Jinong rented 612 square meters (approximately 6,588 square feet) of office space from Kingtone
Information. The lease provides for a two-year term effective as of July 1, 2022 with monthly rent of RMB28,000 (approximately $3,839).
NOTE 10 – LOAN PAYABLES
As of September 30, 2023, the short-term and long-term
loan payables consisted of four loans which mature on dates ranging from June 5, 2024 through August 18, 2024 with interest rates ranging
from 3.65% to 5.00%. The first three loans are collateralized by Tianjuyuan’s land use right and building ownership right.
| No. | |
Payee | |
Loan period per agreement | |
Interest
Rate | | |
September 30,
2023 | |
| 1 | |
Beijing Bank -Pinggu Branch | |
June 5, 2023-June 5, 2024 | |
| 4.15 | % | |
| 1,371,000 | |
| 2 | |
Huaxia Bank -HuaiRou Branch | |
June 28, 2023-June 28, 2024 | |
| 3.65 | % | |
| 1,371,000 | |
| 3 | |
Pinggu New Village Bank | |
June 29, 2023-June 28, 2024 | |
| 5.00 | % | |
| 959,700 | |
| 4 | |
Industrial Bank Co. Ltd | |
August 19, 2022-August 18, 2024 | |
| 3.98 | % | |
| 987,120 | |
| | |
Total | |
| |
| | | |
$ | 4,688,820 | |
The interest expense from loans was $67,554 and
$82,244 for the three months ended September 30, 2023 and 2022, respectively.
NOTE 11 – TAXES PAYABLE
Enterprise Income Tax
Effective January 1, 2008, the Enterprise Income
Tax (“EIT”) law of the PRC replaced the tax laws for Domestic Enterprises (“DEs”) and Foreign Invested Enterprises
(“FIEs”). The EIT rate of 25% replaced the 33% rate that was applicable to both DEs and FIEs. The two-year tax exemption and
three-year 50% tax reduction tax holiday for production-oriented FIEs was eliminated. Since January 1, 2008, Jinong became subject to
income tax in China at a rate of 15% as a high-tech company, because of the expiration of its tax exemption on December 31, 2007. Accordingly,
it made no provision for income taxes for the three-month period ended September 30, 2023 and 2022.
Value-Added Tax
All the Company’s fertilizer products that
are produced and sold in the PRC were subject to a Chinese Value-Added Tax (VAT) of 13% of the gross sales price. On April 29, 2008, the
PRC State of Administration of Taxation (SAT) released Notice #56, “Exemption of VAT for Organic Fertilizer Products”,
which allows certain fertilizer products to be exempt from VAT beginning June 1, 2008. The Company submitted the application for exemption
in May 2009, which was granted effective September 1, 2009, continuing through December 31, 2015. On August 10, 2015 and August 28, 2015,
the SAT released Notice #90. “Reinstatement of VAT for Fertilizer Products”, and Notice #97, “Supplementary
Reinstatement of VAT for Fertilizer Products”, which restore the VAT of 13% of the gross sales price on certain fertilizer products
includes non-organic fertilizer products starting from September 1, 2015, but granted taxpayers a reduced rate of 3% from September 1,
2015 through June 30, 2016.
On April 28, 2017, the PRC State of Administration
of Taxation (SAT) released Notice 2017 #37, “Notice on Policy of Reduced Value Added Tax Rate,” under which, effective
July 1, 2017, all the Company’s fertilizer products that are produced and sold in the PRC are subject to a Chinese Value-Added Tax
(VAT) of 11% of the gross sales price. The tax rate was reduced 2% from 13%.
On April 4, 2018, the PRC State of Administration
of Taxation (SAT) released Notice 2018 #32, “Notice on Adjustment of VAT Tax Rate,” under which, effective May 1, 2018,
all the Company’s fertilizer products that are produced and sold in the PRC are subject to a Chinese Value-Added Tax (VAT) of 10%
of the gross sales price. The tax rate was reduced 1% from 11%.
On March 20, 2019, the PRC State of Administration
of Taxation (SAT) released Notice 2019 #39, “Announcement on Policies Concerning Deepening the Reform of Value Added Tax,”
under which, effective April 1, 2019, all the Company’s fertilizer products that are produced and sold in the PRC are subject to
a Chinese Value-Added Tax (VAT) of 9% of the gross sales price. The tax rate was reduced 1% from 10%.
Income Taxes and Related Payables
| | |
September 30, | | |
June 30, | |
| | |
2023 | | |
2023 | |
| VAT provision | |
$ | (456,256 | ) | |
$ | (398,499 | ) |
| Income tax payable | |
| (2,121,569 | ) | |
| (2,132,400 | ) |
| Other levies | |
| 600,789 | | |
| 591,325 | |
| Repatriation tax | |
| 29,010,535 | | |
| 29,010,535 | |
| Total | |
$ | 27,033,499 | | |
$ | 27,070,961 | |
The provision for income taxes consists of the following:
| | |
September 30, | | |
September 30, | |
| | |
2023 | | |
2022 | |
| Current tax - foreign | |
$ | (4,413 | ) | |
$ | - | |
| Deferred tax | |
| - | | |
| - | |
| Total | |
$ | (4,413 | ) | |
$ | - | |
Significant components of deferred tax assets were as follows:
| | |
September 30, | | |
June 30, | |
| | |
2023 | | |
2023 | |
| Deferred tax assets | |
| | |
| |
| Deferred Tax Benefit | |
| 32,304,001 | | |
| 32,464,001 | |
| Valuation allowance | |
| (32,201,767 | ) | |
| (32,366,181 | ) |
| Total deferred tax assets | |
$ | 102,233 | | |
| 97,820 | |
Tax Rate Reconciliation
Our effective tax rates were approximately 0.2%
and 0% for the three months ended September 30, 2023 and 2022, respectively. Substantially all the Company’s income before income
taxes and related tax expense are from PRC sources. Actual income tax benefit reported in the consolidated statements of operations and
comprehensive income (loss) differ from the amounts computed by applying the US statutory income tax rate of 21.0% to income before income
taxes for the Three months Ended September 30, 2023 and 2022 for the following reasons:
September 30, 2023
| | |
China
15% - 25% | | |
| | |
United
States 21% | | |
| | |
Total | | |
| |
| Pretax loss | |
$ | (1,243,531 | ) | |
| | | |
| (545,075 | ) | |
| | | |
$ | (1,788,606 | ) | |
| | |
| | |
| | | |
| | | |
| | | |
| | | |
| | | |
| | |
| Expected income tax expense (benefit) | |
| (310,883 | ) | |
| 25.0 | % | |
| (114,466 | ) | |
| 21.0 | % | |
| (425,349 | ) | |
| | |
| High-tech income benefits on Jinong | |
| - | | |
| - | | |
| - | | |
| - | | |
| - | | |
| | |
| Losses from subsidiaries in which no benefit is recognized | |
| 306,469 | | |
| -24.6 | % | |
| - | | |
| - | | |
| 306,469 | | |
| | |
| Change in valuation allowance on deferred tax asset from US tax benefit | |
| - | | |
| - | | |
| 114,466 | | |
| (21.0 | )% | |
| 114,466 | | |
| | |
| Actual tax expense | |
$ | (4,413 | ) | |
| 0.4 | % | |
$ | - | | |
| - | | |
$ | (4,413 | ) | |
| 0.2 | % |
September 30, 2022
| | |
China
15% - 25% | | |
| | |
United
States 21% | | |
| | |
Total | | |
| |
| Pretax loss | |
$ | 449,437 | | |
| | | |
| (977,551 | ) | |
| | | |
$ | (528,114 | ) | |
| | |
| | |
| | | |
| | | |
| | | |
| | | |
| | | |
| | |
| Expected income tax expense (benefit) | |
| 112,359 | | |
| 25.0 | % | |
| (205,286 | ) | |
| 21.0 | % | |
| (92,927 | ) | |
| | |
| High-tech income benefits on Jinong | |
| (246,088 | ) | |
| (54.8 | )% | |
| - | | |
| - | | |
| (246,088 | ) | |
| | |
| Losses from subsidiaries in which no benefit is recognized | |
| 133,728 | | |
| 29.8 | % | |
| - | | |
| - | | |
| 133,728 | | |
| | |
| Change in valuation allowance on deferred tax asset from US tax benefit | |
| - | | |
| - | | |
| 205,286 | | |
| (21.0 | )% | |
| 205,286 | | |
| | |
| Actual tax expense | |
$ | - | | |
| - | | |
$ | - | | |
| - | | |
$ | - | | |
| 0 | % |
NOTE 12 – STOCKHOLDERS’ EQUITY
Common Stock
There were no shares of common stock issued during
the quarter ended September 30, 2023.
On August 2, 2022, the Company completed the issuance
of 1,117,142 shares of its Common Stock for $16,757,130 to P Kevin HODL Ltd, an entity owned and controlled by Mr. Zhibiao Pan, who was
subsequently appointed as the Company’s co-Chief Executive Officer on August 25, 2022. This sale was made pursuant to the Share
Purchase Agreement dated November 23, 2021 in transactions exempt from registration under the Securities Act of 1933, as amended, in reliance
on an exemption provided by Rule 903 of Regulation S and/or Section 4(a)(2) of the Securities Act.
As of September 30, 2023, and June 30, 2023, there
were 13,380,914 and 13,380,914 shares of common stock issued and outstanding, respectively.
Preferred Stock
Under the Company’s Articles of Incorporation,
the Board has the authority, without further action by stockholders, to designate up to 20,000,000 shares of preferred stock in one or
more series and to fix the rights, preferences, privileges, qualifications and restrictions granted to or imposed upon the preferred stock,
including dividend rights, conversion rights, voting rights, rights and terms of redemption, liquidation preference and sinking fund terms,
any or all of which may be greater than the rights of the common stock. If the Company sells preferred stock under its registration statement
on Form S-3, it will fix the rights, preferences, privileges, qualifications and restrictions of the preferred stock of each series in
the certificate of designation relating to that series and will file the certificate of designation that describes the terms of the series
of preferred stock the Company offers before the issuance of the related series of preferred stock.
As of September 30, 2023, the Company has 20,000,000
shares of preferred stock authorized, with a par value of $.001 per share, of which no shares are issued or outstanding.
NOTE 13 – CONCENTRATIONS AND LITIGATION
Market Concentration
The majority of the Company’s revenue-generating
operations are conducted in the PRC. Accordingly, the Company’s business, financial condition and results of operations may be influenced
by the political, economic and legal environments in the PRC, and by the general state of the PRC’s economy.
The Company’s operations in the PRC are
subject to specific considerations and significant risks not typically associated with companies in North America and Western Europe.
These include risks associated with, among other things, the political, economic and legal environment and foreign currency exchange.
The Company’s results may be adversely affected by, among other things, changes in governmental policies with respect to laws and
regulations, anti-inflationary measures, currency conversion and remittance abroad, and rates and methods of taxation.
Vendor and Customer Concentration
There are three vendors that the Company purchased over 10% of its
raw materials with an aggregate amount of $6,878,429, or 10.7%, 10.5%, and 10.1%, respectively, for fertilizer manufacturing during the
three months ended September 30, 2023.
None of the vendors accounted over 10% of the Company’s purchase
of raw materials and supplies for the three months ended September 30, 2022.
No customer accounted for over 10% of the Company’s sales for
the three months ended September 30, 2023 and 2022.
Litigation
On June 5, 2020, an individual filed suit pro
se (as in, representing oneself without an attorney) in the Southern District of Florida federal court alleging violations of the Securities
Exchange Act. The Company believes the action is without merit and vigorously opposed it. The company moved to dismiss the litigation
and for attorney’s fees from the plaintiff. On November 2, 2020, the case was transferred to the United States District Court for
The Southern District Of New York. On September 30, 2021, the Southern District of New York federal court presiding over the case dismissed
all claims against the company, its executives, and its independent directors. The dismissal was without prejudice and the plaintiff
can appeal or amend within 30 days, or by October 29, 2021. The plaintiff amended the complaint on Oct 30, 2021. On August 30, 2022, the
Southern District of New York federal court presiding over the case issued an order granting motions to dismiss all claims in the amended
complaint against the Company, its executives, and its independent directors. On September 6, 2022, the plaintiff filed a notice of civil
appeal to the U.S. Court of Appeals, Second Circuit. The appeal has now been fully briefed and the Company expects a decision to issue
sometime in the coming year.
There are no other actions, suits, proceedings,
inquiries or investigations before or by any court, public board, government agency, self-regulatory organization or body pending or,
to the knowledge of the executive officers of our company or any of our subsidiaries, threatened against or affecting our company, our
common stock, any of our subsidiaries or of our companies or our subsidiaries’ officers or directors in their capacities as such,
in which an adverse decision could have a material adverse effect.
NOTE 14 – SEGMENT REPORTING
As of September 30, 2023, the Company was organized
into four main business segments based on location and product: Jinong (fertilizer production), Gufeng (fertilizer production), Yuxing
(agricultural products production) and Antaeus (Bitcoin). Each of the four operating segments referenced above has separate and distinct
general ledgers. The chief operating decision maker (“CODM”) receives financial information, including revenue, gross margin,
operating income and net income produced from the various general ledger systems to make decisions about allocating resources and assessing
performance; however, the principal measure of segment profitability or loss used by the CODM is net income by segment.
| | |
Three Months Ended
September 30, | |
| | |
2023 | | |
2022 | |
| Revenues from unaffiliated customers: | |
| | |
| |
| Jinong | |
$ | 9,288,758 | | |
$ | 12,148,002 | |
| Gufeng | |
| 10,421,274 | | |
| 12,578,822 | |
| Yuxing | |
| 2,342,716 | | |
| 2,870,501 | |
| Antaeus | |
| 345,114 | | |
| - | |
| Consolidated | |
$ | 22,397,862 | | |
| 27,597,325 | |
| | |
| | | |
| | |
| Operating income (expense): | |
| | | |
| | |
| Jinong | |
$ | (145,123 | ) | |
$ | 919,643 | |
| Gufeng | |
| (1,219,882 | ) | |
| (663,730 | ) |
| Yuxing | |
| 154,682 | | |
| 183,994 | |
| Antaeus | |
| (30,496 | ) | |
| - | |
| Reconciling item (1) | |
| - | | |
| - | |
| Reconciling item (2) | |
| (545,088 | ) | |
| (977,567 | ) |
| Consolidated | |
$ | (1,785,907 | ) | |
$ | (537,660 | ) |
| | |
| | | |
| | |
| Net income (loss): | |
| | | |
| | |
| Jinong | |
$ | (114,362 | ) | |
$ | 984,350 | |
| Gufeng | |
| (1,262,423 | ) | |
| (746,500 | ) |
| Yuxing | |
| 154,271 | | |
| 211,586 | |
| Antaeus | |
| (16,603 | ) | |
| - | |
| Reconciling item (1) | |
| 12 | | |
| 16 | |
| Reconciling item (2) | |
| (545,088 | ) | |
| (977,566 | ) |
| Consolidated | |
$ | (1,784,193 | ) | |
$ | (528,114 | ) |
| | |
| | | |
| | |
| Depreciation and Amortization: | |
| | | |
| | |
| Jinong | |
$ | 189,307 | | |
$ | 198,245 | |
| Gufeng | |
| 182,340 | | |
| 193,653 | |
| Yuxing | |
| 185,225 | | |
| 270,280 | |
| Antaeus | |
| 100,087 | | |
| - | |
| Consolidated | |
$ | 656,959 | | |
$ | 662,177 | |
| | |
| | | |
| | |
| Interest expense: | |
| | | |
| | |
| Jinong | |
| 25,128 | | |
| - | |
| Gufeng | |
| 42,426 | | |
| 82,244 | |
| Yuxing | |
| - | | |
| - | |
| Antaeus | |
| - | | |
| - | |
| Consolidated | |
$ | 67,554 | | |
$ | 82,244 | |
| | |
| | | |
| | |
| Capital Expenditure: | |
| | | |
| | |
| Jinong | |
$ | 743 | | |
$ | 3,762 | |
| Gufeng | |
| - | | |
| 219,870 | |
| Yuxing | |
| 3,684 | | |
| 4,909 | |
| Antaeus | |
| 1,502,600 | | |
| - | |
| Consolidated | |
$ | 1,507,027 | | |
$ | 228,541 | |
| | |
As of | |
| | |
September 30, | | |
June 30, | |
| | |
2023 | | |
2023 | |
| Identifiable assets: | |
| | |
| |
| Jinong | |
$ | 86,188,315 | | |
$ | 87,862,836 | |
| Gufeng | |
| 47,935,231 | | |
| 49,749,041 | |
| Yuxing | |
| 38,355,326 | | |
| 38,223,482 | |
| Antaeus | |
| 2,839,333 | | |
| 3,292,247 | |
| Reconciling item (1) | |
| 7,376,949 | | |
| 7,387,637 | |
| Reconciling item (2) | |
| 166,121 | | |
| 166,121 | |
| Consolidated | |
$ | 182,861,275 | | |
$ | 186,681,364 | |
NOTE 15 – COMMITMENTS AND CONTINGENCIES
We are subject to various claims and contingencies
related to lawsuits, certain taxes and environmental matters, as wells commitments under contractual and other commercial obligations.
We recognize liabilities for commitments and contingencies when a loss is probable and estimable.
On July 1, 2022, Jinong signed an office lease
with Kingtone Information Technology Co., Ltd. (“Kingtone Information”), of which Mr. Zhuoyu Li, Chairman and CEO of the Company,
served as Chairman. Pursuant to the lease, Jinong rented 612 square meters (approximately 6,588 square feet) of office space from Kingtone
Information. The lease provides for a two-year term effective as of July 1, 2022 with monthly rent of RMB28,000 (approximately $3,839).
In February 2004, Tianjuyuan signed a fifty-year
rental agreement with the village committee of Dong Gao Village and Zhen Nan Zhang Dai Village in the Beijing Ping Gu District.
On April 2, 2023, Antaeus signed a one-year rental
agreement for an office in Austin, Texas for approximately 404 square meters (4,348 square feet) space.
Accordingly, the Company recorded an aggregate
of $13,783 and $13,021 as rent expenses from these committed property leases for the three-month periods ended September 30, 2023 and
2022, respectively. The contingent rent expenses herein for the next five twelve-month periods ended September 30, are as follows:
| Years ending September 30, | |
| |
| 2024 | |
$ | 55,132 | |
| 2025 | |
| 55,132 | |
| 2026 | |
| 55,132 | |
| 2027 | |
| 55,132 | |
| 2028 | |
| 55,132 | |
NOTE 16 – VARIABLE INTEREST ENTITIES
In accordance with accounting standards regarding
consolidation of variable interest entities, VIEs are generally entities that lack sufficient equity to finance their activities without
additional financial support from other parties or whose equity holders lack adequate decision-making ability. All VIEs with which a company
is involved must be evaluated to determine the primary beneficiary of the risks and rewards of the VIE. The primary beneficiary is required
to consolidate the VIE for financial reporting purposes.
Green Nevada through one of its subsidiaries,
Jinong, entered into a series of agreements (the “VIE Agreements”) with Yuxing for it to qualify as a VIE, effective June
16, 2013.
The Company has concluded, based on the contractual
arrangements, that Yuxing is a VIE and that the Company’s wholly owned subsidiary, Jinong, absorbs most of the risk of loss from
the activities of Yuxing, thereby enabling the Company, through Jinong, to receive a majority of Yuxing expected residual returns.
On June 30, 2016 and January 1, 2017, the Company,
through its wholly owned subsidiary Jinong, entered into strategic acquisition agreements and into a series of contractual agreements
to qualify as VIEs with the shareholders of the sales VIE Companies.
Jinong, the sales VIE Companies, and the shareholders
of the sales VIE Companies also entered into a series of contractual agreements for the sales VIE Companies to qualify as VIEs (the “VIE
Agreements”).
On November 30, 2017, the Company, through its
wholly owned subsidiary Jinong, exited the VIE agreements with the shareholders of Zhenbai.
On June 2, 2021, the Company, through its wholly
owned subsidiary Jinong, discontinued the strategic acquisition agreements and the series of contractual agreements with the shareholders
of Xindeguo, Xinyulei and Xiangrong.
On December 1, 2021, the Company, through its
wholly owned subsidiary Jinong, discontinued the strategic acquisition agreements and the series of contractual agreements with the shareholders
of Lishijie.
On December 31, 2021, the Company, through its
wholly owned subsidiary Jinong, discontinued the strategic acquisition agreements and the series of contractual agreements with the shareholders
of Fengnong.
On March 31, 2022, the Company, through its wholly
owned subsidiary Jinong, discontinued the strategic acquisition agreements and the series of contractual agreements with the shareholders
of Jinyangguang and Wangtian.
As a result of these contractual arrangements,
with Yuxing and the sales VIE Companies the Company is entitled to substantially all the economic benefits of Yuxing and the VIE Companies.
The following financial statement amounts and balances of the VIE (Yuxing) was included in the accompanying consolidated financial statements
as of September 30, 2023 and June 30, 2023:
| | |
September 30, | | |
June 30, | |
| | |
2023 | | |
2023 | |
| | |
| | |
| |
| ASSETS | |
| | |
| |
| Current Assets | |
| | |
| |
| Cash and cash equivalents | |
$ | 278,236 | | |
$ | 323,854 | |
| Accounts receivable, net | |
| 622,237 | | |
| 283,221 | |
| Inventories | |
| 24,388,477 | | |
| 24,288,379 | |
| Other current assets | |
| 121,753 | | |
| 108,677 | |
| Related party receivable | |
| - | | |
| 27,560 | |
| | |
| | | |
| | |
| Total Current Assets | |
| 25,410,703 | | |
| 25,031,691 | |
| | |
| | | |
| | |
| Plant, Property and Equipment, Net | |
| 5,727,384 | | |
| 5,887,278 | |
| Other assets | |
| 9,734 | | |
| 9,784 | |
| Intangible Assets, Net | |
| 7,207,505 | | |
| 7,294,729 | |
| Total Assets | |
$ | 38,355,326 | | |
$ | 38,223,482 | |
| | |
| | | |
| | |
| LIABILITIES AND STOCKHOLDERS’ EQUITY | |
| | | |
| | |
| Current Liabilities | |
| | | |
| | |
| Accounts payable | |
$ | 58,898 | | |
$ | 12,512 | |
| Customer deposits | |
| 18,126 | | |
| 62,134 | |
| Accrued expenses and other payables | |
| 281,690 | | |
| 282,968 | |
| Amount due to related parties | |
| 39,316,184 | | |
| 39,346,051 | |
| Total Current Liabilities | |
| 39,674,898 | | |
| 39,703,665 | |
| Total Liabilities | |
$ | 39,674,898 | | |
| 39,703,665 | |
| | |
| | | |
| | |
| Stockholders’ equity | |
| (1,319,572 | ) | |
| (1,480,183 | ) |
| | |
| | | |
| | |
| Total Liabilities and Stockholders’ Equity | |
$ | 38,355,326 | | |
$ | 38,223,482 | |
| | |
Three Months Ended
September 30, | |
| | |
2023 | | |
2022 | |
| Revenue | |
$ | 2,342,717 | | |
$ | 2,870,501 | |
| Expenses | |
| 2,188,446 | | |
| 2,658,915 | |
| Net income | |
$ | 154,271 | | |
$ | 211,586 | |
NOTE 17 – SUBSEQUENT EVENTS
In accordance with ASC 855-10, the Company has
analyzed its operations after September 30, 2023 to the date these unaudited condensed consolidated financial statements were available
to be issued and has determined that there were no significant subsequent events or transactions that would require recognition or disclosure
in the unaudited condensed consolidated financial statements.
Item 2. Management’s Discussion and Analysis
of Financial Condition and Results of Operations
The following discussion and analysis of our
financial condition and results of operations should be read in conjunction with our consolidated financial statements and the notes to
those financial statements appearing elsewhere in this report. This discussion and analysis contain forward-looking statements that involve
significant risks and uncertainties. As a result of many factors, such as the slow-down of the macro-economic environment in China and
its impact on economic growth in general, the competition in the fertilizer industry and the impact of such competition on pricing, revenues
and margins, the weather conditions in the areas where our customers are based, the cost of attracting and retaining highly skilled personnel,
the prospects for future acquisitions, and the factors set forth elsewhere in this report, our actual results may differ materially from
those anticipated in these forward-looking statements. With these risks and uncertainties, there can be no assurance that the forward-looking
statements contained in this report will in fact occur. You should not place undue reliance on the forward-looking statements contained
in this report.
The forward-looking statements speak only as
of the date on which they are made, and, except to the extent required by U.S. federal securities laws, we undertake no obligation to
update any forward-looking statement to reflect events or circumstances after the date on which the statement is made or to reflect the
occurrence of unanticipated events. Further, the information about our intentions contained in this report is a statement of our
intention as of the date of this report and is based upon, among other things, the existing regulatory environment, industry conditions,
market conditions and prices, and our assumptions as of such date. We may change our intentions, at any time and without notice,
based upon any changes in such factors, in our assumptions or otherwise.
Unless the context indicates otherwise, as
used in the notes to the financial statements of the Company, the following are the references herein of all the subsidiaries of the Company
(i) Green Agriculture Holding Corporation (“Green New Jersey”), a wholly-owned subsidiary of Green Nevada incorporated in
the State of New Jersey; (ii) Shaanxi TechTeam Jinong Humic Acid Product Co., Ltd. (“Jinong”), a wholly-owned subsidiary of
Green New Jersey organized under the laws of the PRC; (iii) Xi’an Hu County Yuxing Agriculture Technology Development Co., Ltd.
(“Yuxing”), a Variable Interest Entity in the PRC (“VIE”) controlled by Jinong through contractual agreements;
(iv) Beijing Gufeng Chemical Products Co., Ltd., a wholly-owned subsidiary of Jinong in the PRC (“Gufeng”); (v) Beijing Tianjuyuan
Fertilizer Co., Ltd., Gufeng’s wholly-owned subsidiary in the PRC (“Tianjuyuan”). Yuxing may also collectively be referred
to as the “the VIE Company”, and (vi)Antaeus Tech, Inc. (“Antaeus”), a wholly-owned subsidiary of Green Nevada
incorporated in the State of Delaware.
Unless the context otherwise requires, all
references to (i) “PRC” and “China” are to the People’s Republic of China; (ii) “U.S. dollar,”
“$” and “US$” are to United States dollars; and (iii) “RMB”, “Yuan” and Renminbi are to
the currency of the PRC or China.
Overview
We are engaged in the research, development, production,
and sale of various types of fertilizers, agricultural products and Bitcoin in the PRC and United State through our wholly owned Chinese
subsidiaries, Jinong and Gufeng (including Gufeng’s subsidiary Tianjuyuan), our VIE, Yuxing and our wholly owned U.S. subsidiary
Antaeus. Our primary business is fertilizer products, specifically humic-acid based compound fertilizer produced by Jinong and compound
fertilizer, blended fertilizer, organic compound fertilizer, slow-release fertilizer, highly concentrated water-soluble fertilizer, and
mixed organic-inorganic compound fertilizer produced by Gufeng. In addition, through Yuxing, we develop and produce various agricultural
products, such as top-grade fruits, vegetables, flowers and colored seedlings. Besides, we engaged in the mining of digital assets Bitcoin
through Antaeus. For financial reporting purposes, our operations are organized into four business segments: fertilizer products (Jinong),
fertilizer products (Gufeng), agricultural products (Yuxing), and Bitcoin (Antaeus).
The fertilizer business conducted by Jinong and
Gufeng generated approximately 88.0% and 89.6% of our total revenues for the three months ended September 30, 2023 and 2022, respectively.
Yuxing generated 10.5% and 10.4% of our revenues for the years ended September 30, 2023 and 2022, respectively. Yuxing serves as a research
and development base for our fertilizer products. Antaeus generated 1.5% and 0% of our revenues for the years ended September 30,
2023 and 2022, respectively.
Fertilizer Products
As of September 30, 2023, we had developed and
produced a total of 409 different fertilizer products in use, of which 73 were developed and produced by Jinong, 336 by Gufeng.
Below is a table that shows the metric tons of
fertilizer sold by Jinong and Gufeng and the revenue per ton for the periods indicated:
| | |
Three Months Ended | | |
| | |
| |
| | |
September 30, | | |
Change 2022 to 2023 | |
| | |
2023 | | |
2022 | | |
Amount | | |
% | |
| | |
(metric tons) | | |
| | |
| |
| Jinong | |
8,036 | | |
9,385 | | |
(1,349 | ) | |
-14.4 | % |
| Gufeng | |
| 20,809 | | |
| 24,171 | | |
| (3,362 | ) | |
| -13.9 | % |
| | |
| 28,845 | | |
| 33,556 | | |
| (4,711 | ) | |
| -14.0 | % |
| | |
Three Months Ended
September 30, | |
| | |
2023 | | |
2022 | |
| | |
(revenue per tons) | |
| Jinong | |
$ | 1,157 | | |
$ | 1,294 | |
| Gufeng | |
| 501 | | |
| 520 | |
For the three months ended September 30, 2023,
we sold approximately 28,845 tons of fertilizer products, as compared to 33,556 metric tons for the three months ended September 30, 2022.
For the three months ended September 30, 2023, Jinong sold approximately 8,036 metric tons of fertilizer products, as compared to 9,385
metric tons for the three months ended September 30, 2022. For the three months ended September 30, 2023, Gufeng sold approximately 20,809
metric tons of fertilizer products, as compared to 24,171 metric tons for the three months ended September 30, 2022.
Our sales of fertilizer products to customers
in five provinces within China accounted for approximately 61.9% of our fertilizer revenue for the three months ended September 30, 2023.
Specifically, the provinces and their respective percentage contributing to our fertilizer revenues were Hebei (26.2%), Heilongjiang (11.5%),
Inner Mongolia (9.5%), Liaoning (9.4%), and Shaanxi (5.3%).
As of September 30, 2023, we had a total of 1,223
distributors covering 22 provinces, 4 autonomous regions and 4 central government-controlled municipalities in China. Jinong had 878 distributors
in China. Jinong’s sales are not dependent on any single distributor or any group of distributors. Jinong’s top five distributors
accounted for 18.2% of its fertilizer revenues for the three months ended September 30, 2023. Gufeng had 345 distributors, including some
large state-owned enterprises. Gufeng’s top five distributors accounted for 80.9% of its revenues for the three months ended September
30, 2023.
Agricultural Products
Through Yuxing, we develop, produce and sell high-quality
flowers, green vegetables and fruits to local marketplaces and various horticulture and planting companies. We also use certain of Yuxing’s
greenhouse facilities to conduct research and development activities for our fertilizer products. The three PRC provinces and municipalities
that accounted for 83.2% of our agricultural products revenue for the three months ended September 30, 2023 were Shaanxi (67.4%),
Beijing (9.4%), and Shanghai (6.4%).
Digital Assets Bitcoin
In March 2023, we established Antaeus Tech Inc.
(“Antaeus”) and purchased mining machines to mine digital assets Bitcoin in the State of Texas. Through Antaeus, we expanded
our activities in the mining of digital assets Bitcoin.
Recent Developments
New Products
During the three months ended September 30, 2023,
Jinong launched 3 new fertilizer products but eliminated 105 unqualified distributors. During the same period, Gufeng neither launched
any new fertilizer products nor added any new distributors
Results of Operations
Three Months ended September 30, 2023 Compared to the Three Months
ended September 30, 2022.
| | |
2023 | | |
2022 | | |
Change $ | | |
Change % | |
| Sales | |
| | |
| | |
| | |
| |
| Jinong | |
$ | 9,288,758 | | |
$ | 12,148,002 | | |
| (2,859,244 | ) | |
| -23.5 | % |
| Gufeng | |
| 10,421,274 | | |
| 12,578,822 | | |
| (2,157,548 | ) | |
| -17.2 | % |
| Yuxing | |
| 2,342,716 | | |
| 2,870,501 | | |
| (527,785 | ) | |
| -18.4 | % |
| Antaeus | |
| 345,114 | | |
| - | | |
| 345,114 | | |
| - | |
| Net sales | |
| 22,397,862 | | |
| 27,597,325 | | |
| (5,199,463 | ) | |
| -18.8 | % |
| | |
| | | |
| | | |
| | | |
| | |
| Cost of goods sold | |
| | | |
| | | |
| | | |
| | |
| | |
| | | |
| | | |
| | | |
| | |
| Jinong | |
| 6,606,614 | | |
| 8,760,170 | | |
| (2,153,556 | ) | |
| -24.6 | % |
| Gufeng | |
| 8,995,321 | | |
| 11,254,877 | | |
| (2,259,556 | ) | |
| -20.1 | % |
| Yuxing | |
| 1,877,527 | | |
| 2,397,469 | | |
| (519,942 | ) | |
| -21.7 | % |
| Antaeus | |
| 268,546 | | |
| - | | |
| 268,546 | | |
| - | |
| Cost of goods sold | |
| 17,748,008 | | |
| 22,412,516 | | |
| (4,664,508 | ) | |
| -20.8 | % |
| Gross profit | |
| 4,649,854 | | |
| 5,184,809 | | |
| (534,955 | ) | |
| -10.3 | % |
| Operating expenses | |
| | | |
| | | |
| | | |
| | |
| Selling expenses | |
| 1,879,155 | | |
| 2,437,354 | | |
| (558,199 | ) | |
| -22.9 | % |
| General and administrative expenses | |
| 4,556,606 | | |
| 3,285,115 | | |
| 1,271,491 | | |
| 38.7 | % |
| Total operating expenses | |
| 6,435,761 | | |
| 5,722,469 | | |
| 713,292 | | |
| 12.5 | % |
| Loss from operations | |
| (1,785,907 | ) | |
| (537,660 | ) | |
| (1,248,247 | ) | |
| 232.2 | % |
| Other income (expense) | |
| | | |
| | | |
| | | |
| | |
| Other income (expense) | |
| 9,783 | | |
| 27,790 | | |
| (18,007 | ) | |
| -64.8 | % |
| Interest income | |
| 55,072 | | |
| 64,000 | | |
| (8,928 | ) | |
| -13.9 | % |
| Interest expense | |
| (67,554 | ) | |
| (82,244 | ) | |
| 14,690 | | |
| -17.9 | % |
| Total other income (expense) | |
| (2,699 | ) | |
| 9,546 | | |
| (12,245 | ) | |
| -128.3 | % |
| Loss before income taxes | |
| (1,788,606 | ) | |
| (528,114 | ) | |
| (1,260,492 | ) | |
| 238.7 | % |
| Provision for income taxes | |
| (4,413 | ) | |
| - | | |
| (4,413 | ) | |
| - | |
| Net loss | |
| (1,784,193 | ) | |
| (528,114 | ) | |
| (1,256,078 | ) | |
| 237.8 | % |
| | |
| | | |
| | | |
| | | |
| | |
| Other comprehensive loss | |
| | | |
| | | |
| | | |
| | |
| Foreign currency translation loss | |
| (836,377 | ) | |
| (10,920,158 | ) | |
| 10,083,781 | | |
| -92.3 | % |
| Comprehensive loss | |
$ | (2,620,570 | ) | |
$ | (11,448,272 | ) | |
| 8,827,703 | | |
| -77.1 | % |
Net Sales
Total net sales for the three months ended September
30, 2023 were $22,397,862, a decrease of $5,199,463 or 18.8%, from $27,597,325 for the three months ended September 30, 2022. This decrease
was mainly due to the decrease for Jinong’s net sales.
For the three months ended September 30, 2023, Jinong’s net sales
decreased $2,859,244, or 23.5%, to $9,288,758 from $12,148,002 for the three months ended September 30, 2022. This decrease was mainly
due to Jinong’s lower sales volume in the last three months. Jinong sold approximately 8,036 metric tons of fertilizer products
for the three months ended September 30, 2023, decreased 1,349 tons or 14.4%, as compared to 9,385 metric tons for the three months ended
September 30, 2022.
For the three months ended September 30, 2023,
Gufeng’s net sales were $10,421,274, a decrease of $2,157,548 or 17.2%, from $12,578,822 for the three months ended September 30,
2022. This decrease was mainly due to Gufeng’s lower sales volume in the last three months. Gufeng sold approximately 20,809 metric
tons of fertilizer products for the three months ended September 30, 2023, decreased 3,362 tons or 13.9%, as compared to 24,171 metric
tons for the three months ended September 30, 2022.
For the three months ended September 30, 2023,
Yuxing’s net sales were $2,342,716, a decrease of $527,785 or 18.4%, from $2,870,501 for the three months ended September 30, 2022.
The decrease was mainly due to the decrease in market demand during the three months ended September 30, 2023.
For the three months ended September 30, 2023,
Antaeus’s net sales were $345,114.
Cost of Goods Sold
Total cost of goods sold for the three months
ended September 30, 2023 was $17,748,008, a decrease of $4,664,508, or 20.8%, from $22,412,516 for the three months ended September 30,
2022. The decrease was mainly due lower sales.
Cost of goods sold by Jinong for the three months
ended September 30, 2023 was $6,606,614, a decrease of $2,153,556, or 24.6%, from $8,760,170 for the three months ended September 30,
2022. The decrease in cost of goods was primarily due to lower sales in last three months ended September 30, 2023.
Cost of goods sold by Gufeng for the three months
ended September 30, 2023 was $8,995,321, a decrease of $2,259,556, or 20.1%, from $11,254,877 for the three months ended September 30,
2022. This decrease was primarily due to the 17.2% decrease in net sale in last three months ended September 30, 2023.
For three months ended September 30, 2023, cost
of goods sold by Yuxing was $1,877,527, a decrease of $519,942, or 21.7%, from $2,397,469 for the three months ended September 30, 2022.
This decrease was primarily due to the 18.4% decrease in net sale in last three months ended September 30, 2023.
For the three months ended September 30, 2023,
cost of goods sold by Antaeus was $268,546.
Gross Profit
Total gross profit for the three months ended
September 30, 2023 decreased by $534,955, or 10.3%, to $4,649,854, as compared to $5,184,809 for the three months ended September 30,
2022. Gross profit margin percentage was 20.8% and 18.8% for the three months Ended September 30, 2023 and 2022, respectively.
Gross profit generated by Jinong decreased by
$705,688, or 20.8%, to $2,682,144 for the three months ended September 30, 2023 from $3,387,832 for the three months ended September 30,
2022. Gross profit margin percentage from Jinong’s sales was approximately 28.9% and 27.9% for the three months Ended September
30, 2023 and 2022, respectively.
For the three months ended September 30, 2023,
gross profit generated by Gufeng was $1,425,953, an increase of $102,008, or 7.7%, from $1,323,945 for the three months ended September
30, 2022. Gross profit margin percentage from Gufeng’s sales was approximately 13.7% and 10.5% for the three months ended September
30, 2023 and 2022, respectively.
For the three months ended September 30, 2023,
gross profit generated by Yuxing was $465,189, a slightly decrease of $7,843, or 1.7% from $473,032 for the three months ended September
30, 2022. The gross profit margin percentage was approximately 19.9% and 16.5% for the three months Ended September 30, 2023 and 2022,
respectively. The increase in gross profit margin percentage was mainly due to the decrease in product costs.
For the three months ended September 30, 2023,
gross profit generated by Antaeus was $76,568. The gross profit margin was approximately 22.2% for the three months ended September 30,
2023.
Selling Expenses
Our selling expenses consisted primarily of salaries
of sales personnel, advertising and promotion expenses, freight-out costs and related compensation. Selling expenses were $1,879,155,
or 8.4%, of net sales for the three months ended September 30, 2023, as compared to $2,437,354, or 8.8%, of net sales for the three months
ended September 30, 2022, a decrease of $558,199, or 22.9%. The decrease in selling expense was caused by the decrease in marketing activities.
The selling expenses of Jinong for the three months
ended September 30, 2023 were $1,795,441 or 19.3% of Jinong’s net sales, as compared to selling expenses of $2,351,821 or 19.4%
of Jinong’s net sales for the three months ended September 30, 2022. The selling expenses of Yuxing were $19,837 or 0.8% of Yuxing’s
net sales for the three months ended September 30, 2023, as compared to $19,046 or 0.7% of Yuxing’s net sales for the three months
ended September 30, 2022. The selling expenses of Gufeng were $63,877 or 0.6% of Gufeng’s net sales for the three months ended September
30, 2023, as compared to $66,487 or 0.5% of Gufeng’s net sales for the three months ended September 30, 2022. There is no selling
expenses for Antaeus for the three months ended September 30, 2023.
General and Administrative Expenses
General and administrative expenses consisted
primarily of related salaries, rental expenses, business development, depreciation and travel expenses incurred by our general and administrative
departments and legal and professional expenses including expenses incurred and accrued for certain litigation. General and administrative
expenses were $4,556,606, or 20.3% of net sales for the three months ended September 30, 2023, as compared to $3,285,115, or 11.9% of
net sales for the three months ended September 30, 2022, an increase of $1,271,491, or 38.7%. The increase in general and administrative
expenses was mainly due to higher general and administrative expenses for Jinong and Gufeng. Jinong’s general and administrative
expenses were $1,031,827 for the three months ended September 30, 2023, increased $915,460, or 786.7%, as compared to $116,367 for the
three months ended September 30, 2022. Gufeng’s general and administrative expenses were $2,581,958 for the three months ended September
30, 2023, increased $660,770, or 34.4%, as compared to $1,921,188 for the three months ended September 30, 2022.
Total Other Income (Expenses)
Total other income (expenses) consisted of income
from subsidies received from the PRC government, interest income, interest expenses and bank charges. Total other expense for the three
months ended September 30, 2023 was $2,699, as compared to other income of $9,546 for the three months ended September 30, 2022. The difference
was mainly due to the decrease in other income with amount of 18,007, or 64.8% from $27,790 for the three months ended September 30, 2022
to $9,783 for the three months ended September 30, 2023. There was $21,898 in subsidy income for the three months ended September 30,
2022, compared to no subsidy income for the three months ended September 30, 2023.
Income Taxes
Jinong is subject to a preferred tax rate of 15%
because of its business being classified as a High-Tech project under the PRC Enterprise Income Tax Law (“EIT”) that became
effective on January 1, 2008. Jinong incurred no income tax expenses for the three months ended September 30, 2023 and 2022.
Gufeng is subject to a tax rate of 25%, incurred
no income tax expenses for the three months ended September 30, 2023 and 2022.
Yuxing inccured no income tax for the three months
ended September 30, 2023 and 2022 because of being exempted from paying income tax due to its products fall into the tax exemption list
set out in the EIT.
Antaeus is subject to a tax rate of 21% and had
income tax expense of $(4,413) for the three months ended September 30, 2023.
Net loss
Net loss for the three months ended September
30, 2023 was $(1,784,193), an increase in loss of $1,256,078, or 237.8%, compared to net loss of $(528,114) for the three months ended
September 30, 2022. Net loss as a percentage of total net sales was approximately -8.0% and -1.9% for the three months Ended September
30, 2023 and 2022, respectively.
Discussion of Segment Profitability Measures
As of September 30, 2023, we were engaged in the
following businesses: the production and sale of fertilizers through Jinong and Gufeng, the production and sale of high-quality agricultural
products by Yuxing and the production and sale of Bitcoin by Antaeus. For financial reporting purpose, our operations were organized into
four main business segments based on locations and products: Jinong (fertilizer production), Gufeng (fertilizer production), Yuxing (agricultural
products production) and Antaeus (Bitcoin). Each of the segments has its own annual budget about development, production and sales.
Each of the four operating segments referenced
above has separate and distinct general ledgers. The chief operating decision maker (“CODM”) makes decisions with respect
to resources allocation and performance assessment upon receiving financial information, including revenue, gross margin, operating income
and net income produced from the various general ledger systems; however, net income by segment is the principal benchmark to measure
profit or loss adopted by the CODM.
For Jinong, the net income (loss) decreased by
$1,098,712, or 111.6%, to $(114,362) for the three months ended September 30, 2023, from $984,350 for the three months ended September
30, 2022. The decrease in net income was principally due to lower sales and higher general and administrative expenses.
For Gufeng, the net loss increased by $515,923,
or 69.1%, to $(1,262,423) for the three months ended September 30, 2023, from $(746,500) for the three months ended September 30, 2022.
The increase in net loss was principally due to the increase in general and administrative expenses.
For Yuxing, the net income decreased $57,315 or
27.1%, to $154,271 for the three months ended September 30, 2023 from $211,586 for the three months ended September 30, 2022. The decrease
was mainly due to lower net sales.
For Antaeus, the net loss was $(16,603) for the
three months ended September 30, 2023.
Liquidity and Capital Resources
Our principal sources of liquidity include cash
from operations, borrowings from local commercial banks and net proceeds of offerings of our securities.
As of September 30, 2023, cash and cash equivalents
were $67,285,823, a decrease of $3,856,365, or 5.4%, from $71,142,188 as of June 30, 2023.
We intend to use the net proceeds from our securities
offerings, as well as other working capital if required, to acquire new businesses, upgrade production lines and complete Yuxing’s
new greenhouse facilities for agriculture products located on 88 acres of land in Hu County, 18 kilometers southeast of Xi’an city.
We believe that we have sufficient cash on hand and positive projected cash flow from operations to support our business growth for the
next twelve months to the extent we do not have further significant acquisitions or expansions. However, if events or circumstances occur
and we do not meet our operating plan as expected, we may be required to seek additional capital and/or to reduce certain discretionary
spending, which could have a material adverse effect on our ability to achieve our business objectives. Notwithstanding the foregoing,
we may seek additional financing as necessary for expansion purposes and when we believe market conditions are most advantageous, which
may include additional debt and/or equity financings. There can be no assurance that any additional financing will be available on acceptable
terms, if at all. Any equity financing may result in dilution to existing stockholders and any debt financing may include restrictive
covenants.
The following table sets forth a summary of our cash flows for the
periods indicated:
| | |
Three Months Ended | |
| | |
September 30, | |
| | |
2023 | | |
2022 | |
| Net cash used in operating activities | |
$ | (626,510 | ) | |
$ | (2,995,510 | ) |
| Net cash (used in) provided by investing activities | |
| (1,507,026 | ) | |
| 683,884 | |
| Net cash (used in) provided by financing activities | |
| (1,383,960 | ) | |
| 18,025,034 | |
| Effect of exchange rate change on cash and cash equivalents | |
| (338,869 | ) | |
| (3,651,176 | ) |
| Net (decrease) increase in cash and cash equivalents | |
| (3,856,365 | ) | |
| 12,062,232 | |
| Cash and cash equivalents, beginning balance | |
| 71,142,188 | | |
| 57,770,303 | |
| Cash and cash equivalents, ending balance | |
$ | 67,285,823 | | |
$ | 69,832,535 | |
Operating Activities
Net cash used in operating activities was $626,510
for the three months ended September 30, 2023, a decrease of $2,369,000, or 79.1%, from cash used in operating activities of $2,995,510
for the three months ended September 30, 2022. The decrease in cash used in operating activities was mainly due to an increase in customer
deposits during the three months ended September 30, 2023 as compared to the same period in 2022.
Investing Activities
Net cash used in investing activities for the
three months ended September 30, 2023 was $1,507,026, compared to cash provided by investing activities of $683,884 for the three months
ended September 30, 2022. The difference of $2,190,910 was mainly due to purchase of plant, property, and equipment with amount of $1,507,026
during the three months ended September 30, 2023, comparing with $228,541 during the three months ended September 30, 2022.
Financing Activities
Net cash used in financing activities for the
three months ended September 30, 2023 was $1,383,960, a decrease of $19,408,994, or 107.7% compared to $18,025,034 net cash provided by
financing activities for the three months ended September 30, 2022. The decrease was mainly due to the repayment of loans with amount
of $1,574,960 during the three months ended September 30, 2023.
As of September 30, 2023, and June 30, 2023, our loans payable was
as follows:
| | |
September 30, | | |
June 30, | |
| | |
2023 | | |
2023 | |
| Short term loans payable: | |
$ | 3,756,540 | | |
$ | 5,346,640 | |
| Long term loans payable: | |
| 932,280 | | |
| 937,040 | |
| Total | |
$ | 4,688,820 | | |
$ | 6,283,680 | |
Accounts Receivable
We had accounts receivable of $19,908,132 as of
September 30, 2023, as compared to $16,455,734 as of June 30, 2023, an increase of $3,452,398, or 21.0%.
Allowance for doubtful accounts in accounts receivable
as of September 30, 2023 was $50,913,569, a decrease of $3,794,917, or 6.9%, from $54,708,486 as of June 30, 2023. And the allowance for
doubtful accounts as a percentage of accounts receivable was 71.9% as of September 30, 2023 and 76.9% as of June 30, 2023.
Deferred assets
We had no deferred assets as of September 30,
2023 and June 30, 2023. During the three months, we assisted the distributors in certain marketing efforts and developing standard stores
to expand our competitive advantage and market shares. Based on the distributor agreements, the amount owed by the distributors in certain
marketing efforts and store development will be expensed over three years if the distributors are actively selling our products. If a
distributor defaults, breaches, or terminates the agreement with us earlier than the contractual terms, the unamortized portion of the
amount owed by the distributor is payable to us immediately. The deferred assets had been fully amortized as of September 30, 2023.
Inventories
We had inventories of $42,595,553 as of September
30, 2023, as compared to $46,455,131 as of June 30, 2023, a decrease of $3,859,578, or 8.3%. The decrease was primarily due to Gufeng’s
inventory. As of September 30, 2023, Gufeng’s inventory was $17,730,525, compared to $21,691,450 as of June 30, 2023, a decrease
of $3,960,925, or 18.3%. The company confirmed the loss of $2.4 million and $1.7 million of inventories for the three months ended September
30, 2023 and 2022, respectively.
Advances to Suppliers
We had advances to suppliers of $14,685,085 as
of September 30, 2023 as compared to $14,332,715 as of June 30, 2023, representing an increase of $352,370, or 2.5%. Our inventory level
may fluctuate from time to time, depending how quickly the raw material is consumed and replenished during the production process, and
how soon the finished goods are sold. The replenishment of raw material relies on management’s estimate of numerous factors,
including but not limited to, the raw materials future price, and spot price along with its volatility, as well as the seasonal demand
and future price of finished fertilizer products. Such estimate may not be accurate, and the purchase decision of raw materials based
on the estimate can cause excessive inventories in times of slow sales and insufficient inventories in peak times.
Accounts Payable
We had accounts payable of $1,979,494 as of September
30, 2023 as compared to $2,100,449 as of June 30, 2023, representing a decrease of $120,955, or 5.8%.
Customer Deposits (Unearned Revenue)
We had customer deposits of $5,669,071 as of September
30, 2023 as compared to $5,489,781 as of June 30, 2023, representing an increase of $179,290, or 3.3%. The increase was mainly attributable
to Jinong’ $1,232,751 unearned revenue as of September 30, 2023, compared to $1,152,204 unearned revenue as of June 30, 2023, increased
$80,547, or 7.0%, caused by the advance deposits made by clients. This increase was due to seasonal fluctuation and we expect to deliver
products to our customers during the next three months at which time we will recognize the revenue.
Off-Balance Sheet Arrangements
We do not have any off-balance sheet arrangements.
Critical Accounting Policies and Estimates
Management’s discussion and analysis of
its financial condition and results of operations are based upon our consolidated financial statements, which have been prepared in accordance
with United States generally accepted accounting principles. Our financial statements reflect the selection and application of accounting
policies which require management to make significant estimates and judgments. See Note 2 to our consolidated financial statements, “Basis
of Presentation and Summary of Significant Accounting Policies.” We believe that the following paragraphs reflect the most critical
accounting policies that currently affect our financial condition and results of operations:
Use of estimates
The preparation of consolidated financial statements
in conformity with accounting principles generally accepted in the United States of America requires management to make estimates and
assumptions that affect the reported amounts of assets and liabilities and disclosure of contingent assets and liabilities at the date
of the consolidated financial statements and the amount of revenues and expenses during the reporting periods. Management makes these
estimates using the best information available at the time the estimates are made. However, actual results and outcomes may differ from
management’s estimates and assumptions due to risks and uncertainties.
Revenue recognition
Sales revenue is recognized at the date of shipment
to customers when a formal arrangement exists, the price is fixed or determinable, the delivery is completed, we have no other significant
obligations and collectability is reasonably assured. Payments received before all the relevant criteria for revenue recognition are satisfied
are recorded as unearned revenue.
Our revenue consists of invoiced value of goods,
net of a value-added tax (VAT). No product return or sales discount allowance is made as products delivered and accepted by customers
are normally not returnable and sales discounts are normally not granted after products are delivered.
Cash and cash equivalents
For statement of cash flows purposes, we consider
all cash on hand and in banks, certificates of deposit and other highly-liquid investments with maturities of three months or less, when
purchased, to be cash and cash equivalents.
Accounts receivable
Our policy is to maintain reserves for potential
credit losses on accounts receivable. Management reviews the composition of accounts receivable and analyzes historical bad debts, customer
concentrations, customer credit worthiness, current economic trends and changes in customer payment patterns to evaluate the adequacy
of these reserves. Any accounts receivable of Jinong and Gufeng that are outstanding for more than 180 days will be accounted as allowance
for bad debts, and any accounts receivable of Yuxing that are outstanding for more than 90 days will be accounted as allowance for bad
debts.
Deferred assets
Deferred assets represent amounts the Company
advanced to the distributors in their marketing and stores development to expand our competitive advantage and market shares. Based
on the distributor agreements, the amount owed by the distributors in certain marketing efforts and store development will be expensed
over three years if the distributors are actively selling our products. If a distributor defaults, breaches, or terminates the agreement
with us earlier than the realization of the contractual terms, the unamortized portion of the amount owed by the distributor is to be
refunded to us immediately. The deferred assets had been fully amortized as of September 30, 2023.
Segment reporting
FASB ASC 280 requires use of the “management
approach” model for segment reporting. The management approach model is based on the way a company’s management organizes
segments within the company for making operating decisions and assessing performance. Reportable segments are based on products and services,
geography, legal structure, management structure, or any other way management disaggregates a company.
As of September 30, 2023, we were organized into
four main business units: Jinong (fertilizer production), Gufeng (fertilizer production), Yuxing (agricultural products production)
and Antaeus(Bitcoin). For financial reporting purpose, our operations were organized into four main business segments based on locations
and products: Jinong (fertilizer production), Gufeng (fertilizer production), Yuxing (agricultural products production) and Antaeus(Bitcoin).
Each of the segments has its own annual budget regarding development, production, and sales.
Item 3. Quantitative and Qualitative Disclosures About Market Risk
Disclosures About Market Risk
We may be exposed to changes in financial market
conditions in the normal course of business. Market risk generally represents the risk that losses may occur because of movements in interest
rates and equity prices. We currently do not, in the normal course of business, use financial instruments that are subject to changes
in financial market conditions.
Currency Fluctuations and Foreign Currency Risk
Substantially all our revenues and expenses are
denominated in RMB. However, we use the U.S. dollar for financial reporting purposes. Conversion of RMB into foreign currencies is regulated
by the People’s Bank of China through a unified floating exchange rate system. Although the PRC government has stated its intention
to support the value of RMB, there can be no assurance that such exchange rate will not again become volatile or that RMB will not devalue
significantly against U.S. dollar. Exchange rate fluctuations may adversely affect the value, in U.S. dollar terms, of our net assets
and income derived from our operations in the PRC.
Our reporting currency is the U.S. dollar. Except
for U.S. holding companies, all our consolidated revenues, consolidated costs and expenses, and our assets are denominated in RMB. As
a result, we are exposed to foreign exchange risk as our revenues and results of operations may be affected by fluctuations in the exchange
rate between the U.S. dollars and RMB. If RMB depreciates against the U.S. dollar, the value of our RMB revenues, earnings and assets
as expressed in our U.S. dollar financial statements will decline. Assets and liabilities are translated at the exchange rates as of the
balance sheet dates, revenues and expenses are translated at the average exchange rates, and shareholders’ equity is translated
at historical exchange rates. Any resulting translation adjustments are not included in determining net income (loss) but are included
in determining other comprehensive income, a component of shareholders’ equity. As of September 30, 2023, our accumulated other
comprehensive loss was $28 million. We have not entered any hedging transactions to reduce our exposure to foreign exchange risk. The
value of the RMB against the U.S. dollar and other currencies is affected by, among other things, changes in PRC’s political and
economic conditions. Between July 1, 2023 and September 30, 2023, China’s currency decreased by a cumulative 0.5% against the U.S.
dollar, making Chinese exports cheaper and imports into China more expensive by that percentage. The effect on trade can be substantial.
Moreover, it is possible that in the future, the PRC authorities may lift restrictions on fluctuations in the RMB exchange rate and lessen
intervention in the foreign exchange market.
Interest Rate Risk
We deposit surplus funds with Chinese banks earning
daily interest. We do not invest in any instruments for trading purposes. All our outstanding debt instruments carry fixed rates of interest.
The amount of short-term debt outstanding as of September 30, 2023 and June 30, 2023 was $3.8 million and $5.3 million, respectively.
We are exposed to interest rate risk primarily with respect to our short-term bank loans. Although the interest rates, which are based
on the banks’ prime rates with respect to our short-term loans, are fixed for the terms of the loans, the terms are typically three
to twelve months for short-term bank loans and interest rates are subject to change upon renewal. There was no material change in interest
rates for short-term bank loans renewed during the three months ended September 30, 2023. The original loan term on average is one year,
and the remaining average life of the short term-loans is approximately nine months.
Management monitors the banks’ prime rates
in conjunction with our cash requirements to determine the appropriate level of debt balances relative to other sources of funds. We have
not entered any hedging transactions to reduce our exposure to interest rate risk.
Credit Risk
We have experienced higher credit risk than usual
since 2020. With the impact of COVID-19 pandemic, the overdue outstanding accounts receivable increased significantly compared with the
years prior to the pandemic. Our accounts receivables are typically unsecured and are mainly derived from revenues earned from customers
in the PRC. Most of our customers are individuals and small and medium-sized enterprises (“SMEs”), which may not have strong
cash flows or be well capitalized. They may be vulnerable to an epidemic outbreak and slowing macroeconomic conditions. Many of the SMEs
that we work with cannot weather COVID-19 and the resulting economic impact, or they cannot resume business as usual after a prolonged
outbreak. Numerous distributors encountered significant difficulties and/or hardships in their businesses amid the pandemic. Even through
our receivables are monitored regularly by our credit managers, the bad debts expenses are higher in recent 3 years comparing with the
years before 2020.
Inflation Risk
Inflationary factors such as increases in the
cost of our products and overhead costs may adversely affect our operating results. Notwithstanding the measures taken by the PRC government
to control inflation, China still experienced an increase in inflation and our operating cost became higher than anticipated. The
high rate of inflation had an adverse effect on our ability to maintain current levels of gross margin and selling, general and administrative
expenses as a percentage of net revenues if the selling prices of our products do not increase with these increased costs.
Risk of epidemics, pandemics, or other outbreaks
The outbreak of COVID-19 has adversely affected,
and in the future it or other epidemics, pandemics or outbreaks may adversely affect, our operations. This is or may be due to closures
or restrictions requested or mandated by governmental authorities, disruption to supply chains and workforce, reduction of demand for
our products and services, and credit losses when customers and other counterparties fail to satisfy their obligations to us. We share
most of these risks with all businesses.
In addition, the COVID-19 outbreak has significantly
increased economic and demand uncertainty. The current outbreak and continued spread of COVID-19 may cause a global recession, which would
have a further adverse impact on our financial condition and operations, and this impact could exist for an extensive period.
The Company is continuing to monitor the situation
and take appropriate actions in accordance with the recommendations and requirements of relevant authorities. The full extent of the impact
of the COVID-19 pandemic on the Company’s operational and financial performance is currently uncertain and will depend on many factors
outside the Company’s control, including, without limitation, the timing, extent, trajectory and duration of the pandemic, the development
and availability of effective treatments and vaccines, the imposition of protective public safety measures, and the impact of the pandemic
on the global economy and demand for consumer products.
Additional future impacts on the Company may include,
but are not limited to, material adverse effects on demand for the Company’s products and services; the Company’s supply chain
and sales and distribution channels; the Company’s ability to execute its strategic plans; and the Company’s profitability
and cost structure. To the extent the COVID-19 pandemic adversely affects the Company’s business, results of operations, financial
condition and stock price, it may also have the effect of heightening many of the other risks described above.
Item 4. Controls and Procedures
(a) Evaluation of disclosure controls and procedures
Pursuant to Rule 13a-15(b) under the Securities
Exchange Act of 1934 (“Exchange Act”), at the conclusion of the period ended September 30, 2022 we carried out an evaluation,
under the supervision and with the participation of our management, including our Chief Executive Officer and Chief Financial Officer,
of the effectiveness of the design and operation of our disclosure controls and procedures (as such term is defined in Rules 13a-15(e)
and 15d-15(e) under the Securities Exchange Act of 1934 (the “Exchange Act”)). Based upon that evaluation, our Chief Executive
Officer and Chief Financial Officer concluded that as of the end of the period covered by this Report, our disclosure controls and procedures
were effective and adequately designed to ensure that the information required to be disclosed by us in the reports we submit under the
Exchange Act is recorded, processed, summarized and reported within the time periods specified in the applicable rules and forms and that
such information was accumulated and communicated to our Chief Executive Officer and Chief Financial Officer, in a manner that allowed
for timely decisions regarding required disclosure.
(b) Changes in internal controls
There were no changes in our internal control
over financial reporting identified in connection with the evaluation required by paragraph (d) of Exchange Act Rules 13a-15 or 15d-15
that occurred during the quarter ended September 30, 2023 that have materially affected, or are reasonably likely to materially affect,
our internal control over financial reporting.
PART II – OTHER INFORMATION
Item 1. Legal Proceedings
On June 5, 2020, an individual filed suit pro
se (as in, representing oneself without an attorney) in the Southern District of Florida federal court alleging violations of the Securities
Exchange Act. The Company believes the action is without merit and vigorously opposed it. The company moved to dismiss the litigation
and for attorney’s fees from the plaintiff. On November 2, 2020, the case was transferred to the United States District Court for
The Southern District Of New York. On September 30, 2021, the Southern District of New York federal court presiding over the case dismissed
all claims against the company, its executives, and its independent directors. The dismissal was without prejudice and the plaintiff
can appeal or amend within 30 days, or by October 29, 2021. The plaintiff amended the complaint on Oct 30, 2021. On August 30, 2022, the
Southern District of New York federal court presiding over the case issued an order granting motions to dismiss all claims in the amended
complaint against the Company, its executives, and its independent directors. On September 6, 2022, the plaintiff filed a notice of civil
appeal to the U.S. Court of Appeals, Second Circuit. The appeal has now been fully briefed and the Company expects a decision to issue
sometime in the coming year.
There are no other actions, suits, proceedings,
inquiries or investigations before or by any court, public board, government agency, self-regulatory organization or body pending or,
to the knowledge of the executive officers of our company or any of our subsidiaries, threatened against or affecting our company, our
common stock, any of our subsidiaries or of our companies or our subsidiaries’ officers or directors in their capacities as such,
in which an adverse decision could have a material adverse effect.
Item 2. Unregistered Sales of Equity Securities and Use of Proceeds
There were no unregistered sales of the Company’s
equity securities during the three months ended September 30, 2022, that were not otherwise disclosed in a Current Report on Form 8-K.
Item 3. Defaults Upon Senior Securities
There has been no default in the payment of principal,
interest, sinking or purchase fund installment, or any other material default, with respect to any indebtedness of the Company.
Item 4. Mine Safety Disclosures
Not applicable.
Item 5. Other Information
There is no other information required to be disclosed under this item
which was not previously disclosed.
Item 6. Exhibits
The exhibits required by this item are set forth in the Exhibit Index
attached hereto.
SIGNATURES
Pursuant to the requirements of the Securities
Exchange Act of 1934, the Registrant has duly caused this report to be signed on its behalf by the undersigned thereunto duly authorized.
| |
CHINA GREEN AGRICULTURE, INC. |
| |
|
| Date: November 20, 2023 |
By: |
/s/ Zhuoyu Li |
| |
Name: |
Zhuoyu Li |
| |
Title: |
Chief Executive Officer |
| |
|
(principal executive officer) |
| |
|
|
| Date: November 20, 2023 |
By: |
/s/ Zhibiao Pan |
| |
Name: |
Zhibiao Pan |
| |
Title: |
Co-Chief Executive Officer |
| |
|
(principal executive officer) |
| |
|
|
| Date: November 20, 2023 |
By: |
/s/ Yongcheng Yang |
| |
Name: |
Yongcheng Yang |
| |
Title: |
Chief Financial Officer |
| |
|
(principal financial officer and
principal accounting officer) |
EXHIBIT INDEX
| + | In
accordance with the SEC Release 33-8238, deemed being furnished and not filed. |
33
CN
41371630
13380
false
--06-30
Q1
2024
0000857949
0000857949
2023-07-01
2023-09-30
0000857949
2023-11-20
0000857949
2023-09-30
0000857949
2023-06-30
0000857949
us-gaap:RelatedPartyMember
2023-09-30
0000857949
us-gaap:RelatedPartyMember
2023-06-30
0000857949
cga:JinongMember
2023-07-01
2023-09-30
0000857949
cga:JinongMember
2022-07-01
2022-09-30
0000857949
cga:GufengMember
2023-07-01
2023-09-30
0000857949
cga:GufengMember
2022-07-01
2022-09-30
0000857949
cga:YuxingMember
2023-07-01
2023-09-30
0000857949
cga:YuxingMember
2022-07-01
2022-09-30
0000857949
cga:AntaeusMember
2023-07-01
2023-09-30
0000857949
cga:AntaeusMember
2022-07-01
2022-09-30
0000857949
2022-07-01
2022-09-30
0000857949
us-gaap:CommonStockMember
2023-06-30
0000857949
us-gaap:AdditionalPaidInCapitalMember
2023-06-30
0000857949
cga:StatutoryReserveMember
2023-06-30
0000857949
us-gaap:RetainedEarningsMember
2023-06-30
0000857949
us-gaap:AccumulatedOtherComprehensiveIncomeMember
2023-06-30
0000857949
us-gaap:CommonStockMember
2023-07-01
2023-09-30
0000857949
us-gaap:AdditionalPaidInCapitalMember
2023-07-01
2023-09-30
0000857949
cga:StatutoryReserveMember
2023-07-01
2023-09-30
0000857949
us-gaap:RetainedEarningsMember
2023-07-01
2023-09-30
0000857949
us-gaap:AccumulatedOtherComprehensiveIncomeMember
2023-07-01
2023-09-30
0000857949
us-gaap:CommonStockMember
2023-09-30
0000857949
us-gaap:AdditionalPaidInCapitalMember
2023-09-30
0000857949
cga:StatutoryReserveMember
2023-09-30
0000857949
us-gaap:RetainedEarningsMember
2023-09-30
0000857949
us-gaap:AccumulatedOtherComprehensiveIncomeMember
2023-09-30
0000857949
us-gaap:CommonStockMember
2022-06-30
0000857949
us-gaap:AdditionalPaidInCapitalMember
2022-06-30
0000857949
cga:StatutoryReserveMember
2022-06-30
0000857949
us-gaap:RetainedEarningsMember
2022-06-30
0000857949
us-gaap:AccumulatedOtherComprehensiveIncomeMember
2022-06-30
0000857949
2022-06-30
0000857949
us-gaap:CommonStockMember
2022-07-01
2022-09-30
0000857949
us-gaap:AdditionalPaidInCapitalMember
2022-07-01
2022-09-30
0000857949
cga:StatutoryReserveMember
2022-07-01
2022-09-30
0000857949
us-gaap:RetainedEarningsMember
2022-07-01
2022-09-30
0000857949
us-gaap:AccumulatedOtherComprehensiveIncomeMember
2022-07-01
2022-09-30
0000857949
us-gaap:CommonStockMember
2022-09-30
0000857949
us-gaap:AdditionalPaidInCapitalMember
2022-09-30
0000857949
cga:StatutoryReserveMember
2022-09-30
0000857949
us-gaap:RetainedEarningsMember
2022-09-30
0000857949
us-gaap:AccumulatedOtherComprehensiveIncomeMember
2022-09-30
0000857949
2022-09-30
0000857949
cga:UnitedStatesBanksMember
2023-09-30
0000857949
cga:UnitedStatesBanksMember
2023-06-30
0000857949
2022-07-01
2023-06-30
0000857949
us-gaap:BuildingImprovementsMember
2023-09-30
0000857949
us-gaap:BuildingImprovementsMember
2023-06-30
0000857949
us-gaap:VehiclesMember
2023-09-30
0000857949
us-gaap:VehiclesMember
2023-06-30
0000857949
us-gaap:MachineryAndEquipmentMember
2023-09-30
0000857949
us-gaap:MachineryAndEquipmentMember
2023-06-30
0000857949
cga:OtherPropertyAndEquipmentMember
2023-09-30
0000857949
cga:OtherPropertyAndEquipmentMember
2023-06-30
0000857949
2009-09-25
0000857949
2009-09-01
2009-09-25
0000857949
2003-08-13
0000857949
us-gaap:UseRightsMember
2003-08-13
0000857949
us-gaap:UseRightsMember
2001-08-16
0000857949
us-gaap:PatentedTechnologyMember
2001-08-16
0000857949
us-gaap:PatentedTechnologyMember
2010-07-02
0000857949
us-gaap:CustomerRelationshipsMember
2010-07-02
0000857949
us-gaap:NoncompeteAgreementsMember
2010-07-02
0000857949
cga:NonCompeteAgreementMember
2010-07-02
2010-07-02
0000857949
us-gaap:TrademarksMember
2010-07-02
0000857949
2023-03-01
2023-03-13
0000857949
us-gaap:IntangibleAssetsArisingFromInsuranceContractsAcquiredInBusinessCombinationMember
2023-07-01
2023-09-30
0000857949
us-gaap:UseRightsMember
2023-09-30
0000857949
us-gaap:UseRightsMember
2023-06-30
0000857949
us-gaap:PatentedTechnologyMember
2023-09-30
0000857949
us-gaap:PatentedTechnologyMember
2023-06-30
0000857949
us-gaap:CustomerRelationshipsMember
2023-09-30
0000857949
us-gaap:CustomerRelationshipsMember
2023-06-30
0000857949
us-gaap:NoncompeteAgreementsMember
2023-09-30
0000857949
us-gaap:NoncompeteAgreementsMember
2023-06-30
0000857949
us-gaap:TrademarksMember
2023-09-30
0000857949
us-gaap:TrademarksMember
2023-06-30
0000857949
us-gaap:UseRightsMember
2023-07-01
2023-09-30
0000857949
cga:ForeignCurrencyAdjustmentMember
us-gaap:UseRightsMember
2023-06-30
0000857949
us-gaap:PatentedTechnologyMember
2023-07-01
2023-09-30
0000857949
cga:ForeignCurrencyAdjustmentMember
us-gaap:PatentedTechnologyMember
2023-06-30
0000857949
us-gaap:CustomerRelationshipsMember
2023-07-01
2023-09-30
0000857949
cga:ForeignCurrencyAdjustmentMember
us-gaap:CustomerRelationshipsMember
2023-06-30
0000857949
us-gaap:NoncompeteAgreementsMember
2023-07-01
2023-09-30
0000857949
cga:ForeignCurrencyAdjustmentMember
us-gaap:NoncompeteAgreementsMember
2023-06-30
0000857949
cga:JinongMember
2023-07-01
2023-09-30
0000857949
cga:JinongMember
2017-03-01
2017-03-31
0000857949
cga:JinongMember
2022-07-01
2022-09-30
0000857949
cga:SalesAgreementMember
2015-12-01
2015-12-31
0000857949
cga:YuxingMember
2023-09-30
0000857949
cga:YuxingMember
2023-06-30
0000857949
cga:GufengMember
2023-07-01
2023-09-30
0000857949
cga:GufengMember
2022-07-01
2023-06-30
0000857949
cga:MrZhuoyuLiMember
2023-09-30
0000857949
cga:MrZhuoyuLiMember
2023-06-30
0000857949
cga:MrZhibiaoPanMember
2023-09-30
0000857949
cga:MrZhibiaoPanMember
2023-06-30
0000857949
cga:JinongMember
2023-09-30
0000857949
cga:JinongMember
2023-06-30
0000857949
cga:KingtoneInformationMember
2022-07-01
0000857949
cga:KingtoneInformationMember
2022-07-01
2022-07-01
0000857949
srt:MinimumMember
us-gaap:LoansPayableMember
2023-09-30
0000857949
srt:MaximumMember
us-gaap:LoansPayableMember
2023-09-30
0000857949
cga:BeijingBankPingguBranchMember
2023-07-01
2023-09-30
0000857949
cga:BeijingBankPingguBranchMember
2023-09-30
0000857949
cga:HuaxiaBankHuaiRouBranchMember
2023-07-01
2023-09-30
0000857949
cga:HuaxiaBankHuaiRouBranchMember
2023-09-30
0000857949
cga:PingguNewVillageBankMember
2023-07-01
2023-09-30
0000857949
cga:PingguNewVillageBankMember
2023-09-30
0000857949
cga:IndustrialBankCoLtdMember
2023-07-01
2023-09-30
0000857949
cga:IndustrialBankCoLtdMember
2023-09-30
0000857949
srt:MinimumMember
2008-01-01
2008-01-01
0000857949
srt:MaximumMember
2008-01-01
2008-01-01
0000857949
2007-12-31
2007-12-31
0000857949
country:CN
2017-04-28
2017-04-28
0000857949
srt:MinimumMember
country:CN
2017-04-28
2017-04-28
0000857949
srt:MaximumMember
country:CN
2017-04-28
2017-04-28
0000857949
country:CN
2018-04-04
2018-04-04
0000857949
srt:MinimumMember
country:CN
2018-04-04
2018-04-04
0000857949
srt:MaximumMember
country:CN
2018-04-04
2018-04-04
0000857949
country:CN
2019-03-20
2019-03-20
0000857949
srt:MinimumMember
country:CN
2019-03-20
2019-03-20
0000857949
srt:MaximumMember
country:CN
2019-03-20
2019-03-20
0000857949
country:CN
2023-07-01
2023-09-30
0000857949
country:CN
2022-07-01
2022-09-30
0000857949
country:US
2023-07-01
2023-09-30
0000857949
country:US
2022-07-01
2022-09-30
0000857949
2022-02-02
0000857949
us-gaap:PreferredStockMember
2023-07-01
2023-09-30
0000857949
us-gaap:SupplierConcentrationRiskMember
2023-07-01
2023-09-30
0000857949
cga:OneVendorsMember
2023-07-01
2023-09-30
0000857949
cga:TwoVendorsMember
2023-07-01
2023-09-30
0000857949
cga:ThreeVendorMember
2023-07-01
2023-09-30
0000857949
us-gaap:SupplierConcentrationRiskMember
2022-07-01
2022-09-30
0000857949
cga:JinongMember
2023-07-01
2023-09-30
0000857949
cga:JinongMember
2022-07-01
2022-09-30
0000857949
cga:GufengMember
2023-07-01
2023-09-30
0000857949
cga:GufengMember
2022-07-01
2022-09-30
0000857949
cga:YuxingMember
2023-07-01
2023-09-30
0000857949
cga:YuxingMember
2022-07-01
2022-09-30
0000857949
cga:AntaeusMember
2023-07-01
2023-09-30
0000857949
cga:AntaeusMember
2022-07-01
2022-09-30
0000857949
cga:SegmentReconcilingItems1Member
2023-07-01
2023-09-30
0000857949
cga:SegmentReconcilingItems1Member
2022-07-01
2022-09-30
0000857949
cga:SegmentReconcilingItems2Member
2023-07-01
2023-09-30
0000857949
cga:SegmentReconcilingItems2Member
2022-07-01
2022-09-30
0000857949
cga:JinongMember
2023-09-30
0000857949
cga:JinongMember
2023-06-30
0000857949
cga:GufengMember
2023-09-30
0000857949
cga:GufengMember
2023-06-30
0000857949
cga:YuxingMember
2023-09-30
0000857949
cga:YuxingMember
2023-06-30
0000857949
cga:AntaeusMember
2023-09-30
0000857949
cga:AntaeusMember
2023-06-30
0000857949
cga:SegmentReconcilingItems1Member
2023-09-30
0000857949
cga:SegmentReconcilingItems1Member
2023-06-30
0000857949
cga:SegmentReconcilingItems2Member
2023-09-30
0000857949
cga:SegmentReconcilingItems2Member
2023-06-30
0000857949
cga:JinongMember
2022-07-01
0000857949
2023-04-02
0000857949
cga:VariableInterestEntityOneMember
2023-09-30
0000857949
cga:VariableInterestEntityOneMember
2023-06-30
0000857949
cga:VariableInterestEntityOneMember
2023-07-01
2023-09-30
0000857949
cga:VariableInterestEntityOneMember
2022-07-01
2022-09-30
xbrli:shares
iso4217:USD
iso4217:USD
xbrli:shares
xbrli:pure
utr:sqm
iso4217:CNY
utr:sqft
SUBSIDIAIRES OF CHINA GREEN AGRICULTURE, INC.
18 U.S.C. SECTION 1350,
The undersigned hereby certifies, in his capacity
as the Chairman of the Board of Directors, Chief Executive Officer, and President of China Green Agriculture, Inc. (the “Company”),
for the purposes of 18 U.S.C. Section 1350, as adopted pursuant to Section 906 of the Sarbanes-Oxley Act of 2002, that to the best of
his knowledge:
18 U.S.C. SECTION 1350,
The undersigned hereby certifies, in his capacity
as the Co-Chief Executive Officer of China Green Agriculture, Inc. (the “Company”), for the purposes of 18 U.S.C. Section
1350, as adopted pursuant to Section 906 of the Sarbanes-Oxley Act of 2002, that to the best of his knowledge:
18 U.S.C. SECTION 1350,
The undersigned hereby certifies, in his capacity
as the Chief Financial Officer of China Green Agriculture, Inc. (the “Company”), for the purposes of 18 U.S.C. Section 1350,
as adopted pursuant to Section 906 of the Sarbanes-Oxley Act of 2002, that to the best of his knowledge: