false 0001687932 0001687932 2024-01-08 2024-01-08
UNITED STATES
SECURITIES AND EXCHANGE COMMISSION
Washington, D.C. 20549
FORM 8-K
CURRENT REPORT
PURSUANT TO SECTION 13 OR 15(d)
OF THE SECURITIES EXCHANGE ACT OF 1934
Date of Report (Date of earliest event reported): January 8, 2024
J.JILL, INC.
(Exact name of registrant as specified in its charter)
|
|
|
|
|
| Delaware |
|
001-38026 |
|
45-1459825 |
(State or other jurisdiction
of incorporation) |
|
(Commission File Number) |
|
(I.R.S. Employer
Identification No.) |
4 Batterymarch Park
Quincy, MA 02169
(Address of principal executive offices) (Zip Code)
(617) 376-4300
(Registrant’s telephone number, including area code)
Not Applicable
(Former name or former address, if changed since last report)
Check the appropriate box below if the Form 8-K filing is intended to simultaneously satisfy the filing obligation of the registrant under any of the following provisions:
| ☐ |
Written communications pursuant to Rule 425 under the Securities Act (17 CFR 230.425) |
| ☐ |
Soliciting material pursuant to Rule 14a-12 under the Exchange Act (17 CFR 240.14a-12) |
| ☐ |
Pre-commencement communications pursuant to Rule 14d-2(b) under the Exchange Act (17 CFR 240.14d-2(b)) |
| ☐ |
Pre-commencement communications pursuant to Rule 13e-4(c) under the Exchange Act (17 CFR 240.13e-4(c)) |
Securities registered pursuant to Section 12(b) of the Act:
|
|
|
|
|
| Title of each class: |
|
Trading
Symbol(s) |
|
Name of each exchange on which registered: |
| Common Stock, $0.01 par value |
|
JILL |
|
New York Stock Exchange |
Indicate by check mark whether the registrant is an emerging growth company as defined in Rule 405 of the Securities Act of 1933 (§230.405 of this chapter) or Rule 12b-2 of the Securities Exchange Act of 1934 (§240.12b-2 of this chapter).
Emerging growth company ☐
If an emerging growth company, indicate by check mark if the registrant has elected not to use the extended transition period for complying with any new or revised financial accounting standards provided pursuant to Section 13(a) of the Exchange Act. ☐
| Item 7.01 |
Regulation FD Disclosure. |
On January 8, 2024, J.Jill, Inc. (the “Company”) reaffirmed its fourth quarter and full year 2023 guidance in advance of its presentation and investor meetings today at the 26th Annual ICR Conference.
Copies of the Company’s related press release and the Company’s ICR Conference presentation are attached to this current report as Exhibits 99.1 and 99.2, respectively, and are incorporated herein by reference.
| Item 9.01. |
Financial Statements and Exhibits. |
(d) Exhibits:
SIGNATURE
Pursuant to the requirements of the Securities Exchange Act of 1934, the registrant has duly caused this report to be signed on its behalf by the undersigned hereunto duly authorized.
|
|
|
|
|
|
|
| Date: January 8, 2024 |
|
J.JILL, INC. |
|
|
|
|
|
|
|
|
By: |
|
/s/ Mark Webb |
|
|
|
|
Name: |
|
Mark Webb |
|
|
|
|
Title: |
|
Executive Vice President, Chief Financial Officer and Chief Operating Officer |
Exhibit 99.1

J.Jill, Inc. Reaffirms Fourth Quarter and Full Year 2023 Guidance
Ahead of the 26th Annual ICR Conference
QUINCY, Mass. – January 8, 2024—J.Jill, Inc. (NYSE:JILL) today reaffirmed its fourth quarter and full year 2023 guidance in advance of its
presentation and investor meetings at the 26th Annual ICR Conference.
For the fourth quarter of fiscal 2023, the Company continues to expect revenues to
be approximately flat compared to the fourth quarter of fiscal 2022, and for Adjusted EBITDA* to be in the range of $11.0 million and $13.0 million.
For fiscal 2023, the Company continues to expect Adjusted EBITDA* dollars to be down in the low-single digits compared
to fiscal 2022.
The fourth quarter and full year Fiscal 2023 Adjusted EBITDA* outlook includes approximately $2.0 million of benefit from the 53rd
week in fiscal 2023.
The Company is scheduled to present at the 26th Annual ICR Conference, held at the Grande Lakes Orlando in Orlando, FL, today,
Monday, January 8, 2024 at 11:30 a.m. Eastern Time. The audio portion of the presentation will be webcast live over the Internet and can be accessed, along with the corresponding slide presentation, on the Company’s Investor Relation
website, http://investors.jjill.com/Investors-Relations/News-Events/events. An online archive will be available on that site following the presentation.
About J.Jill, Inc.
J.Jill is a national lifestyle brand
that provides apparel, footwear and accessories designed to help its customers move through a full life with ease. The brand represents an easy, thoughtful, and inspired style that celebrates the totality of all women and designs its products with
its core brand ethos in mind: keep it simple and make it matter. J.Jill offers a high touch customer experience through over 200 stores nationwide and a robust ecommerce platform. J.Jill is headquartered outside Boston. For more information, please
visit www.jjill.com or http://investors.jjill.com. The information included on our websites is not incorporated by reference herein.
Non-GAAP Financial Measures
| * |
The Company has not provided a reconciliation of Adjusted EBITDA outlook for the fourth quarter and full year
of fiscal 2023 to GAAP net income, the most directly comparable GAAP financial measure due to the inherent difficulty, without unreasonable efforts, to predict with reasonable certainty the amount or timing of
non-GAAP adjustments that are used to calculate Adjusted EBITDA, including but not limited to: (a) tax-related items, (b) lease expenses for retail stores
given ongoing negotiations, and (c) other non-recurring items not indicative of ongoing operating performance. These adjustments are uncertain, depend on various factors that are beyond our control and
could have a material impact on net income for the fourth quarter of fiscal 2023. |
To supplement our unaudited consolidated financial statements presented in accordance with generally accepted
accounting principles (“GAAP”), we use the following non-GAAP measures of financial performance:
| |
• |
|
Adjusted EBITDA, which represents net income (loss) plus interest expense, provision (benefit) for income taxes,
depreciation and amortization, equity-based compensation expense, impairments of goodwill, intangible assets and other long-lived assets, fair value adjustments of warrants and derivatives and other
non-recurring expenses and one-time items. We present Adjusted EBITDA on a consolidated basis because management uses it as a supplemental measure in assessing our
operating performance, and we believe that it is helpful to investors, securities analysts and other interested parties as a measure of our comparative operating performance from period to period. We also use Adjusted EBITDA as one of the primary
methods for planning and forecasting overall expected performance of our business and for evaluating on a quarterly and annual basis actual results against such expectations. Further, we recognize Adjusted EBITDA as a commonly used measure in
determining business value and as such, use it internally to report results. |
While we believe that Adjusted EBITDA is useful in
evaluating our business, it is a non-GAAP financial measure that has limitations as an analytical tool. Adjusted EBITDA should not be considered an alternative to, or substitute for, net income (loss) or EPS,
which are calculated in accordance with GAAP. In addition, other companies, including companies in our industry, may calculate Adjusted EBITDA differently or not at all, which reduces the usefulness of such
non-GAAP financial measures as a tool for comparison.
Forward-Looking Statements
This press release contains, and oral statements made from time to time by our representatives may contain, “forward-looking statements” within the
meaning of Private Securities Litigation Reform Act of 1995. All statements other than statements of historical facts contained in this press release, including statements regarding our strategy, future operations, future financial position, future
revenue, projected costs, prospects, plans, objectives of management, expected market growth and any activities, events or developments that we intend, expect or believe may occur in the future are forward-looking statements. Such statements are
often identified by words such as “could,” “may,” “might,” “will,” “likely,” “anticipates,” “intends,” “plans,” “seeks,” “believes,”
“estimates,” “expects,” “continues,” “projects,” “goal,” “target” (although not all forward-looking statements contain these identifying words) and similar references to future periods, or
by the inclusion of forecasts or projections.
Forward-looking statements are based on our current expectations and assumptions regarding capital market
conditions, our business, the economy and other future conditions and are not guarantees of future performance. Because forward-looking statements relate to the future, by their nature, they are inherently subject to a number of risks,
uncertainties, potentially inaccurate assumptions and changes
in circumstances that are difficult to predict. As a result, our actual results may differ materially from those contemplated by the forward-looking statements. Important factors that could cause
actual results to differ materially from those in any forward-looking statements include regional, national or global political, economic, business, competitive, market and regulatory conditions, including risks regarding: (1) our sensitivity
to changes in economic conditions and discretionary consumer spending; (2) the material adverse impact of pandemics or other health crises on our operations, business and financial results; (3) our ability to anticipate and respond to
changing customer preferences, shifts in fashion and industry trends in a timely manner; (4) our ability to maintain our brand image, engage new and existing customers and gain market share; (5) the impact of operating in a highly
competitive industry with increased competition; (6) our ability to successfully optimize our omnichannel operations, including our ability to enhance our marketing efforts and successfully realize the benefits from our investments in new
technology, for example our recently implemented point-of-sale system and the forthcoming upgrade to our order management system; (7) our ability to use effective
marketing strategies and increase existing and new customer traffic; (8) any interruptions in our foreign sourcing operations and the relationships with our suppliers and agents; (9) any increases in the demand for, or the price of, raw
materials used to manufacture our merchandise and other fluctuations in sourcing and distribution costs; (10) any material damage or interruptions to our information systems; (11) our ability to protect our trademarks and other
intellectual property rights; (12) our indebtedness restricting our operational and financial flexibility; (13) our ability to manage our inventory levels, size assortments and merchandise mix; (14) our status as a controlled company;
and (15) other factors that may be described in our filings with the Securities and Exchange Commission (the “SEC”), including the factors set forth under “Risk Factors” in our Annual Report on Form 10-K for the fiscal year ended January 28, 2023. Under the “safe harbor” provisions of the Private Securities Litigation Reform Act of 1995, we have identified these important factors that,
individually or in the aggregate, could cause actual results and outcomes, including with respect to our ability to achieve our strategy and other goals and future plans in this press release or in our oral statements, to differ materially from
those contained in, or implied by, any forward-looking statements we make. You should understand that it is not possible to predict or identify all factors and risks. Consequently, you should not consider the foregoing list to be complete. You are
encouraged to read our filings with the SEC, available at www.sec.gov, for a discussion of these and other risks and uncertainties. We caution investors, potential investors and others not to place considerable reliance on the forward-looking
statements in this press release and in the oral statements made by our representatives. Any such forward-looking statement speaks only as of the date on which it is made. J.Jill undertakes no obligation to publicly update or revise any
forward-looking statement, whether as a result of new information, future developments or otherwise.
Contacts:
Investor Relations:
Caitlin Churchill
ICR, Inc.
investors@jjill.com
203-682-8200
Business and Financial Media:
Ariel Kouvaras
Sloane & Company
akouvaras@sloanepr.com
973-897-6241
Brand Media:
Meredith Schwenk
J.Jill, Inc.
media@jjill.com
617-376-4399

Exhibit 99.2 1

2

Forward-Looking and Cautionary Statements This presentation contains,
and oral statements made from time to time by our representatives may contain, “forward-looking statements” within the meaning of Private Securities Litigation Reform Act of 1995. All statements other than statements of historical facts
contained in this presentation, including statements regarding our strategy, future operations, future financial position, future revenue, projected costs, prospects, plans, objectives of management, expected market growth and any activities, events
or developments that we intend, expect or believe may occur in the future are forward-looking statements. Such statements are often identified by words such as “could,” “may,” “might,” “will,”
“likely,” “anticipates,” “intends,” “plans,” “seeks,” “believes,” “estimates,” “expects,” “continues,” “projects,”
“goal,” “target” (although not all forward-looking statements contain these identifying words) and similar references to future periods, or by the inclusion of forecasts or projections. Forward-looking statements are based on
our current expectations and assumptions regarding capital market conditions, our business, the economy and other future conditions and are not guarantees of future performance. Because forward-looking statements relate to the future, by their
nature, they are inherently subject to a number of risks, uncertainties, potentially inaccurate assumptions and changes in circumstances that are difficult to predict. As a result, our actual results may differ materially from those contemplated by
the forward-looking statements. Important factors that could cause actual results to differ materially from those in any forward-looking statements include regional, national or global political, economic, business, competitive, market and
regulatory conditions, including risks regarding : (1) our sensitivity to changes in economic conditions and discretionary consumer spending; (2) the material adverse impact of pandemics or other health crises on our operations, business and
financial results; (3) our ability to anticipate and respond to changing customer preferences, shifts in fashion and industry trends in a timely manner; (4) our ability to maintain our brand image, engage new and existing customers and gain market
share; (5) the impact of operating in a highly competitive industry with increased competition; (6) our ability to successfully optimize our omnichannel operations, including our ability to enhance our marketing efforts[ and successfully realize the
benefits from our investments in new technology, for example our recently implemented point-of-sale system and the forthcoming upgrade to our order management system]; (7) our ability to use effective marketing strategies and increase existing and
new customer traffic; (8) any interruptions in our foreign sourcing operations and the relationships with our suppliers and agents; (9) any increases in the demand for, or the price of, raw materials used to manufacture our merchandise and other
fluctuations in sourcing and distribution costs; (10) any material damage or interruptions to our information systems; (11) our ability to protect our trademarks and other intellectual property rights; (12) our indebtedness restricting our
operational and financial flexibility; (13) our ability to manage our inventory levels, size assortments and merchandise mix; (14) our status as a controlled company; and (15) other factors that may be described in our filings with the Securities
and Exchange Commission (the “SEC”), including the factors set forth under “Risk Factors” in our Annual Report on Form 10-K for the fiscal year ended January 28, 2023. Under the “safe harbor” provisions of the
Private Securities Litigation Reform Act of 1995, we have identified these important factors that, individually or in the aggregate, could cause actual results and outcomes, including with respect to our ability to achieve our strategy and other
goals and future plans discussed in this presentation, to differ materially from those contained in, or implied by, any forward-looking statements we make. You should understand that it is not possible to predict or identify all factors and risks.
Consequently, you should not consider the foregoing list to be complete. You are encouraged to read our filings with the SEC, available at www.sec.gov, for a discussion of these and other risks and uncertainties. We caution investors, potential
investors and others not to place considerable reliance on the forward-looking statements in this presentation and in the oral statements made by our representatives. Any such forward-looking statement speaks only as of the date on which it is made.
J.Jill undertakes no obligation to publicly update or revise any forward-looking statement, whether as a result of new information, future developments or otherwise. Non-GAAP Financial Measures This presentation includes financial information
determined by methods other than in accordance with U.S. generally accepted accounting principles (“GAAP”). Our management uses these non-GAAP measures in its analysis of our performance. These non-GAAP disclosures should not be viewed
as a substitute for operating results determined in accordance with GAAP, nor are they necessarily comparable to non-GAAP performance measures that may be presented by other companies. Reconciliations of these non-GAAP measures to the most
comparable GAAP measures are included in the Appendix to this presentation. 3

4

5

Net Sales Gross Margin Rate Adjusted (1) EBITDA /Margin $602.9M 70.0%
$109.7M/18.2% (2) (3) Net Sales Channel Split Avg Customer Tenure Store Count 54% / 46% >10 245 Retail / Direct Years 2015: TowerBrook J.Jill is founded 1999: opened first 2017: IPO - JILL Post-Covid refined purchases the retail stores and
operating model company Heritage as a launched e- 2021: Claire Spofford focused on driving Catalog business commerce site joins as CEO sustainable, profitable growth (1) Non-GAAP financial measures; see Appendix for reconciliation to GAAP financial
measures (2) Reflects average tenure of existing customer base (>1 year with J. Jill). Source: J.Jill Customer Database LTMNov23 6 (3) Reflects store count as of end of fiscal period ended October 28, 2023

J.Jill is a national lifestyle brand that creates versatile apparel,
footwear and accessories designed to meet every moment of our customers’ lives • Efficient, disciplined operating model yielding strong EBITDA and consistent free cash flow generation • Extremely loyal customer from attractive and
valuable demographic • Balanced business model across retail and direct • Relevant, size inclusive product assortments • Investing in technology to improve the customer experience and unlock revenue-generating capabilities •
Opportunity for profitable growth through market share gains 7

26% 25% We target one of the largest segments of the female population
19% 17% 13% Target customer is 45-65, with new customers moving towards the Target Customers younger end of the range Children Youth Adult Adult Seniors 0-14 15-24 25-44 45-64 65+ (2) U.S. Census Bureau, Population Division. Annual Estimates of the
Resident Population for Selected Age Groups by Sex for the United States: April 1, 2020 to July 1, 2022 (NC-EST2022-AGESEX). June 2023 Release (1) Approximately 50% of customers have an income of $150K+ Just 25% have children in their household,
allowing for more (1) discretionary spend on herself Population J.Jill Customers 63% (1) 38% 69% are college graduates (double the total population) 30% 30% 26% 12% of the file have a post-grad degree (nearly quadruple the total (1) population) 12%
Under $100K $100K<$200K $200K+ (3) U.S. Census Bureau, Current Population Survey, 2023 Annual Social and Economic Supplement (CPS ASEC). 8 (1) J.Jill Customer Database LTMNov23 (4) Epsilon Total Source Plus

• She buys to update her wardrobe seasonally • She is
digitally savvy and is comfortable shopping all channels • She frequents the store for the high-touch experience, personal styling and appointments • She leverages our private label credit card with exclusive benefits that keep her
engaged (1) Source: J.Jill Brand Tracker January 2023, NPS Score of Past Six-Month Shoppers (2) The percent of customers who say they are highly satisfied or satisfied with their most recent in-store purchase. Source: J.Jill CSAT Tracker (3) For two
consecutive twelve-month timeframes, Retention Rate is the # of Customers who shopped in both timeframes divided by the # of Customers who shopped in the previous timeframe. Source J.Jill Customer Database LTMNov23 9 (4) Reflects average tenure of
existing customer base (>1 year with J. Jill). Source: J.Jill Customer Database LTMNov23

o t y O n e u o r c m o n r a e m i h r n e i n - i p c k x u a r e s n
o t o d g w n l m i s o l e p y e r p s a n l o a n Omnichannel Direct Store (1) 3.0x Engaging Experience Omni-customer spend J.Jill at Her Fingertips vs. single channel • High-touch customer • Convenient access to experience the full
assortment • Elevated showcase of • Inclusive Sizing in XS-4X, brand concept Petite and Tall • Appointments and • Online-only exclusive Events product • New POS provides • Styling and Fit tools seamless in-store
access to full assortment and sizes . 10 (1) J.Jill Customer Database LTMNov23 r h c a e s u h s s o t s C u o e r l l m i m m a e t a o r e s s e t R s v d a a l n r u a e a v t i b c l l e e e r i d D r u O

The J.Jill retail platform is a highly efficient and profitable model
that combines an unmatched shopping experience with attractive economics in only the best locations. New POS further heightens the in-store experience • Streamlined store fleet in premium malls (52% of units) and lifestyle centers (48% of
units) • Underpenetrated relative the competition. Strategically opening new 60% locations in select markets of New Customers Make Their First (1) Purchase Through a Store • 97% of the store fleet is profitable (1) J.Jill Customer
Database LTMNov23 • Attractive return on initial net investment of $1M, representing a cash-on- cash return of approx. 40% at maturity Store Count as of LTM Q323: 245 11

• – Historically casual, right for the moment with a flow
and ease to our silhouettes • – We interpret seasonal trends and delight her with inspired novelties each season. She pairs her new coveted favorites back to quality staples • – With sizes XS to 4X and offerings in Petite and
Tall, our inclusive sizing creates consistent brand experiences across extended sizes • – We show her how to put outfits together, leveraging the third piece or accessories and footwear to complete each look • – We leverage
our portfolio of sub brands to flex and adapt penetrations based on consumer needs and shifts in trend 12 (1) J.Jill Brand Tracker

Our Core assortment and 3 Sub-Brands cover the needs of our customer
LIFE IN MOTION STYLE MADE SIMPLE THE ART OF EASE ALL DAY CHIC Simple silhouettes, high-quality Focused on elevated fabrics, Versatile performance apparel Wearever provides mix & basics, trend-right color, and and artisanal & unique match
knit based separates for the active and enjoyable interpreted relevant trends, techniques -often done by lifestyle. Style designed for dressing designed to be easy- combine to create curated, hand - Pure Jill provides a pack, easy-care & travel
health and wellness, focused versatile, and intuitive outfit luxurious and versatile casual on a blend of performance ready. Universal fits and focused collections that move collection; polished enough attributes with comfort feel- uncomplicated
silhouettes with her throughout her multi- for a weekend getaway or make “polished made easy” good loungewear. faceted life, moment to entertaining with friends and Walking. Running. Hiking. for any occasion. Yoga. Golf. Tennis. Errands.
moment. family. Leveraged for Wear-to-Work The “Pure Jill Elements” collection 13 this year tests the upper limit of the brand

New pieces for each collection Predictable assortment with seasonal
updates Grounded in annual and semi- annual Simplified merchandising process that drives profitability while still flowing newness 14

($Millions) (1) Net Revenue Adjusted EBITDA and Margin 15% 18% 62.0%
57.6% 67.4% 68.6% 9% NM 16% 65.2% $706 $691 $615 $585 $109 $103 $294 $302 $92 $427 $288 $292 $65 $279 $413 $390 $327 $294 $147 2018 2019 2020 2021 2022 Retail Direct Gross Margin % ($38) 2018 2019 2020 2021 2022 Total Company Comparable Sales 1%
(3%) n/a 23% 7% Margin Adjusted EBITDA Total Store Count 282 287 267 253 243 15 (1) Non-GAAP financial measures; see Appendix for reconciliation to GAAP financial measures

Approximate Two-Year (1) Average Revenue $600 Million Gross Margin 68%
Adjusted EBITDA $100 Million Interest $20 Million Tax Expense $12 Million Pro Forma (2) Capital Expenditures $20 Million (3) Free Cash Flow $40 Million (1) Approximate Average of prior Fiscal Years 2021 & 2022 (2) Fiscal 2021 & 2022 average
capital of $10 million increased to reflect investments in technology projects and store growth 16 (3) Excludes ~$28 million of COVID tax credits received 2021-2022 and includes pro forma capital of $20 million; Non-GAAP financial measure; see
Appendix for reconciliation to GAAP financial measures
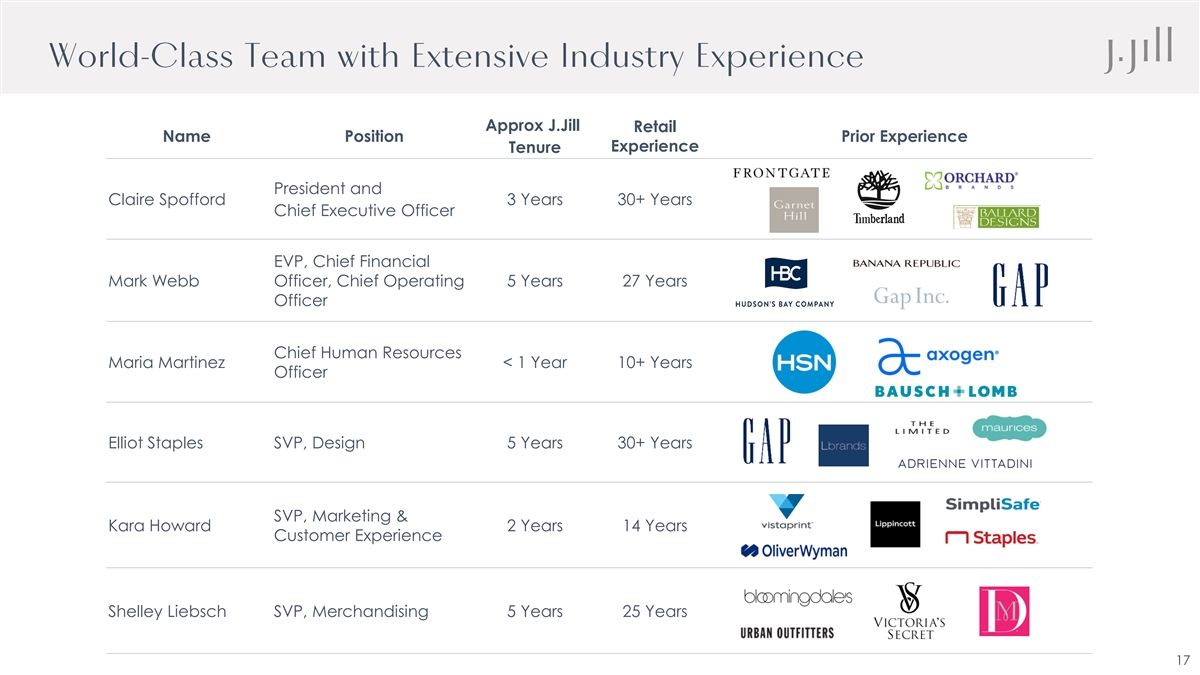
Approx J.Jill Retail Name Position Prior Experience Experience Tenure
President and Claire Spofford 3 Years 30+ Years Chief Executive Officer EVP, Chief Financial Mark Webb Officer, Chief Operating 5 Years 27 Years Officer Chief Human Resources Maria Martinez < 1 Year 10+ Years Officer Elliot Staples SVP, Design 5
Years 30+ Years SVP, Marketing & Kara Howard 2 Years 14 Years Customer Experience Shelley Liebsch SVP, Merchandising 5 Years 25 Years 17

18

Female Apparel Total $133 Bn Measured Market J.Jill Apparel $115 Bn (1)
Categories J.Jill is poised to Women 45+ continue to take $133 Bn $38 Bn Household market share in a Income $75K+ growing and attractive category J.Jill $615 M FY 2022 Net Sales Source: Circana Female Apparel LTM July 2023 (1) Includes
Circana’s female apparel total measured market categories less bras, cold weather undergarmets, panties, shapewear, sheer hosiery and swimwear 19

✓ Attract and Convert New Customers Through Focused Strategic
Initiatives – Significant opportunity to increase brand awareness ✓ Modernize the Brand and Value Proposition to Increase Relevance – New and exciting offerings such as inclusive sizing ✓ Drive Growth in High-Potential
Sub-Brands and Offerings – Such as Pure Jill Elements ✓ Strengthen Omnichannel Capabilities while Increasing Digital Sales – Provide the service and tools she needs to shop when and wherever she wants ✓ Profitably Expand
Our Store Base – Optimize store count in quality locations to further connect with our customers 20

• Drive Profitable Growth and Increase Market Share through
Strategic Initiatives • Disciplined Store Growth; Expect to Open 20-25 New Stores in the Mid Term • Maintain Healthy Gross Margin Profile • Ongoing Operating Expense Management • Goal to Deliver High Teens Adjusted EBITDA
Margin • Generate Strong & Consistent Free Cash Flow to Deploy to Growth Initiatives and Shareholder Return Strategies 21

• Invest in growth initiatives • Invest in systems •
Pay down debt – Amortization schedule – Excess cash flow sweeps – Prepayments • Evaluate other total shareholder return strategies (e.g. dividends and share buybacks) and accretive M&A opportunities 22

23

Performance continues to exhibit strong operating disciplines despite
macroeconomic headwinds Commentary Net Revenue ($Millions) ◼ Net Revenue decreased by 0.1% year-over-year, and total $150 $150 store count decreased by 1%, from 247 to 245 over the same time period ─ Total Company comparable store sales,
which includes comparable store and direct to consumer, was up 1.9% year-over-year Retail Direct Gross Profit and Margin ◼ Gross Margin expanded 190 bps year-over-year, driven by ($Millions) favorability in freight costs and underlying first
cost AUCs, 69.9% 71.8% strong full price selling and lower promotions ◼ Adjusted EBITDA Margin increased 50 bps compared to last year at 18.8% Gross Profit Margin (1) Adjusted EBITDA and Margin ($Millions) 18.3% 18.8% 24 (1) Non-GAAP financial
measures; see Appendix for reconciliation to GAAP financial measures Adj. EBITDA Margin

($Millions) (1) Net Revenue Adjusted EBITDA and Margin 62.0% 57.6%
67.4% 68.6% 65.2% 15% 9% NM 16% 18% $109 $706 $691 $103 $615 $92 $585 $294 $302 $65 $427 $288 $292 $279 $413 $390 $327 $294 $147 2018 2019 2020 2021 2022 Retail Direct Gross Margin % Adjusted EBITDA ($38) Margin 2018 2019 2020 2021 2022 Total
Company Comparable Sales 1% (3%) n/a 23% 7% (1) (1) (2) (1) (3) Ca Ca Capit pit pital al al Ex Ex Expe pe pendit ndit nditur ur ures es es Free Cash Flow and Cash Conversion 40 3% 3% 1% 1% 2% 41% 22% NM 76% 54% 3% 3% 2% 1% 1% 2% 35 30 $25 25 $70 $18
$59 20 $15 $43 15 10 $5 $14 $4 5 0 2018 2019 2020 2021 2022 Free Cash Flow Free Cash Flow Conversion CapEx % of Revenue ($39) (1) Non-GAAP financial measures; see Appendix for reconciliation to GAAP financial measures 2018 2019 2020 2021 2022 (2)
Capital Expenditures presented excluding tenant allowances as reported on the statement of cash flows. 25 (3) Free Cash Flow is defined as Cash from Operations less Gross Capital Expenditures. Cash Conversion is defined as Free Cash Flow as a
percentage of Adjusted EBITDA.

($Millions) Cash Inventory $77 $73 $58 $87 $56 $51 $66 $4 $36 $22 2018
2019 2020 2021 2022 2018 2019 2020 2021 2022 (1) (1) C Ca ap pit ita al l Ex Ex Deb p pend end t it itur ures es Commentary • Healthy cash balance and strong free cash flow for capital deployment • Disciplined model demonstrated in
rightsized $240 $234 $232 inventory; contributes to strong yields $210 $209 • Refreshed capital structure in 2023; reduced Term Loan principal to $175M and extended maturity to May 2028 o $40M ABL maturity aligned to Term Loan 2018 2019 2020
2021 2022 o Net Debt/Adj EBITDA <1.5x 26

(1) $ in millions 2018 2019 2020 2021 2022 Q3 '23 LTM Q3
Commentary Net Sales $ 706 $ 691 $ 427 $ 585 $ 615 $ 150 $ 603 a. Equity Based Compensation: adds back stock based compensation expensed through the P&L; related compensation expense recognized based on fair value at Net Income $ 31 $ (129) $
(139) $ (28) $ 42 $ 12 $ 32 the date of grant. Interest Expense 19 20 18 19 20 6 24 b. Impairments: adds back impairment of goodwill, intangibles, and long-lived assets Income Tax Provision 12 (3) (48) 8 16 5 14 expensed through the P&L; in
FY19, the impairment charges are primarily related to goodwill & intangibles; in FY20, impairment is related to goodwill & intangibles and Depreciation & Amort 37 38 34 29 26 6 23 leasehold improvements arising from material adverse
effect from COVID-19. Equity Based Comp (a) 4 4 2 3 4 1 4 c. Fair Market Value Adj: primarily consists of non-cash fair value adjustments of Write-off of Prop & Equip 0 0 1 1 0 0 0 warrants issued with the September 2020 refinancing. Adj for
Exited Retail Stores - - (1) (2) (0) (1) (1) d. Refinancing Costs: represents costs associated with debt refinancing transactions Impairments (b) - 134 66 - 1 0 0 completed in September 2020 and April 2023. Fair Market Value Adj (c) - - 5 60 - - -
e. Non-Recurring Items: Represents items management believes are not indicative of ongoing operating performance, including professional fees, retention expenses Refinancing Costs (d) - - 22 - - - 13 and costs related to the COVID-19 pandemic.
Non-Recurring (e) 1 2 3 2 0 - 0 Adjusted EBITDA $ 103 $ 65 $ (38) $ 92 $ 109 $ 28 $ 110 Margin % 15% 9% -9% 16% 18% 19% 18% $ in millions 2018 2019 2020 2021 2022 Q3 '23 Net Income $ 31 $ (129) $ ( 139) $ (28) $ 42 $ 12 Non-Cash Expense 38
166 94 91 35 6 Change in Working Capital (1) (5) 11 12 (3) 3 Cash from Operations 68 33 ( 35) 75 74 21 Less: Capital Expenditures 25 18 4 5 15 4 Free Cash Flow $ 43 $ 14 $ ( 39) $ 70 $ 59 $ 17 27 (1) Amounts shown as 0 round to less than $1
million
v3.23.4
| X |
- DefinitionBoolean flag that is true when the XBRL content amends previously-filed or accepted submission.
| Name: |
dei_AmendmentFlag |
| Namespace Prefix: |
dei_ |
| Data Type: |
xbrli:booleanItemType |
| Balance Type: |
na |
| Period Type: |
duration |
|
| X |
- DefinitionFor the EDGAR submission types of Form 8-K: the date of the report, the date of the earliest event reported; for the EDGAR submission types of Form N-1A: the filing date; for all other submission types: the end of the reporting or transition period. The format of the date is YYYY-MM-DD.
| Name: |
dei_DocumentPeriodEndDate |
| Namespace Prefix: |
dei_ |
| Data Type: |
xbrli:dateItemType |
| Balance Type: |
na |
| Period Type: |
duration |
|
| X |
- DefinitionThe type of document being provided (such as 10-K, 10-Q, 485BPOS, etc). The document type is limited to the same value as the supporting SEC submission type, or the word 'Other'.
| Name: |
dei_DocumentType |
| Namespace Prefix: |
dei_ |
| Data Type: |
dei:submissionTypeItemType |
| Balance Type: |
na |
| Period Type: |
duration |
|
| X |
- DefinitionAddress Line 1 such as Attn, Building Name, Street Name
| Name: |
dei_EntityAddressAddressLine1 |
| Namespace Prefix: |
dei_ |
| Data Type: |
xbrli:normalizedStringItemType |
| Balance Type: |
na |
| Period Type: |
duration |
|
| X |
- Definition
+ References
+ Details
| Name: |
dei_EntityAddressCityOrTown |
| Namespace Prefix: |
dei_ |
| Data Type: |
xbrli:normalizedStringItemType |
| Balance Type: |
na |
| Period Type: |
duration |
|
| X |
- DefinitionCode for the postal or zip code
| Name: |
dei_EntityAddressPostalZipCode |
| Namespace Prefix: |
dei_ |
| Data Type: |
xbrli:normalizedStringItemType |
| Balance Type: |
na |
| Period Type: |
duration |
|
| X |
- DefinitionName of the state or province.
| Name: |
dei_EntityAddressStateOrProvince |
| Namespace Prefix: |
dei_ |
| Data Type: |
dei:stateOrProvinceItemType |
| Balance Type: |
na |
| Period Type: |
duration |
|
| X |
- DefinitionA unique 10-digit SEC-issued value to identify entities that have filed disclosures with the SEC. It is commonly abbreviated as CIK. Reference 1: http://www.xbrl.org/2003/role/presentationRef
-Publisher SEC
-Name Exchange Act
-Number 240
-Section 12
-Subsection b-2
| Name: |
dei_EntityCentralIndexKey |
| Namespace Prefix: |
dei_ |
| Data Type: |
dei:centralIndexKeyItemType |
| Balance Type: |
na |
| Period Type: |
duration |
|
| X |
- DefinitionIndicate if registrant meets the emerging growth company criteria. Reference 1: http://www.xbrl.org/2003/role/presentationRef
-Publisher SEC
-Name Exchange Act
-Number 240
-Section 12
-Subsection b-2
| Name: |
dei_EntityEmergingGrowthCompany |
| Namespace Prefix: |
dei_ |
| Data Type: |
xbrli:booleanItemType |
| Balance Type: |
na |
| Period Type: |
duration |
|
| X |
- DefinitionCommission file number. The field allows up to 17 characters. The prefix may contain 1-3 digits, the sequence number may contain 1-8 digits, the optional suffix may contain 1-4 characters, and the fields are separated with a hyphen.
| Name: |
dei_EntityFileNumber |
| Namespace Prefix: |
dei_ |
| Data Type: |
dei:fileNumberItemType |
| Balance Type: |
na |
| Period Type: |
duration |
|
| X |
- DefinitionTwo-character EDGAR code representing the state or country of incorporation.
| Name: |
dei_EntityIncorporationStateCountryCode |
| Namespace Prefix: |
dei_ |
| Data Type: |
dei:edgarStateCountryItemType |
| Balance Type: |
na |
| Period Type: |
duration |
|
| X |
- DefinitionThe exact name of the entity filing the report as specified in its charter, which is required by forms filed with the SEC. Reference 1: http://www.xbrl.org/2003/role/presentationRef
-Publisher SEC
-Name Exchange Act
-Number 240
-Section 12
-Subsection b-2
| Name: |
dei_EntityRegistrantName |
| Namespace Prefix: |
dei_ |
| Data Type: |
xbrli:normalizedStringItemType |
| Balance Type: |
na |
| Period Type: |
duration |
|
| X |
- DefinitionThe Tax Identification Number (TIN), also known as an Employer Identification Number (EIN), is a unique 9-digit value assigned by the IRS. Reference 1: http://www.xbrl.org/2003/role/presentationRef
-Publisher SEC
-Name Exchange Act
-Number 240
-Section 12
-Subsection b-2
| Name: |
dei_EntityTaxIdentificationNumber |
| Namespace Prefix: |
dei_ |
| Data Type: |
dei:employerIdItemType |
| Balance Type: |
na |
| Period Type: |
duration |
|
| X |
- DefinitionLocal phone number for entity.
| Name: |
dei_LocalPhoneNumber |
| Namespace Prefix: |
dei_ |
| Data Type: |
xbrli:normalizedStringItemType |
| Balance Type: |
na |
| Period Type: |
duration |
|
| X |
- DefinitionBoolean flag that is true when the Form 8-K filing is intended to satisfy the filing obligation of the registrant as pre-commencement communications pursuant to Rule 13e-4(c) under the Exchange Act. Reference 1: http://www.xbrl.org/2003/role/presentationRef
-Publisher SEC
-Name Exchange Act
-Number 240
-Section 13e
-Subsection 4c
| Name: |
dei_PreCommencementIssuerTenderOffer |
| Namespace Prefix: |
dei_ |
| Data Type: |
xbrli:booleanItemType |
| Balance Type: |
na |
| Period Type: |
duration |
|
| X |
- DefinitionBoolean flag that is true when the Form 8-K filing is intended to satisfy the filing obligation of the registrant as pre-commencement communications pursuant to Rule 14d-2(b) under the Exchange Act. Reference 1: http://www.xbrl.org/2003/role/presentationRef
-Publisher SEC
-Name Exchange Act
-Number 240
-Section 14d
-Subsection 2b
| Name: |
dei_PreCommencementTenderOffer |
| Namespace Prefix: |
dei_ |
| Data Type: |
xbrli:booleanItemType |
| Balance Type: |
na |
| Period Type: |
duration |
|
| X |
- DefinitionTitle of a 12(b) registered security. Reference 1: http://www.xbrl.org/2003/role/presentationRef
-Publisher SEC
-Name Exchange Act
-Number 240
-Section 12
-Subsection b
| Name: |
dei_Security12bTitle |
| Namespace Prefix: |
dei_ |
| Data Type: |
dei:securityTitleItemType |
| Balance Type: |
na |
| Period Type: |
duration |
|
| X |
- DefinitionName of the Exchange on which a security is registered. Reference 1: http://www.xbrl.org/2003/role/presentationRef
-Publisher SEC
-Name Exchange Act
-Number 240
-Section 12
-Subsection d1-1
| Name: |
dei_SecurityExchangeName |
| Namespace Prefix: |
dei_ |
| Data Type: |
dei:edgarExchangeCodeItemType |
| Balance Type: |
na |
| Period Type: |
duration |
|
| X |
- DefinitionBoolean flag that is true when the Form 8-K filing is intended to satisfy the filing obligation of the registrant as soliciting material pursuant to Rule 14a-12 under the Exchange Act. Reference 1: http://www.xbrl.org/2003/role/presentationRef
-Publisher SEC
-Name Exchange Act
-Section 14a
-Number 240
-Subsection 12
| Name: |
dei_SolicitingMaterial |
| Namespace Prefix: |
dei_ |
| Data Type: |
xbrli:booleanItemType |
| Balance Type: |
na |
| Period Type: |
duration |
|
| X |
- DefinitionTrading symbol of an instrument as listed on an exchange.
| Name: |
dei_TradingSymbol |
| Namespace Prefix: |
dei_ |
| Data Type: |
dei:tradingSymbolItemType |
| Balance Type: |
na |
| Period Type: |
duration |
|
| X |
- DefinitionBoolean flag that is true when the Form 8-K filing is intended to satisfy the filing obligation of the registrant as written communications pursuant to Rule 425 under the Securities Act. Reference 1: http://www.xbrl.org/2003/role/presentationRef
-Publisher SEC
-Name Securities Act
-Number 230
-Section 425
| Name: |
dei_WrittenCommunications |
| Namespace Prefix: |
dei_ |
| Data Type: |
xbrli:booleanItemType |
| Balance Type: |
na |
| Period Type: |
duration |
|
J Jill (NYSE:JILL)
Gráfico Histórico do Ativo
De Mar 2024 até Abr 2024

J Jill (NYSE:JILL)
Gráfico Histórico do Ativo
De Abr 2023 até Abr 2024
