UNITED STATES
SECURITIES AND EXCHANGE COMMISSION
Washington, D.C. 20549
FORM 6-K
REPORT OF
FOREIGN PRIVATE ISSUER
PURSUANT TO RULE 13a-16 or
15d-16
UNDER THE SECURITIES EXCHANGE ACT OF 1934
For the month of February 2024
Commission File Number: 001-14946
Cemex, S.A.B. de C.V.
(Translation of Registrant’s name into English)
Avenida
Ricardo Margáin Zozaya #325, Colonia Valle del Campestre,
San Pedro Garza García, Nuevo León 66265,
México
(Address of principal executive offices)
Indicate by check mark whether the registrant files or will file annual reports under cover Form 20-F or Form 40-F.
Form 20-F ☒ Form 40-F ☐
Indicate by check mark if the registrant is submitting the Form
6-K in paper as permitted by Regulation S-T Rule 101(b)(1):
Indicate by
check mark if the registrant is submitting the Form 6-K in paper as permitted by Regulation S-T Rule 101(b)(7):
Contents
|
|
|
| 1. |
|
Press release dated February 8, 2024, announcing fourth quarter 2023 results for Cemex, S.A.B. de C.V. (NYSE: CX) (“Cemex”). |
|
|
| 2. |
|
Fourth quarter 2023 results for Cemex. |
|
|
| 3. |
|
Presentation regarding fourth quarter 2023 results for Cemex. |
SIGNATURE
Pursuant to the requirements of the Securities Exchange Act of 1934, Cemex, S.A.B. de C.V. has duly caused this report to be signed on its
behalf by the undersigned, thereunto duly authorized.
|
|
|
|
|
|
|
|
|
|
|
|
|
|
|
|
|
Cemex, S.A.B. de C.V. |
|
|
|
|
|
|
|
|
(Registrant) |
|
|
|
|
|
| Date: |
|
February 8, 2024 |
|
|
|
By: |
|
/s/ Rafael Garza Lozano |
|
|
|
|
|
|
|
|
Name: Rafael Garza Lozano |
|
|
|
|
|
|
|
|
Title: Chief Comptroller |
3
EXHIBIT INDEX
|
|
|
EXHIBIT
NO. |
|
DESCRIPTION |
|
|
| 1. |
|
Press release dated February 8, 2024, announcing fourth quarter 2023 results for Cemex, S.A.B. de C.V. (NYSE: CX) (“Cemex”). |
|
|
| 2. |
|
Fourth quarter 2023 results for Cemex. |
|
|
| 3. |
|
Presentation regarding fourth quarter 2023 results for Cemex. |
4
Exhibit 1

Cemex announces record annual EBITDA
and proposal to initiate a dividend program
Monterrey, Mexico. February 8, 2024 – Cemex reported today exceptional 2023 results, with an 8% growth in Sales, 20% increase
in EBITDA, and a more than doubling of Free Cash Flow after maintenance capex to US$1.2 billion. This performance, coupled with the Board’s confidence in the medium-term outlook and strong free cash flow generation over the last few years,
allows Cemex to initiate a formal shareholder return program, subject to approval at the next Annual Shareholders’ Meeting.
Cemex reported an EBITDA
margin of 19.2%, an expansion of 2.0pp, achieving its stated goal of recovering 2021 margin. Record EBITDA of approximately US$3.35 billion, and a turnaround in working capital investment, significantly contributed to a 6-year high in Free Cash Flow after maintenance capex. Results were bolstered by strong pricing for its products across all markets, decelerating input cost inflation, and contributions from Cemex’s growth
investment strategy and Urbanization Solutions business. Cemex’s leverage ratio declined to 2.06x(1), within investment grade parameters.
“I am pleased to announce that 2023 is a record year for our company where we delivered not only great results and recovered from the extraordinary
inflationary pressures of the last few years, but also continued executing against our ambitious decarbonization commitments, reducing our CO2 emissions by 4% this year and by 13% since
2020,” said Fernando A. González, CEO of Cemex. “Despite the significant macro challenges of the last four years, we have proven not only the resiliency of our business model but also our ability to pivot and adjust rapidly to
changing global conditions. This foundation gives us additional flexibility in capital allocation, where we continue to accelerate investments in our bolt-on growth strategy, initiate a sustainable return
program for shareholders, and bolster our capital structure.”
Cemex proposes the initiation of a quarterly dividend program:
| |
• |
|
Subject to approval at Cemex’s Annual Shareholder Meeting to be scheduled on March 22nd. |
| |
• |
|
Equal quarterly dividend distribution totaling US$120 million in first year; first payment commencing in 2nd quarter of 2024 and final payment in 1st quarter of 2025. |
| |
• |
|
Subsequent dividend distributions under the program will be subject to shareholder approval.
|
Cemex’s Consolidated 2023 Full Year and 4th Quarter Financial and
Operational Highlights.
| |
• |
|
Net Sales increased 8%, to US$17,416 million in 2023, and 5% to US$4,243 million in the
4th quarter. |
| |
• |
|
EBITDA increased 20%, to US$3,347 million in 2023, and 13%, to US$743 million in the 4th quarter. |
| |
• |
|
EBITDA margin increased 2.0pp in 2023, to 19.2%, and by 1.2 pp, to 17.5% in the 4th quarter.
|
| |
• |
|
Free Cash Flow after Maintenance Capital Expenditures was US$1,208 million in 2023, and US$511 million
in 4th quarter. |
| |
• |
|
For the full year, EBITDA from Cemex’s Urbanization Solutions business increased by 27%.
|
| |
• |
|
Continued execution of Cemex’s decarbonization roadmap, with a 4% YoY CO2 reduction in 2023 and 13% since 2020. |
| |
• |
|
Controlling interest net income after adjusting for a previously disclosed adverse tax judgement in Spain of
US$613 million in 4th quarter, was US$63 million lower YoY for the full year, and was US$271 million higher YoY for the fourth quarter. |
1
Geographical Markets 2023 Full Year and 4th Quarter
Highlights.
| |
• |
|
Net Sales in Mexico increased 16% in 2023, to US$5,088 million, and 17% in 4th quarter, to US$1,333 million. EBITDA increased 15% in 2023, to US$1,488 million, and increased 13% in 4th quarter, to
US$346 million. |
| |
• |
|
Cemex’s operations in the United States reported Net Sales of US$5,338 million in 2023, an increase of
6%, and US$1,269 million in 4th quarter, an increase of 4%. EBITDA increased 37% in 2023, to US$1,040 million, and increased 18% to US$239 million in the 4th quarter.
|
| |
• |
|
In the Europe, Middle East, Africa and Asia region, Net Sales increased by 5% in 2023, to US$5,059 million,
and decreased 4% in 4th quarter, to US$1,166 million. EBITDA was US$703 million in 2023, 7% higher, and US$129 million for 4th
quarter, a 14% decrease. |
| |
• |
|
Cemex’s operations in the South, Central America, and the Caribbean region, reported Net Sales of
US$1,725 million in 2023, an increase of 8%, and US$425 million in 4th quarter, an increase of 7%. EBITDA increased 5% to US$399 million in 2023 and increased 14% to
US$98 million in the 4th quarter. |
Note: All percentage variations related to Net Sales and EBITDA are on a like-to-like basis for the ongoing operations and for foreign exchange fluctuations compared to the same period of last year. All references to EBITDA mean Operating EBITDA.
| (1) |
Calculated in accordance with Cemex’s bank debt agreements. |
About Cemex
Cemex is a global construction materials
company that is building a better future through sustainable products and solutions. Cemex is committed to achieving carbon neutrality through relentless innovation and industry-leading research and development. Cemex is at the forefront of the
circular economy in the construction value chain and is pioneering ways to increase the use of waste and residues as alternative raw materials and fuels in its operations with the help of new technologies. Cemex offers cement, ready-mix concrete, aggregates, and urbanization solutions in growing markets around the world, powered by a multinational workforce focused on providing a superior customer experience enabled by digital
technologies. For more information, please visit: www.cemex.com
Contact information
Analyst and Investor Relations - Monterrey
Fabián Orta
+52 (81) 8888-4327
ir@cemex.com
Analyst and Investor Relations - New York
Scott Pollak
+1 (212) 317-6011
ir@cemex.com
Media Relations
Jorge Pérez
+52 (81) 8259-6666
jorgeluis.perez@cemex.com
###
2
Except as the context otherwise may require, references in this press release to “Cemex,”
”we,” ”us,” ”our,” refer to Cemex, S.A.B. de C.V. and its consolidated subsidiaries. This press release contains forward-looking statements within the meaning of the U.S. federal securities laws. Cemex intends these
forward-looking statements to be covered by the safe harbor provisions for forward-looking statements in the U.S. federal securities laws. These forward-looking statements reflect Cemex’s current expectations and projections about future events
based on Cemex’s knowledge of present facts and circumstances and assumptions about future events, as well as Cemex’s current plans based on such facts and circumstances, unless otherwise indicated. These statements necessarily involve
risks, uncertainties, and assumptions that could cause actual results to differ materially from Cemex’s expectations, including, among others, risks, uncertainties, and assumptions discussed in Cemex’s most recent annual report and
detailed from time to time in Cemex’s other filings with the U.S. Securities and Exchange Commission and the Mexican Stock Exchange (Bolsa Mexicana de Valores), which factors are incorporated herein by reference, which if materialized could
ultimately lead to Cemex’s expectations and/or expected results not producing the expected benefits and/or results. Forward-looking statements should not be considered guarantees of future performance, nor the results or developments are
indicative of results or developments in subsequent periods. These factors may be revised or supplemented, and the information contained in this press release is subject to change without notice, but Cemex is not under, and expressly disclaims, any
obligation to update or correct this press release or revise any forward-looking statement contained herein, whether as a result of new information, future events or otherwise, or to reflect the occurrence of anticipated or unanticipated events or
circumstances. Any or all of Cemex’s forward-looking statements may turn out to be inaccurate. Accordingly, undue reliance on forward-looking statements should not be placed, as such forward-looking statements speak only as of the dates on
which they are made. The content of this press release is for informational purposes only, and you should not construe any such information or other material as legal, tax, investment, financial, or other advice. All references to prices in this
press release refer to Cemex’s prices for Cemex products and services. There is currently no single globally recognized or accepted, consistent, and comparable set of definitions or standards (legal, regulatory, or otherwise) of, nor widespread
cross-market consensus i) as to what constitutes, a ‘green’, ‘social,’ or ‘sustainable’ or having equivalent-labelled activity, product, or asset; or ii) as to what precise attributes are required for a particular
activity, product, or asset to be defined as ‘green’, ‘social,’ or ‘sustainable’ or such other equivalent label; or iii) as to climate and sustainable funding and financing activities and their classification and
reporting. Therefore, there is little certainty, and no assurance or representation is given that such activities and/or reporting of those activities will meet any present or future expectations or requirements for describing or classifying funding
and financing activities as ‘green’, ‘social’, or ‘sustainable’ or attributing similar labels. We expect policies, regulatory requirements, standards, and definitions to be developed and continuously evolve over time.
3
Exhibit 2
Fourth Quarter Results 2023
Oum Wellness Center,
San Pedro Garza García, Mexico
Built with Resilia and Pervia concrete, part of our Vertua family of sustainable products
Stock Listing Information
NYSE (ADS)
Ticker: CX
Mexican Stock Exchange (CPO)
Ticker: CEMEX.CPO
Ratio of CEMEXCPO to CX = 10:1
Investor Relations
In the United States:
+ 1 877 7CX NYSE
In Mexico:
+ 52 (81) 8888 4292
E-Mail: ir@cemex.com
|
|
|
| Operating and financial highlights |
|

|
|
|
|
|
|
|
|
|
|
|
|
|
|
|
|
|
|
|
|
|
|
|
|
|
|
|
|
|
|
|
|
|
|
| |
|
|
|
|
January - December |
|
|
|
|
|
Fourth Quarter |
|
| |
|
|
|
|
|
|
|
|
|
|
l-t-l |
|
|
|
|
|
|
|
|
|
|
|
l-t-l |
|
| |
|
2023 |
|
|
2022 |
|
|
% var |
|
|
% var |
|
|
2023 |
|
|
2022 |
|
|
% var |
|
|
% var |
|
| Consolidated volumes |
|
|
|
|
|
|
|
|
|
|
|
|
|
|
|
|
|
|
|
|
|
|
|
|
|
|
|
|
|
|
|
|
| Domestic gray cement |
|
|
51,665 |
|
|
|
55,134 |
|
|
|
(6 |
%) |
|
|
|
|
|
|
12,584 |
|
|
|
13,288 |
|
|
|
(5 |
%) |
|
|
|
|
| Ready-mix |
|
|
47,093 |
|
|
|
50,026 |
|
|
|
(6 |
%) |
|
|
|
|
|
|
10,803 |
|
|
|
12,043 |
|
|
|
(10 |
%) |
|
|
|
|
| Aggregates |
|
|
138,839 |
|
|
|
139,210 |
|
|
|
(0 |
%) |
|
|
|
|
|
|
33,699 |
|
|
|
33,654 |
|
|
|
0 |
% |
|
|
|
|
|
|
|
|
|
|
|
|
|
|
|
|
|
|
|
|
|
|
|
|
|
|
|
|
|
|
|
|
|
|
|
|
|
| Net sales |
|
|
17,416 |
|
|
|
15,577 |
|
|
|
12 |
% |
|
|
8 |
% |
|
|
4,243 |
|
|
|
3,869 |
|
|
|
10 |
% |
|
|
5 |
% |
| Gross profit |
|
|
5,861 |
|
|
|
4,822 |
|
|
|
22 |
% |
|
|
16 |
% |
|
|
1,432 |
|
|
|
1,208 |
|
|
|
19 |
% |
|
|
12 |
% |
| as % of net sales |
|
|
33.7 |
% |
|
|
31.0 |
% |
|
|
2.7pp |
|
|
|
|
|
|
|
33.7 |
% |
|
|
31.2 |
% |
|
|
2.5pp |
|
|
|
|
|
| Operating earnings before other income and expenses, net |
|
|
2,114 |
|
|
|
1,561 |
|
|
|
35 |
% |
|
|
29 |
% |
|
|
432 |
|
|
|
361 |
|
|
|
20 |
% |
|
|
14 |
% |
| as % of net sales |
|
|
12.1 |
% |
|
|
10.0 |
% |
|
|
2.1pp |
|
|
|
|
|
|
|
10.2 |
% |
|
|
9.3 |
% |
|
|
0.9pp |
|
|
|
|
|
| SG&A expenses as % of net sales |
|
|
9.1 |
% |
|
|
8.0 |
% |
|
|
1.1pp |
|
|
|
|
|
|
|
10.6 |
% |
|
|
8.5 |
% |
|
|
2.1pp |
|
|
|
|
|
| Controlling interest net income (loss) |
|
|
182 |
|
|
|
858 |
|
|
|
(79 |
%) |
|
|
|
|
|
|
(441 |
) |
|
|
(99 |
) |
|
|
(345 |
%) |
|
|
|
|
| Operating EBITDA |
|
|
3,347 |
|
|
|
2,681 |
|
|
|
25 |
% |
|
|
20 |
% |
|
|
743 |
|
|
|
630 |
|
|
|
18 |
% |
|
|
13 |
% |
| as % of net sales |
|
|
19.2 |
% |
|
|
17.2 |
% |
|
|
2.0pp |
|
|
|
|
|
|
|
17.5 |
% |
|
|
16.3 |
% |
|
|
1.2pp |
|
|
|
|
|
|
|
|
|
|
|
|
|
|
|
|
|
|
|
|
|
|
|
|
|
|
|
|
|
|
|
|
|
|
|
|
|
|
| Free cash flow after maintenance capital expenditures |
|
|
1,208 |
|
|
|
553 |
|
|
|
118 |
% |
|
|
|
|
|
|
511 |
|
|
|
391 |
|
|
|
31 |
% |
|
|
|
|
| Free cash flow |
|
|
788 |
|
|
|
78 |
|
|
|
909 |
% |
|
|
|
|
|
|
403 |
|
|
|
201 |
|
|
|
101 |
% |
|
|
|
|
|
|
|
|
|
|
|
|
|
|
|
|
|
|
|
|
|
|
|
|
|
|
|
|
|
|
|
|
|
|
|
|
|
| Total debt |
|
|
7,486 |
|
|
|
8,147 |
|
|
|
(8 |
%) |
|
|
|
|
|
|
7,486 |
|
|
|
8,147 |
|
|
|
(8 |
%) |
|
|
|
|
| Earnings (loss) of continuing operations per ADS |
|
|
0.12 |
|
|
|
0.36 |
|
|
|
(66 |
%) |
|
|
|
|
|
|
(0.30 |
) |
|
|
(0.12 |
) |
|
|
(160 |
%) |
|
|
|
|
| Fully diluted earnings (loss) of continuing operations per ADS |
|
|
0.12 |
|
|
|
0.36 |
|
|
|
(66 |
%) |
|
|
|
|
|
|
(0.30 |
) |
|
|
(0.12 |
) |
|
|
(160 |
%) |
|
|
|
|
| Average ADSs outstanding (1) |
|
|
1,471 |
|
|
|
1,478 |
|
|
|
(1 |
%) |
|
|
|
|
|
|
1,471 |
|
|
|
1,475 |
|
|
|
(0 |
%) |
|
|
|
|
| Employees |
|
|
46,063 |
|
|
|
43,535 |
|
|
|
6 |
% |
|
|
|
|
|
|
46,063 |
|
|
|
43,535 |
|
|
|
6 |
% |
|
|
|
|
| (1) |
For purposes of this report, Average ADSs outstanding equals the total number of Series A shares and Series B
shares outstanding as if they were all held in ADS form. Please see “Equity-related information” below in this report. The calculation of Average ADSs outstanding also includes the restricted CPOs allocated to eligible employees as
variable compensation. |
This information does not include discontinued operations. Please see page 14 of this report for
additional information. Cement and aggregates volumes in thousands of metric tons. Ready-mix volumes in thousands of cubic meters. In millions of U.S. dollars, except volumes, percentages, employees, and per-ADS amounts. Average ADSs outstanding are presented in millions. Please refer to page 13 for end-of quarter CPO-equivalent units
outstanding.
Consolidated net sales in 2023 reached US$17.4 billion, an increase of 8% on a like-to-like basis, while increasing 5% in fourth quarter, compared to the fourth quarter of 2022. Our higher prices in local currency terms in all regions drove our top line
growth.
Cost of sales, as a percentage of Net Sales, decreased by 2.7pp to 66.3% in 2023, and was 2.5pp lower in the fourth quarter versus the
same period last year, mainly driven by pricing of our products, easing cost headwinds, and operational efficiencies. This was the fifth consecutive quarter of year-over-year decrease in cost of sales as a percentage of Net Sales.
Operating expenses, as a percentage of Net Sales, increased by 0.6pp in 2023 to 21.5%, and was 1.7pp higher during the fourth quarter of 2023 compared
with the same period last year.
Operating EBITDA in 2023 grew 20% on a
like-to-like basis, reaching a record US$3.35 billion, with growth in all four regions, while increasing 13% in the fourth quarter. Operating EBITDA outperformance
reflects not only strong pricing of our products and decelerating input cost inflation, but also the success of our growth investment strategy, as well as continued growth in our Urbanization Solutions business.
Operating EBITDA margin increased by 2.0pp from 17.2% to 19.2% in 2023 and was 1.2pp higher in fourth
quarter. The expansion reflects the pricing strategy execution for our products, as well as easing cost inflation and operational efficiencies, with full year margin exceeding our goal of recovering 2021 levels, after adjusting for volume and
product mix.
Controlling interest net income (loss) resulted in an income of US$182 million in 2023 and a loss of US$441 million in the
fourth quarter. Despite better operating performance, net income for the year was lower due to a provision for a tax fine created in fourth quarter related to a tax matter in Spain. In addition, in 2022 we recorded a gain from the sale of our
operations in Costa Rica and El Salvador, and Neoris.
|
|
|
| 2023 Fourth Quarter Results |
|
Page 2 |
|
|
|
| Operating results |
|
|
Mexico
|
|
|
|
|
|
|
|
|
|
|
|
|
|
|
|
|
|
|
|
|
|
|
|
|
|
|
|
|
|
|
|
|
| |
|
January - December |
|
|
Fourth Quarter |
|
| |
|
2023 |
|
|
2022 |
|
|
% var |
|
|
l-t-l
% var |
|
|
2023 |
|
|
2022 |
|
|
% var |
|
|
l-t-l
% var |
|
| Net sales |
|
|
5,088 |
|
|
|
3,842 |
|
|
|
32 |
% |
|
|
16 |
% |
|
|
1,333 |
|
|
|
1,016 |
|
|
|
31 |
% |
|
|
17 |
% |
| Operating EBITDA |
|
|
1,488 |
|
|
|
1,133 |
|
|
|
31 |
% |
|
|
15 |
% |
|
|
346 |
|
|
|
271 |
|
|
|
28 |
% |
|
|
13 |
% |
| Operating EBITDA margin |
|
|
29.3 |
% |
|
|
29.5 |
% |
|
|
(0.2pp |
) |
|
|
|
|
|
|
26.0 |
% |
|
|
26.7 |
% |
|
|
(0.7pp |
) |
|
|
|
|
In millions of U.S. dollars, except percentages.
|
|
|
|
|
|
|
|
|
|
|
|
|
|
|
|
|
|
|
|
|
|
|
|
|
| |
|
Domestic gray cement |
|
|
Ready-mix |
|
|
Aggregates |
|
Year-over-year percentage
variation |
|
January - December |
|
|
Fourth Quarter |
|
|
January - December |
|
|
Fourth Quarter |
|
|
January - December |
|
|
Fourth Quarter |
|
| Volume |
|
|
3 |
% |
|
|
4 |
% |
|
|
7 |
% |
|
|
1 |
% |
|
|
9 |
% |
|
|
4 |
% |
| Price (USD) |
|
|
27 |
% |
|
|
21 |
% |
|
|
42 |
% |
|
|
37 |
% |
|
|
41 |
% |
|
|
44 |
% |
| Price (local currency) |
|
|
11 |
% |
|
|
8 |
% |
|
|
25 |
% |
|
|
22 |
% |
|
|
23 |
% |
|
|
29 |
% |
Our Mexican operations delivered strong results in 2023, with both Sales and EBITDA growing in the mid
teen percentage area, supported by strong volumes and pricing of our products. Operating EBITDA margin slightly decreased in the year mainly due to an unfavorable product mix effect and higher transportation costs.
The recovery in cement volumes in 2023 was driven by the formal sector, with bulk cement more than offsetting the decline in bagged, while
ready mix and aggregate volumes grew high single-digit. Importantly, we have seen a pickup in bagged cement demand in the back half of the year which we believe bodes well for 2024.
United States
|
|
|
|
|
|
|
|
|
|
|
|
|
|
|
|
|
|
|
|
|
|
|
|
|
|
|
|
|
|
|
|
|
| |
|
January - December |
|
|
Fourth Quarter |
|
| |
|
2023 |
|
|
2022 |
|
|
% var |
|
|
l-t-l
% var |
|
|
2023 |
|
|
2022 |
|
|
% var |
|
|
l-t-l
% var |
|
| Net sales |
|
|
5,338 |
|
|
|
5,038 |
|
|
|
6 |
% |
|
|
6 |
% |
|
|
1,269 |
|
|
|
1,221 |
|
|
|
4 |
% |
|
|
4 |
% |
| Operating EBITDA |
|
|
1,040 |
|
|
|
762 |
|
|
|
37 |
% |
|
|
37 |
% |
|
|
239 |
|
|
|
202 |
|
|
|
18 |
% |
|
|
18 |
% |
| Operating EBITDA margin |
|
|
19.5 |
% |
|
|
15.1 |
% |
|
|
4.4pp |
|
|
|
|
|
|
|
18.8 |
% |
|
|
16.5 |
% |
|
|
2.3pp |
|
|
|
|
|
In millions of U.S. dollars, except percentages.
|
|
|
|
|
|
|
|
|
|
|
|
|
|
|
|
|
|
|
|
|
|
|
|
|
| |
|
Domestic gray cement |
|
|
Ready-mix |
|
|
Aggregates |
|
Year-over-year percentage
variation |
|
January - December |
|
|
Fourth Quarter |
|
|
January - December |
|
|
Fourth Quarter |
|
|
January - December |
|
|
Fourth Quarter |
|
| Volume |
|
|
(13 |
%) |
|
|
(13 |
%) |
|
|
(10 |
%) |
|
|
(11 |
%) |
|
|
1 |
% |
|
|
11 |
% |
| Price (USD) |
|
|
14 |
% |
|
|
10 |
% |
|
|
19 |
% |
|
|
14 |
% |
|
|
12 |
% |
|
|
(0 |
%) |
| Price (local currency) |
|
|
14 |
% |
|
|
10 |
% |
|
|
19 |
% |
|
|
14 |
% |
|
|
12 |
% |
|
|
(0 |
%) |
The United States posted record full year Operating EBITDA of over US$1 billion in 2023, an
important milestone for the business. Operating EBITDA grew 37% year-over-year due to the pricing strategy for our products, growth investments, and decelerating costs. The material Operating EBITDA margin recovery of 4.4pp reflects our success in
recovering multi-year cost inflation through pricing as well as easing inflation headwinds.
Prices in 2023 for our three core products
rose between 12% and 19%.
Volume decline in the US in 2023 largely reflects bad weather, lower residential and commercial demand,
completion of some large industrial projects, as well as some market share loss due to our pricing strategy for our products. In response to the slowdown in demand, we were once again able to reduce our lower margin cement imports to support
profitability.
|
|
|
| 2023 Fourth Quarter Results |
|
Page 3 |
|
|
|
| Operating results |
|
|
Europe, Middle East, Africa and Asia
|
|
|
|
|
|
|
|
|
|
|
|
|
|
|
|
|
|
|
|
|
|
|
|
|
|
|
|
|
|
|
|
|
| |
|
January - December |
|
|
Fourth Quarter |
|
| |
|
2023 |
|
|
2022 |
|
|
% var |
|
|
l-t-l
% var |
|
|
2023 |
|
|
2022 |
|
|
% var |
|
|
l-t-l
% var |
|
| Net sales |
|
|
5,059 |
|
|
|
4,930 |
|
|
|
3 |
% |
|
|
5 |
% |
|
|
1,166 |
|
|
|
1,199 |
|
|
|
(3 |
%) |
|
|
(4 |
%) |
| Operating EBITDA |
|
|
703 |
|
|
|
670 |
|
|
|
5 |
% |
|
|
7 |
% |
|
|
129 |
|
|
|
146 |
|
|
|
(11 |
%) |
|
|
(14 |
%) |
| Operating EBITDA margin |
|
|
13.9 |
% |
|
|
13.6 |
% |
|
|
0.3pp |
|
|
|
|
|
|
|
11.1 |
% |
|
|
12.2 |
% |
|
|
(1.1pp |
) |
|
|
|
|
In millions of U.S. dollars, except percentages.
|
|
|
|
|
|
|
|
|
|
|
|
|
|
|
|
|
|
|
|
|
|
|
|
|
| |
|
Domestic gray cement |
|
|
Ready-mix |
|
|
Aggregates |
|
Year-over-year percentage
variation |
|
January - December |
|
|
Fourth Quarter |
|
|
January - December |
|
|
Fourth Quarter |
|
|
January - December |
|
|
Fourth Quarter |
|
| Volume |
|
|
(10 |
%) |
|
|
(9 |
%) |
|
|
(8 |
%) |
|
|
(16 |
%) |
|
|
(5 |
%) |
|
|
(11 |
%) |
| Price (USD) |
|
|
15 |
% |
|
|
11 |
% |
|
|
10 |
% |
|
|
9 |
% |
|
|
8 |
% |
|
|
8 |
% |
| Price (local currency) (*) |
|
|
18 |
% |
|
|
9 |
% |
|
|
12 |
% |
|
|
7 |
% |
|
|
8 |
% |
|
|
5 |
% |
EMEA delivered solid full year results despite a challenging demand environment. The operating EBITDA growth and margin
expansion experienced in the first nine months of the year was interrupted in the fourth quarter, with a slowdown in construction activity in the region, as well as major maintenance in the Philippines. Despite the slowdown, full year EBITDA rose
7%, while EBITDA margin expanded by 0.3 percentage points.
Europe posted record full year Operating EBITDA, growing more than 20%, and margin
expansion of 2pp. These achievements are attributable to the success of our “One Europe” strategy implemented in 2019 which consolidated and integrated our footprint in the region, accelerated our Climate Action efforts, while
rationalizing costs and pursuing bolt-on growth investments in integrated urban micro markets.
In Asia, Middle
East and Africa, adverse competitive dynamics in the Philippines, as well as an overall slowdown of construction activity, negatively impacted the region throughout the year.
| (*) |
Calculated on a volume-weighted-average basis at constant foreign-exchange rates. |
South, Central America and the Caribbean
|
|
|
|
|
|
|
|
|
|
|
|
|
|
|
|
|
|
|
|
|
|
|
|
|
|
|
|
|
|
|
|
|
| |
|
January - December |
|
|
Fourth Quarter |
|
| |
|
2023 |
|
|
2022 |
|
|
% var |
|
|
l-t-l
% var |
|
|
2023 |
|
|
2022 |
|
|
% var |
|
|
l-t-l
% var |
|
| Net sales |
|
|
1,725 |
|
|
|
1,605 |
|
|
|
7 |
% |
|
|
8 |
% |
|
|
425 |
|
|
|
377 |
|
|
|
13 |
% |
|
|
7 |
% |
| Operating EBITDA |
|
|
399 |
|
|
|
382 |
|
|
|
4 |
% |
|
|
5 |
% |
|
|
98 |
|
|
|
84 |
|
|
|
16 |
% |
|
|
14 |
% |
| Operating EBITDA margin |
|
|
23.2 |
% |
|
|
23.8 |
% |
|
|
(0.6pp |
) |
|
|
|
|
|
|
23.1 |
% |
|
|
22.4 |
% |
|
|
0.7pp |
|
|
|
|
|
In millions of U.S. dollars, except percentages.
|
|
|
|
|
|
|
|
|
|
|
|
|
|
|
|
|
|
|
|
|
|
|
|
|
| |
|
Domestic gray cement |
|
|
Ready-mix |
|
|
Aggregates |
|
Year-over-year
percentage variation |
|
January - December |
|
|
Fourth Quarter |
|
|
January - December |
|
|
Fourth Quarter |
|
|
January - December |
|
|
Fourth Quarter |
|
| Volume |
|
|
(3 |
%) |
|
|
(2 |
%) |
|
|
(0 |
%) |
|
|
(1 |
%) |
|
|
8 |
% |
|
|
7 |
% |
| Price (USD) |
|
|
8 |
% |
|
|
12 |
% |
|
|
21 |
% |
|
|
36 |
% |
|
|
14 |
% |
|
|
23 |
% |
| Price (local currency) (*) |
|
|
9 |
% |
|
|
7 |
% |
|
|
20 |
% |
|
|
19 |
% |
|
|
14 |
% |
|
|
7 |
% |
|
|
|
| 2023 Fourth Quarter Results |
|
Page 4 |
|
|
|
| Operating results |
|
|
In South, Central America and Caribbean, after a challenging 2022 where the pricing for our products
struggled to keep up with cost inflation, Sales and Operating EBITDA rebounded in 2023.
Pricing of our products drove top line growth, with cement prices
increasing 9%, but still not sufficient to cover input cost inflation. While bagged cement demand remains under pressure, bulk volumes continue to grow, supported by infrastructure projects such as the Bogotá Metro, the 4th Bridge over the Canal in Panamá and tourism related projects in the Dominican Republic.
| (*) |
Calculated on a volume-weighted-average basis at constant foreign-exchange rates. |
|
|
|
| 2023 Fourth Quarter Results |
|
Page 5 |
|
|
|
| Operating results |
|
|
Operating EBITDA and free cash flow
|
|
|
|
|
|
|
|
|
|
|
|
|
|
|
|
|
|
|
|
|
|
|
|
|
| |
|
January - December |
|
|
Fourth Quarter |
|
| |
|
2023 |
|
|
2022 |
|
|
% var |
|
|
2023 |
|
|
2022 |
|
|
% var |
|
| Operating earnings before other income and expenses, net |
|
|
2,114 |
|
|
|
1,561 |
|
|
|
35 |
% |
|
|
432 |
|
|
|
361 |
|
|
|
20 |
% |
| + Depreciation and operating amortization |
|
|
1,233 |
|
|
|
1,120 |
|
|
|
|
|
|
|
311 |
|
|
|
270 |
|
|
|
|
|
|
|
|
|
|
|
|
|
|
|
|
|
|
|
|
|
|
|
|
|
|
|
|
|
|
| Operating EBITDA |
|
|
3,347 |
|
|
|
2,681 |
|
|
|
25 |
% |
|
|
743 |
|
|
|
630 |
|
|
|
18 |
% |
| - Net financial expense |
|
|
574 |
|
|
|
529 |
|
|
|
|
|
|
|
145 |
|
|
|
132 |
|
|
|
|
|
| - Maintenance capital expenditures |
|
|
996 |
|
|
|
888 |
|
|
|
|
|
|
|
399 |
|
|
|
301 |
|
|
|
|
|
| - Change in working capital |
|
|
1 |
|
|
|
515 |
|
|
|
|
|
|
|
(405 |
) |
|
|
(307 |
) |
|
|
|
|
| - Taxes paid |
|
|
550 |
|
|
|
197 |
|
|
|
|
|
|
|
56 |
|
|
|
41 |
|
|
|
|
|
| - Other cash items (net) |
|
|
17 |
|
|
|
6 |
|
|
|
|
|
|
|
36 |
|
|
|
74 |
|
|
|
|
|
| - Free cash flow discontinued operations |
|
|
— |
|
|
|
(6 |
) |
|
|
|
|
|
|
— |
|
|
|
(3 |
) |
|
|
|
|
|
|
|
|
|
|
|
|
|
|
|
|
|
|
|
|
|
|
|
|
|
|
|
|
|
| Free cash flow after maintenance capital expenditures |
|
|
1,208 |
|
|
|
553 |
|
|
|
118 |
% |
|
|
511 |
|
|
|
391 |
|
|
|
31 |
% |
| - Strategic capital expenditures |
|
|
420 |
|
|
|
475 |
|
|
|
|
|
|
|
108 |
|
|
|
191 |
|
|
|
|
|
|
|
|
|
|
|
|
|
|
|
|
|
|
|
|
|
|
|
|
|
|
|
|
|
|
| Free cash flow |
|
|
788 |
|
|
|
78 |
|
|
|
909 |
% |
|
|
403 |
|
|
|
201 |
|
|
|
101 |
% |
|
|
|
|
|
|
|
|
|
|
|
|
|
|
|
|
|
|
|
|
|
|
|
|
|
|
| In millions of U.S. dollars, except percentages. |
Higher Operating EBITDA and a lower investment in working capital, partially offset by higher taxes, resulted
in free cash flow after maintenance capex of US$1,208 million in 2023, a 6-year high, and US$655 million higher than last year.
The increase in cash taxes is a consequence of stronger results, as well as the tax effect of foreign exchange on our U.S. dollar denominated
debt.
During 2023 we had no incremental investment in working capital despite higher sales and continued inflationary and supply chain
pressures. This is the consequence of a management initiative undertaken in 2nd quarter to optimize working capital. This focus on working capital to maximize free cash flow generation is expected
to continue into 2024.
During the year, the main uses of Free cash flow include the acquisition of the assets of Atlantic Minerals Limited
in Canada, the investment in a new Construction, Demolition, and Excavation Waste (CDEW) recycling center in EMEA, outflows from our derivative instruments primarily related to FX, coupons of our subordinated notes with no fixed maturity, and
repurchases of shares in CLH and CHP.
Information on debt
|
|
|
|
|
|
|
|
|
|
|
|
|
|
|
|
|
|
|
|
|
|
|
|
|
|
|
| |
|
Fourth Quarter |
|
|
|
|
|
Third
Quarter |
|
|
|
|
Fourth Quarter |
|
| |
|
2023 |
|
|
2022 |
|
|
% var |
|
|
2023 |
|
|
|
|
2023 |
|
|
2022 |
|
| Total debt (1) |
|
|
7,486 |
|
|
|
8,147 |
|
|
|
(8 |
%) |
|
|
7,492 |
|
|
Currency denomination |
|
|
|
|
|
|
|
|
| Short-term |
|
|
3 |
% |
|
|
4 |
% |
|
|
|
|
|
|
4 |
% |
|
U.S. dollar |
|
|
74 |
% |
|
|
78 |
% |
| Long-term |
|
|
97 |
% |
|
|
96 |
% |
|
|
|
|
|
|
96 |
% |
|
Euro |
|
|
16 |
% |
|
|
14 |
% |
| Cash and cash equivalents |
|
|
624 |
|
|
|
495 |
|
|
|
26 |
% |
|
|
533 |
|
|
Mexican peso |
|
|
5 |
% |
|
|
4 |
% |
|
|
|
|
|
|
|
|
|
|
|
|
|
|
|
|
|
|
|
|
|
|
|
|
|
|
|
| Net debt |
|
|
6,862 |
|
|
|
7,652 |
|
|
|
(10 |
%) |
|
|
6,960 |
|
|
Other |
|
|
5 |
% |
|
|
4 |
% |
|
|
|
|
|
|
|
|
|
|
|
|
|
|
|
|
|
|
|
|
|
|
|
|
|
|
|
| Consolidated net debt (2) |
|
|
6,888 |
|
|
|
7,620 |
|
|
|
|
|
|
|
6,982 |
|
|
Interest rate (3) |
|
|
|
|
|
|
|
|
| Consolidated leverage ratio (2) |
|
|
2.06 |
|
|
|
2.84 |
|
|
|
|
|
|
|
2.16 |
|
|
Fixed |
|
|
70 |
% |
|
|
71 |
% |
| Consolidated coverage ratio (2) |
|
|
7.91 |
|
|
|
6.27 |
|
|
|
|
|
|
|
7.62 |
|
|
Variable |
|
|
30 |
% |
|
|
29 |
% |
|
|
|
|
|
|
|
|
|
|
|
|
|
|
|
|
|
|
|
|
|
|
|
|
|
|
|
In millions of U.S. dollars, except percentages and ratios.
| (1) |
Includes leases, in accordance with International Financial Reporting Standards (IFRS). |
| (2) |
Calculated in accordance with our contractual obligations under our main bank debt agreements.
|
| (3) |
Includes the effect of our interest rate derivatives, as applicable. |
On October 30th, 2023, we closed the refinancing of our sustainability-linked syndicated
bank facility, which consists of a US$1 billion term loan and US$2 billion committed revolving credit facility. Additionally, in early October we issued $6 billion pesos, the equivalent of approximately US$ 350 million, in
peso-denominated sustainability-linked long-term notes (certificados bursátiles de largo plazo) in Mexico. Finally, on December 6th, 2023, we closed the refinancing of our
sustainability-linked bilateral loan agreement for $6 billion pesos – the equivalent of approximately US$350 million.
|
|
|
| 2023 Fourth Quarter Results |
|
Page 6 |
|
|
|
| Operating results |
|
|
Consolidated Statement of Operations & Statement of Financial Position
Cemex, S.A.B. de C.V. and Subsidiaries
(Thousands of
U.S. dollars, except per ADS amounts)
|
|
|
|
|
|
|
|
|
|
|
|
|
|
|
|
|
|
|
|
|
|
|
|
|
|
|
|
|
|
|
|
|
| |
|
January - December |
|
|
Fourth Quarter |
|
| |
|
|
|
|
|
|
|
|
|
|
like-to-like |
|
|
|
|
|
|
|
|
|
|
|
like-to-like |
|
| STATEMENT OF OPERATIONS |
|
2023 |
|
|
2022 |
|
|
% var |
|
|
% var |
|
|
2023 |
|
|
2022 |
|
|
% var |
|
|
% var |
|
| Net sales |
|
|
17,415,624 |
|
|
|
15,576,819 |
|
|
|
12 |
% |
|
|
8 |
% |
|
|
4,243,201 |
|
|
|
3,868,517 |
|
|
|
10 |
% |
|
|
5 |
% |
| Cost of sales |
|
|
(11,554,540 |
) |
|
|
(10,754,908 |
) |
|
|
(7 |
%) |
|
|
|
|
|
|
(2,811,609 |
) |
|
|
(2,660,572 |
) |
|
|
(6 |
%) |
|
|
|
|
|
|
|
|
|
|
|
|
|
|
|
|
|
|
|
|
|
|
|
|
|
|
|
|
|
|
|
|
|
|
|
|
|
| Gross profit |
|
|
5,861,083 |
|
|
|
4,821,911 |
|
|
|
22 |
% |
|
|
16 |
% |
|
|
1,431,592 |
|
|
|
1,207,945 |
|
|
|
19 |
% |
|
|
12 |
% |
| Operating expenses |
|
|
(3,747,513 |
) |
|
|
(3,261,376 |
) |
|
|
(15 |
%) |
|
|
|
|
|
|
(999,519 |
) |
|
|
(847,045 |
) |
|
|
(18 |
%) |
|
|
|
|
|
|
|
|
|
|
|
|
|
|
|
|
|
|
|
|
|
|
|
|
|
|
|
|
|
|
|
|
|
|
|
|
|
| Operating earnings before other income and expenses, net |
|
|
2,113,570 |
|
|
|
1,560,535 |
|
|
|
35 |
% |
|
|
29 |
% |
|
|
432,073 |
|
|
|
360,901 |
|
|
|
20 |
% |
|
|
14 |
% |
| Other expenses, net |
|
|
(264,574 |
) |
|
|
(467,275 |
) |
|
|
43 |
% |
|
|
|
|
|
|
(138,722 |
) |
|
|
(460,997 |
) |
|
|
70 |
% |
|
|
|
|
|
|
|
|
|
|
|
|
|
|
|
|
|
|
|
|
|
|
|
|
|
|
|
|
|
|
|
|
|
|
|
|
|
| Operating earnings |
|
|
1,848,996 |
|
|
|
1,093,260 |
|
|
|
69 |
% |
|
|
|
|
|
|
293,350 |
|
|
|
(100,097 |
) |
|
|
N/A |
|
|
|
|
|
| Financial expense |
|
|
(530,612 |
) |
|
|
(505,843 |
) |
|
|
(5 |
%) |
|
|
|
|
|
|
(131,583 |
) |
|
|
(128,195 |
) |
|
|
(3 |
%) |
|
|
|
|
| Other financial income (expense), net |
|
|
32,888 |
|
|
|
151,674 |
|
|
|
(78 |
%) |
|
|
|
|
|
|
57,806 |
|
|
|
107,733 |
|
|
|
(46 |
%) |
|
|
|
|
| Financial income |
|
|
40,171 |
|
|
|
26,697 |
|
|
|
50 |
% |
|
|
|
|
|
|
12,770 |
|
|
|
14,302 |
|
|
|
(11 |
%) |
|
|
|
|
| Results from financial instruments, net |
|
|
(58,337 |
) |
|
|
109,264 |
|
|
|
N/A |
|
|
|
|
|
|
|
(5,780 |
) |
|
|
(4,562 |
) |
|
|
(27 |
%) |
|
|
|
|
| Foreign exchange results |
|
|
143,991 |
|
|
|
72,899 |
|
|
|
98 |
% |
|
|
|
|
|
|
76,493 |
|
|
|
110,774 |
|
|
|
(31 |
%) |
|
|
|
|
| Effects of net present value on assets and liabilities and others, net |
|
|
(92,937 |
) |
|
|
(57,186 |
) |
|
|
(63 |
%) |
|
|
|
|
|
|
(25,678 |
) |
|
|
(12,782 |
) |
|
|
(101 |
%) |
|
|
|
|
| Equity in gain (loss) of associates |
|
|
97,629 |
|
|
|
30,900 |
|
|
|
216 |
% |
|
|
|
|
|
|
31,483 |
|
|
|
(15,432 |
) |
|
|
N/A |
|
|
|
|
|
|
|
|
|
|
|
|
|
|
|
|
|
|
|
|
|
|
|
|
|
|
|
|
|
|
|
|
|
|
|
|
|
|
| Income (loss) before income tax |
|
|
1,448,901 |
|
|
|
769,991 |
|
|
|
88 |
% |
|
|
|
|
|
|
251,056 |
|
|
|
(135,991 |
) |
|
|
N/A |
|
|
|
|
|
| Income tax |
|
|
(1,250,303 |
) |
|
|
(209,065 |
) |
|
|
(498 |
%) |
|
|
|
|
|
|
(693,305 |
) |
|
|
(37,992 |
) |
|
|
(1725 |
%) |
|
|
|
|
|
|
|
|
|
|
|
|
|
|
|
|
|
|
|
|
|
|
|
|
|
|
|
|
|
|
|
|
|
|
|
|
|
| Profit (loss) of continuing operations |
|
|
198,598 |
|
|
|
560,926 |
|
|
|
(65 |
%) |
|
|
|
|
|
|
(442,249 |
) |
|
|
(173,983 |
) |
|
|
(154 |
%) |
|
|
|
|
| Discontinued operations |
|
|
— |
|
|
|
323,605 |
|
|
|
(100 |
%) |
|
|
|
|
|
|
— |
|
|
|
71,478 |
|
|
|
(100 |
%) |
|
|
|
|
|
|
|
|
|
|
|
|
|
|
|
|
|
|
|
|
|
|
|
|
|
|
|
|
|
|
|
|
|
|
|
|
|
| Consolidated net income (loss) |
|
|
198,598 |
|
|
|
884,530 |
|
|
|
(78 |
%) |
|
|
|
|
|
|
(442,249 |
) |
|
|
(102,504 |
) |
|
|
(331 |
%) |
|
|
|
|
| Non-controlling interest net income (loss) |
|
|
16,435 |
|
|
|
26,173 |
|
|
|
(37 |
%) |
|
|
|
|
|
|
(1,249 |
) |
|
|
(3,364 |
) |
|
|
63 |
% |
|
|
|
|
|
|
|
|
|
|
|
|
|
|
|
|
|
|
|
|
|
|
|
|
|
|
|
|
|
|
|
|
|
|
|
|
|
| Controlling interest net income (loss) |
|
|
182,163 |
|
|
|
858,357 |
|
|
|
(79 |
%) |
|
|
|
|
|
|
(441,000 |
) |
|
|
(99,140 |
) |
|
|
(345 |
%) |
|
|
|
|
|
|
|
|
|
|
|
|
|
|
|
|
|
|
|
|
|
|
|
|
|
|
|
|
|
|
|
|
|
|
|
|
|
| Operating EBITDA |
|
|
3,347,038 |
|
|
|
2,680,630 |
|
|
|
25 |
% |
|
|
20 |
% |
|
|
743,107 |
|
|
|
630,463 |
|
|
|
18 |
% |
|
|
13 |
% |
| Earnings (loss) of continued operations per ADS |
|
|
0.12 |
|
|
|
0.36 |
|
|
|
(66 |
%) |
|
|
|
|
|
|
(0.30 |
) |
|
|
(0.12 |
) |
|
|
(160 |
%) |
|
|
|
|
| Earnings (loss) of discontinued operations per ADS |
|
|
— |
|
|
|
0.22 |
|
|
|
(100 |
%) |
|
|
|
|
|
|
— |
|
|
|
0.05 |
|
|
|
(100 |
%) |
|
|
|
|
|
|
|
|
|
|
|
|
|
|
|
|
|
|
|
|
|
|
|
|
|
|
|
|
|
|
|
|
|
|
|
|
|
|
|
|
|
|
|
|
|
|
|
|
|
|
| |
|
As of December 31 |
|
| STATEMENT OF FINANCIAL POSITION |
|
2023 |
|
|
2022 |
|
|
% var |
|
| Total assets |
|
|
28,433,399 |
|
|
|
26,447,451 |
|
|
|
8 |
% |
| Cash and cash equivalents |
|
|
623,933 |
|
|
|
494,920 |
|
|
|
26 |
% |
| Trade receivables less allowance for doubtful accounts |
|
|
1,751,468 |
|
|
|
1,644,491 |
|
|
|
7 |
% |
| Other accounts receivable |
|
|
649,674 |
|
|
|
535,065 |
|
|
|
21 |
% |
| Inventories, net |
|
|
1,789,303 |
|
|
|
1,668,658 |
|
|
|
7 |
% |
| Assets held for sale |
|
|
48,825 |
|
|
|
68,926 |
|
|
|
(29 |
%) |
| Other current assets |
|
|
142,197 |
|
|
|
113,664 |
|
|
|
25 |
% |
| Current assets |
|
|
5,005,400 |
|
|
|
4,525,723 |
|
|
|
11 |
% |
| Property, machinery and equipment, net |
|
|
12,465,655 |
|
|
|
11,284,126 |
|
|
|
10 |
% |
| Other assets |
|
|
10,962,343 |
|
|
|
10,637,602 |
|
|
|
3 |
% |
|
|
|
|
|
|
|
|
|
|
|
|
|
| Total liabilities |
|
|
16,290,314 |
|
|
|
15,538,582 |
|
|
|
5 |
% |
| Current liabilities |
|
|
6,785,733 |
|
|
|
5,546,947 |
|
|
|
22 |
% |
| Long-term liabilities |
|
|
6,202,961 |
|
|
|
6,919,512 |
|
|
|
(10 |
%) |
| Other liabilities |
|
|
3,301,621 |
|
|
|
3,072,124 |
|
|
|
7 |
% |
|
|
|
|
|
|
|
|
|
|
|
|
|
| Total stockholder’s equity |
|
|
12,143,084 |
|
|
|
10,908,869 |
|
|
|
11 |
% |
| Common stock and additional paid-in capital |
|
|
7,686,469 |
|
|
|
7,810,104 |
|
|
|
(2 |
%) |
| Other equity reserves |
|
|
(2,036,270 |
) |
|
|
(2,463,631 |
) |
|
|
17 |
% |
| Subordinated notes |
|
|
1,771,427 |
|
|
|
908,942 |
|
|
|
95 |
% |
| Retained earnings |
|
|
4,370,228 |
|
|
|
4,245,780 |
|
|
|
3 |
% |
| Non-controlling interest |
|
|
351,231 |
|
|
|
407,674 |
|
|
|
(14 |
%) |
|
|
|
|
|
|
|
|
|
|
|
|
|
|
|
|
| 2023 Fourth Quarter Results |
|
Page 7 |
|
|
|
| Operating results |
|
|
Operating Summary per Country
In thousands of U.S. dollars
|
|
|
|
|
|
|
|
|
|
|
|
|
|
|
|
|
|
|
|
|
|
|
|
|
|
|
|
|
|
|
|
|
| |
|
January - December |
|
|
Fourth Quarter |
|
| |
|
|
|
|
|
|
|
|
|
|
like-to-like |
|
|
|
|
|
|
|
|
|
|
|
like-to-like |
|
| NET SALES |
|
2023 |
|
|
2022 |
|
|
% var |
|
|
% var |
|
|
2023 |
|
|
2022 |
|
|
% var |
|
|
% var |
|
| Mexico |
|
|
5,088,356 |
|
|
|
3,842,407 |
|
|
|
32 |
% |
|
|
16 |
% |
|
|
1,333,267 |
|
|
|
1,016,496 |
|
|
|
31 |
% |
|
|
17 |
% |
| U.S.A. |
|
|
5,337,668 |
|
|
|
5,037,534 |
|
|
|
6 |
% |
|
|
6 |
% |
|
|
1,268,722 |
|
|
|
1,221,007 |
|
|
|
4 |
% |
|
|
4 |
% |
| Europe, Middle East, Asia and Africa |
|
|
5,059,473 |
|
|
|
4,929,607 |
|
|
|
3 |
% |
|
|
5 |
% |
|
|
1,165,643 |
|
|
|
1,198,768 |
|
|
|
(3 |
%) |
|
|
(4 |
%) |
| Europe |
|
|
3,653,975 |
|
|
|
3,389,313 |
|
|
|
8 |
% |
|
|
4 |
% |
|
|
848,724 |
|
|
|
819,660 |
|
|
|
4 |
% |
|
|
(3 |
%) |
| Asia, Middle East and Africa (1) |
|
|
1,405,497 |
|
|
|
1,540,294 |
|
|
|
(9 |
%) |
|
|
4 |
% |
|
|
316,919 |
|
|
|
379,108 |
|
|
|
(16 |
%) |
|
|
(9 |
%) |
| South, Central America and the Caribbean |
|
|
1,724,876 |
|
|
|
1,604,708 |
|
|
|
7 |
% |
|
|
8 |
% |
|
|
424,574 |
|
|
|
377,276 |
|
|
|
13 |
% |
|
|
7 |
% |
| Others and intercompany eliminations |
|
|
205,252 |
|
|
|
162,562 |
|
|
|
26 |
% |
|
|
26 |
% |
|
|
50,996 |
|
|
|
54,971 |
|
|
|
(7 |
%) |
|
|
(7 |
%) |
|
|
|
|
|
|
|
|
|
|
|
|
|
|
|
|
|
|
|
|
|
|
|
|
|
|
|
|
|
|
|
|
|
| TOTAL |
|
|
17,415,624 |
|
|
|
15,576,819 |
|
|
|
12 |
% |
|
|
8 |
% |
|
|
4,243,201 |
|
|
|
3,868,517 |
|
|
|
10 |
% |
|
|
5 |
% |
|
|
|
|
|
|
|
|
|
|
|
|
|
|
|
|
|
|
|
|
|
|
|
|
|
|
|
|
|
|
|
|
|
| GROSS PROFIT |
|
|
|
|
|
|
|
|
|
|
|
|
|
|
|
|
|
|
|
|
|
|
|
|
|
|
|
|
|
|
|
|
| Mexico |
|
|
2,414,888 |
|
|
|
1,772,121 |
|
|
|
36 |
% |
|
|
20 |
% |
|
|
617,674 |
|
|
|
463,346 |
|
|
|
33 |
% |
|
|
19 |
% |
| U.S.A. |
|
|
1,556,661 |
|
|
|
1,284,903 |
|
|
|
21 |
% |
|
|
21 |
% |
|
|
377,856 |
|
|
|
355,822 |
|
|
|
6 |
% |
|
|
6 |
% |
| Europe, Middle East, Asia and Africa |
|
|
1,227,671 |
|
|
|
1,205,406 |
|
|
|
2 |
% |
|
|
3 |
% |
|
|
263,277 |
|
|
|
277,049 |
|
|
|
(5 |
%) |
|
|
(8 |
%) |
| Europe |
|
|
956,424 |
|
|
|
864,581 |
|
|
|
11 |
% |
|
|
7 |
% |
|
|
214,099 |
|
|
|
210,505 |
|
|
|
2 |
% |
|
|
(5 |
%) |
| Asia, Middle East and Africa |
|
|
271,246 |
|
|
|
340,825 |
|
|
|
(20 |
%) |
|
|
(7 |
%) |
|
|
49,178 |
|
|
|
66,544 |
|
|
|
(26 |
%) |
|
|
(18 |
%) |
| South, Central America and the Caribbean |
|
|
584,718 |
|
|
|
553,761 |
|
|
|
6 |
% |
|
|
6 |
% |
|
|
146,024 |
|
|
|
126,949 |
|
|
|
15 |
% |
|
|
11 |
% |
| Others and intercompany eliminations |
|
|
77,146 |
|
|
|
5,719 |
|
|
|
1249 |
% |
|
|
1249 |
% |
|
|
26,762 |
|
|
|
(15,220 |
) |
|
|
N/A |
|
|
|
N/A |
|
|
|
|
|
|
|
|
|
|
|
|
|
|
|
|
|
|
|
|
|
|
|
|
|
|
|
|
|
|
|
|
|
|
| TOTAL |
|
|
5,861,083 |
|
|
|
4,821,911 |
|
|
|
22 |
% |
|
|
16 |
% |
|
|
1,431,592 |
|
|
|
1,207,945 |
|
|
|
19 |
% |
|
|
12 |
% |
|
|
|
|
|
|
|
|
|
|
|
|
|
|
|
|
|
|
|
|
|
|
|
|
|
|
|
|
|
|
|
|
|
| OPERATING EARNINGS BEFORE OTHER EXPENSES, NET |
|
|
|
|
|
|
|
|
|
|
|
|
|
| Mexico |
|
|
1,267,027 |
|
|
|
960,589 |
|
|
|
32 |
% |
|
|
15 |
% |
|
|
288,904 |
|
|
|
224,840 |
|
|
|
28 |
% |
|
|
13 |
% |
| U.S.A. |
|
|
557,080 |
|
|
|
306,590 |
|
|
|
82 |
% |
|
|
82 |
% |
|
|
118,171 |
|
|
|
105,278 |
|
|
|
12 |
% |
|
|
12 |
% |
| Europe, Middle East, Asia and Africa |
|
|
375,134 |
|
|
|
343,777 |
|
|
|
9 |
% |
|
|
12 |
% |
|
|
48,091 |
|
|
|
62,106 |
|
|
|
(23 |
%) |
|
|
(25 |
%) |
| Europe |
|
|
288,430 |
|
|
|
206,989 |
|
|
|
39 |
% |
|
|
33 |
% |
|
|
44,700 |
|
|
|
46,167 |
|
|
|
(3 |
%) |
|
|
(11 |
%) |
| Asia, Middle East and Africa |
|
|
86,704 |
|
|
|
136,788 |
|
|
|
(37 |
%) |
|
|
(19 |
%) |
|
|
3,391 |
|
|
|
15,939 |
|
|
|
(79 |
%) |
|
|
(63 |
%) |
| South, Central America and the Caribbean |
|
|
315,210 |
|
|
|
304,321 |
|
|
|
4 |
% |
|
|
4 |
% |
|
|
77,455 |
|
|
|
67,567 |
|
|
|
15 |
% |
|
|
13 |
% |
| Others and intercompany eliminations |
|
|
(400,881 |
) |
|
|
(354,742 |
) |
|
|
(13 |
%) |
|
|
1 |
% |
|
|
(100,549 |
) |
|
|
(98,890 |
) |
|
|
(2 |
%) |
|
|
14 |
% |
|
|
|
|
|
|
|
|
|
|
|
|
|
|
|
|
|
|
|
|
|
|
|
|
|
|
|
|
|
|
|
|
|
| TOTAL |
|
|
2,113,570 |
|
|
|
1,560,535 |
|
|
|
35 |
% |
|
|
29 |
% |
|
|
432,073 |
|
|
|
360,901 |
|
|
|
20 |
% |
|
|
14 |
% |
|
|
|
|
|
|
|
|
|
|
|
|
|
|
|
|
|
|
|
|
|
|
|
|
|
|
|
|
|
|
|
|
|
|
|
|
| 2023 Fourth Quarter Results |
|
Page 8 |
|
|
|
| Operating results |
|
|
Operating Summary per Country
Operating EBITDA in thousands of U.S. dollars. Operating EBITDA margin as a percentage of Net sales.
|
|
|
|
|
|
|
|
|
|
|
|
|
|
|
|
|
|
|
|
|
|
|
|
|
|
|
|
|
|
|
|
|
| |
|
January - December |
|
|
Fourth Quarter |
|
|
|
|
| |
|
|
|
|
|
|
|
|
|
|
like-to-like |
|
|
|
|
|
|
|
|
|
|
|
like-to-like |
|
| OPERATING EBITDA |
|
2023 |
|
|
2022 |
|
|
% var |
|
|
% var |
|
|
2023 |
|
|
2022 |
|
|
% var |
|
|
% var |
|
| Mexico |
|
|
1,488,365 |
|
|
|
1,132,631 |
|
|
|
31 |
% |
|
|
15 |
% |
|
|
346,119 |
|
|
|
271,022 |
|
|
|
28 |
% |
|
|
13 |
% |
| U.S.A. |
|
|
1,040,094 |
|
|
|
761,585 |
|
|
|
37 |
% |
|
|
37 |
% |
|
|
238,726 |
|
|
|
201,808 |
|
|
|
18 |
% |
|
|
18 |
% |
| Europe, Middle East, Asia and Africa |
|
|
702,501 |
|
|
|
669,687 |
|
|
|
5 |
% |
|
|
7 |
% |
|
|
129,471 |
|
|
|
145,817 |
|
|
|
(11 |
%) |
|
|
(14 |
%) |
| Europe |
|
|
533,648 |
|
|
|
424,674 |
|
|
|
26 |
% |
|
|
21 |
% |
|
|
105,115 |
|
|
|
103,930 |
|
|
|
1 |
% |
|
|
(6 |
%) |
| Asia, Middle East and Africa (1) |
|
|
168,853 |
|
|
|
245,013 |
|
|
|
(31 |
%) |
|
|
(17 |
%) |
|
|
24,356 |
|
|
|
41,887 |
|
|
|
(42 |
%) |
|
|
(33 |
%) |
| South, Central America and the Caribbean |
|
|
399,435 |
|
|
|
382,329 |
|
|
|
4 |
% |
|
|
5 |
% |
|
|
98,287 |
|
|
|
84,461 |
|
|
|
16 |
% |
|
|
14 |
% |
| Others and intercompany eliminations |
|
|
(283,356 |
) |
|
|
(265,602 |
) |
|
|
(7 |
%) |
|
|
13 |
% |
|
|
(69,496 |
) |
|
|
(72,645 |
) |
|
|
4 |
% |
|
|
26 |
% |
|
|
|
|
|
|
|
|
|
|
|
|
|
|
|
|
|
|
|
|
|
|
|
|
|
|
|
|
|
|
|
|
|
| TOTAL |
|
|
3,347,038 |
|
|
|
2,680,630 |
|
|
|
25 |
% |
|
|
20 |
% |
|
|
743,107 |
|
|
|
630,463 |
|
|
|
18 |
% |
|
|
13 |
% |
|
|
|
|
|
|
|
|
|
|
|
|
|
|
|
|
|
|
|
|
|
|
|
|
|
|
|
|
|
|
|
|
|
| OPERATING EBITDA MARGIN |
|
|
|
|
|
|
|
|
|
|
|
|
|
|
|
|
|
|
|
|
|
|
|
|
|
|
|
|
|
|
|
|
| Mexico |
|
|
29.3 |
% |
|
|
29.5 |
% |
|
|
|
|
|
|
|
|
|
|
26.0 |
% |
|
|
26.7 |
% |
|
|
|
|
|
|
|
|
| U.S.A. |
|
|
19.5 |
% |
|
|
15.1 |
% |
|
|
|
|
|
|
|
|
|
|
18.8 |
% |
|
|
16.5 |
% |
|
|
|
|
|
|
|
|
| Europe, Middle East, Asia and Africa |
|
|
13.9 |
% |
|
|
13.6 |
% |
|
|
|
|
|
|
|
|
|
|
11.1 |
% |
|
|
12.2 |
% |
|
|
|
|
|
|
|
|
| Europe |
|
|
14.6 |
% |
|
|
12.5 |
% |
|
|
|
|
|
|
|
|
|
|
12.4 |
% |
|
|
12.7 |
% |
|
|
|
|
|
|
|
|
| Asia, Middle East and Africa |
|
|
12.0 |
% |
|
|
15.9 |
% |
|
|
|
|
|
|
|
|
|
|
7.7 |
% |
|
|
11.0 |
% |
|
|
|
|
|
|
|
|
| South, Central America and the Caribbean |
|
|
23.2 |
% |
|
|
23.8 |
% |
|
|
|
|
|
|
|
|
|
|
23.1 |
% |
|
|
22.4 |
% |
|
|
|
|
|
|
|
|
|
|
|
|
|
|
|
|
|
|
|
|
|
|
|
|
|
|
|
|
|
|
|
|
|
|
|
|
|
|
|
|
|
| TOTAL |
|
|
19.2 |
% |
|
|
17.2 |
% |
|
|
|
|
|
|
|
|
|
|
17.5 |
% |
|
|
16.3 |
% |
|
|
|
|
|
|
|
|
|
|
|
|
|
|
|
|
|
|
|
|
|
|
|
|
|
|
|
|
|
|
|
|
|
|
|
|
|
|
|
|
|
| (1) |
In the Philippines, Net Sales (in thousands of dollars) for the fourth quarter 2023 were US$68,688 and for the
period January to December 2023 were US$311,805. Operating EBITDA (in thousands of dollars) for the fourth quarter 2023 was US$(166) and for the period January to December 2023 was US$34,014. |
|
|
|
| 2023 Fourth Quarter Results |
|
Page 9 |
|
|
|
| Operating results |
|
|
Volume Summary
Cement and aggregates: Thousands of metric tons.
Ready-mix: Thousands of cubic meters.
|
|
|
|
|
|
|
|
|
|
|
|
|
|
|
|
|
|
|
|
|
|
|
|
|
| |
|
January - December |
|
|
|
|
|
Fourth Quarter |
|
|
|
|
| |
|
2023 |
|
|
2022 |
|
|
% var |
|
|
2023 |
|
|
2022 |
|
|
% var |
|
| Consolidated cement volume (1) |
|
|
59,618 |
|
|
|
63,376 |
|
|
|
(6 |
%) |
|
|
14,226 |
|
|
|
15,569 |
|
|
|
(9 |
%) |
| Consolidated ready-mix volume |
|
|
47,093 |
|
|
|
50,026 |
|
|
|
(6 |
%) |
|
|
10,803 |
|
|
|
12,043 |
|
|
|
(10 |
%) |
| Consolidated aggregates volume (2) |
|
|
138,839 |
|
|
|
139,210 |
|
|
|
(0 |
%) |
|
|
33,699 |
|
|
|
33,654 |
|
|
|
0 |
% |
Per-country volume summary
|
|
|
|
|
|
|
|
|
|
|
|
|
| |
|
January - December |
|
|
Fourth Quarter |
|
|
Fourth Quarter 2023 |
|
| DOMESTIC GRAY CEMENT VOLUME |
|
2023 vs. 2022 |
|
|
2023 vs. 2022 |
|
|
vs. Third Quarter 2023 |
|
| Mexico |
|
|
3 |
% |
|
|
4 |
% |
|
|
0 |
% |
| U.S.A. |
|
|
(13 |
%) |
|
|
(13 |
%) |
|
|
(11 |
%) |
| Europe, Middle East, Asia and Africa |
|
|
(10 |
%) |
|
|
(9 |
%) |
|
|
(9 |
%) |
| Europe |
|
|
(13 |
%) |
|
|
(14 |
%) |
|
|
(14 |
%) |
| Asia, Middle East and Africa |
|
|
(6 |
%) |
|
|
(3 |
%) |
|
|
(3 |
%) |
| South, Central America and the Caribbean |
|
|
(3 |
%) |
|
|
(2 |
%) |
|
|
(3 |
%) |
| READY-MIX VOLUME |
|
|
|
|
|
|
|
|
|
|
|
|
| Mexico |
|
|
7 |
% |
|
|
1 |
% |
|
|
(7 |
%) |
| U.S.A. |
|
|
(10 |
%) |
|
|
(11 |
%) |
|
|
(13 |
%) |
| Europe, Middle East, Asia and Africa |
|
|
(8 |
%) |
|
|
(16 |
%) |
|
|
(14 |
%) |
| Europe |
|
|
(10 |
%) |
|
|
(10 |
%) |
|
|
(6 |
%) |
| Asia, Middle East and Africa |
|
|
(6 |
%) |
|
|
(25 |
%) |
|
|
(24 |
%) |
| South, Central America and the Caribbean |
|
|
(0 |
%) |
|
|
(1 |
%) |
|
|
(3 |
%) |
| AGGREGATES VOLUME |
|
|
|
|
|
|
|
|
|
|
|
|
| Mexico |
|
|
9 |
% |
|
|
4 |
% |
|
|
(4 |
%) |
| U.S.A. |
|
|
1 |
% |
|
|
11 |
% |
|
|
(4 |
%) |
| Europe, Middle East, Asia and Africa |
|
|
(5 |
%) |
|
|
(11 |
%) |
|
|
(12 |
%) |
| Europe |
|
|
(6 |
%) |
|
|
(11 |
%) |
|
|
(10 |
%) |
| Asia, Middle East and Africa |
|
|
(2 |
%) |
|
|
(13 |
%) |
|
|
(18 |
%) |
| South, Central America and the Caribbean |
|
|
8 |
% |
|
|
7 |
% |
|
|
(2 |
%) |
| (1) |
Consolidated cement volume includes domestic and export volume of gray cement, white cement, special cement,
mortar, and clinker. |
| (2) |
Consolidated aggregates volumes include aggregates from our marine business in the United Kingdom.
|
|
|
|
| 2023 Fourth Quarter Results |
|
Page 10 |
|
|
|
| Operating results |
|
|
Price Summary
Variation in U.S. dollars
|
|
|
|
|
|
|
|
|
|
|
|
|
| |
|
January - December |
|
|
Fourth Quarter |
|
|
Fourth Quarter 2023 vs. |
|
| DOMESTIC GRAY CEMENT PRICE |
|
2023 vs. 2022 |
|
|
2023 vs. 2022 |
|
|
Third Quarter 2023 |
|
| Mexico |
|
|
27 |
% |
|
|
21 |
% |
|
|
(3 |
%) |
| U.S.A. |
|
|
14 |
% |
|
|
10 |
% |
|
|
2 |
% |
| Europe, Middle East, Asia and Africa (*) |
|
|
15 |
% |
|
|
11 |
% |
|
|
(3 |
%) |
| Europe (*) |
|
|
29 |
% |
|
|
23 |
% |
|
|
(1 |
%) |
| Asia, Middle East and Africa (*) |
|
|
(9 |
%) |
|
|
(6 |
%) |
|
|
1 |
% |
| South, Central America and the Caribbean (*) |
|
|
8 |
% |
|
|
12 |
% |
|
|
(1 |
%) |
| READY-MIX PRICE |
|
|
|
|
|
|
|
|
|
|
|
|
| Mexico |
|
|
42 |
% |
|
|
37 |
% |
|
|
(2 |
%) |
| U.S.A. |
|
|
19 |
% |
|
|
14 |
% |
|
|
2 |
% |
| Europe, Middle East, Asia and Africa (*) |
|
|
10 |
% |
|
|
9 |
% |
|
|
1 |
% |
| Europe (*) |
|
|
18 |
% |
|
|
14 |
% |
|
|
1 |
% |
| Asia, Middle East and Africa (*) |
|
|
(2 |
%) |
|
|
(4 |
%) |
|
|
(4 |
%) |
| South, Central America and the Caribbean (*) |
|
|
21 |
% |
|
|
36 |
% |
|
|
2 |
% |
| AGGREGATES PRICE |
|
|
|
|
|
|
|
|
|
|
|
|
| Mexico |
|
|
41 |
% |
|
|
44 |
% |
|
|
1 |
% |
| U.S.A. |
|
|
12 |
% |
|
|
(0 |
%) |
|
|
(0 |
%) |
| Europe, Middle East, Asia and Africa (*) |
|
|
8 |
% |
|
|
8 |
% |
|
|
(2 |
%) |
| Europe (*) |
|
|
11 |
% |
|
|
13 |
% |
|
|
(1 |
%) |
| Asia, Middle East and Africa (*) |
|
|
(5 |
%) |
|
|
(8 |
%) |
|
|
(7 |
%) |
| South, Central America and the Caribbean (*) |
|
|
14 |
% |
|
|
23 |
% |
|
|
(0 |
%) |
| (*) |
Price variation in U.S. dollars calculated on a volume-weighted-average basis; price variation in local
currency calculated on a volume-weighted-average basis at constant foreign-exchange rates. |
|
|
|
| 2023 Fourth Quarter Results |
|
Page 11 |
|
|
|
| Operating results |
|
|
Variation in Local Currency
|
|
|
|
|
|
|
|
|
|
|
|
|
| |
|
January - December |
|
|
Fourth Quarter |
|
|
Fourth Quarter 2023 vs. |
|
| DOMESTIC GRAY CEMENT PRICE |
|
2023 vs. 2022 |
|
|
2023 vs. 2022 |
|
|
Third Quarter 2023 |
|
| Mexico |
|
|
11 |
% |
|
|
8 |
% |
|
|
(0 |
%) |
| U.S.A. |
|
|
14 |
% |
|
|
10 |
% |
|
|
2 |
% |
| Europe, Middle East, Asia and Africa (*) |
|
|
18 |
% |
|
|
9 |
% |
|
|
(3 |
%) |
| Europe (*) |
|
|
24 |
% |
|
|
14 |
% |
|
|
(1 |
%) |
| Asia, Middle East and Africa (*) |
|
|
8 |
% |
|
|
3 |
% |
|
|
1 |
% |
| South, Central America and the Caribbean (*) |
|
|
9 |
% |
|
|
7 |
% |
|
|
(1 |
%) |
| READY-MIX PRICE |
|
|
|
|
|
|
|
|
|
|
|
|
| Mexico |
|
|
25 |
% |
|
|
22 |
% |
|
|
0 |
% |
| U.S.A. |
|
|
19 |
% |
|
|
14 |
% |
|
|
2 |
% |
| Europe, Middle East, Asia and Africa (*) |
|
|
12 |
% |
|
|
7 |
% |
|
|
1 |
% |
| Europe (*) |
|
|
14 |
% |
|
|
7 |
% |
|
|
1 |
% |
| Asia, Middle East and Africa (*) |
|
|
8 |
% |
|
|
3 |
% |
|
|
(4 |
%) |
| South, Central America and the Caribbean (*) |
|
|
20 |
% |
|
|
19 |
% |
|
|
1 |
% |
| AGGREGATES PRICE |
|
|
|
|
|
|
|
|
|
|
|
|
| Mexico |
|
|
23 |
% |
|
|
29 |
% |
|
|
3 |
% |
| U.S.A. |
|
|
12 |
% |
|
|
(0 |
%) |
|
|
(0 |
%) |
| Europe, Middle East, Asia and Africa (*) |
|
|
8 |
% |
|
|
5 |
% |
|
|
(1 |
%) |
| Europe (*) |
|
|
9 |
% |
|
|
6 |
% |
|
|
(0 |
%) |
| Asia, Middle East and Africa (*) |
|
|
5 |
% |
|
|
(1 |
%) |
|
|
(7 |
%) |
| South, Central America and the Caribbean (*) |
|
|
14 |
% |
|
|
7 |
% |
|
|
(1 |
%) |
| (*) |
Price variation in U.S. dollars calculated on a volume-weighted-average basis; price variation in local
currency calculated on a volume-weighted-average basis at constant foreign-exchange rates. |
|
|
|
| 2023 Fourth Quarter Results |
|
Page 12 |
|
|
|
| Other Information |
|
|
Operating expenses
The following table shows the breakdown of operating expenses for the period presented.
|
|
|
|
|
|
|
|
|
|
|
|
|
|
|
|
|
| |
|
January - December |
|
|
Fourth Quarter |
|
| In thousands of US dollars |
|
2023 |
|
|
2022 |
|
|
2023 |
|
|
2022 |
|
| Administrative expenses |
|
|
1,221,542 |
|
|
|
934,252 |
|
|
|
348,416 |
|
|
|
239,023 |
|
| Selling expenses |
|
|
356,804 |
|
|
|
311,545 |
|
|
|
99,791 |
|
|
|
88,478 |
|
| Distribution and logistics expenses |
|
|
1,952,528 |
|
|
|
1,824,315 |
|
|
|
494,558 |
|
|
|
469,737 |
|
|
|
|
|
|
|
|
|
|
|
|
|
|
|
|
|
|
| Operating expenses before depreciation |
|
|
3,530,874 |
|
|
|
3,070,111 |
|
|
|
942,765 |
|
|
|
797,238 |
|
|
|
|
|
|
|
|
|
|
|
|
|
|
|
|
|
|
| Depreciation in operating expenses |
|
|
216,639 |
|
|
|
191,265 |
|
|
|
56,755 |
|
|
|
49,806 |
|
|
|
|
|
|
|
|
|
|
|
|
|
|
|
|
|
|
| Operating expenses |
|
|
3,747,513 |
|
|
|
3,261,376 |
|
|
|
999,519 |
|
|
|
847,045 |
|
|
|
|
|
|
|
|
|
|
|
|
|
|
|
|
|
|
|
|
|
|
|
|
|
|
|
|
|
|
|
|
|
|
|
| As % of Net Sales |
|
| Administrative expenses |
|
|
7.0 |
% |
|
|
6.0 |
% |
|
|
8.2 |
% |
|
|
6.2 |
% |
| SG&A expenses |
|
|
9.1 |
% |
|
|
8.0 |
% |
|
|
10.6 |
% |
|
|
8.5 |
% |
Equity-related information
As of December 31, 2022, based on our latest 20-F annual report, the number of outstanding CPO-equivalents was 14,487,786,971. See Cemex’s reports furnished to or filed with the U.S. Securities and Exchange Commission for information, if any, regarding repurchases of securities and other
developments that may have caused a change in the number of CPO-equivalents outstanding after December 31, 2022. For the twelve-month period ended December 31, 2023, no CPOs were repurchased by
Cemex.
One Cemex ADS represents ten Cemex CPOs. One Cemex CPO represents two Series A shares and one Series B share.
For purposes of this report, outstanding CPO-equivalents equal the total number of Series A and B shares outstanding
as if they were all held in CPO form, less CPOs held by Cemex and its subsidiaries, which as of December 31, 2022, were 20,541,277. Restricted CPOs allocated to eligible employees as variable compensation are not included in the outstanding CPO-equivalents.
Derivative instruments
The following table shows the notional amount for each type of derivative instrument and the aggregate fair market value for all of Cemex’s derivative
instruments as of the last day of each quarter presented.
|
|
|
|
|
|
|
|
|
|
|
|
|
|
|
|
|
|
|
|
|
|
|
|
|
| |
|
Fourth Quarter |
|
|
Third Quarter |
|
| |
|
2023 |
|
|
2022 |
|
|
2023 |
|
| In millions of US dollars |
|
Notional
amount |
|
|
Fair
value |
|
|
Notional
amount |
|
|
Fair
value |
|
|
Notional
amount |
|
|
Fair
value |
|
| Exchange rate derivatives (1) |
|
|
1,276 |
|
|
|
(84 |
) |
|
|
1,337 |
|
|
|
(30 |
) |
|
|
1,358 |
|
|
|
(83 |
) |
| Interest rate swaps (2) |
|
|
1,085 |
|
|
|
53 |
|
|
|
1,018 |
|
|
|
54 |
|
|
|
1,050 |
|
|
|
47 |
|
| Fuel derivatives |
|
|
232 |
|
|
|
5 |
|
|
|
136 |
|
|
|
8 |
|
|
|
138 |
|
|
|
13 |
|
|
|
|
|
|
|
|
|
|
|
|
|
|
|
|
|
|
|
|
|
|
|
|
|
|
|
|
|
2,593 |
|
|
|
(26 |
) |
|
|
2,491 |
|
|
|
32 |
|
|
|
2,546 |
|
|
|
(23 |
) |
|
|
|
|
|
|
|
|
|
|
|
|
|
|
|
|
|
|
|
|
|
|
|
|
|
| 1) |
The exchange rate derivatives are used to manage currency exposures arising from regular operations, net
investment hedge and forecasted transactions. As of December 31, 2023, the derivatives related to net investment hedge represent a notional amount of US$976 million. |
| 2) |
Interest-rate swap derivatives related to bank loans, includes an interest rate and exchange rate swap
derivative with a notional amount of US$335 million. |
Under IFRS, companies are required to recognize the fair value of all
derivative financial instruments on the balance sheet as financial assets or liabilities, with changes in such fair market values recorded in the income statement, except when transactions are entered into for cash-flow-hedging purposes, in such
cases, changes in the fair market value of the related derivative instruments are recognized temporarily in equity and subsequently reclassified into earnings as the effects of the underlying are recognized in the income statement. Moreover, in
transactions related to net investment hedges, changes in fair market value are recorded directly in equity as part of the currency translation effect and are reclassified to the income statement only in the case of a disposal of the net investment.
As of December 31, 2023, in connection with its derivatives portfolio’s fair market value recognition, Cemex recognized a change in mark to market as compared to 3Q23 resulting in a financial liability of US$26 million.
|
|
|
| 2023 Fourth Quarter Results |
|
Page 13 |
|
|
|
| Other Information |
|
|
Discontinued operations
On October 25, 2022, Cemex concluded a partnership with Advent International (“Advent”). As part of the partnership, Advent acquired from Cemex
a 65% stake in Neoris for US$119 million. While surrendering control to Advent, Cemex retained a 34.8% stake and remained a key strategic partner and customer of Neoris. Cemex’s retained 34.8% stake in Neoris is accounted for under the
equity method. Neoris’ results for the period from January 1 to October 25, 2022, are reported in Cemex’s income statement for the year ended December 31, 2022, net of income tax, in the single line item “Discontinued
operations.”
On August 31, 2022, Cemex concluded with affiliates of Cementos Progreso Holdings, S.L. the sale of its operations in Costa Rica
and El Salvador for a total consideration for Cemex of US$325 million. The assets divested consisted of one cement plant, one grinding station, seven ready-mix plants, one aggregates quarry, as well as
one distribution center in Costa Rica and one distribution center in El Salvador. Cemex’s operations of these assets for the period from January 1 to August 31, 2022, are reported in Cemex’s income statements for the year ended
December 31, 2022, net of income tax, in the single line item “Discontinued operations.”
The following table presents condensed combined
information of the income statement for the twelve-month period ended December 31, 2022, for Cemex’s discontinued operations related to Neoris, Costa Rica and El Salvador:
|
|
|
|
|
|
|
|
|
|
|
|
|
|
|
|
|
| STATEMENT OF OPERATIONS |
|
Jan-Dec |
|
|
Fourth Quarter |
|
| (Millions of U.S. dollars) |
|
2023 |
|
|
2022 |
|
|
2023 |
|
|
2022 |
|
| Sales |
|
|
— |
|
|
|
256 |
|
|
|
— |
|
|
|
17 |
|
| Cost of sales, operating expenses, and other expenses, net |
|
|
— |
|
|
|
(233 |
) |
|
|
— |
|
|
|
(13 |
) |
| Interest expense, net, and others |
|
|
— |
|
|
|
— |
|
|
|
— |
|
|
|
(1 |
) |
|
|
|
|
|
|
|
|
|
|
|
|
|
|
|
|
|
| Income (loss) before income
tax |
|
|
— |
|
|
|
23 |
|
|
|
— |
|
|
|
3 |
|
|
|
|
|
|
|
|
|
|
|
|
|
|
|
|
|
|
| Income tax |
|
|
— |
|
|
|
(3 |
) |
|
|
— |
|
|
|
2 |
|
|
|
|
|
|
|
|
|
|
|
|
|
|
|
|
|
|
| Income (loss) from discontinued operations |
|
|
— |
|
|
|
20 |
|
|
|
— |
|
|
|
5 |
|
|
|
|
|
|
|
|
|
|
|
|
|
|
|
|
|
|
| Net gain (loss) on sale |
|
|
— |
|
|
|
304 |
|
|
|
— |
|
|
|
66 |
|
|
|
|
|
|
|
|
|
|
|
|
|
|
|
|
|
|
| Net result from discontinued operations |
|
|
— |
|
|
|
324 |
|
|
|
— |
|
|
|
71 |
|
|
|
|
|
|
|
|
|
|
|
|
|
|
|
|
|
|
Relevant accounting effects included in the reported financial statements
During 2023 and 2022, Cemex recognized non-cash impairment charges in the statements of income for amounts of US$36 and
US$442 million, respectively, within the line-item other expenses, net, of which US$365 million in 2022, refers to impairment of goodwill while US$77 million in 2022, and $36 million in 2023, refer to impairment of property,
machinery and equipment. The impairment losses of goodwill in 2022 refer to Cemex operating segments in the United States for US$273 million and Spain for US$92 million, which reduced the line item of goodwill in the statement of financial
position in 2022. The impairment losses of property, machinery, and equipment in 2023 and 2022 relate mainly to idle assets in several countries.
The
goodwill impairment loss in 2022 was mainly related to the significant increase in the discount rates as compared to 2021 and the resulting significant decrease in the Cemex’s projected cash flows in these operating segments considering the
global high inflationary environment as of that date, which increased the risk-free rates, and the funding cost observed in the industry during the period. These negative effects more than offset the expected improvements in the estimated Operating
EBITDA generation in both of Cemex’s businesses in the United States and Spain. These non-cash impairment losses did not impact Cemex’s liquidity, Operating EBITDA, and cash taxes payable.
Nevertheless, they decreased Cemex’s total assets and equity and generated net losses in the fourth quarter of 2022.
|
|
|
| 2023 Fourth Quarter Results |
|
Page 14 |
|
|
|
| Definitions of terms and disclosures |
|
|
Methodology for translation, consolidation, and presentation of results
Under IFRS, Cemex translates the financial statements of foreign subsidiaries using exchange rates at the reporting date for the balance sheet and the exchange
rates at the end of each month for the income statement.
Breakdown of regions and subregions
The South, Central America and the Caribbean region includes Cemex’s operations in Bahamas, Colombia, the Dominican Republic, Guatemala, Guyana, Haiti,
Jamaica, Trinidad & Tobago, Barbados, Nicaragua, Panama, Peru, and Puerto Rico, as well as trading operations in the Caribbean region.
The EMEA
region includes Europe, Middle East, Asia, and Africa.
Europe subregion includes operations in Spain, Croatia, the Czech Republic, France, Germany,
Poland, and the United Kingdom.
Asia, Middle East, and Africa subregion includes operations in Philippines, United Arab Emirates, Egypt, and Israel.
Definition of terms
Free cash flow equals operating
EBITDA minus net interest expense, maintenance, and strategic capital expenditures, change in working capital, taxes paid, and other cash items (net other expenses less proceeds from the disposal of obsolete and/or substantially depleted operating
fixed assets that are no longer in operation).
l-t-l (like to like) on a like-to-like basis adjusting for currency fluctuations and for investments/divestments when applicable.
Maintenance capital expenditures equal investments incurred for the purpose of ensuring the company’s operational continuity. These include capital
expenditures on projects required to replace obsolete assets or maintain current operational levels, and mandatory capital expenditures, which are projects required to comply with governmental regulations or company policies.
Net debt equals total debt (debt plus financial leases) minus cash and cash equivalents.
Operating EBITDA, or EBITDA equals operating earnings before other income and expenses, net, plus depreciation and amortization.
pp equals percentage points.
Prices all references to pricing
initiatives, price increases or decreases, refer to our prices for our products and services.
SG&A expenses equal selling and administrative expenses
Strategic capital expenditures equal investments incurred with the purpose of increasing the company’s profitability. These include capital
expenditures on projects designed to increase profitability by expanding capacity, and margin improvement capital expenditures, which are projects designed to increase profitability by reducing costs.
Working capital equals operating accounts receivable (including other current assets received as payment in kind) plus historical inventories minus operating
payables.
% var percentage variation
Earnings per ADS
Please refer to page 2 for the number of average ADSs outstanding used for the calculation of earnings per ADS.
According to the IAS 33 Earnings per share, the weighted-average number of common shares outstanding is determined considering the number of days during the
accounting period in which the shares have been outstanding, including shares derived from corporate events that have modified the stockholder’s equity structure during the period, such as increases in the number of shares by a public offering
and the distribution of shares from stock dividends or recapitalizations of retained earnings and the potential diluted shares (Stock options, Restricted Stock Options and Mandatory Convertible Shares). The shares issued because of share dividends,
recapitalizations and potential diluted shares are considered as issued at the beginning of the period.
|
|
|
|
|
|
|
|
|
|
|
|
|
|
|
|
|
|
|
|
|
|
|
|
|
| Exchange rates |
|
January - December |
|
|
Fourth Quarter |
|
|
Fourth Quarter |
|
| |
|
2023
Average |
|
|
2022
Average |
|
|
2023
Average |
|
|
2022
Average |
|
|
2023
End of period |
|
|
2022
End of period |
|
| Mexican peso |
|
|
17.63 |
|
|
|
20.03 |
|
|
|
17.47 |
|
|
|
19.53 |
|
|
|
16.97 |
|
|
|
19.50 |
|
| Euro |
|
|
0.9227 |
|
|
|
0.9522 |
|
|
|
0.9198 |
|
|
|
0.9686 |
|
|
|
0.9059 |
|
|
|
0.9344 |
|
| British pound |
|
|
0.8019 |
|
|
|
0.8139 |
|
|
|
0.7982 |
|
|
|
0.8415 |
|
|
|
0.7852 |
|
|
|
0.8266 |
|
| Amounts provided in units of local currency per U.S. dollar. |
|
|
|
|
|
|
|
|
|
|
|
|
|
|
|
|
|
|
|
|
|
|
|
|
|
|
|
| 2023 Fourth Quarter Results |
|
Page 15 |
|
|
|
| Disclaimer |
|
|
Except as the context otherwise may require, references in this report to “Cemex,” “we,”
“us,” or “our,” refer to Cemex, S.A.B. de C.V. (NYSE: CX) and its consolidated entities. The information included in this report contains forward-looking statements within the meaning of the U.S. federal securities laws. We
intend these forward-looking statements to be covered by the safe harbor provisions for forward-looking statements within the meaning of the U.S. federal securities laws. These forward-looking statements and information are necessarily subject to
risks, uncertainties, and assumptions, including but not limited to statements related to Cemex’s plans, objectives, expectations (financial or otherwise), and typically can be identified by the use of words such as “may,”
“assume,” “might,” “should,” “could,” “continue,” “would,” “can,” “consider,” “anticipate,” “estimate,” “expect,” “envision,”
“plan,” “believe,” “foresee,” “predict,” “potential,” “target,” “strategy,” “intend,” “aimed”, or other similar terms. Although Cemex believes that its
expectations are reasonable, it can give no assurance that these expectations will prove to be correct, and actual results may vary materially from historical results or results anticipated by forward-looking statements due to various factors. These
forward-looking statements reflect, as of the date on which such forward-looking statements are made, or unless otherwise indicated, our current expectations and projections about future events based on our knowledge of present facts and
circumstances and assumptions about future events. These statements necessarily involve risks, uncertainties, and assumptions that could cause actual results to differ materially from historical results or those anticipated in this report. Among
others, such risks, uncertainties, and assumptions that could cause results to differ, or that otherwise could have an impact on us, include those discussed in Cemex’s most recent annual report and those detailed from time to time in
Cemex’s other filings with the Securities and Exchange Commission and the Mexican Stock Exchange (Bolsa Mexicana de Valores), which factors are incorporated herein by reference, including, but not limited to: impact of pandemics,
epidemics or outbreaks of infectious diseases and the response of governments and other third parties, which could adversely affect, among other matters, the ability of our operating facilities to operate at full or any capacity, supply chains,
international operations, availability of liquidity, investor confidence and consumer spending, as well as the availability of, and demand for, our products and services; the cyclical activity of the construction sector; our exposure to other
sectors that impact our and our clients’ businesses, such as, but not limited to, the energy sector; availability of raw materials and related fluctuating prices of raw materials, as well as of goods and services in general, in particular
increases in prices as a result of inflation; volatility in pension plan asset values and liabilities, which may require cash contributions to the pension plans; the impact of environmental cleanup costs and other remedial actions, and other
liabilities relating to existing and/or divested businesses; our ability to secure and permit aggregates reserves in strategically located areas; the timing and amount of federal, state and local funding for infrastructure; changes in the level of
spending for private residential and private nonresidential construction; changes in our effective tax rate; competition in the markets in which we offer our products and services; general political, social, health, economic and business conditions
in the markets in which we operate or that affect our operations and any significant economic, health, political or social developments in those markets, as well as any inherent risks to international operations; the regulatory environment,
including environmental, energy, tax, labor, antitrust, and acquisition-related rules and regulations; our ability to satisfy our obligations under our material debt agreements, the indentures that govern our outstanding notes, and other debt
instruments and financial obligations, including our subordinated notes with no fixed maturity and other financial obligations; the availability of short-term credit lines or working capital facilities, which can assist us in connection with market
cycles; the impact of our below investment grade debt rating on our cost of capital and on the cost of the products and services we purchase; loss of reputation of our brands; our ability to consummate asset sales, fully integrate newly acquired
businesses, achieve cost-savings from our cost-reduction initiatives, implement our pricing initiatives for our products and generally meet our business strategy goals; the increasing reliance on information technology infrastructure for our sales,
invoicing, procurement, financial statements and other processes that can adversely affect our sales and operations in the event that the infrastructure does not work as intended, experiences technical difficulties or is subjected to cyber-attacks;
changes in the economy that affect the demand for consumer goods, consequently affecting demand for our products and services; climate change, in particular reflected in weather conditions, including but not limited to, excessive rain and snow, and
disasters such as earthquakes and floods, that could affect our facilities or the markets in which we offer our products and services or from where we source our raw materials; trade barriers, including tariffs or import taxes and changes in
existing trade policies or changes to, or withdrawals from, free trade agreements, including the United States-Mexico-Canada Agreement; availability and cost of trucks, railcars, barges and ships, as well as their licensed operators and drivers, for
transport of our materials; labor shortages and constraints; terrorist and organized criminal activities, as well as geopolitical events, such as war and armed conflicts, including the current war between Russia and Ukraine and conflicts in the
Middle East; declarations of insolvency or bankruptcy, or becoming subject to similar proceedings; and, natural disasters and other unforeseen events (including global health hazards such as COVID-19). Many
factors could cause Cemex’s expectations, expected results, and/or projections expressed in this report not being reached and/or not producing the expected benefits and/or results, as any such benefits or results are subject to uncertainties,
costs, performance, and rate of implementation of technologies, some of which are yet not proven. Should one or more of these risks or uncertainties materialize, or should underlying assumptions prove incorrect, actual results may vary materially
from historical results, performance, or achievements and/or results, performance or achievements expressly or implicitly anticipated by the forward-looking statements, or otherwise could have an impact on us or our consolidated entities.
Forward-looking statements should not be considered guarantees of future performance, nor the results or developments are indicative of results or developments in subsequent periods. Actual results of Cemex’s operations and the development of
market conditions in which Cemex operates, or other circumstances or assumptions suggested by such statements may differ materially from those described in, or suggested by, the forward-looking statements contained herein. Any or all of Cemex’s
forward-looking statements may turn out to be inaccurate and the factors identified above are not exhaustive. Accordingly, undue reliance on forward-looking statements should not be
|
|
|
| 2023 Fourth Quarter Results |
|
Page 16 |
|
|
|
| Disclaimer |
|
|
placed, as such forward-looking statements speak only as of the dates on which they are made. These factors may be revised or supplemented and the information contained in this report is subject
to change without notice, but Cemex is not under, and expressly disclaims, any obligation to update or correct the information contained in this report or revise any forward-looking statement that it may make from time to time, whether as a result
of new information, future events or otherwise, or to reflect the occurrence of anticipated or unanticipated events or circumstances. Readers should review future reports filed by us with the U.S. Securities and Exchange Commission and the Mexican
Stock Exchange (Bolsa Mexicana de Valores). Market data used in this report not attributed to a specific source are estimates of Cemex and have not been independently verified. Certain financial and statistical information contained in this
report is subject to rounding adjustments. Accordingly, any discrepancies between the totals and the sums of the amounts listed are due to rounding. Also, this report includes statistical data regarding the production, distribution, marketing and
sale of cement, ready-mix concrete, clinker, aggregates, and Urbanization Solutions. Cemex generated some of this data internally, and some was obtained from independent industry publications and reports that
Cemex believes to be reliable sources. Cemex has not independently verified this data nor sought the consent of any organizations to refer to their reports in this report. Cemex acts in strict compliance of antitrust laws and as such, among other
measures, maintains an independent pricing policy that has been independently developed and its core element is to price Cemex’s products and services based upon their quality and characteristics as well as their value to Cemex’s
customers. Cemex does not accept any communications or agreements of any type with competitors regarding the determination of Cemex’s prices for Cemex’s products and services. Unless the context indicates otherwise, all references to
pricing initiatives, price increases or decreases, refer to Cemex’s prices for Cemex’s products.
Additionally, the information contained in
this report contains references to “green,” “social,” “sustainable,” or equivalent-labelled activities, products, assets, or projects. There is currently no single globally recognized or accepted, consistent, and
comparable set of definitions or standards (legal, regulatory, or otherwise) of, nor widespread cross-market consensus i) as to what constitutes, a ‘green’, ‘social,’ or ‘sustainable’ or having equivalent-labelled
activity, product, or asset; or ii) as to what precise attributes are required for a particular activity, product, or asset to be defined as ‘green’, ‘social,’ or ‘sustainable’ or such other equivalent label; or iii) as
to climate and sustainable funding and financing activities and their classification and reporting. Therefore, there is little certainty, and no assurance or representation is given that such activities and/or reporting of those activities will meet
any present or future expectations or requirements for describing or classifying funding and financing activities as ‘green,’ ‘social,’ or ‘sustainable’ or attributing similar labels. We expect policies, regulatory
requirements, standards, and definitions to be developed and continuously evolve over time.
UNLESS OTHERWISE NOTED, ALL FIGURES ARE
PRESENTED IN DOLLARS, BASED ON INTERNATIONAL FINANCIAL REPORTING STANDARDS, AS APPLICABLE
Copyright Cemex, S.A.B. de C.V. and its
subsidiaries
|
|
|
| 2023 Fourth Quarter Results |
|
Page 17 |
Exhibit 3 Fourth Quarter 2023 Results Oum Wellness Center, San Pedro Garza
García, Mexico Built with Resilia and Pervia concrete, part of our Vertua family of sustainable products

Except as the context otherwise may require, references in this
presentation to “Cemex,” “we,” “us,” or “our,” refer to Cemex, S.A.B. de C.V. (NYSE: CX) and its consolidated entities. The information included in this presentation contains forward-looking statements
within the meaning of the U.S. federal securities laws. We intend these forward-looking statements to be covered by the safe harbor provisions for forward-looking statements within the meaning of the U.S. federal securities laws. These
forward-looking statements and information are necessarily subject to risks, uncertainties, and assumptions, including but not limited to statements related to Cemex’s plans, objectives, expectations (financial or otherwise), and typically can
be identified by the use of words such as “may,” “assume,” “might,” “should,” “could,” “continue,” “would,” “can,” “consider,”
“anticipate,” “estimate,” “expect,” “envision,” “plan,” “believe,” “foresee,” “predict,” “potential,” “target,”
“strategy,” “intend,” “aimed” or other similar terms. Although Cemex believes that its expectations are reasonable, it can give no assurance that these expectations will prove to be correct, and actual results may
vary materially from historical results or results anticipated by forward-looking statements due to various factors. These forward-looking statements reflect, as of the date on which such forward-looking statements are made, or unless otherwise
indicated, our current expectations and projections about future events based on our knowledge of present facts and circumstances and assumptions about future events. These statements necessarily involve risks, uncertainties, and assumptions that
could cause actual results to differ materially from historical results or those anticipated in this presentation. Among others, such risks, uncertainties, and assumptions that could cause results to differ, or that otherwise could have an impact on
us, include those discussed in Cemex’s most recent annual report and those detailed from time to time in Cemex’s other filings with the Securities and Exchange Commission and the Mexican Stock Exchange (Bolsa Mexicana de Valores), which
factors are incorporated herein by reference, including, but not limited to: impact of pandemics, epidemics or outbreaks of infectious diseases and the response of governments and other third parties, which could adversely affect, among other
matters, the ability of our operating facilities to operate at full or any capacity, supply chains, international operations, availability of liquidity, investor confidence and consumer spending, as well as the availability of, and demand for, our
products and services; the cyclical activity of the construction sector; our exposure to other sectors that impact our and our clients’ businesses, such as, but not limited to, the energy sector; availability of raw materials and related
fluctuating prices of raw materials, as well as of goods and services in general, in particular increases in prices as a result of inflation; volatility in pension plan asset values and liabilities, which may require cash contributions to the
pension plans; the impact of environmental cleanup costs and other remedial actions, and other liabilities relating to existing and/or divested businesses; our ability to secure and permit aggregates reserves in strategically located areas; the
timing and amount of federal, state and local funding for infrastructure; changes in the level of spending for private residential and private nonresidential construction; changes in our effective tax rate; competition in the markets in which we
offer our products and services; general political, social, health, economic and business conditions in the markets in which we operate or that affect our operations and any significant economic, health, political or social developments in those
markets, as well as any inherent risks to international operations; the regulatory environment, including environmental, energy, tax, labor, antitrust, and acquisition-related rules and regulations; our ability to satisfy our obligations under our
material debt agreements, the indentures that govern our outstanding notes, and other debt instruments and financial obligations, including our subordinated notes with no fixed maturity and other financial obligations; the availability of short-term
credit lines or working capital facilities, which can assist us in connection with market cycles; the impact of our below investment grade debt rating on our cost of capital and on the cost of the products and services we purchase; loss of
reputation of our brands; our ability to consummate asset sales, fully integrate newly acquired businesses, achieve cost-savings from our cost-reduction initiatives, implement our pricing initiatives for our products and generally meet our business
strategy goals; the increasing reliance on information technology infrastructure for our sales, invoicing, procurement, financial statements and other processes that can adversely affect our sales and operations in the event that the infrastructure
does not work as intended, experiences technical difficulties or is subjected to cyber-attacks; changes in the economy that affect demand for consumer goods, consequently affecting the demand for our products and services; climate change, in
particular reflected in weather conditions, including but not limited to, excessive rain and snow, and disasters such as earthquakes and floods, that could affect our facilities or the markets in which we offer our products and services or from
where we source our raw materials; trade barriers, including tariffs or import taxes and changes in existing trade policies or changes to, or withdrawals from, free trade agreements, including the United States-Mexico-Canada Agreement; availability
and cost of trucks, railcars, barges, and ships, as well as their licensed operators and drivers, for transport of our materials; labor shortages and constraints; terrorist and organized criminal activities, as well as geopolitical events, such as
war and armed conflicts, including the current war between Russia and Ukraine and conflicts in the Middle East; declarations of insolvency or bankruptcy, or becoming subject to similar proceedings; and, natural disasters and other unforeseen events
(including global health hazards such as COVID-19). Many factors could cause Cemex’s expectations, expected results, and/or projections expressed in this presentation not being reached and/or not producing the expected benefits and/or results,
as any such benefits or results are subject to uncertainties, costs, performance, and rate of implementation of technologies, some of which are yet not proven. Should one or more of these risks or uncertainties materialize, or should underlying
assumptions prove incorrect, actual results may vary materially from historical results, performance, or achievements and/or results, performance or achievements expressly or implicitly anticipated by the forward-looking statements, or otherwise
could have an impact on us or our consolidated entities. Forward-looking statements should not be considered guarantees of future performance, nor the results or developments are indicative of results or developments in subsequent periods. Actual
results of Cemex’s operations and the development of market conditions in which Cemex operates, or other circumstances or assumptions suggested by such statements may differ materially from those described in, or suggested by, the
forward-looking statements contained herein. Any or all of Cemex’s forward-looking statements may turn out to be inaccurate and the factors identified above are not exhaustive. Accordingly, undue reliance on forward-looking statements should
not be placed, as such forward-looking statements speak only as of the dates on which they are made. These factors may be revised or supplemented and the information contained in this presentation is subject to change without notice, but Cemex is
not under, and expressly disclaims, any obligation to update or correct the information contained in this presentation or revise any forward-looking statement that it may make from time to time, whether as a result of new information, future events
or otherwise, or to reflect the occurrence of anticipated or unanticipated events or circumstances. Readers should review future reports filed by us with the U.S. Securities and Exchange Commission and the Mexican Stock Exchange (Bolsa Mexicana de
Valores). Market data used in this presentation not attributed to a specific source are estimates of Cemex and have not been independently verified. Certain financial and statistical information contained in this presentation is subject to rounding
adjustments. Accordingly, any discrepancies between the totals and the sums of the amounts listed are due to rounding. Also, this presentation includes statistical data regarding the production, distribution, marketing and sale of cement, ready-mix
concrete, clinker, aggregates, and Urbanization Solutions. Cemex generated some of this data internally, and some was obtained from independent industry publications and reports that Cemex believes to be reliable sources. Cemex has not independently
verified this data nor sought the consent of any organizations to refer to their reports in this presentation. Cemex acts in strict compliance of antitrust laws and as such, among other measures, maintains an independent pricing policy that has been
independently developed and its core element is to price Cemex’s products and services based upon their quality and characteristics as well as their value to Cemex’s customers. Cemex does not accept any communications or agreements of
any type with competitors regarding the determination of Cemex’s prices for Cemex’s products and services. Unless the context indicates otherwise, all references to pricing initiatives, price increases or decreases, refer to
Cemex’s prices for Cemex’s products. Additionally, the information contained in this presentation contains references to “green,” “social,” “sustainable,” or equivalent-labelled activities, products,
assets, or projects. There is currently no single globally recognized or accepted, consistent, and comparable set of definitions or standards (legal, regulatory, or otherwise) of, nor widespread cross-market consensus i) as to what constitutes, a
‘green’, ‘social,’ or ‘sustainable’ or having equivalent-labelled activity, product, or asset; or ii) as to what precise attributes are required for a particular activity, product, or asset to be defined as
‘green’, ‘social,’ or ‘sustainable’ or such other equivalent label; or iii) as to climate and sustainable funding and financing activities and their classification and reporting. Therefore, there is little
certainty, and no assurance or representation is given that such activities and/or reporting of those activities will meet any present or future expectations or requirements for describing or classifying funding and financing activities as
‘green,’ ‘social,’ or ‘sustainable’ or attributing similar labels. We expect policies, regulatory requirements, standards, and definitions to be developed and continuously evolve over time. UNLESS OTHERWISE NOTED,
ALL FIGURES ARE PRESENTED IN DOLLARS, BASED ON INTERNATIONAL FINANCIAL REPORTING STANDARDS, AS APPLICABLE Copyright Cemex, S.A.B. de C.V. and its subsidiaries

Key highlights in 2023 • Record EBITDA of ~$3.35 B, up 20% •
EBITDA margin expansion of 2 pp, achieving goal of recovering 2021 margin • Recent deceleration in input cost inflation • Growth investments contributing 13% of incremental EBITDA • Urbanization Solution’s EBITDA increasing
close to 30%, with 1.4 pp margin expansion 1 • FCF of ~$1.2 B, a 6-year high, driven by EBITDA and lower working capital investment 2 • Leverage ratio at 2.06x, within Investment Grade parameters 3 • Continued improvement in ROCE ,
reaching 13.7% • Achieved all-time high Net Promoter Score of 73, a benchmark for our industry • Continued execution of decarbonization roadmap, with record three-year reduction of 13% in CO emissions 2 • Recognized by CDP with
elite ‘A’ score for climate disclosure 1) Free cash Flow after maintenance capex 2) Calculated in accordance with our bank debt agreements 3 S61 expressway - Augustów bypass - 3) Return over Capital Employed. Trailing twelve months
as of December 2023, excluding goodwill state border, Warsaw, Poland
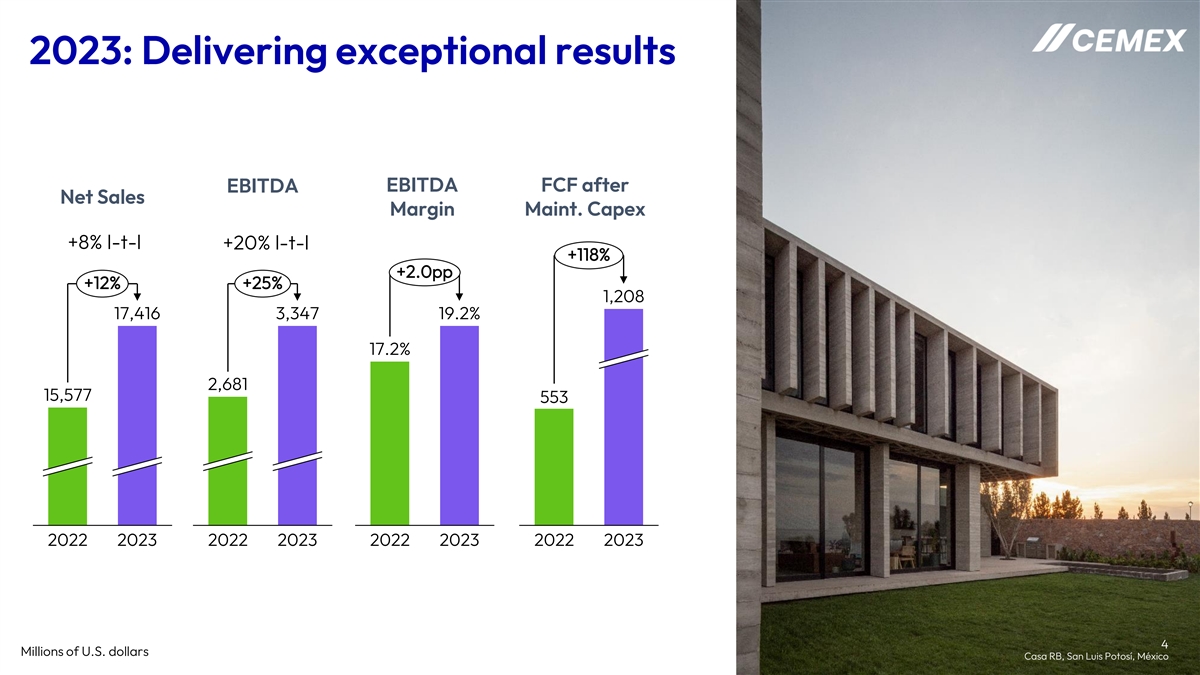
2023: Delivering exceptional results EBITDA EBITDA FCF after Net Sales
Margin Maint. Capex +8% l-t-l +20% l-t-l +118% +2.0pp +12% +25% 1,208 17,416 3,347 19.2% 17.2% 2,681 15,577 553 2022 2023 2022 2023 2022 2023 2022 2023 4 Millions of U.S. dollars Casa RB, San Luis Potosí, México
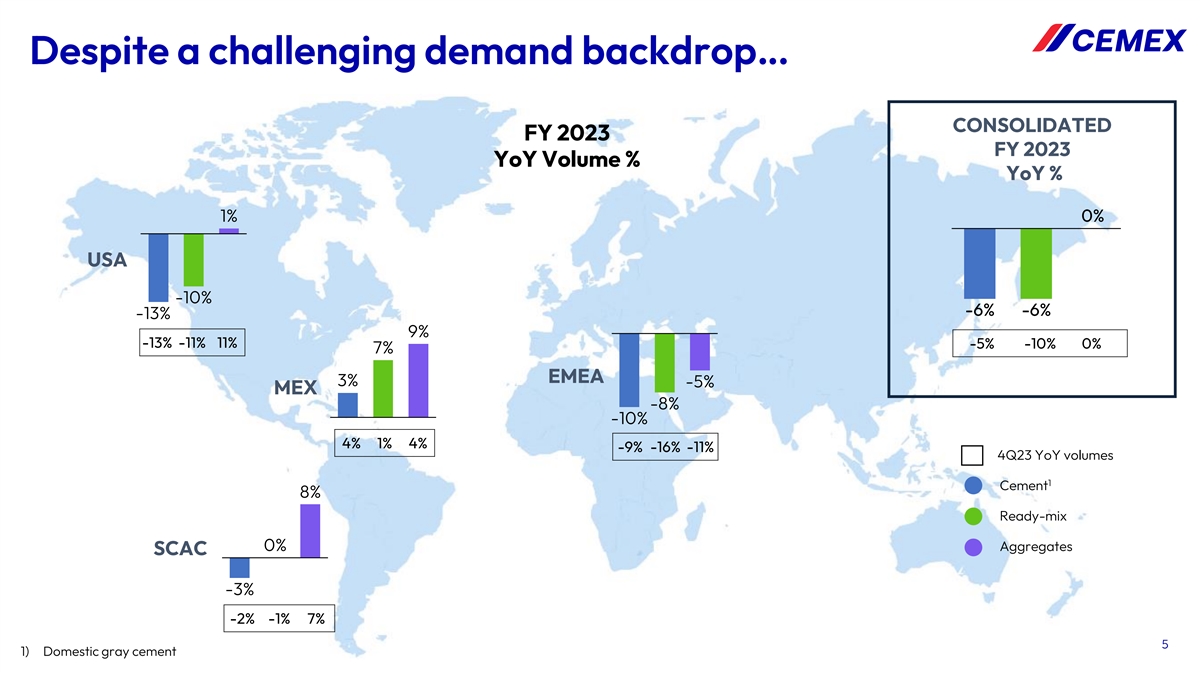
Despite a challenging demand backdrop… CONSOLIDATED FY 2023 FY 2023
YoY Volume % YoY % 1% 0% USA -10% -6% -6% -13% 9% -13% -11% 11% -5% -10% 0% 7% EMEA 3% -5% MEX -8% -10% 4% 1% 4% -9% -16% -11% 4Q23 YoY volumes 1 Cement 8% Ready-mix 0% Aggregates SCAC -3% -2% -1% 7% 5 1) Domestic gray cement

…our prices enjoyed strong momentum across our portfolio FY 2023
CONSOLIDATED FY 2023 YoY Price % YoY % 19% 16% 14% 14% 12% 11% USA 0% 1% 0% 2% 2% 0% 18% 25% 23% 12% 8% 11% EMEA MEX -3% 1% -1% 0% 0% 3% Sequential (3Q23 to 4Q23) 1 Cement 20% Ready-mix 14% 9% Aggregates SCAC -1% 1% -1% 1) Domestic gray cement 6
Note: For Cemex, SCAC, and EMEA, prices are calculated on a volume-weighted average basis at constant foreign-exchange rates

Price/Cost, growth investments, and Urbanization Solutions drive EBITDA
2023 EBITDA Waterfall +20% +25% 3,347 3,225 -1,155 122 -19 47 86 1,957 2,681 -372 2022 Volume Price Costs Growth Urbanization Other 2023 FX 2023 Investments Solutions l-t-l reported EBITDA 17.2% 19.2% +2.0 pp margin 7 Millions of U.S.
dollars

Achieved goal of recovering 2021 margin Consolidated EBITDA Margin +1pp
20.7% Impact from 19.7% volumes and product mix 17.2% 19.2% 2021 2022 2023 COGS as 67.8 % 69.0% 66.3% % of Sales 8

Future in Action: Your partner in decarbonization of construction sector
Achieved 2025 Vertua customer adoption target 2 years ahead of schedule Scope 1 Scope 2 +15pp -13% -4% 56% 1st in industry to provide 50% 41% 620 2025 target product climate impact disclosure globally - 3rd party validated 562 2022 2023 540 % of
total cement volumes -10% -1% 57.5 Recognized with ‘A’ score for 52.4 51.7 climate disclosure 2020 2022 2023 2020 2022 2023 Accelerating decarbonization pace: doing in 3 years what used to take us 15 years 9 Kilograms of CO per ton of
cementitious. Scope 1 relates to net emissions. 2

Urbanization Solutions: Our fastest growing business EBITDA •
Contributing 9% of EBITDA and 7% of incremental EBITDA in 2023 CAGR +24% 299 • ~$130 M of completed investments since 2020 227 128 • Circularity business, driven by Regenera, is largest growth contributor 2019 2022 2023 • Ample
small bolt-on investment % of total opportunities consolidated 5% 8% 9% EBITDA EBITDA margin 9% 11% 12% Aligned to mega trends of construction industry, including decarbonization, resiliency, circularity and urbanization 10 Millions of U.S.
dollars

Growth investments contributing 10% of 2023 EBITDA Immokalee, Florida,
sand quarry (US) - Aggregates ~$2.9 B 1 growth pipeline Clear profitability guidelines Puebla, waste management facility (MEX) – Urbanization Solutions • Short payback periods $0.6 B Remaining• IRR > 25% • Strategic Fit
$0.9 B Investment Madrid, two aggregates quarries Ongoing (SPA) - Aggregates examples investments to date Contributing in 2023 Germany, mortars and adhesives EBITDA ~$325 M (GER) – Urbanization Solutions $1.3 B Completed Incremental ~$86 M
EBITDA Canada, aggregates reserves (US)- Aggregates 11 1) As of December 2023, approved investment pipeline in bolt-ons and legacy cement since 2020
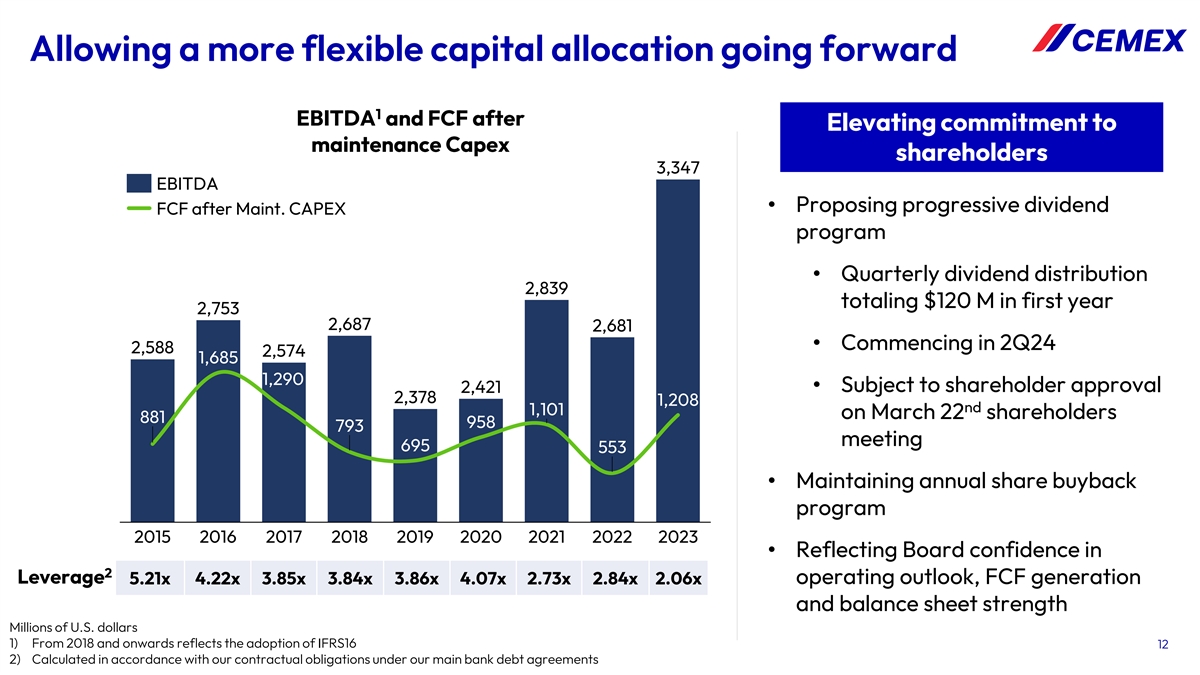
Allowing a more flexible capital allocation going forward 1 EBITDA and FCF
after Elevating commitment to maintenance Capex shareholders 3,347 EBITDA • Proposing progressive dividend FCF after Maint. CAPEX program • Quarterly dividend distribution 2,839 totaling $120 M in first year 2,753 2,687 2,681 •
Commencing in 2Q24 2,588 2,574 1,685 1,290 • Subject to shareholder approval 2,421 2,378 1,208 nd 1,101 on March 22 shareholders 881 958 793 meeting 695 553 • Maintaining annual share buyback program 2015 2016 2017 2018 2019 2020 2021
2022 2023 • Reflecting Board confidence in 2 Leverage operating outlook, FCF generation 5.21x 4.22x 3.85x 3.84x 3.86x 4.07x 2.73x 2.84x 2.06x and balance sheet strength Millions of U.S. dollars 1) From 2018 and onwards reflects the adoption of
IFRS16 12 2) Calculated in accordance with our contractual obligations under our main bank debt agreements

Regional Highlights 411 Tower, Monterrey, Mexico
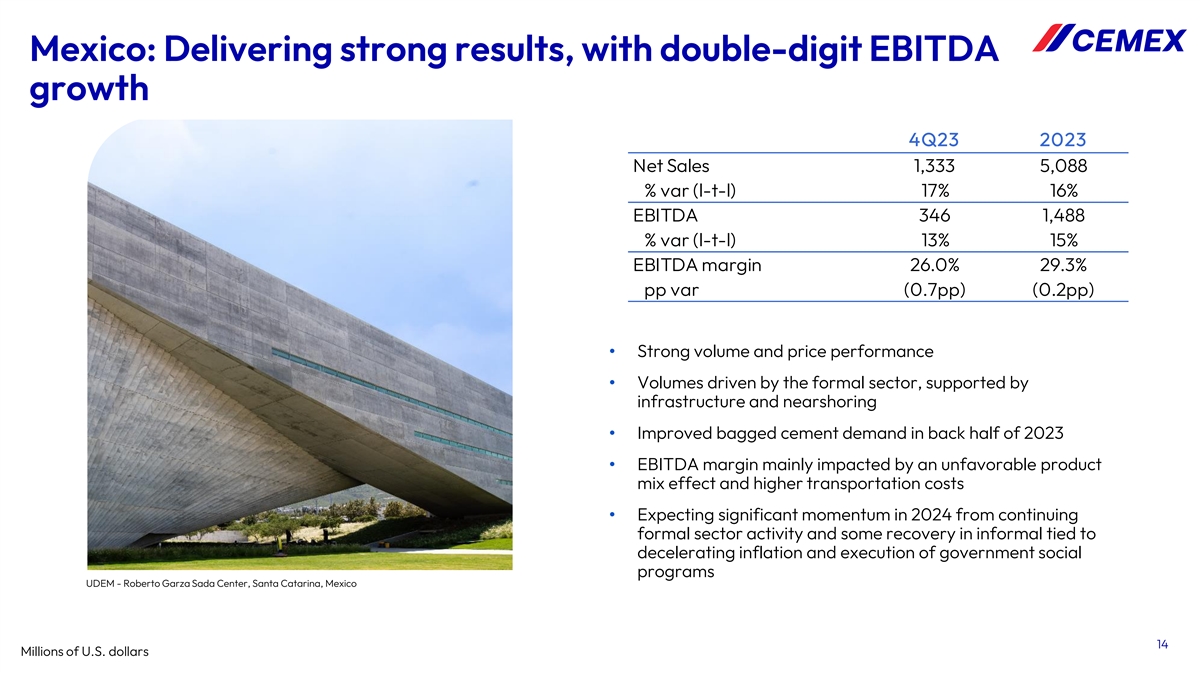
Mexico: Delivering strong results, with double-digit EBITDA growth 4Q23
2023 Net Sales 1,333 5,088 % var (l-t-l) 17% 16% EBITDA 346 1,488 % var (l-t-l) 13% 15% EBITDA margin 26.0% 29.3% pp var (0.7pp) (0.2pp) • Strong volume and price performance • Volumes driven by the formal sector, supported by
infrastructure and nearshoring • Improved bagged cement demand in back half of 2023 • EBITDA margin mainly impacted by an unfavorable product mix effect and higher transportation costs • Expecting significant momentum in 2024 from
continuing formal sector activity and some recovery in informal tied to decelerating inflation and execution of government social programs UDEM - Roberto Garza Sada Center, Santa Catarina, Mexico 14 Millions of U.S. dollars

1 US: Record full-year EBITDA of over $1 B 4Q23 2023 Net Sales 1,269 5,338
% var (l-t-l) 4% 6% EBITDA 239 1,040 % var (l-t-l) 18% 37% EBITDA margin 18.8% 19.5% pp var 2.3pp 4.4pp • Despite volume headwinds, EBITDA grew 37% driven by pricing strategy, growth investments and decelerating costs • Material margin
recovery reflects success in recovering multiyear cost inflation through pricing • For 2024, expect low single digit volume increases across all products • Driven by infrastructure and industrial sectors, underpinned by nearshoring
trends and fiscal stimulus programs • Expect improved residential performance due to declining interest rates and low housing inventory University of Alabama’s Bryant-Denny Stadium, Alabama, United States Built with Vertua
water-permeable concrete, part of our Vertua family of sustainable products Courtesy: University of Alabama Millions of U.S. dollars 15 1) Highest LTL full-year EBITDA since 2007
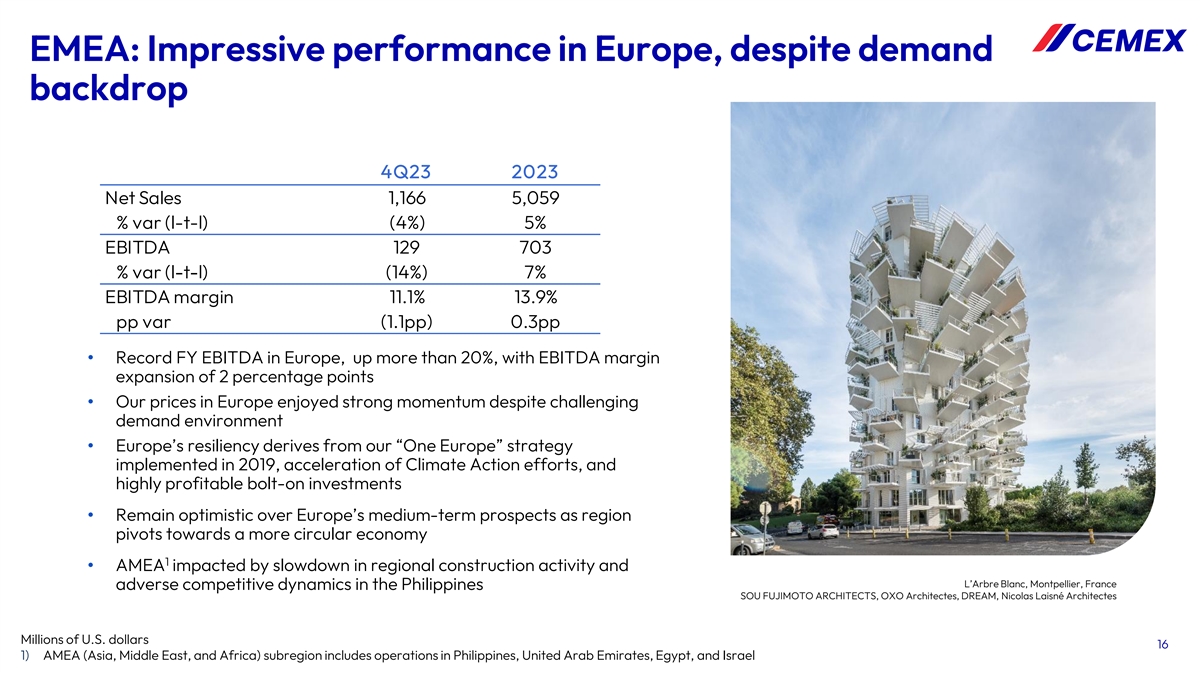
EMEA: Impressive performance in Europe, despite demand backdrop 4Q23 2023
Net Sales 1,166 5,059 % var (l-t-l) (4%) 5% EBITDA 129 703 % var (l-t-l) (14%) 7% EBITDA margin 11.1% 13.9% pp var (1.1pp) 0.3pp • Record FY EBITDA in Europe, up more than 20%, with EBITDA margin expansion of 2 percentage points • Our
prices in Europe enjoyed strong momentum despite challenging demand environment • Europe’s resiliency derives from our “One Europe” strategy implemented in 2019, acceleration of Climate Action efforts, and highly profitable
bolt-on investments • Remain optimistic over Europe’s medium-term prospects as region pivots towards a more circular economy 1 • AMEA impacted by slowdown in regional construction activity and L’Arbre Blanc, Montpellier,
France adverse competitive dynamics in the Philippines SOU FUJIMOTO ARCHITECTS, OXO Architectes, DREAM, Nicolas Laisné Architectes Millions of U.S. dollars 16 1) AMEA (Asia, Middle East, and Africa) subregion includes operations in Philippines,
United Arab Emirates, Egypt, and Israel
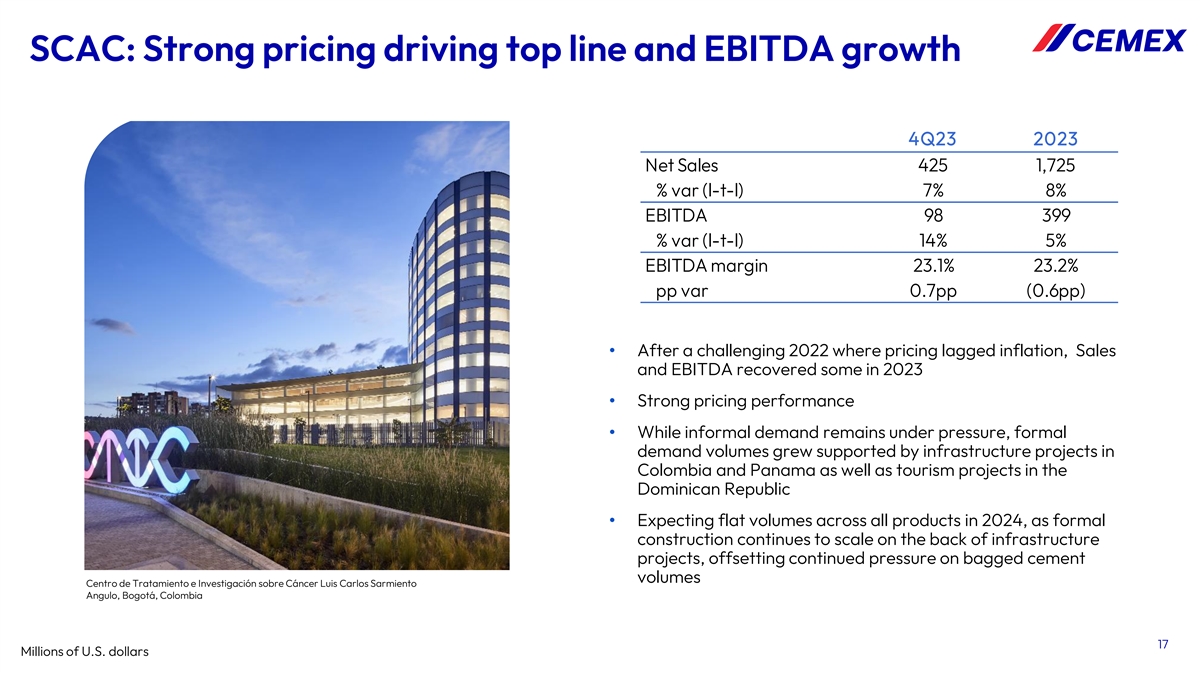
SCAC: Strong pricing driving top line and EBITDA growth 4Q23 2023 Net
Sales 425 1,725 % var (l-t-l) 7% 8% EBITDA 98 399 % var (l-t-l) 14% 5% EBITDA margin 23.1% 23.2% pp var 0.7pp (0.6pp) • After a challenging 2022 where pricing lagged inflation, Sales and EBITDA recovered some in 2023 • Strong pricing
performance • While informal demand remains under pressure, formal demand volumes grew supported by infrastructure projects in Colombia and Panama as well as tourism projects in the Dominican Republic • Expecting flat volumes across all
products in 2024, as formal construction continues to scale on the back of infrastructure projects, offsetting continued pressure on bagged cement volumes Centro de Tratamiento e Investigación sobre Cáncer Luis Carlos Sarmiento Angulo,
Bogotá, Colombia 17 Millions of U.S. dollars

Financial Developments Crédit Agricole Building, Nimes, France Built
with Vertua Concrete, part of our Vertua family of sustainable products

Record operating results with significantly higher free cash flow
generation January - December Fourth Quarter l-t-l l-t-l 2023 2022 %var %var 2023 2022 %var %var EBITDA 3,347 2,681 +25% +20% 743 630 +18% +13% Controlling Interest - Net Financial Expense 574 529 145 132 Net Income - Maintenance Capex 996 888 399
301 858 - Change in Working 1 515 (405) (307) Capital - Taxes Paid 550 197 56 41 - Other Cash Items (net) 17 6 36 74 - Free Cash Flow 0 (6) 0 (3) 182 Discontinued Operations Free Cash Flow after 1,208 553 +118% 511 391 +31% Maintenance Capex 2023
2022 - Strategic Capex 420 475 108 191 Free Cash Flow 788 78 +909% 403 201 +101% 19 Millions of U.S. dollars

Improved debt maturity profile, liquidity and leverage • Increased
committed revolving credit facility to $2.0 B, improving liquidity Debt maturity profile • Refinanced bank debt facility, with final as of December 2023 maturity now in 2028 Billions of U.S. dollars • Returned to the Mexican debt capital
markets, first time in over 15 years • Enhanced maturity schedule, further 1.5 improving credit profile 1.2 1.1 1.0 1.0 0.8 • Debt linked to sustainability KPIs now at 0.7 50%, two years ahead of plan 0.3 • Leverage ratio of 2.06x,
lowest since 2009 24 25 26 27 28 29 30 ≥31 20

2024 Outlook Gilbert Chabroux School, Lyon France Built with Insularis,
part of our Vertua family of sustainable products

1 2024 guidance 2 EBITDA Low to mid single-digit % increase Energy
cost/ton of cement produced Mid single-digit % decline ~$1.6 billion total Capital expenditures ~$1.0 billion Maintenance, ~$0.6 billion Strategic Investment in working capital Reduction of ~$300 million Cash taxes ~$1.0 billion 3 Cost of debt Flat
1) Reflects Cemex’s expectations as of February 8, 2024 2) Like-to-like for ongoing operations and assuming December 31, 2023 FX levels 22 3) Including the coupons of subordinated notes with no fixed maturity and the effect of our MXN-USD
cross-currency swaps

Appendix Happy Residence for Seniors, Montpellier, France Built with
Insularis, part of our Vertua family of sustainable products

Debt maturity profile as of December 31, 2023 Main bank debt agreements
Other bank debt Total debt as of December 31, 2023: $7,486 million Fixed Income Leases Average life of debt: 4.8 years 1,494 1,210 1,058 974 955 809 689 297 2024 2025 2026 2027 2028 2029 2030 2031 24 Millions of U.S. dollars
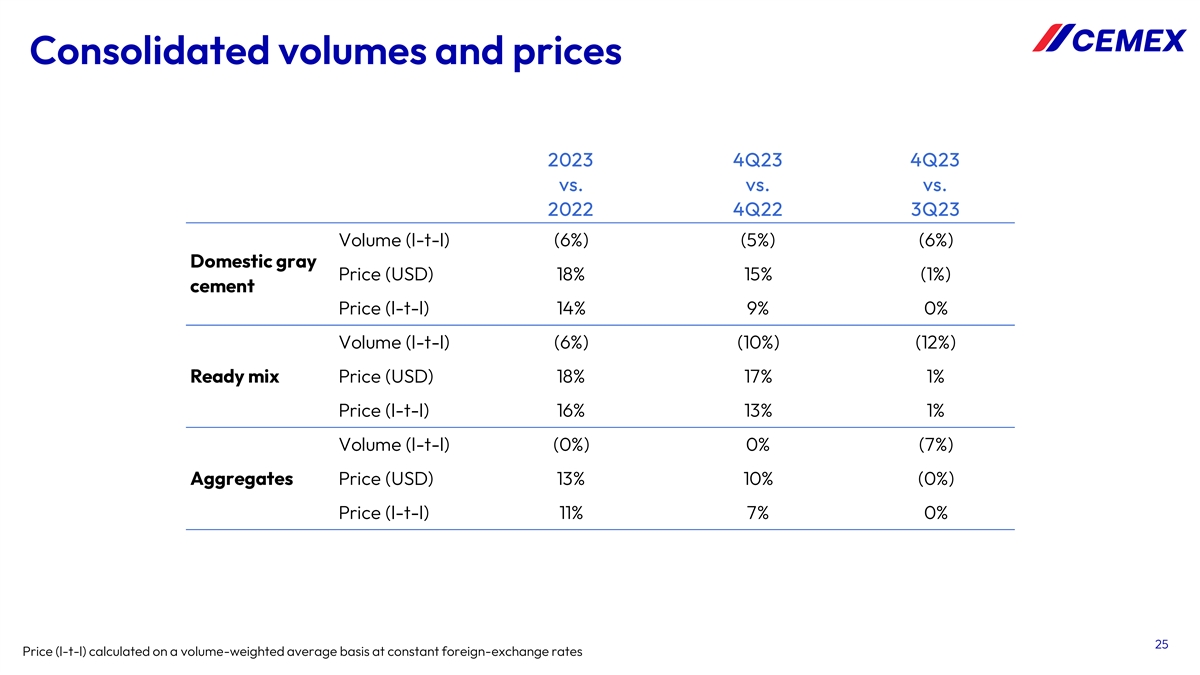
Consolidated volumes and prices 2023 4Q23 4Q23 vs. vs. vs. 2022 4Q22 3Q23
Volume (l-t-l) (6%) (5%) (6%) Domestic gray Price (USD) 18% 15% (1%) cement Price (l-t-l) 14% 9% 0% Volume (l-t-l) (6%) (10%) (12%) Ready mix Price (USD) 18% 17% 1% Price (l-t-l) 16% 13% 1% Volume (l-t-l) (0%) 0% (7%) Aggregates Price (USD) 13% 10%
(0%) Price (l-t-l) 11% 7% 0% 25 Price (l-t-l) calculated on a volume-weighted average basis at constant foreign-exchange rates
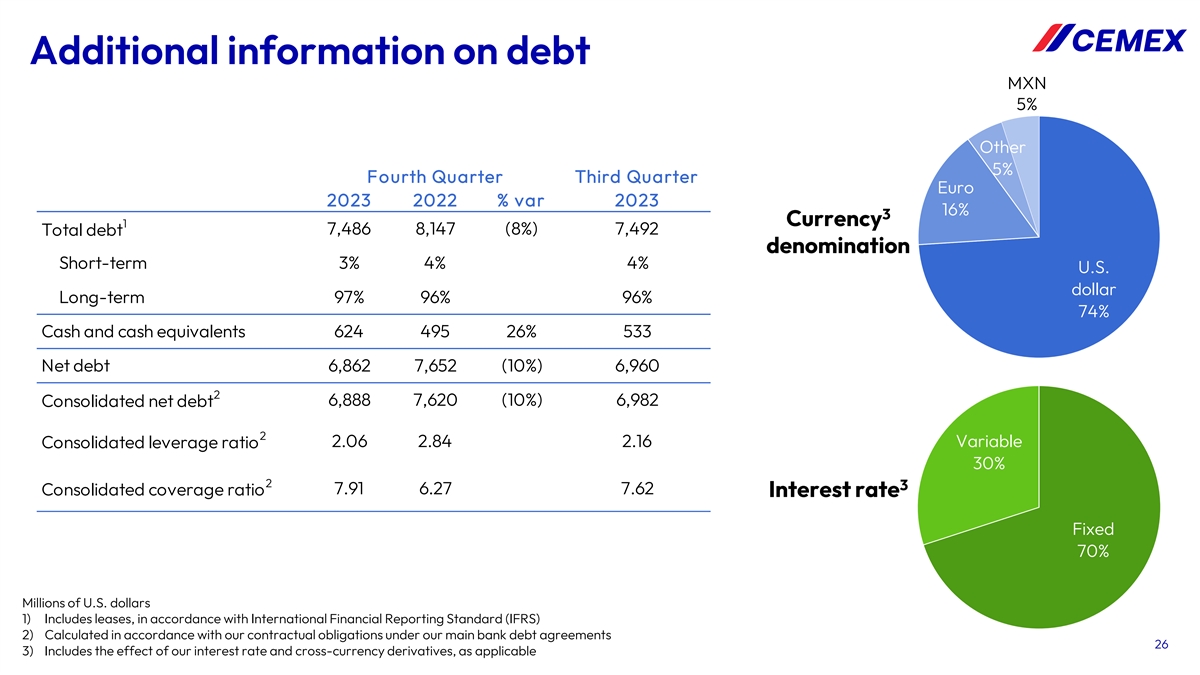
Additional information on debt MXN 5% Other 5% Fourth Quarter Third
Quarter Euro 2023 2022 % var 2023 16% 3 Currency 1 7,486 8,147 (8%) 7,492 Total debt denomination Short-term 3% 4% 4% U.S. dollar Long-term 97% 96% 96% 74% Cash and cash equivalents 624 495 26% 533 Net debt 6,862 7,652 (10%) 6,960 2 6,888 7,620
(10%) 6,982 Consolidated net debt 2 2.06 2.84 2.16 Variable Consolidated leverage ratio 30% 2 3 7.91 6.27 7.62 Consolidated coverage ratio Interest rate Fixed 70% Millions of U.S. dollars 1) Includes leases, in accordance with International
Financial Reporting Standard (IFRS) 2) Calculated in accordance with our contractual obligations under our main bank debt agreements 26 3) Includes the effect of our interest rate and cross-currency derivatives, as applicable

Additional information on debt Total debt by instrument Fourth Quarter
Third Quarter 2023 % of total 2023 % of total Fixed Income 3,508 47% 3,138 42% Main Bank Debt Agreements 2,476 33% 2,907 39% 47% 33% Leases 1,258 17% 1,177 16% Other 244 3% 271 4% Total Debt 7,486 7,492 17% 3% 27 Millions of U.S. dollars

4Q23 volume and price summary: selected countries and regions Domestic
gray cement Ready mix Aggregates 4Q23 vs. 4Q22 4Q23 vs. 4Q22 4Q23 vs. 4Q22 Volume Price (USD) Price (LC) Volume Price (USD) Price (LC) Volume Price (USD) Price (LC) Mexico 4% 21% 8% 1% 37% 22% 4% 44% 29% U.S. (13%) 10% 10% (11%) 14% 14% 11% (0%)
(0%) EMEA (9%) 11% 9% (16%) 9% 7% (11%) 8% 5% Europe (14%) 23% 14% (10%) 14% 7% (11%) 13% 6% AMEA (3%) (6%) 3% (25%) (4%) 3% (13%) (8%) (1%) SCAC (2%) 12% 7% (1%) 36% 19% 7% 23% 7% 28 Price (LC) for EMEA, Europe, AMEA, and SCAC calculated on a
volume-weighted-average basis at constant foreign-exchange rates

2023 volume and price summary: selected countries and regions Domestic
gray cement Ready mix Aggregates 2023 vs. 2022 2023 vs. 2022 2023 vs. 2022 Volume Price (USD) Price (LC) Volume Price (USD) Price (LC) Volume Price (USD) Price (LC) Mexico 3% 27% 11% 7% 42% 25% 9% 41% 23% U.S. (13%) 14% 14% (10%) 19% 19% 1% 12% 12%
EMEA (10%) 15% 18% (8%) 10% 12% (5%) 8% 8% Europe (13%) 29% 24% (10%) 18% 14% (6%) 11% 9% AMEA (6%) (9%) 8% (6%) (2%) 8% (2%) (5%) 5% SCAC (3%) 8% 9% (0%) 21% 20% 8% 14% 14% 29 Price (LC) for EMEA, Europe, AMEA, and SCAC calculated on a
volume-weighted-average basis at constant foreign-exchange rates

1 2024 volume guidance : selected countries/regions Cement Ready-mix
Aggregates Flat to low single-digit increase Flat to low single-digit decline Flat to low single-digit decline CEMEX Low single-digit increase Low single-digit increase Low single-digit increase Mexico Low single-digit increase Low single-digit
increase Low single-digit increase USA Flat Low single-digit decline Low single-digit decline EMEA Europe Flat to low single-digit decline Flat to low single-digit decline Flat to low single-digit decline AMEA Flat to low single-digit increase Mid
single-digit decline Mid single-digit decline SCAC Flat Flat N/A 30 1) Reflects Cemex’s expectations as of February 8, 2024. Volumes on a like-to-like basis. All volume guidance in this slide means in percentage terms vs 2023
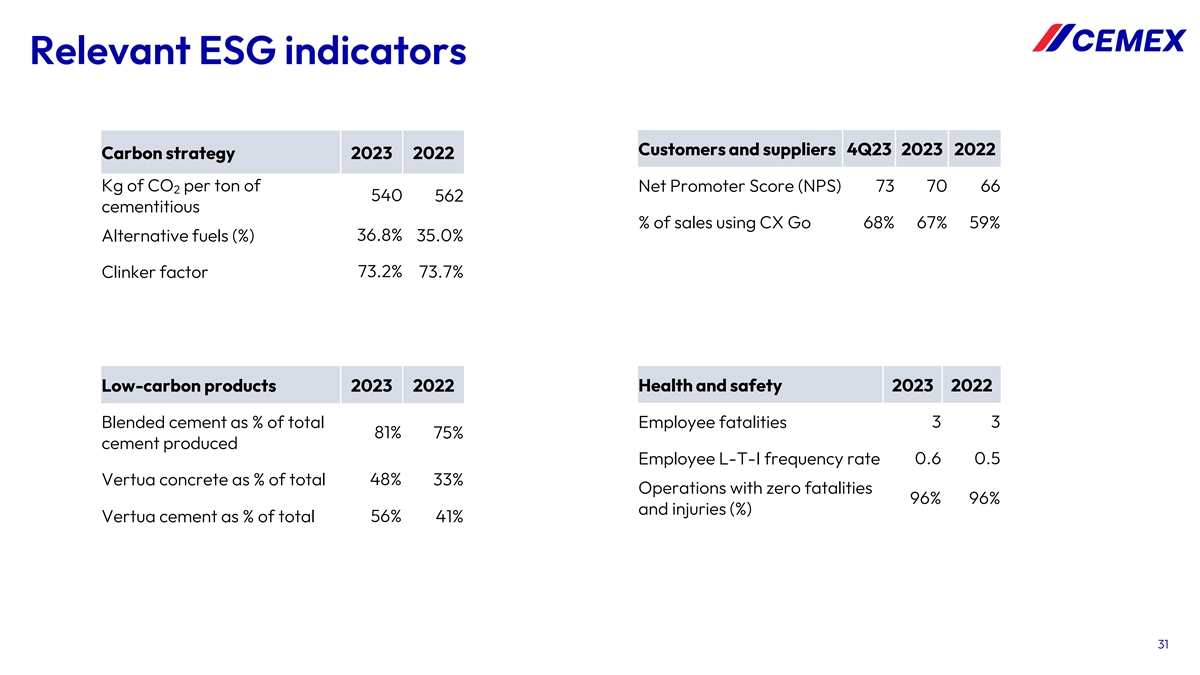
Relevant ESG indicators Customers and suppliers 4Q23 2023 2022 Carbon
strategy 2023 2022 Kg of CO per ton of Net Promoter Score (NPS) 73 70 66 2 540 562 cementitious % of sales using CX Go 68% 67% 59% Alternative fuels (%) 36.8% 35.0% 73.2% 73.7% Clinker factor Health and safety 2023 2022 Low-carbon products 2023 2022
3 3 Blended cement as % of total Employee fatalities 81% 75% cement produced Employee L-T-I frequency rate 0.6 0.5 Vertua concrete as % of total 48% 33% Operations with zero fatalities 96% 96% and injuries (%) Vertua cement as % of total 56% 41%
31

Definitions SCAC South, Central America and the Caribbean EMEA Europe,
Middle East, Africa and Asia AMEA Asia, Middle East, and Africa When providing cement volume variations, refers to domestic gray cement operations (starting in 2Q10, the base for reported Cement cement volumes changed from total domestic cement
including clinker to domestic gray cement) LC Local currency l-t-l (like to like) On a like-to-like basis adjusting for currency fluctuations and for investments/divestments when applicable Investments incurred for the purpose of ensuring the
company’s operational continuity. These include capital expenditures on Maintenance capital projects required to replace obsolete assets or maintain current operational levels, and mandatory capital expenditures, which expenditures are
projects required to comply with governmental regulations or company policies EBITDA Means Operating EBITDA: Operating earnings before other expenses, net plus depreciation and operating amortization IFRS International Financial Reporting Standards,
as issued by the International Accounting Standards Board Pp Percentage points Prices All references to pricing initiatives, price increases or decreases, refer to our prices for our products Investments incurred with the purpose of increasing the
company’s profitability. These include capital expenditures on projects Strategic capital expenditures designed to increase profitability by expanding capacity, and margin improvement capital expenditures, which are projects designed to
increase profitability by reducing costs U.S. dollars USD/U.S. dollars Percentage variation % var 32

Contact Information Investors Relations Stock Information In the United
States: NYSE (ADS): +1 877 7CX NYSE CX In Mexico: Mexican Stock Exchange +52 81 8888 4292 (CPO): CEMEX.CPO ir@cemex.com Ratio of CPO to ADS: 10 to 1
Cemex SaB De Cv (NYSE:CX)
Gráfico Histórico do Ativo
De Mar 2024 até Abr 2024

Cemex SaB De Cv (NYSE:CX)
Gráfico Histórico do Ativo
De Abr 2023 até Abr 2024
