FORM 6 - K
SECURITIES AND EXCHANGE COMMISSION
Washington, D.C. 20549
Report of Foreign Private Issuer
Pursuant to Rule 13a - 16 or 15d - 16 of
the Securities Exchange Act of 1934
As of 2/20/2024
Ternium S.A.
(Translation of Registrant’s name into English)
Ternium S.A.
26, Boulevard Royal - 4th floor
L-2449 Luxembourg
(352) 2668-3152
(Address of principal executive offices)
Indicate by check mark whether the registrant files or will file annual reports under cover Form 20-F or 40-F.
Form 20-F a Form 40-F __
Indicate by check mark whether the registrant by furnishing the information contained in this Form is also thereby furnishing the information to the Commission pursuant to Rule 12G3-2(b) under the Securities Exchange Act of 1934.
Yes __ No a
If “Yes” is marked, indicate below the file number assigned to the registrant in connection with Rule 12g3-2(b):
Not applicable
The attached material is being furnished to the Securities and Exchange Commission pursuant to Rule 13a-16 and Form 6-K under the Securities Exchange Act of 1934, as amended.
This report contains Ternium S.A.’s press release announcing fourth quarter and full year 2023 results.
SIGNATURE
Pursuant to the requirements of the Securities Exchange Act of 1934, the Registrant has duly caused this report to be signed on its behalf by the undersigned, thereunto duly authorized.
TERNIUM S.A.
By: /s/ Guillermo Etchepareborda By: /s/ Sebastián Martí
Name: Guillermo Etchepareborda Name: Sebastián Martí
Title: Attorney in Fact Title: Attorney in Fact
Dated: February 20, 2024
Sebastián Martí
Ternium - Investor Relations
+1 (866) 890 0443
+54 (11) 4018 8389
www.ternium.com
Ternium Announces Fourth Quarter and Full Year 2023 Results
Luxembourg, February 20, 2024 – Ternium S.A. (NYSE: TX) today announced its results for the fourth quarter and full year ended December 31, 2023.
The financial and operational information contained in this press release is based on Ternium S.A.’s operational data and consolidated condensed financial statements prepared in accordance with International Financial Reporting Standards (IFRS) and presented in US dollars ($) and metric tons. This press release includes certain non-IFRS alternative performance measures such as Adjusted Net Result, Adjusted Equity Holders’ Net Result, Adjusted Earnings per ADS, Adjusted EBITDA, Net Cash and Free Cash Flow. The reconciliation of these figures to the most directly comparable IFRS measures is included in Exhibit I.
Fourth Quarter of 2023 Highlights
| | | | | | | | | | | | | | | | | | | | | | | | | | | | | | | | | | | | | | | | | | | | | | | |
SHIPMENTS - STEEL PRODUCTS | | | ADJUSTED EBITDA | | | | NET INCOME | |
4.0 MILLION TONS | | | | $651 MILLION | | | | $554 MILLION | |
| | | | | | | | | | | | | | | |
SHIPMENTS - MINING PRODUCTS | | | ADJUSTED EBITDA MARGIN | | | | EARNINGS PER ADS | |
2.0 MILLION TONS | | | | 13% | | | | $2.11 | |
| | | | | | | | | | | | | | | |
| | | | | | | | | | | | | | | |
| CASH PROVIDED BY OPERATING ACTIVITIES | | | NET CASH POSITION | | | | 2023 ANNUAL DIVIDEND PROPOSAL | |
718 MILLION | | | | | $1.9 BILLION | | | | | $3.30 PER ADS | |
| | | | | | | | | | | | | | | |
Summary of Fourth Quarter of 2023 Results
| | | | | | | | | | | | | | | | | | | | |
| CONSOLIDATED | | 4Q23 | 3Q23 | DIF | 4Q22 | DIF |
| | | | | | |
| Steel Shipments (thousand tons) | | 4,035 | | 4,131 | | -2 | % | 3,020 | | 34 | % |
| Mining Shipments (thousand tons) | | 1,952 | | 2,176 | | -10 | % | — | | |
| Net Sales ($ million) | | 4,931 | | 5,185 | | -5 | % | 3,546 | | 39 | % |
| Operating Income ($ million) | | 582 | | 527 | | 10 | % | 43 | | 1249 | % |
| Adjusted EBITDA ($ million) | | 651 | | 698 | | -7 | % | 303 | | 115 | % |
| Adjusted EBITDA Margin (% of net sales) | | 13 | % | 13 | % | | 9 | % | |
| | | | | | |
| Net Income (Loss) ($ million) | | 554 | | (783) | | | 59 | | |
| Equity Holders’ Net Income (Loss) ($ million) | | 414 | | (739) | | | 40 | | |
Earnings (Losses) per ADS1 ($) | | 2.11 | | (3.77) | | | 0.20 | | |
| Adjusted Net Income ($ million) | | 554 | | 323 | | | 59 | | |
| Adjusted Equity Holders’ Net Income ($ million) | | 414 | | 271 | | | 40 | | |
Adjusted Earnings per ADS1 ($) | | 2.11 | | 1.38 | | | 0.20 | | |
1 American Depositary Share. Each ADS represents 10 shares of Ternium’s common stock. Results are based on a weighted average number of shares of common stock outstanding (net of treasury shares) of 1,963,076,776.
Fourth quarter of 2023 highlights
Ternium reported a good set of operating results in the fourth quarter of 2023. Steel shipments in Mexico remained strong in a seasonally weaker period, aided by continued growth of commercial customer demand. On the other hand, steel shipments in the Southern Region were relatively weak in the fourth quarter, as government-imposed restrictions on the importation of inputs further affected Ternium’s steel production rates in Argentina. Adjusted EBITDA margin remained relatively weak in the fourth quarter of 2023 due to the consolidation of Usiminas’ steel operations, which continued to record a relatively low level of profitability as it ramped-up its main blast furnace at its Ipatinga facility.
After a new administration took office in Argentina in December 2023, the Argentine Peso suffered a significant devaluation versus the US dollar. This event resulted in a decrease of $537 million in the fair value of the company’s holdings of Argentine securities in the fourth quarter, which are reported in US dollars using the official Argentine Peso exchange rate. In addition, Ternium recorded a $171 million net foreign exchange gain in the period, mainly due to the positive impact of the Argentine Peso devaluation on Ternium Argentina’s net short local currency position.
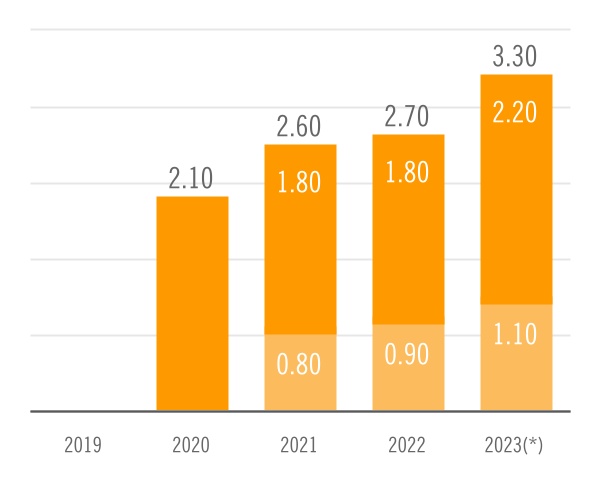
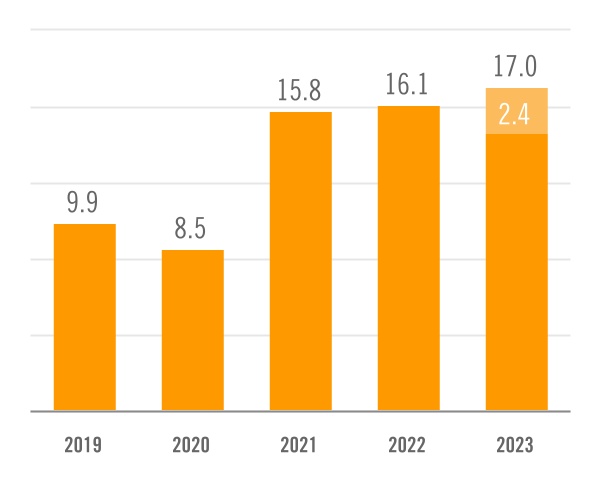
Annual Dividend Proposal
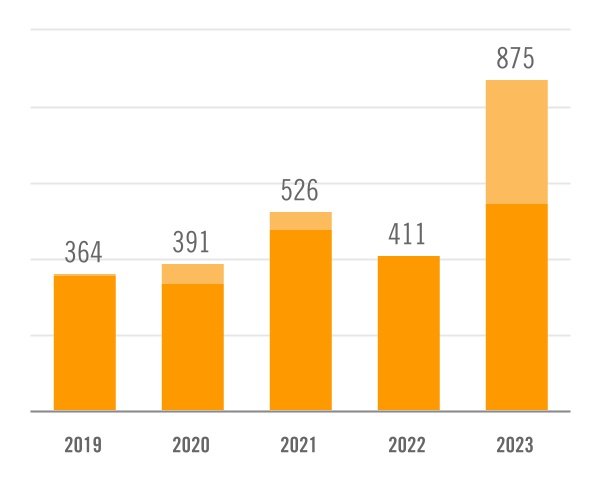
Ternium’s board of directors proposed that an annual dividend of $3.30 per ADS ($0.33 per share), or $649 million, be approved at the company’s annual general shareholders’ meeting, which is scheduled to be held on April 30, 2024. The annual dividend would include the interim dividend of $1.10 per ADS ($0.11 per share), or $216 million, paid in the fourth quarter. If the board of directors’ proposal is approved at the shareholders’ meeting, a net dividend of $2.20 per ADS ($0.22 per share), or $433 million, will be paid on May 8, 2024, with record-date on May 3, 2024.
With a dividend yield of approximately 9%, the new proposed annual dividend would represent a 22% increase compared to the prior annual dividend and almost three times the annual dividend of $1.20 per ADS paid for the year 2018.
| | |
n Interim (*) Board of Directors proposal |
|
Outlook
The Mexican steel market recorded a strong performance in 2023, with flat steel consumption reaching an all-time high of 18.1 million tons after annual growth of 18%. Ternium’s shipments in the country grew by 22% during the year, representing a significant market share gain supported by the ramp up of its new hot rolling mill in Pesquería. Ternium expects to begin deploying its downstream project in Pesquería during the second half of 2024, with the start-up of a 550 thousand tons per year new pickling mill and the first lines in its new service center. This should support an increase in volumes in this market during the second half of this year.
Healthy industrial activity in Mexico, together with the nearshoring of manufacturing capacity, are contributing to steel demand growth in the region. Construction activity in Mexico remains at good levels, with non-residential construction such as industrial warehouses, natural gas pipelines and other infrastructure projects doing well and residential construction being negatively affected by increased input prices. On the other hand, apparent steel demand in the domestic commercial market is showing short-term weakness due to a destocking tied to the recent downturn in steel spot prices in North America.
In Brazil, Ternium began fully consolidating Usiminas results in July 2023, during a period of significant transformation for Usiminas as it successfully relined its main blast furnace. In 2024, Usiminas will be focused on increasing its industrial system productivity. For the first quarter of 2024, Usiminas anticipates a sequential improvement in the profitability of its steel segment, coupled with a revenue decline in its mining segment due to the temporary halt of one of its ore processing plants and seasonal rains at the beginning of the year.
In Argentina, a new government administration took office in December and is poised to introduce much needed macroeconomic reforms in the country. These reforms are expected to have a recessionary effect on the Argentine economy in the first half of 2024 and, consequently, are likely to negatively affect Ternium shipments in the local market. During 2024, the company expects to commission its new, captive wind farm from which it will source renewable energy, replacing 90% of the electricity that its Argentine subsidiary currently purchases from third party providers.
For the first quarter of 2024, Ternium expects adjusted EBITDA to increase compared to the fourth quarter of 2023. The company anticipates adjusted EBITDA margin to sequentially improve as a result of lower steel cost per ton and slightly higher revenue per ton, which it expects will be driven by higher realized steel prices in Mexico and the U.S. In addition, the company anticipates slightly higher shipments in the USMCA region to be offset by lower shipments in Argentina.
Summary of 2023 Results
| | | | | | | | | | | | | | |
| CONSOLIDATED | | 2023 | 2022 | DIF |
| | | | |
| Steel Shipments (thousand tons) | | 14,213 | | 11,896 | | 19 | % |
| Mining Shipments (thousand tons) | | 4,128 | | 0 | | |
| Net Sales ($ million) | | 17,610 | | 16,414 | | 7 | % |
| Operating Income ($ million) | | 2,198 | | 2,700 | | -19 | % |
| Adjusted EBITDA ($ million) | | 2,740 | | 3,415 | | -20 | % |
| Adjusted EBITDA Margin (% of net sales) | | 16 | % | 21 | % | |
| | | | |
| Net Income ($ million) | | 986 | | 2,093 | | |
| Equity Holders’ Net Income ($ million) | | 676 | | 1,768 | | |
Earnings per ADS2 ($) | | 3.44 | | 9.00 | | |
| Adjusted Net Income ($ million) | | 2,092 | | 2,093 | | |
| Adjusted Equity Holders’ Net Income ($ million) | | 1,686 | | 1,768 | | |
Adjusted Earnings per ADS2 ($) | | 8.59 | | 9.00 | | |
2 American Depositary Share. Each ADS represents 10 shares of Ternium’s common stock. Results are based on a weighted average number of shares of common stock outstanding (net of treasury shares) of 1,963,076,776.
Highlights for the Year
2023 was an outstanding year for Ternium. Shipments in Mexico grew a remarkable 22% year-over-year, achieving a record 8.4 million tons. Steel demand strengthened in the country supported by nearshoring activities, manufacturing and infrastructure investment. In addition, Ternium continued gaining share in Mexico’s flat steel market as it ramped-up its new state-of-the-art hot rolling mill in Pesquería. On the other hand, steel shipments in the Southern Region were negatively affected by government-imposed restrictions on the importation of inputs for the production process in Argentina.
In 2023, Ternium advanced several initiatives aimed at further strengthening its unique position in Latin America. The company announced the construction of a new steelmaking facility and a direct reduction unit in Pesquería, as well as a new port facility for raw material handling in Brownsville, Texas. In addition, Usiminas completed the relining of its main blast furnace at the Ipatinga facility.
Ternium’s Adjusted EBITDA in 2023 was supported by a record level of finished steel shipments and a healthy Adjusted EBITDA margin, despite the negative effect of the consolidation of Usiminas’ operations as it relined its main blast furnace at Ipatinga. In addition, net income in 2023 was negatively impacted by a $935 million loss in connection with the increase in Ternium’s participation in Usiminas, mainly due to the recycling of Currency Translation Adjustment (CTA) from Other Comprehensive Income to Net Results. This loss was
non-cash, it had no income tax effects and did not change the value of Ternium’s equity.
Analysis of Fourth Quarter and Full Year 2023 Results
Consolidated Steel Products Sales
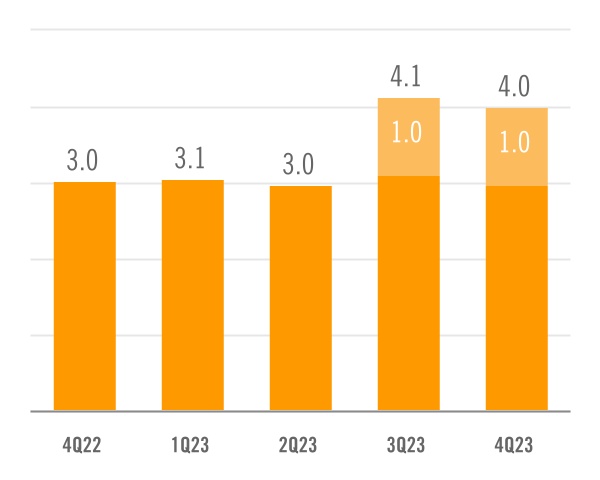
In the fourth quarter of 2023, steel shipments remained strong, similar to the levels achieved in the prior quarter. The consolidation of Usiminas added 1.0 million tons to total steel shipments. Revenue per ton decreased sequentially in the fourth quarter,
reflecting lower realized steel prices in most of Ternium’s markets. Particularly in Mexico, revenue per ton decreased sequentially in the fourth quarter reflecting lower industrial contract prices, as they reset with a lag, partially offset by higher spot prices, as market prices in the USMCA region rebounded during the period.
| | |
SHIPMENTS - STEEL PRODUCTS - QUARTERLY MILLION TONS |
| | |
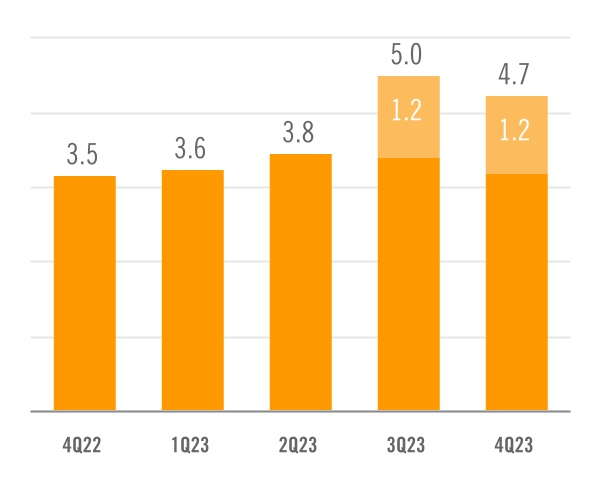
NET SALES - STEEL PRODUCTS - QUARTERLY $ BILLION |
In the fourth quarter of 2023, steel shipments in Mexico remained near record levels despite negative
seasonality effects, supported by higher commercial customer demand.
Steel shipments in the Southern Region decreased sequentially in the fourth quarter due to the impact on Ternium’s production rates in Argentina of government-imposed restrictions on the importation of inputs.
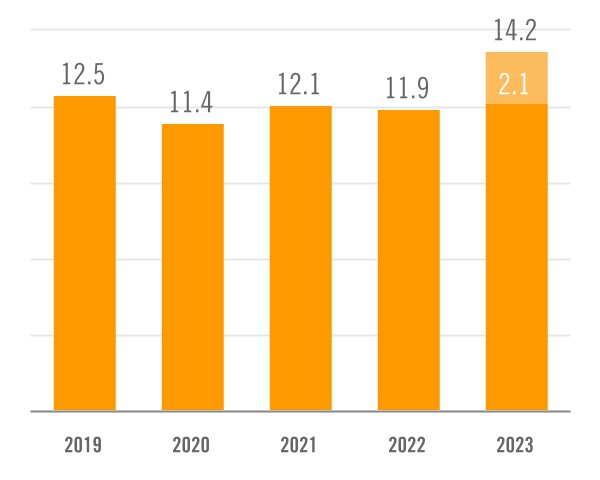
On a year-over-year basis, Ternium’s steel shipments increased 5% in 2023. The consolidation of Usiminas added 2.1 million tons to total steel shipments. Revenue per ton decreased year-over-year in 2023 reflecting lower realized steel prices in most of Ternium’s markets, particularly in the USMCA region.
| | |
SHIPMENTS BY REGION - STEEL PRODUCTS - QUARTERLY MILLION TONS |
| | |
SHIPMENTS - STEEL PRODUCTS - YEARLY MILLION TONS |
| | |
NET SALES - STEEL PRODUCTS - YEARLY $ BILLION |
In 2023, Ternium’s steel shipments in Mexico increased 22% to a new all-time high of 8.4 million tons. Steel demand was supported by nearshoring activities, manufacturing and infrastructure
investment. In addition, Ternium continued gaining market share in Mexico leaning on its new state-of-the-art hot rolling mill in Pesquería.
In the Southern Region, shipments in 2023 were negatively affected by government-imposed restrictions on the importation of inputs for the production process in Argentina, partially offset by the consolidation of Usiminas’ shipments in this region in the second half of the year. The consolidation of Usiminas led to a significant increase in reported steel volumes in Brazil.
| | |
SHIPMENTS BY REGION - STEEL PRODUCTS - YEARLY MILLION TONS |
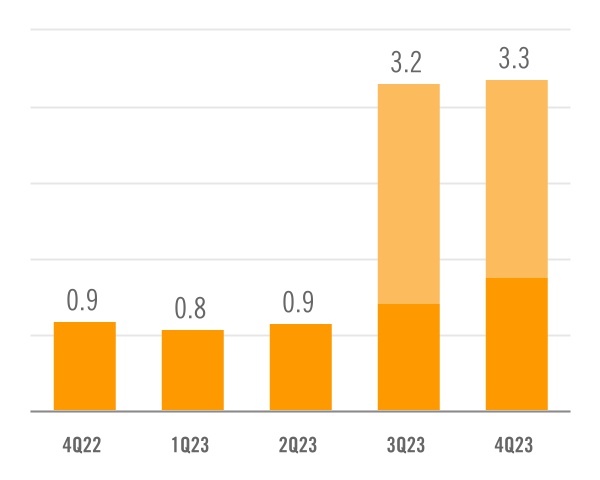
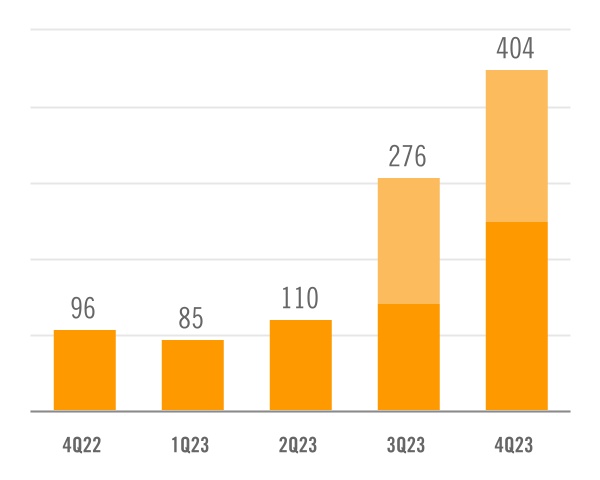
Mining Products Sales
Ternium reports intercompany and third-party sales of mining products under the Mining and Usiminas segments.
In the fourth quarter of 2023, iron ore shipments increased slightly sequentially. Intercompany iron
ore shipments increased in the period mainly due to the ramp-up of Usiminas’ main blast furnace at its Ipatinga facility. This was mostly offset by lower iron ore shipments to third parties.
Net sales increased sequentially in the fourth quarter reflecting higher iron ore prices.
| | |
SHIPMENTS - MINING PRODUCTS - QUARTERLY MILLION TONS |
| | |
n Intercompany n Third parties |
|
| | |
NET SALES - MINING PRODUCTS - QUARTERLY $ MILLION |
| | |
n Intercompany n Third parties |
|
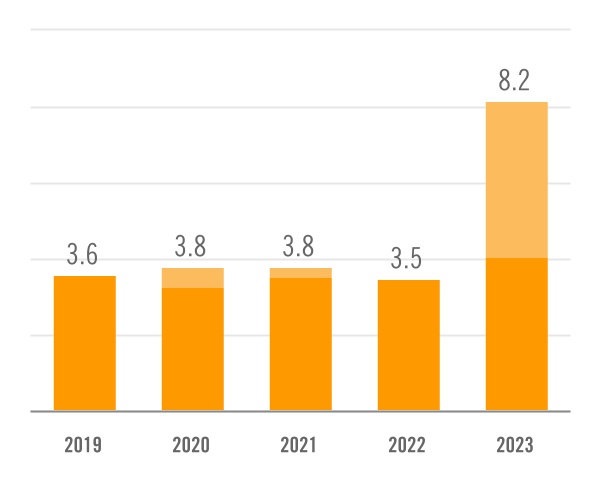
On a year-over-year basis, Ternium’s iron ore shipments to third parties increased by 4.1 million tons in 2023 due to the consolidation of Usiminas.
Revenue per ton increased year-over-year in 2023
reflecting higher iron ore prices.
| | |
SHIPMENTS - MINING PRODUCTS - YEARLY MILLION TONS |
| | |
n Intercompany n Third parties |
|
| | |
NET SALES - MINING PRODUCTS - YEARLY $ MILLION |
| | |
n Intercompany n Third parties |
|
| | | | | | | | | | | | | | | | | | | | | | | | | | | | | | | | | | | | | | |
| CONSOLIDATED | | NET SALES ($ MILLION) | | SHIPMENTS (THOUSAND TONS) | | REVENUE/TON ($/TON) |
| | | | | | | | | | | | |
| | 4Q23 | 3Q23 | DIF | | 4Q23 | 3Q23 | DIF | | 4Q23 | 3Q23 | DIF |
| | | | | | | | | | | | |
| Mexico | | 2,265 | | 2,383 | | -5 | % | | 2,122 | | 2,135 | | -1 | % | | 1,067 | | 1,116 | | -4 | % |
| Brazil | | 1,064 | | 1,136 | | -6 | % | | 952 | | 957 | | -1 | % | | 1,118 | | 1,187 | | -6 | % |
| Southern Region | | 905 | | 941 | | -4 | % | | 561 | | 603 | | -7 | % | | 1,611 | | 1,561 | | 3 | % |
| Other Markets | | 455 | | 504 | | -10 | % | | 399 | | 436 | | -8 | % | | 1,140 | | 1,157 | | -2 | % |
| Total steel products | | 4,689 | | 4,964 | | -6 | % | | 4,035 | | 4,131 | | -2 | % | | 1,162 | | 1,202 | | -3 | % |
| Mining products | | 180 | | 149 | | 21 | % | | 1,952 | | 2,176 | | -10 | % | | 92 | | 68 | | 35 | % |
| Other products | | 62 | 72 | -15 | % | | | | | | | | |
| Net sales | | 4,931 | 5,185 | -5 | % | | | | | | | | |
| | | | | | | | | | | | | | | | | | | | | | | | | | | | | | | | | | | | | | |
| CONSOLIDATED | | NET SALES ($ MILLION) | | SHIPMENTS (THOUSAND TONS) | | REVENUE/TON ($/TON) |
| | | | | | | | | | | | |
| | 2023 | 2022 | DIF | | 2023 | 2022 | DIF | | 2023 | 2022 | DIF |
| | | | | | | | | | | | |
| Mexico | | 9,311 | | 8,828 | | 5 | % | | 8,355 | | 6,843 | | 22 | % | | 1,114 | | 1,290 | | -14 | % |
| Brazil | | 2,279 | | 582 | | 292 | % | | 2,014 | | 723 | | 178 | % | | 1,132 | | 804 | | 41 | % |
| Southern Region | | 3,569 | | 3,834 | | -7 | % | | 2,271 | | 2,362 | | -4 | % | | 1,572 | | 1,623 | | -3 | % |
| Other Markets | | 1,853 | | 2,848 | | -35 | % | | 1,573 | | 1,968 | | -20 | % | | 1,178 | | 1,447 | | -19 | % |
| Total steel products | | 17,013 | | 16,092 | | 6 | % | | 14,213 | | 11,896 | | 19 | % | | 1,197 | | 1,353 | | -12 | % |
| Mining products | | 329 | | 0 | | | | 4,128 | | 0 | | | | 80 | | | |
| Other products | | 268 | 323 | -17 | % | | | | | | | | |
| Net sales | | 17,610 | 16,414 | 7 | % | | | | | | | | |
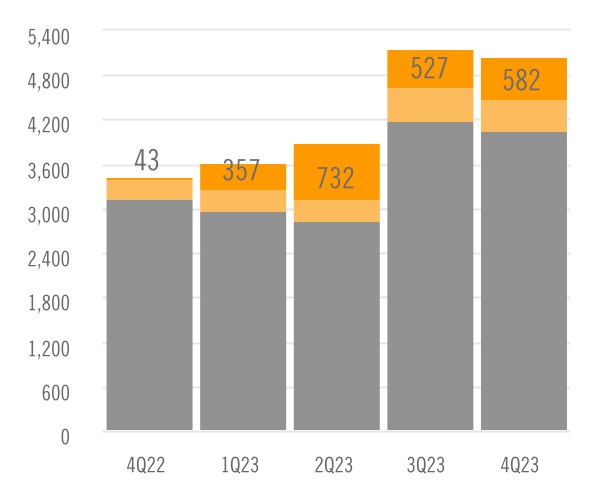
Operating Income
In the fourth quarter of 2023, operating income included a $109 million gain related to the reversal of Usiminas’ post-retirement liabilities and a $63 million gain due to the reversal of a contingency following the dismissal of a public civil action against Usiminas, partially offset by a $42 million loss related to the impairment charge of certain mining assets from Las Encinas.
| | |
OPERATING INCOME $ MILLION |
| | |
n Operating income n SG&A expenses & other n Cost of sales |
|
| | | | | | | | | | | | | | | | | | | | | | | | | | | | | | | | |
| $ MILLION | | 4Q23 | 3Q23 | DIF | 4Q22 | DIF | | 2023 | 2022 | DIF |
| | | | | | | | | | |
| Operating income | | 582 | | 527 | | 10 | % | 43 | | 1249 | % | | 2,198 | | 2,700 | | -19 | % |
| Net sales | | 4,931 | | 5,185 | | -5 | % | 3,546 | | 39 | % | | 17,610 | | 16,414 | | 7 | % |
| Cost of sales | | (4,039) | | (4,192) | | -4 | % | (3,119) | | 29 | % | | (14,051) | | (12,487) | | 13 | % |
| SG&A expenses | | (432) | | (443) | | -3 | % | (275) | | 57 | % | | (1,472) | | (1,144) | | 29 | % |
| Other operating income (expense), net | | 121 | | (22) | | | (110) | | | | 110 | | (84) | | |
Net Financial Results
In the fourth quarter of 2023, Ternium recorded a $171 million net foreign exchange gain mainly due to the impact on Ternium Argentina’s net short local currency position of the devaluation of the Argentine Peso versus the US dollar.
Ternium’s divestment of Argentine government bond holdings in the fourth quarter of 2023 resulted
in a loss of $58 million due to the recycling of changes in the fair value of financial instruments from Other Comprehensive Income to Financial Results. As of December 31, 2023, the balance of Ternium’s Other Comprehensive Income in connection with its Argentine government bond holdings amounted to a negative $527 million.
| | | | | | | | | | | | | | | | | | | | | | | |
| $ MILLION | | 4Q23 | 3Q23 | 4Q22 | | 2023 | 2022 |
| | | | | | | |
| Net interest results | | 49 | | 30 | | 10 | | | 130 | | 28 | |
| Net foreign exchange result | | 171 | | (33) | | (27) | | | 98 | | (164) | |
| Change in fair value of financial assets | | (85) | | 36 | | 20 | | | (58) | | 76 | |
| Other financial (expense) income, net | | (32) | | (3) | | 6 | | | (47) | | (10) | |
| Net financial results | | 103 | | 30 | | 9 | | | 123 | | (70) | |
Income Tax Results
Deferred tax results reflect the impact of local currency fluctuations versus the US dollar on
companies that use the US dollar as functional
currency, mainly Ternium Mexico, Ternium Argentina and Ternium Brasil, net of the positive effect of local inflation.
| | | | | | | | | | | | | | | | | | | | | | | |
| $ MILLION | | 4Q23 | 3Q23 | 4Q22 | | 2023 | 2022 |
| | | | | | | |
| Current income tax expense | | (141) | | (164) | | (23) | | | (591) | | (600) | |
| Deferred tax (loss) gain | | (15) | | (89) | | 12 | | | 257 | | 27 | |
| Income tax expense | | (156) | | (253) | | (11) | | | (334) | | (574) | |
| Result before income tax | | 709 | | (530) | | 70 | | | 1,321 | | 2,666 | |
| Effective tax rate | | 22 | % | -48 | % | 16 | % | | 25 | % | 22 | % |
Net Income
Ternium’s Net Income in the fourth quarter of 2023 was strong, reflecting a healthy operation, the positive effect on Operating Income from liabilities and contingency reversals, and the positive effect on Financial Results of the Argentine Peso devaluation.
In the third quarter of 2023, Adjusted Net Income and Adjusted Equity Holders’ Net Income equaled the period’s Net Loss and Equity Holders’ Net Loss, respectively, adjusted to exclude a loss of $1.1 billion in connection with the increase in the participation in Usiminas. Adjusted Earnings per ADS equaled the period’s Adjusted Equity Holders’ Net Income divided by 1,963 million outstanding shares of Ternium’s common stock, net of treasury shares, expressed in ADS equivalent (each ADS represents 10 shares).
| | |
NET INCOME (LOSS), EARNINGS (LOSSES) PER ADS $ MILLION, $ |
| | | | | | | | | | | | | | | | | | | | | | | |
| $ MILLION | | 4Q23 | 3Q23 | 4Q22 | | 2023 | 2022 |
| | | | | | | |
| Owners of the parent | | 414 | | (739) | | 40 | | | 676 | | 1,768 | |
| Non-controlling interest | | 140 | | (44) | | 19 | | | 310 | | 325 | |
Net Income (Loss) | | 554 | | (783) | | 59 | | | 986 | | 2,093 | |
| Less: non-cash effects related to the increase in the participation in Usiminas | | — | | (1,106) | | — | | | (1,106) | | — | |
| Adjusted Net Income | | 554 | | 323 | | 59 | | | 2,092 | | 2,093 | |
Adjusted EBITDA
Adjusted EBITDA in the fourth quarter of 2023 equals net results adjusted to exclude:
◦Income Tax Results;
◦Equity in Results of Non-consolidated Companies;
◦Net Financial Results;
◦Reversal of Usiminas’ post-retirement liabilities;
◦Contingency reversal due to dismissal of public civil action against Usiminas;
◦Impairment charge on Las Encinas’ mining assets; and
◦Depreciation and Amortization.
And adjusted to include the proportional EBITDA in Unigal (70% participation).
Adjusted EBITDA Margin equals Adjusted EBITDA divided by net sales.
Cash Flow and Liquidity
In the fourth quarter of 2023, Ternium posted a strong level of cash from operations, partly as a result of a working capital reduction in the period. The decrease in working capital included a $254 million decrease in trade and other receivables and a $216 million decrease in inventories, partially offset by an aggregate $150 million increase in accounts payable and other liabilities.
Trade receivables decreased in the period mainly as a result of lower shipment volumes. The inventory reduction mainly reflected a decrease in steel costs and lower raw material volumes. In particular, inventories at Ternium’s Argentine operations were affected by the government-imposed restrictions on the importation of inputs.
Capital expenditures increased sequentially in the fourth quarter as Ternium advanced the construction of the new facilities at its industrial center in Pesquería. The company has reassessed the estimated cost of its upstream and downstream expansion projects in Pesquería to $3.5 billion. The new estimate represents an increase of 9%, or $280 million, compared to the original figure, mainly reflecting higher prices and foreign exchange fluctuations.
| | |
CASH FROM OPERATIONS, CHANGES IN WORKING CAPITAL - QUARTERLY $ BILLION |
| | |
n Cash from operations n (Incr.) decr. in working capital |
|
| | |
CAPITAL EXPENDITURES(*) - QUARTERLY $ MILLION |
| | |
n Usiminas |
(*) In 2023, CAPEX include advance payments to equipment suppliers. |
|
As of year-end 2023, Ternium recorded a strong $1.9 billion net cash position. In the fourth quarter of 2023, Ternium’s net cash position decreased $496 million sequentially, mainly as a result of a lower fair value of Argentine securities. In addition, the company paid an interim dividend of $216 million in November 2023.
Ternium’s net cash position as of December 31, 2023 included Ternium Argentina’s total position of cash and cash equivalents and other investments of $1.1 billion.
In 2023, Ternium’s cash from operations reached a solid $2.5 billion. Capital expenditures increased sequentially in the year mainly reflecting the development of Ternium’s growth projects in Pesquería and the consolidation of Usiminas in the second half of 2023.
In addition to its Pesquería growth projects, during the year Ternium advanced the construction of a new wind farm in Argentina and several projects aimed at further improving environmental and safety
| | |
NET CASH POSITION $ BILLION |
conditions at its facilities. Usiminas’ capital expenditures included those in connection with the relining of its main blast furnace in Ipatinga, among others.
| | |
CASH FROM OPERATIONS - YEARLY $ BILLION |
| | |
CAPITAL EXPENDITURES - YEARLY $ MILLION |
| | |
n Usiminas |
(*) In 2023, CAPEX include advance payments to equipment suppliers. |
|
In 2023, Ternium’s net cash position decreased $711 million. The fair value of Argentine securities holdings decreased by $555 million, mostly as a result of a significant devaluation of the Argentine Peso in December 2023.
In 2023, Ternium paid dividends to shareholders of $569 million and dividends in kind to non-controlling interest of $234 million.
In addition, Ternium invested $119 million in the acquisition of an additional participation in Usiminas.
| | |
NET (DEBT) CASH POSITION $ BILLION |
Conference Call and Webcast
Ternium will host a conference call on February 21, 2024, at 8:30 a.m. ET in which management will discuss fourth quarter and full year 2023 results. A webcast link will be available in the Investor Center section of the company’s website at www.ternium.com.
Forward Looking Statements
Some of the statements contained in this press release are “forward-looking statements”. Forward-looking statements are based on management’s current views and assumptions and involve known and unknown risks that could cause actual results, performance or events to differ materially from those expressed or implied by those statements. These risks include but are not limited to risks arising from uncertainties as to gross domestic product, related market demand, global production capacity, tariffs, cyclicality in the industries that purchase steel products and other factors beyond Ternium’s control.
About Ternium
Ternium is a leading steel producer in the Americas, providing advanced steel products to a wide range of manufacturing industries and the construction sector. We invest in low carbon emissions steelmaking technologies to support the energy transition and the mobility of the future. We also support the development of our communities, specially through educational programs in Latin America. More information about Ternium is available at www.ternium.com.
Income Statement
| | | | | | | | | | | | | | | | | | | | | | | |
| $ MILLION | | 4Q23 | 3Q23 | 4Q22 | | 2023 | 2022 |
| | | | | | | |
| Net sales | | 4,931 | | 5,185 | | 3,546 | | | 17,610 | | 16,414 | |
| Cost of sales | | (4,039) | | (4,192) | | (3,119) | | | (14,051) | | (12,487) | |
| Gross profit | | 892 | | 993 | | 427 | | | 3,559 | | 3,927 | |
| Selling, general and administrative expenses | | (432) | | (443) | | (275) | | | (1,472) | | (1,144) | |
| Other operating income (expense), net | | 121 | | (22) | | (110) | | | 110 | | (84) | |
| Operating income | | 582 | | 527 | | 43 | | | 2,198 | | 2,700 | |
| | | | | | | |
| Financial expense | | (44) | | (47) | | (18) | | | (125) | | (47) | |
| Financial income | | 94 | | 78 | | 28 | | | 255 | | 75 | |
| Other financial income (expense), net | | 54 | | 0 | | (1) | | | (6) | | (99) | |
Equity in earnings of non-consolidated companies | | 24 | | 19 | | 19 | | | 105 | | 37 | |
| Effect related to the increase of the participation in Usiminas | | — | | (171) | | — | | | (171) | | — | |
| Recycling of other comprehensive income related to Usiminas | | — | | (935) | | — | | | (935) | | — | |
| Profit (loss) before income tax results | | 709 | | (530) | | 70 | | | 1,321 | | 2,666 | |
| Income tax expense | | (156) | | (253) | | (11) | | | (334) | | (574) | |
| Profit (loss) for the period | | 554 | | (783) | | 59 | | | 986 | | 2,093 | |
| | | | | | | |
| Attributable to: | | | | | | | |
| Owners of the parent | | 414 | | (739) | | 40 | | | 676 | | 1,768 | |
| Non-controlling interest | | 140 | | (44) | | 19 | | | 310 | | 325 | |
Net income (loss) | | 554 | | (783) | | 59 | | | 986 | | 2,093 | |
Statement of Financial Position
| | | | | | | | | | | | | | |
| $ MILLION | | DECEMBER 31, 2023 | | DECEMBER 31, 2022 |
| | | | |
| Property, plant and equipment, net | | 7,638 | | | 6,262 | |
| Intangible assets, net | | 996 | | | 944 | |
| Investments in non-consolidated companies | | 517 | | | 822 | |
| Other investments | | 211 | | | 101 | |
| Deferred tax assets | | 1,713 | | | 200 | |
| Receivables, net | | 1,073 | | | 319 | |
| | | | |
| Total non-current assets | | 12,149 | | | 8,648 | |
| | | | |
| Receivables, net | | 1,173 | | | 663 | |
| Derivative financial instruments | | 15 | | | 0 | |
| Inventories, net | | 4,948 | | | 3,470 | |
| Trade receivables, net | | 2,065 | | | 1,181 | |
| Other investments | | 1,976 | | | 1,875 | |
| Cash and cash equivalents | | 1,846 | | | 1,653 | |
| Total current assets | | 12,024 | | | 8,842 | |
| | | | |
| Non-current assets classified as held for sale | | 7 | | | 2 | |
| | | | |
| Total assets | | 24,179 | | | 17,492 | |
Statement of Financial Position (cont.)
| | | | | | | | | | | | | | |
| $ MILLION | | DECEMBER 31, 2023 | | DECEMBER 31, 2022 |
| | | | |
| Capital and reserves attributable to the owners of the parent | | 12,419 | | | 11,846 | |
| Non-controlling interest | | 4,393 | | | 1,922 | |
| Total equity | | 16,812 | | | 13,768 | |
| | | | |
| Provisions | | 840 | | | 81 | |
| Deferred tax liabilities | | 171 | | | 163 | |
| Other liabilities | | 1,149 | | | 538 | |
| Trade payables | | 12 | | | 1 | |
| Lease liabilities | | 189 | | | 190 | |
| Borrowings | | 1,206 | | | 533 | |
| Total non-current liabilities | | 3,567 | | | 1,506 | |
| | | | |
| Current income tax liabilities | | 137 | | | 136 | |
| Other liabilities | | 430 | | | 345 | |
| Trade payables | | 2,233 | | | 1,188 | |
| Derivative financial instruments | | 8 | | | 1 | |
| Lease liabilities | | 52 | | | 49 | |
| Borrowings | | 940 | | | 499 | |
| Total current liabilities | | 3,801 | | | 2,217 | |
| | | | |
| Total liabilities | | 7,367 | | | 3,723 | |
| | | | |
Total equity and liabilities | | 24,179 | | | 17,492 | |
Statement of Cash Flows
| | | | | | | | | | | | | | | | | | | | | | | |
| $ MILLION | | 4Q23 | 3Q23 | 4Q22 | | 2023 | 2022 |
| | | | | | | |
| Result for the period | | 554 | | (783) | | 59 | | | 986 | | 2,093 | |
| | | | | | | |
| Adjustments for: | | | | | | | |
| Depreciation and amortization | | 191 | | 165 | | 160 | | | 658 | | 616 | |
| Income tax accruals less payments | | (45) | | 158 | | (90) | | | (161) | | (1,196) | |
| Equity in earnings of non-consolidated companies | | (24) | | (19) | | (19) | | | (105) | | (37) | |
| Impairment charge | | 42 | | — | | 99 | | | 42 | | 99 | |
| Interest accruals less payments/receipts, net | | (34) | | 1 | | (34) | | | (45) | | (25) | |
| Changes in provisions | | (61) | | (4) | | 0 | | | (64) | | (1) | |
| Changes in working capital | | 320 | | 388 | | 955 | | | 321 | | 1,152 | |
| Net foreign exchange results and others | | (225) | | 8 | | (100) | | | (236) | | 51 | |
| Non-cash effects related to the increase of the participation in Usiminas | | — | | 1,106 | | — | | | 1,106 | | — | |
| Net cash provided by operating activities | | 718 | | 1,020 | | 1,032 | | | 2,501 | | 2,753 | |
| | | | | | | |
| Capital expenditures and advances to suppliers for PP&E | | (597) | | (430) | | (159) | | | (1,461) | | (581) | |
| Decrease (increase) in other investments | | 129 | | (333) | | (444) | | | (718) | | (771) | |
| Proceeds from the sale of property, plant & equipment | | 1 | | 1 | | 1 | | | 2 | | 2 | |
| Dividends received from non-consolidated companies | | 28 | | — | | — | | | 43 | | 29 | |
| Acquisition of non-controlling interest | | — | | — | | — | | | — | | (4) | |
| Acquisition of business: | | | | | | | |
| Purchase consideration | | — | | (119) | | — | | | (119) | | — | |
| Cash acquired | | — | | 781 | | — | | | 781 | | — | |
| Net cash (used in) investing activities | | (439) | | (100) | | (602) | | | (1,470) | | (1,325) | |
| | | | | | | |
| Dividends paid in cash to company’s shareholders | | (216) | | — | | (177) | | | (569) | | (530) | |
| Finance lease payments | | (16) | | (16) | | (12) | | | (59) | | (49) | |
| Proceeds from borrowings | | 119 | | 163 | | 61 | | | 355 | | 286 | |
| Repayments of borrowings | | (121) | | (145) | | (108) | | | (493) | | (723) | |
| Net cash (used in) provided by financing activities | | (234) | | 3 | | (236) | | | (766) | | (1,016) | |
| | | | | | | |
| Increase in cash and cash equivalents | | 45 | | 923 | | 194 | | | 264 | | 412 | |
Shipments
Steel and Mining Segments
| | | | | | | | | | | | | | | | | | | | | | | | | | | | | | | | |
| THOUSAND TONS | | 4Q23 | 3Q23 | DIF | 4Q22 | DIF | | 2023 | 2022 | DIF |
| | | | | | | | | | |
| Mexico | | 2,122 | | 2,135 | | -1 | % | 1,873 | | 13 | % | | 8,355 | | 6,843 | | 22 | % |
| Brazil | | 186 | | 194 | | -4 | % | 182 | | 2 | % | | 486 | | 723 | | -33 | % |
| Southern Region | | 486 | | 558 | | -13 | % | 589 | | -18 | % | | 2,151 | | 2,362 | | -9 | % |
| Other Markets | | 391 | | 408 | | -4 | % | 376 | | 4 | % | | 1,537 | | 1,968 | | -22 | % |
| Total steel products | | 3,185 | | 3,296 | | -3 | % | 3,020 | | 5 | % | | 12,529 | | 11,896 | | 5 | % |
| Mining products (Intercompany) | | 894 | | 842 | | 6 | % | 891 | | 0 | % | | 3,402 | | 3,457 | | -2 | % |
Usiminas Segment
| | | | | | | | | | | | | | | | | | | | | | | | | | | | | | | | |
| THOUSAND TONS | | 4Q23 | 3Q23 | DIF | 4Q22 | DIF | | 2023 | 2022 | DIF |
| | | | | | | | | | |
| Mexico | | — | | — | | | | | | — | | | |
| Brazil | | 942 | | 955 | | -1 | % | | | | 1,897 | | | |
| Southern Region | | 76 | | 45 | | 69 | % | | | | 121 | | | |
| Other Markets | | 30 | | 39 | | -23 | % | | | | 69 | | | |
| Total Usiminas steel products | | 1,048 | | 1,038 | | 1 | % | | | | 2,086 | | | |
| Intercompany shipments | | 431 | | 215 | | 100 | % | | | | 646 | | | |
| Third-party shipments | | 1,952 | | 2,176 | | -10 | % | | | | 4,128 | | | |
| Total Usiminas mining products | | 2,383 | | 2,391 | | 0 | % | | | | 4,774 | | | |
Consolidated
| | | | | | | | | | | | | | | | | | | | | | | | | | | | | | | | |
| THOUSAND TONS | | 4Q23 | 3Q23 | DIF | 4Q22 | DIF | | 2023 | 2022 | DIF |
| | | | | | | | | | |
| Mexico | | 2,122 | | 2,135 | | -1 | % | 1,873 | | 13 | % | | 8,355 | | 6,843 | | 22 | % |
| Brazil | | 952 | | 957 | | -1 | % | 182 | | | | 2,014 | | 723 | | |
| Southern Region | | 561 | | 603 | | -7 | % | 589 | | -5 | % | | 2,271 | | 2,362 | | -4 | % |
| Other Markets | | 399 | | 436 | | -8 | % | 376 | | 6 | % | | 1,573 | | 1,968 | | -20 | % |
| Total steel products | | 4,035 | | 4,131 | | -2 | % | 3,020 | | 34 | % | | 14,213 | | 11,896 | | 19 | % |
| Mining products | | 1,952 | | 2,176 | | -10 | % | 0 | | | | 4,128 | | 0 | | |
Net Sales
Steel and Mining Segments
| | | | | | | | | | | | | | | | | | | | | | | | | | | | | | | | |
| $ MILLION | | 4Q23 | 3Q23 | DIF | 4Q22 | DIF | | 2023 | 2022 | DIF |
| | | | | | | | | | |
| Mexico | | 2,265 | | 2,383 | | -5 | % | 1,954 | | 16 | % | | 9,311 | | 8,828 | | 5 | % |
| Brazil | | 114 | | 148 | | -23 | % | 115 | | -1 | % | | 342 | | 582 | | -41 | % |
| Southern Region | | 805 | | 874 | | -8 | % | 950 | | -15 | % | | 3,402 | | 3,834 | | -11 | % |
| Other Markets | | 452 | | 495 | | -9 | % | 462 | | -2 | % | | 1,841 | | 2,848 | | -35 | % |
| Total steel products | | 3,636 | | 3,900 | | -7 | % | 3,481 | | 4 | % | | 14,897 | | 16,092 | | -7 | % |
| Other products | | 82 | | 81 | | 0 | % | 65 | | 26 | % | | 298 | | 323 | | -8 | % |
| Total steel segment | | 3,718 | | 3,982 | | -7 | % | 3,546 | | 5 | % | | 15,194 | | 16,414 | | -7 | % |
| Mining products (Intercompany) | | 192 | | 114 | | 69 | % | 96 | | 99 | % | | 500 | | 411 | | 22 | % |
Note: other products include mainly electricity sales in Mexico and Brazil.
Usiminas Segment
| | | | | | | | | | | | | | | | | | | | | | | | | | | | | | | | |
| $ MILLION | | 4Q23 | 3Q23 | DIF | 4Q22 | DIF | | 2023 | 2022 | DIF |
| | | | | | | | | | |
| Mexico | | — | | — | | | | | | — | | | |
| Brazil | | 1,059 | | 1,134 | | -7 | % | | | | 2,193 | | | |
| Southern Region | | 100 | | 68 | | 47 | % | | | | 168 | | | |
| Other Markets | | 23 | | 20 | | 15 | % | | | | 43 | | | |
| Total Usiminas steel products | | 1,182 | | 1,221 | | -3 | % | | | | 2,403 | | | |
| Intercompany | | 32 | | 14 | | 129 | % | | | | 46 | | | |
| Third parties | | 180 | | 149 | | 21 | % | | | | 329 | | | |
| Total Usiminas mining products | | 212 | | 162 | | 31 | % | | | | 375 | | | |
| Usiminas segment consolidated net sales | | 1,362 | | 1,370 | | -1 | % | | | | 2,732 | | | |
Net Sales (cont.)
Consolidated
| | | | | | | | | | | | | | | | | | | | | | | | | | | | | | | | |
| $ MILLION | | 4Q23 | 3Q23 | DIF | 4Q22 | DIF | | 2023 | 2022 | DIF |
| | | | | | | | | | |
| Mexico | | 2,265 | | 2,383 | | -5 | % | 1,954 | | 16 | % | | 9,311 | | 8,828 | | 5 | % |
| Brazil | | 1,064 | | 1,136 | | -6 | % | 115 | | | | 2,279 | | 582 | | |
| Southern Region | | 905 | | 941 | | -4 | % | 950 | | -5 | % | | 3,569 | | 3,834 | | -7 | % |
| Other Markets | | 455 | | 504 | | -10 | % | 462 | | -1 | % | | 1,853 | | 2,848 | | -35 | % |
| Total steel products | | 4,689 | | 4,964 | | -6 | % | 3,481 | | 35 | % | | 17,013 | | 16,092 | | 6 | % |
| Mining products | | 180 | | 149 | | 21 | % | 0 | | | | 329 | | 0 | | |
| Other products | | 62 | | 72 | | -15 | % | 65 | | -5 | % | | 268 | | 323 | | -17 | % |
| Total net sales | | 4,931 | | 5,185 | | -5 | % | 3,546 | | 39 | % | | 17,610 | | 16,414 | | 7 | % |
Note: other products include mainly electricity sales in Mexico and Brazil.
Exhibit I - Alternative performance measures
These non-IFRS measures should not be considered in isolation of, or as a substitute for, measures of performance prepared in accordance with IFRS. These non-IFRS measures do not have a standardized meaning under IFRS and, therefore, may not correspond to similar non-IFRS financial measures reported by other companies.
Adjusted EBITDA
| | | | | | | | | | | | | | | | | | | | | | | |
| $ MILLION | | 4Q23 | 3Q23 | 4Q22 | | 2023 | 2022 |
| | | | | | | |
| Net income (loss) | | 554 | | (783) | | 59 | | | 986 | | 2,093 | |
| Adjusted to exclude: | | | | | | | |
| Income tax results | | 156 | | 253 | | 11 | | | 334 | | 574 | |
| Equity in earnings of non-consolidated companies | | (24) | | (19) | | (19) | | | (105) | | (37) | |
| Net financial results | | (103) | | (30) | | (9) | | | (123) | | 70 | |
| Reversal of Usiminas’ post-retirement liabilities | | (109) | | — | | — | | | (109) | | — | |
| Contingency reversal - dismissal of public civil action against Usiminas | | (63) | | — | | — | | | (63) | | — | |
| Non-cash effects related to the increase in the participation in Usiminas | | — | | 1,106 | | — | | | 1,106 | | — | |
Impairment of Ternium’s investment in Ternium Brasil | | — | | — | | 99 | | | — | | 99 | |
Impairment on Las Encinas’ mining assets | | 42 | | — | | — | | | 42 | | — | |
| Depreciation and amortization | | 191 | | 165 | | 160 | | | 658 | | 616 | |
| Adjusted to include: | | | | | | | |
| Proportional EBITDA in Unigal (70% participation) | | 8 | | 6 | | — | | | 14 | | — | |
| Adjusted EBITDA | | 651 | | 698 | | 303 | | | 2,740 | | 3,415 | |
| Divided by: net sales | | 4,931 | | 5,185 | | 3,546 | | | 17,610 | | 16,414 | |
| Adjusted EBITDA Margin (%) | | 13 | % | 13 | % | 9 | % | | 16 | % | 21 | % |
Adjusted Net Income
| | | | | | | | | | | | | | | | | | | | | | | |
| $ MILLION | | 4Q23 | 3Q23 | 4Q22 | | 2023 | 2022 |
| | | | | | | |
Net income (loss) | | 554 | | (783) | | 59 | | | 986 | | 2,093 | |
| Less: non-cash effects related to the increase in the participation in Usiminas | | — | | (1,106) | | — | | | (1,106) | | — | |
| Adjusted Net Income | | | 554 | | | 323 | | | 59 | | | | 2,092 | | | 2,093 | |
Exhibit I - Alternative performance measures (cont.)
Adjusted Equity Holders' Net Income and Adjusted Earnings per ADS
| | | | | | | | | | | | | | | | | | | | | | | |
| $ MILLION | | 4Q23 | 3Q23 | 4Q22 | | 2023 | 2022 |
| | | | | | | |
Equity holders’ net income (loss) | | 414 | | (739) | | 40 | | | 676 | | 1,768 | |
| Less: non-cash effects related to the increase in the participation in Usiminas | | — | | (1,010) | | — | | | (1,010) | | — | |
Adjusted Equity Holders’ Net Income | | 414 | | 271 | | 40 | | | 1,686 | | 1,768 | |
Divided by: outstanding shares of common stock, net of treasury shares (expressed in ADS equivalent) | | 196 | | 196 | | 196 | | | 196 | | 196 | |
Adjusted Earnings per ADS ($) | | | 2.11 | | | 1.38 | | | 0.20 | | | | 8.59 | | | 9.00 | |
Free Cash Flow
| | | | | | | | | | | | | | | | | | | | | | | |
| $ MILLION | | 4Q23 | 3Q23 | 4Q22 | | 2023 | 2022 |
| | | | | | | |
| Net cash provided by operating activities | | 718 | | 1,020 | | 1,032 | | | 2,501 | | 2,753 | |
| Less: capital expenditures and advances to suppliers for PP&E | | (597) | | (430) | | (159) | | | (1,461) | | (581) | |
| Free cash flow | | 121 | | 590 | | 873 | | | 1,040 | | 2,172 | |
Note: Free Cash Flow in the comparative quarters in 2023 has been modified due to a reclassification, moving the following amounts from Interest accruals less payments to Other investments: $27 million in the third quarter of 2023, $46 million in the second quarter of 2023 and $18 million in the first quarter of 2023.
Net Cash Position
| | | | | | | | | | | | | | |
| $ BILLION | | DECEMBER 31, 2023 | SEPTEMBER 30, 2023 | DECEMBER 31, 2022 |
| | | | |
Cash and cash equivalents3 | | 1.8 | | 1.8 | | 1.7 | |
Plus: other investments (current and non-current)3 | | 2.2 | | 2.7 | | 2.0 | |
| Less: borrowings (current and non-current) | | (2.1) | | (2.2) | | (1.0) | |
| Net cash position | | 1.9 | | 2.4 | | 2.6 | |
3 Ternium Argentina’s consolidated position of cash and cash equivalents and other investments amounted to $1.1 billion as of December 31, 2023, $1.2 billion as of September 30, 2023, and $1.3 billion as of December 31, 2022.
Ternium (NYSE:TX)
Gráfico Histórico do Ativo
De Dez 2024 até Dez 2024

Ternium (NYSE:TX)
Gráfico Histórico do Ativo
De Dez 2023 até Dez 2024
