false
0001600438
0001600438
2024-03-05
2024-03-05
iso4217:USD
xbrli:shares
iso4217:USD
xbrli:shares
UNITED STATES
SECURITIES AND
EXCHANGE COMMISSION
Washington,
D.C. 20549
FORM 8-K
CURRENT REPORT
Pursuant to Section 13
or 15(d) of the Securities Exchange Act of 1934
Date of Report (Date of
earliest event reported): March 5, 2024
GMS INC.
(Exact name of
registrant as specified in charter)
| Delaware |
|
001-37784 |
|
46-2931287 |
(State or Other Jurisdiction
of Incorporation) |
|
(Commission
File Number) |
|
(I.R.S. Employer
Identification No.) |
100 Crescent Centre Parkway, Suite 800
Tucker, Georgia |
|
30084 |
| (Address of Principal Executive Offices) |
|
(Zip Code) |
Registrant’s
telephone number, including area code: (800) 392-4619
Check the appropriate box below if
the Form 8-K filing is intended to simultaneously satisfy the filing obligation of the registrant under any of the following
provisions:
| ¨ | Written
communications pursuant to Rule 425 under the Securities Act (17 CFR 230.425) |
| ¨ | Soliciting
material pursuant to Rule 14a-12 under the Exchange Act (17 CFR 240.14a-12) |
| ¨ | Pre-commencement
communications pursuant to Rule 14d-2(b) under the Exchange Act (17 CFR 240.14d-2(b)) |
| ¨ | Pre-commencement
communications pursuant to Rule 13e-4(c) under the Exchange Act (17 CFR 240.13e-4(c)) |
Securities registered pursuant to Section 12(b) of
the Act:
| Title of each class |
|
Trading Symbol(s) |
|
Name of each exchanged on which registered |
| Common Stock, par value $0.01 per share |
|
GMS |
|
New York Stock Exchange |
Indicate by check mark whether the
registrant is an emerging growth company as defined in Rule 405 of the Securities Act of 1933 (§230.405 of this chapter)
or Rule 12b-2 of the Securities Exchange Act of 1934 (§240.12b-2 of this chapter).
Emerging
growth company ¨
If
an emerging growth company, indicate by check mark if the registrant has elected not to use the extended transition period for
complying with any new or revised financial accounting standards provided pursuant to Section 13(a) of the Exchange
Act ¨
Item 7.01. Regulation FD Disclosure.
The slide presentation furnished as Exhibit 99.1 hereto, and incorporated
herein by reference, will be presented to certain investors of GMS on March 5, 2024, and may be used by GMS in various other presentations
to investors on or after March 5, 2024.
In accordance with General Instruction B.2 of Form 8-K, the information
in this Item 7.01 of this Current Report on Form 8-K, including Exhibit 99.1 attached hereto, shall not be deemed “filed”
for purposes of Section 18 of the Securities Exchange Act of 1934, as amended (the “Exchange Act”), or otherwise subject
to the liabilities of that section, nor shall it be deemed incorporated by reference in any filing under the Securities Act of 1933, as
amended, or the Exchange Act, except as shall be expressly set forth by specific reference in such a filing.
Item 9.01. Financial Statements and Exhibits.
(d) Exhibits.
*Furnished herewith
SIGNATURES
Pursuant to the requirements of the Securities
Exchange Act of 1934, the Registrant has duly caused this report to be signed on its behalf by the undersigned hereunto duly authorized.
| |
GMS INC. |
| |
|
|
|
| |
|
|
|
| Date: March 5, 2024 |
By: |
/s/ Scott M. Deakin |
| |
|
Name: |
Scott M. Deakin |
| |
|
Title: |
Chief Financial Officer |
Exhibit 99.1

Investor Overview March 2024

2 Safe Harbor and B asis of Presentation Forward - Looking Statement Safe Harbor — This presentation includes “forward - looking statements” within the meaning of the Private Securities Litigation Reform Act of 1995. You can generally identify forward - looking statements by the Company’s use of forward - looking terminology such as “anticipate,” “bel ieve,” “confident,” “continue,” “could,” “estimate,” “expect,” “intend,” “may,” “might,” “plan,” “potential,” “predict,” “seek,” or “should,” or the negative thereof or other variations th ere on or comparable terminology. In particular, statements about the markets in which GMS operates and our products, including potential or expected growth in those markets and products, the eco nom y generally, our ability to continue successfully navigating the evolving operating environment and executing our business, strategic initiatives and priorities and growth pot ent ial, closing of acquisitions and integration of such acquisitions, future M&A and greenfields, inflation, capital structure, pricing (including but not limited to, fluctuations i n c ommodity pricing), volumes, net sales, organic sales, gross margins, net income, incremental EBITDA, Adjusted EBITDA, Adjusted EBITDA margin, interest expense, capital expenditures, fre e c ash flow, tax rates, future financial performance and liquidity, and the ability of the Company to grow stronger contained in this presentation may be considered forward - looking stat ements. Statements about our expectations, beliefs, plans, strategies, objectives, prospects, assumptions or future events or performance may be considered forward - looking statements. The Company has based forward - looking statements on its current expectations, assumptions, estimates and projections. While the Company believes these expectations, assumptions, es timates and projections are reasonable, such forward - looking statements are only predictions and involve known and unknown risks and uncertainties, many of which are beyond its c ont rol. Forward - looking statements involve risks and uncertainties, including, but not limited to, those described in the “Risk Factors” section in the Company’s most recent Annu al Report on Form 10 - K, and in its other periodic reports filed with the SEC. In addition, the statements in this release are made as of March 4, 2024. The Company undertakes no obligation to update any of the forward - looking statements made herein, whether as a result of new information, future events, changes in expectation or otherwise. These forward - looking statem ents should not be relied upon as representing the Company’s views as of any date subsequent to March 4,2024. Use of Non - GAAP and Adjusted Financial Information — To supplement GAAP financial information, we use adjusted measures of operating results which are non - GAAP measures. This non - GAAP adjusted financial information is provided as additional information for investors. These adjusted results exclude certain costs, expenses, gains and losses, and we believe their exclusion can enhance an overall understanding of our past financial performance and also our prospects for the fu ture. These adjustments to our GAAP results are made with the intent of providing both management and investors a more complete understanding of our operating performance by excl udi ng non - recurring, infrequent or other non - cash charges that are not believed to be material to the ongoing performance of our business. The presentation of this additional inf ormation is not meant to be considered in isolation or as a substitute for GAAP measures of net income, diluted earnings per share or net cash provided by (used in) operating activities pr epared in accordance with generally accepted accounting principles in the United States. Please see the Appendix to this presentation for a further discussion on these non - GAAP measure s and a reconciliation of these non - GAAP measures to the most directly comparable GAAP measures.
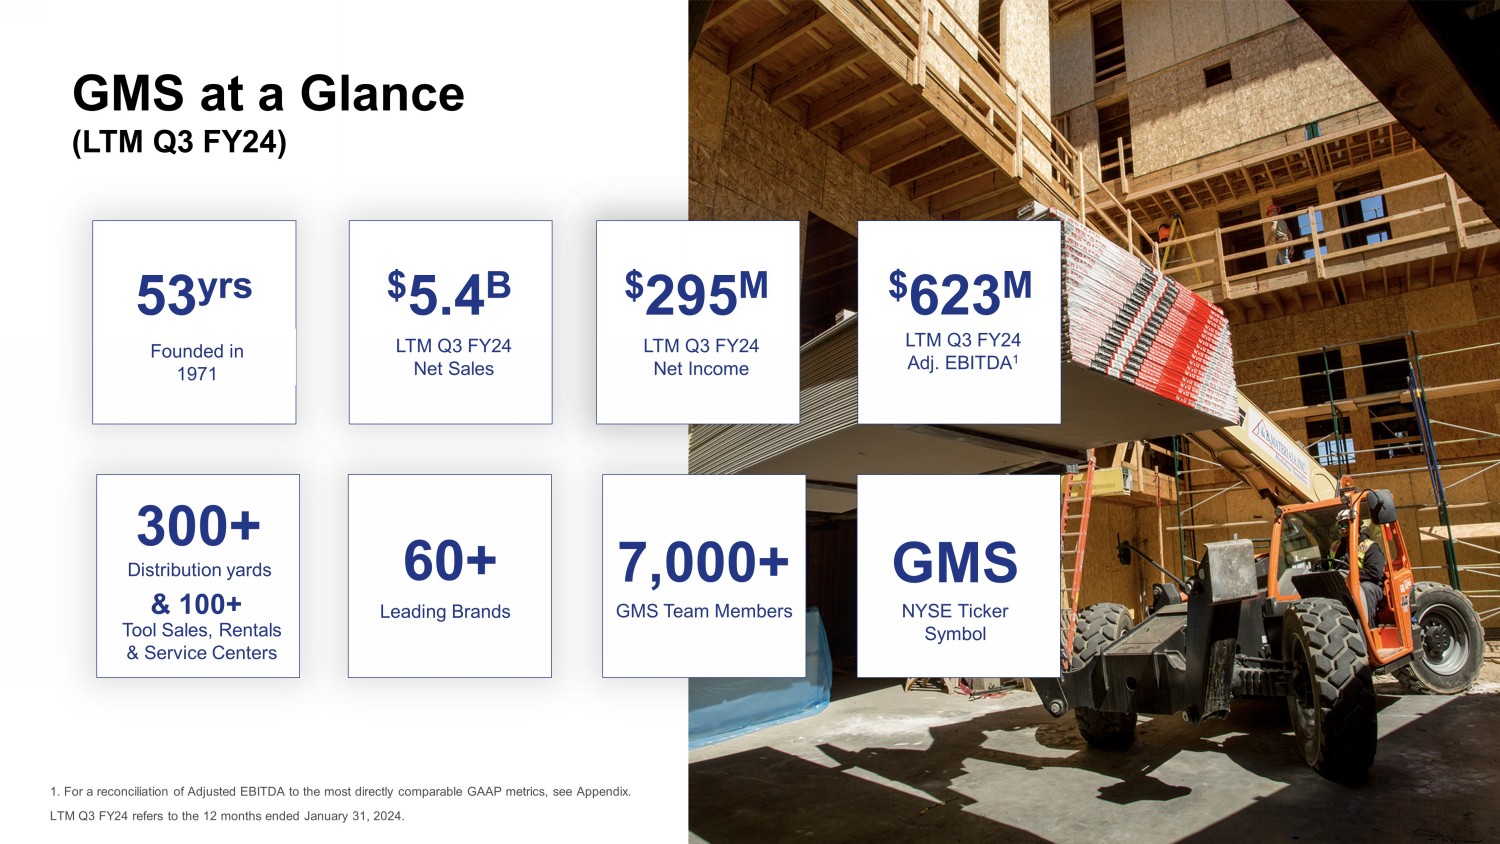
3 Fiscal 2022 Net Sales 53 yrs LTM Q3 FY24 Net Sales $ 5.4 B 300+ Distribution yards GMS at a Glance (LTM Q3 FY24) 7,000+ GMS Team Members NYSE Ticker Symbol GMS & 100+ Tool Sales, Rentals & Service Centers 1. For a reconciliation of Adjusted EBITDA to the most directly comparable GAAP metrics, see Appendix. LTM Q3 FY24 refers to the 12 months ended January 31, 2024. LTM Q3 FY24 Net Income $ 295 M Founded in 1971 Leading Brands 60+ LTM Q3 FY24 Adj. EBITDA 1 $ 623 M

4 Diversified and Balanced End Market Exposure Diversified exposure across commercial and residential new and repair and remodel construction markets continues to be an advantage Residential • Single - Family New • Multi - Family New • Repair & Remodel ~45% Commercial • New Construction • Repair & Remodel ~55% While these percentages fluctuate from time to time as market conditions change, the numbers shown reflect the Company’s “thr oug h the cycle” expectations.

5 Providing Value to Contractors and Builders GMS provides a complementary and complete product offering with value - added service delivery to the contractor s who install wallboard, ceilings, steel framing and ancillary products needed to complete the job Note: LTM Q3 FY24 refers to the twelve months ended January 31, 2024. 1 Complementary products consists of Tools & Fasteners, Insulation, Joint Treatment, Lumber, EIFS/Stucco and Other 1 A leading North American specialty distributor of construction products GMS provides the products and value - added services to contractors who install wallboard, ceilings, steel framing and other complementary building products • Expertise across local markets, leveraging scaled North American footprint • One - stop - shop for contractors with a broad product offering • Critical link between suppliers and a highly fragmented customer base Wallboard 41% Ceilings 12% Steel Framing 17% Complementary Products 30% LTM Q3 FY24
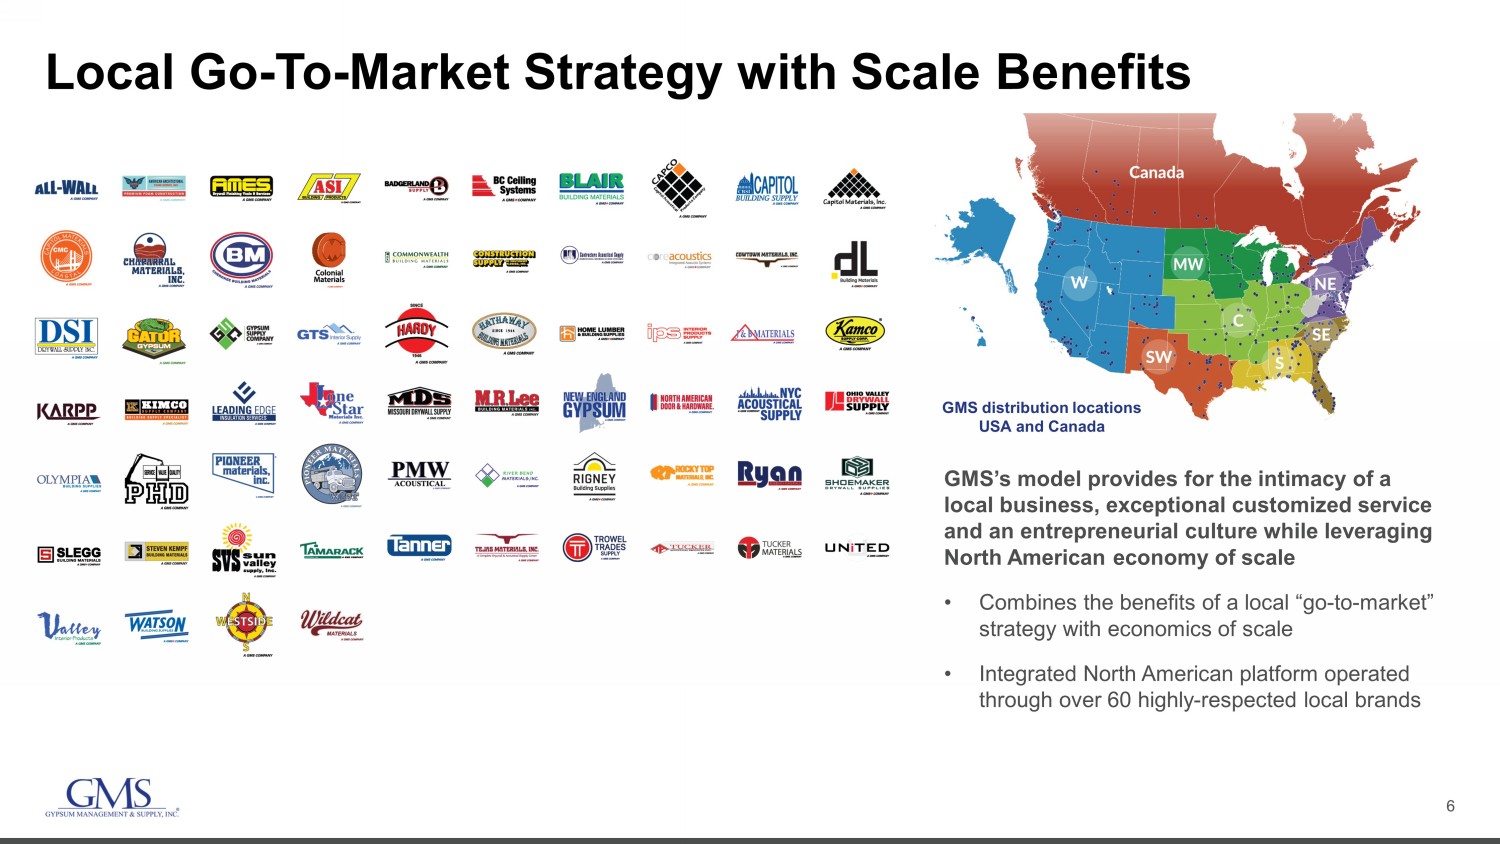
6 Local Go - To - Market Strategy with Scale Benefits GMS distribution locations USA and Canada GMS’s model provides for the intimacy of a local business, exceptional customized service and an entrepreneurial culture while leveraging North American economy of scale • Combines the benefits of a local “go - to - market” strategy with economics of scale • Integrated North American platform operated through over 60 highly - respected local brands
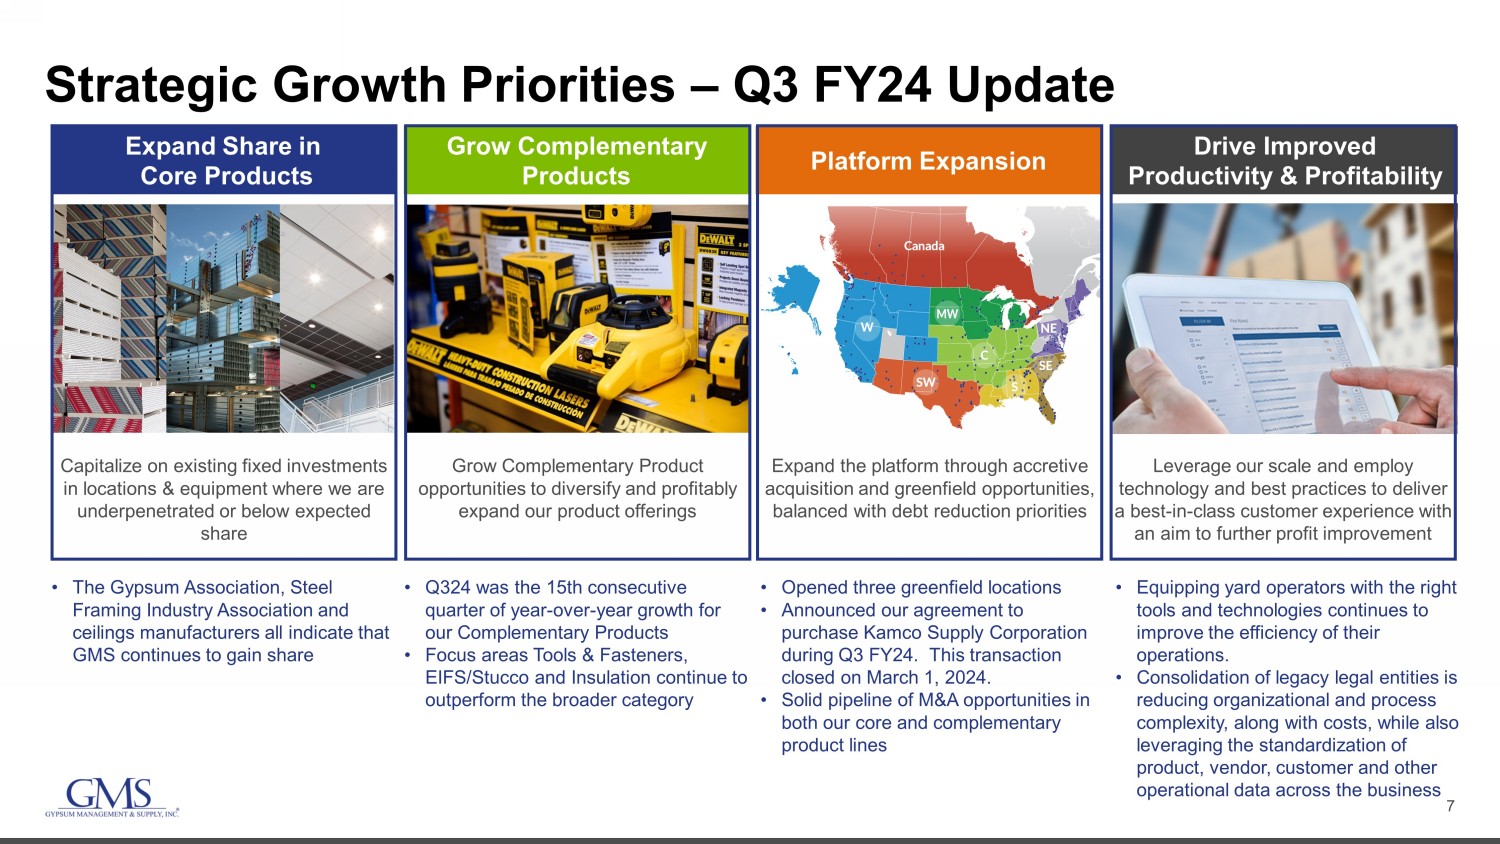
7 Drive Improved Productivity & Profitability Strategic Growth Priorities – Q3 FY24 Update Capitalize on existing fixed investments in locations & equipment where we are underpenetrated or below expected share Grow Complementary Product opportunities to diversify and profitably expand our product offerings Expand the platform through accretive acquisition and greenfield opportunities, balanced with debt reduction priorities Leverage our scale and employ technology and best practices to deliver a best - in - class customer experience with an aim to further profit improvement Expand Share in Core Products Grow Complementary Products Platform Expansion • The Gypsum Association, Steel Framing Industry Association and ceilings manufacturers all indicate that GMS continues to gain share • Q324 was the 15th consecutive quarter of year - over - year growth for our Complementary Products • Focus areas Tools & Fasteners, EIFS/Stucco and Insulation continue to outperform the broader category • Opened three greenfield locations • Announced our agreement to purchase Kamco Supply Corporation during Q3 FY24. This transaction closed on March 1, 2024. • Solid pipeline of M&A opportunities in both our core and complementary product lines • Equipping yard operators with the right tools and technologies continues to improve the efficiency of their operations. • Consolidation of legacy legal entities is reducing organizational and process complexity, along with costs, while also leveraging the standardization of product, vendor, customer and other operational data across the business
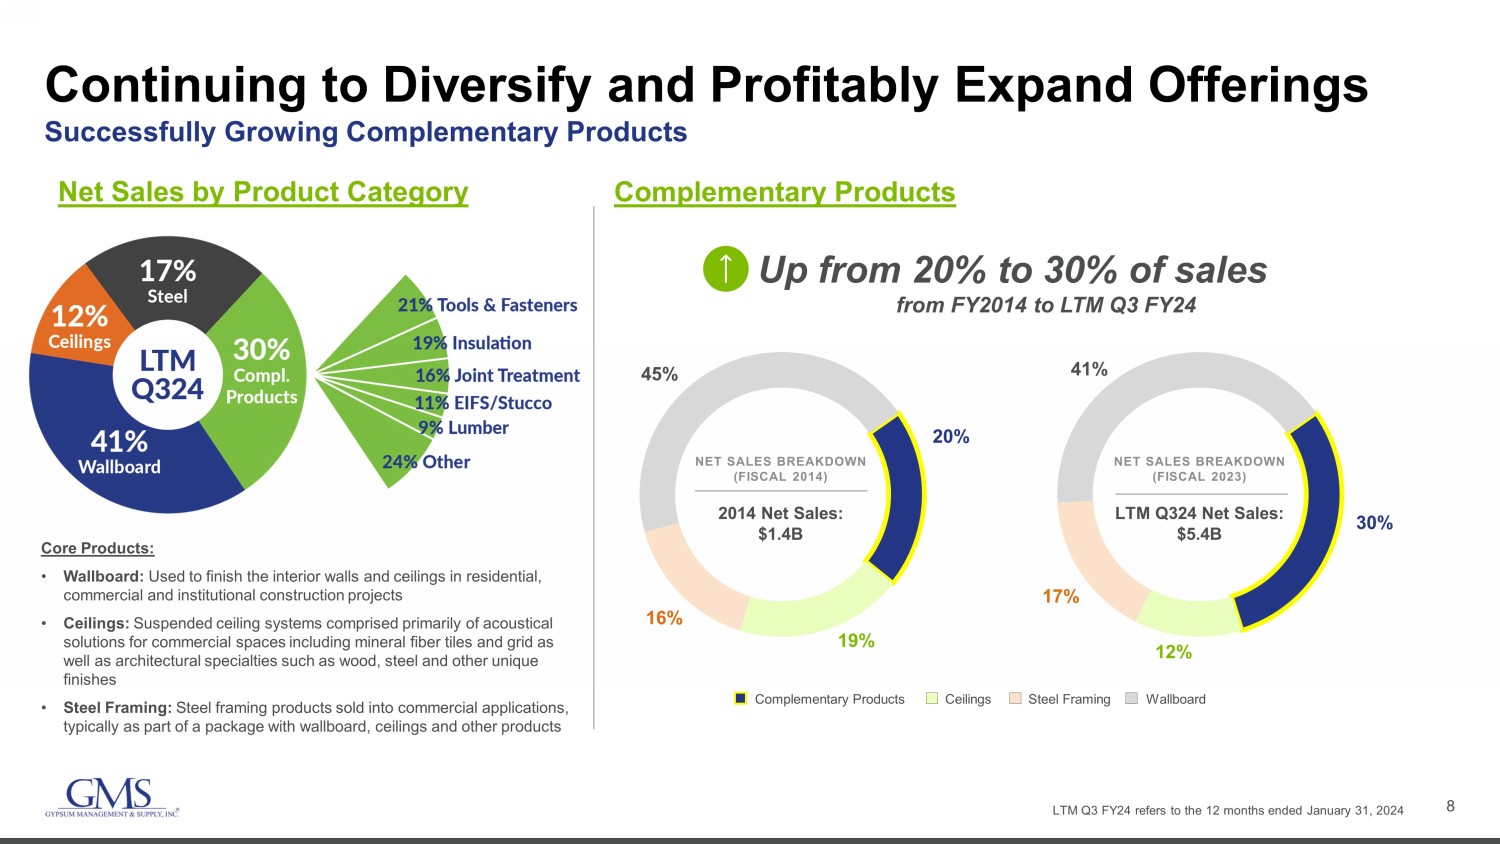
8 20% 19% 16% 45% 30% 12% 17% 41% Continuing to Diversify and Profitably Expand Offerings Successfully Growing Complementary Products Complementary Products 2014 Net Sales: $1.4B NET SALES BREAKDOWN (FISCAL 2014) LTM Q324 Net Sales: $5.4B NET SALES BREAKDOWN (FISCAL 2023) Complementary Products Ceilings Steel Framing Wallboard Up from 20% to 30% of sales from FY2014 to LTM Q3 FY24 Net Sales by Product Category Core Products: • Wallboard: Used to finish the interior walls and ceilings in residential, commercial and institutional construction projects • Ceilings: Suspended ceiling systems comprised primarily of acoustical solutions for commercial spaces including mineral fiber tiles and grid as well as architectural specialties such as wood, steel and other unique finishes • Steel Framing: Steel framing products sold into commercial applications, typically as part of a package with wallboard, ceilings and other products * LTM Q3 FY24 refers to the 12 months ended January 31, 2024

9 Opportunities for Further Platform Expansion • Opportunity to expand our geographic footprint in under - served and under - penetrated markets through accretive greenfield locations and acquisitions • Current footprint comprises over 300 distribution yard locations covering 47 U.S. States and 6 Canadian Provinces; Plus more than 100 AMES store locations • At least some level of presence in 78 of the Top 100 U.S. Metropolitan Statistical Areas (“MSA’s”) and 8 of the Top 10 Canadian Metropolitan Areas (“CMA’s”) • Significant whitespace and underpenetrated markets remaining in both the U.S. and Canada • Opportunities to develop “Complementary Products” in markets where GMS already has an established presence to drive further share gains GMS Distribution Location Map Legend Targeted Expansion Area California Mountain West Western Canada South Central Texas Central Midwest Gulf Coast New England Eastern Canada South Florida AMES Location As of Jan 2024
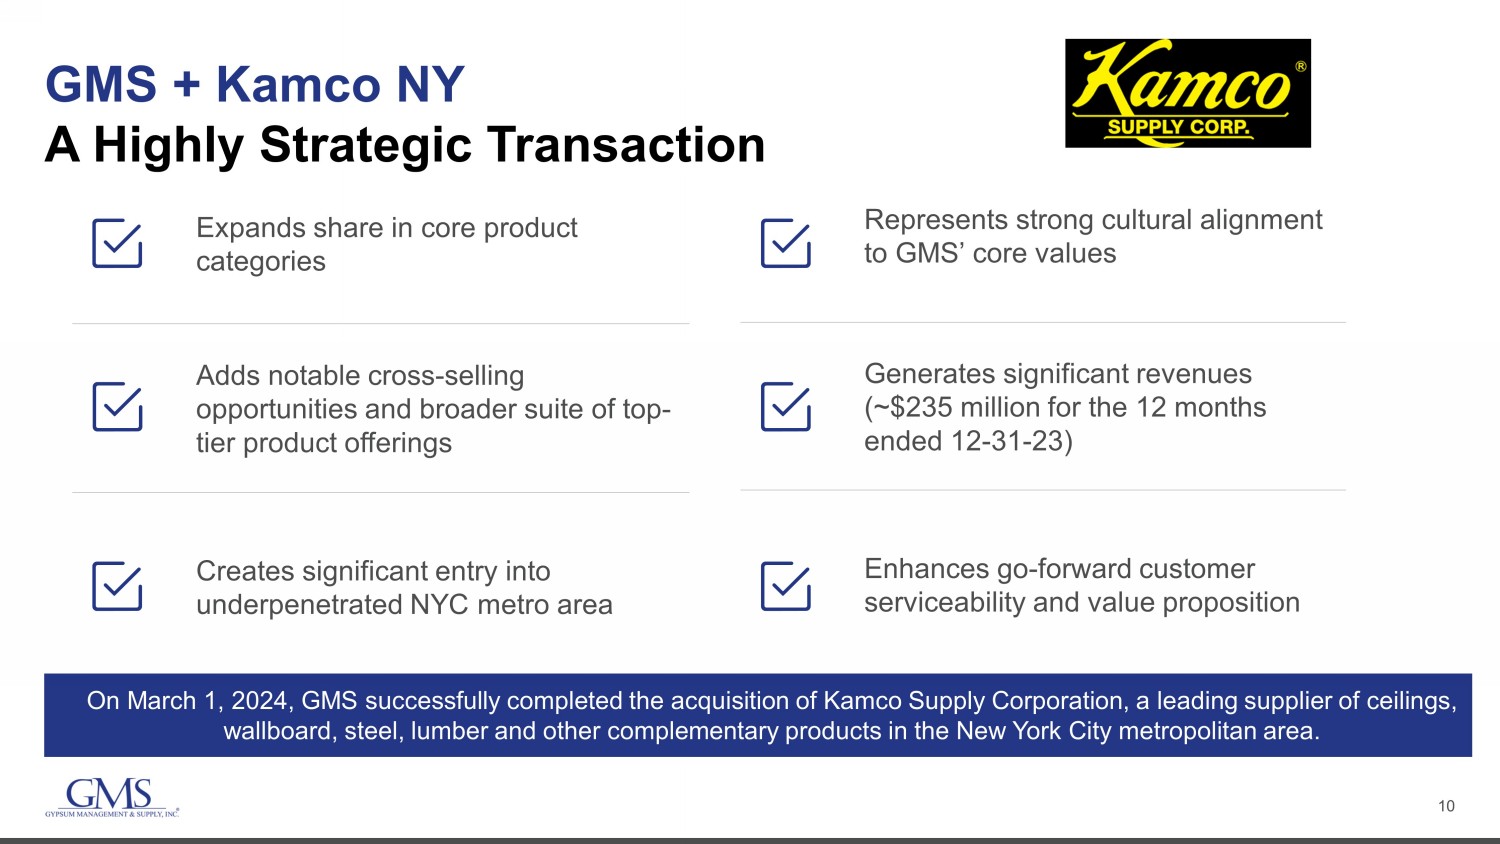
10 Expands share in core product categories Adds notable cross - selling opportunities and broader suite of top - tier product offerings Creates significant entry into underpenetrated NYC metro area GMS + Kamco NY A Highly Strategic Transaction Represents strong cultural alignment to GMS’ core values Generates significant revenues (~$235 million for the 12 months ended 12 - 31 - 23) Enhances go - forward customer serviceability and value proposition On March 1, 2024, GMS successfully completed the acquisition of Kamco Supply Corporation, a leading supplier of ceilings, wallboard, steel, lumber and other complementary products in the New York City metropolitan area.
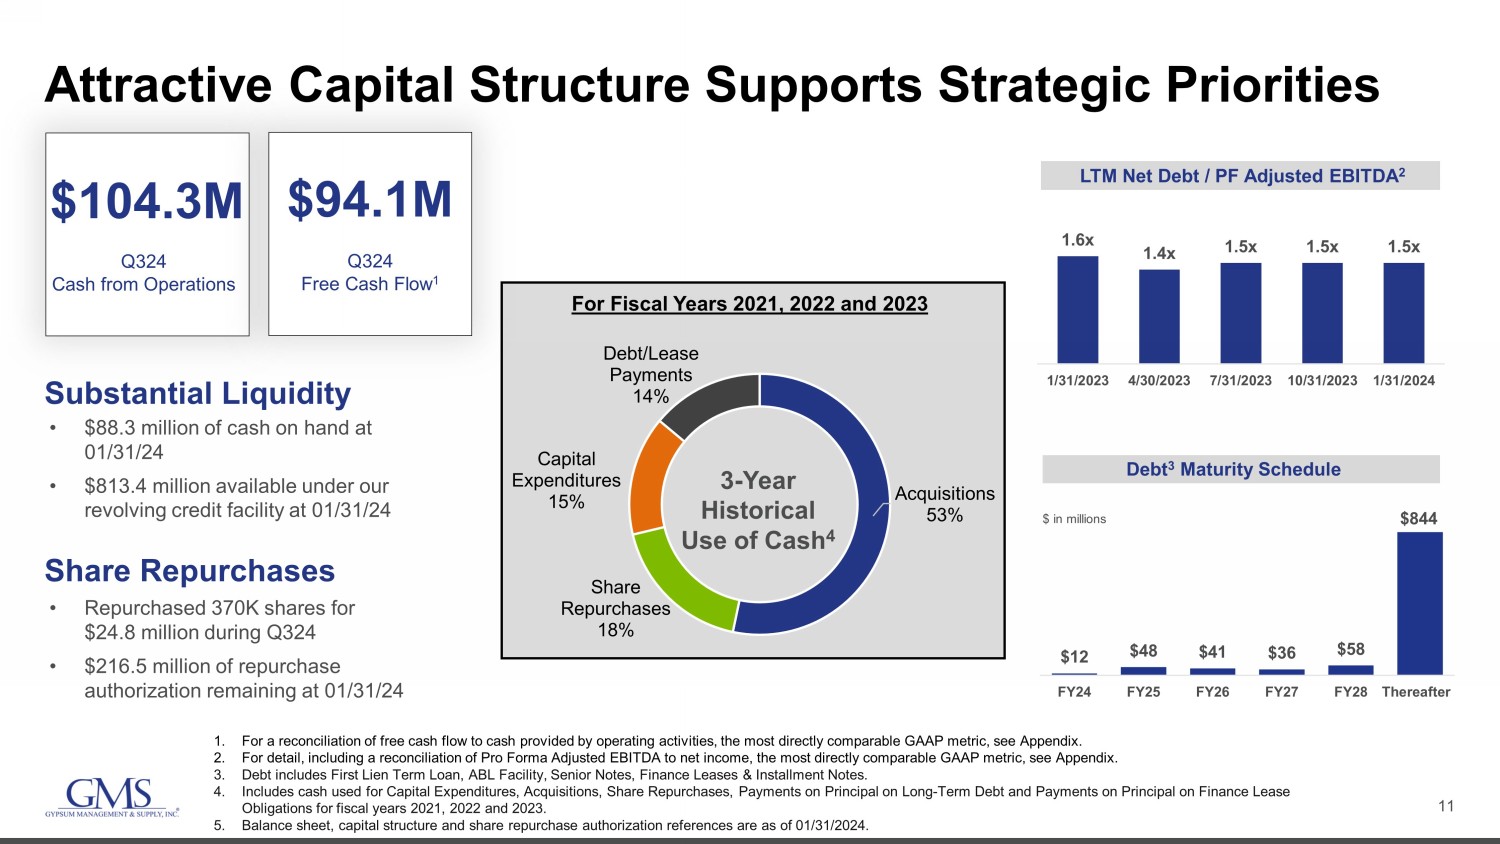
11 Attractive Capital Structure Supports Strategic Priorities • Repurchased 370K shares for $24.8 million during Q324 • $216.5 million of repurchase authorization remaining at 01/31/24 1.6x 1.4x 1.5x 1.5x 1.5x 1/31/2023 4/30/2023 7/31/2023 10/31/2023 1/31/2024 $12 $48 $41 $36 $58 $844 FY24 FY25 FY26 FY27 FY28 Thereafter LTM Net Debt / PF Adjusted EBITDA 2 Debt 3 Maturity Schedule $ in millions 1. For a reconciliation of free cash flow to cash provided by operating activities, the most directly comparable GAAP metric, se e A ppendix. 2. For detail, including a reconciliation of Pro Forma Adjusted EBITDA to net income, the most directly comparable GAAP metric, see Appendix. 3. Debt includes First Lien Term Loan, ABL Facility, Senior Notes, Finance Leases & Installment Notes. 4. Includes cash used for Capital Expenditures, Acquisitions, Share Repurchases, Payments on Principal on Long - Term Debt and Paymen ts on Principal on Finance Lease Obligations for fiscal years 2021, 2022 and 2023. 5. Balance sheet, capital structure and share repurchase authorization references are as of 01/31/2024. Share Repurchases Q324 Cash from Operations $104.3M Q324 Free Cash Flow 1 Substantial Liquidity • $88.3 million of cash on hand at 01/31/24 • $813.4 million available under our revolving credit facility at 01/31/24 Acquisitions 53% Share Repurchases 18% Capital Expenditures 15% Debt/Lease Payments 14% 3 - Year Historical Use of Cash 4 For Fiscal Years 2021, 2022 and 2023 $94.1M
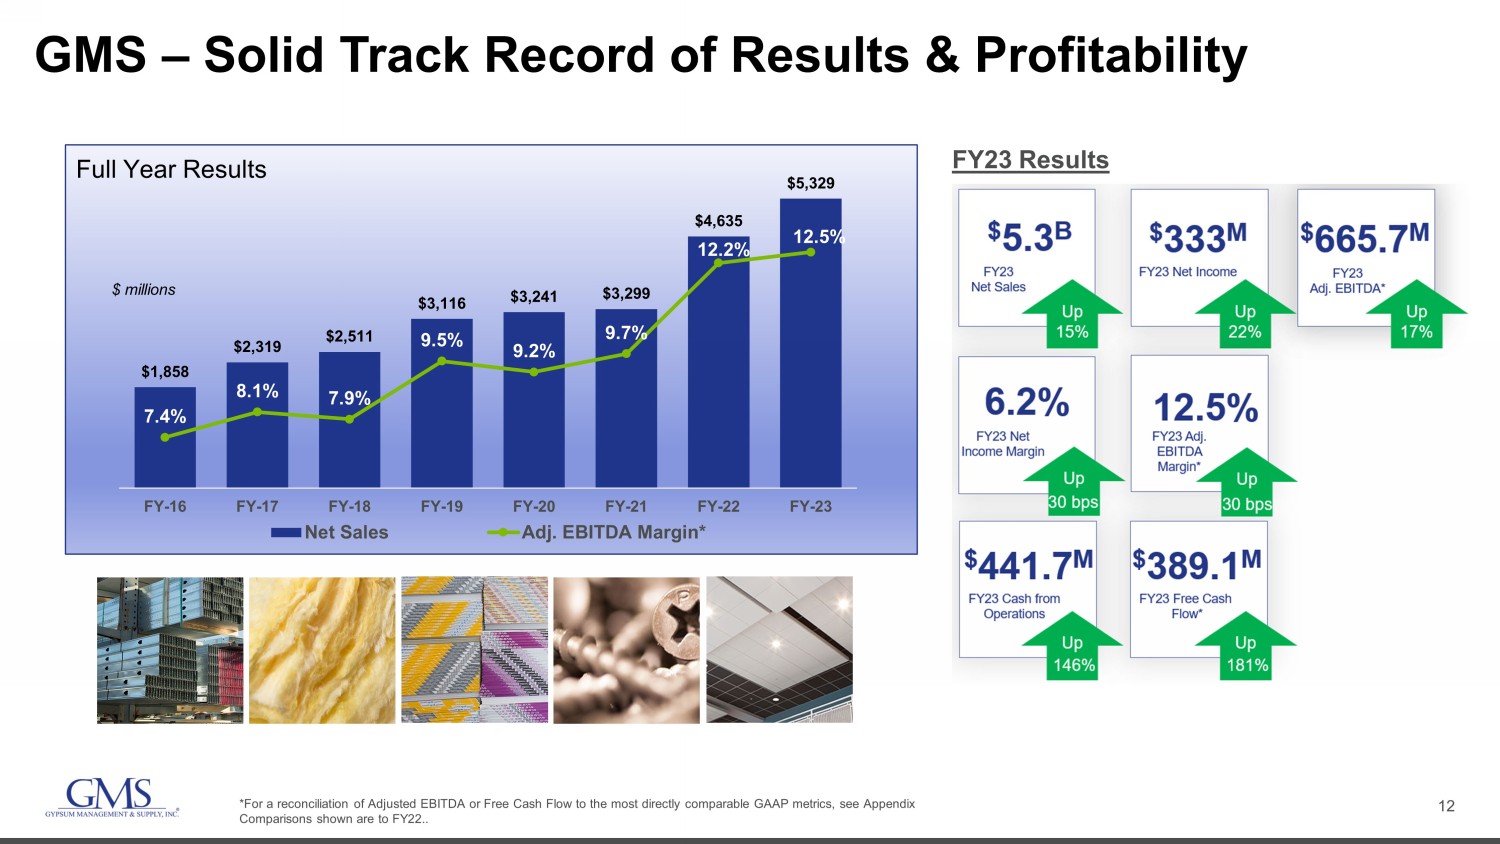
12 GMS – Solid Track Record of Results & Profitability *For a reconciliation of Adjusted EBITDA or Free Cash Flow to the most directly comparable GAAP metrics, see Appendix Comparisons shown are to FY22.. $1,858 $2,319 $2,511 $3,116 $3,241 $3,299 $4,635 $5,329 7.4% 8.1% 7.9% 9.5% 9.2% 9.7% 12.2% 12.5% FY-16 FY-17 FY-18 FY-19 FY-20 FY-21 FY-22 FY-23 Net Sales Adj. EBITDA Margin* $ millions Full Year Results 30 bps FY23 Results
13 Outlook for Q4 FY2024
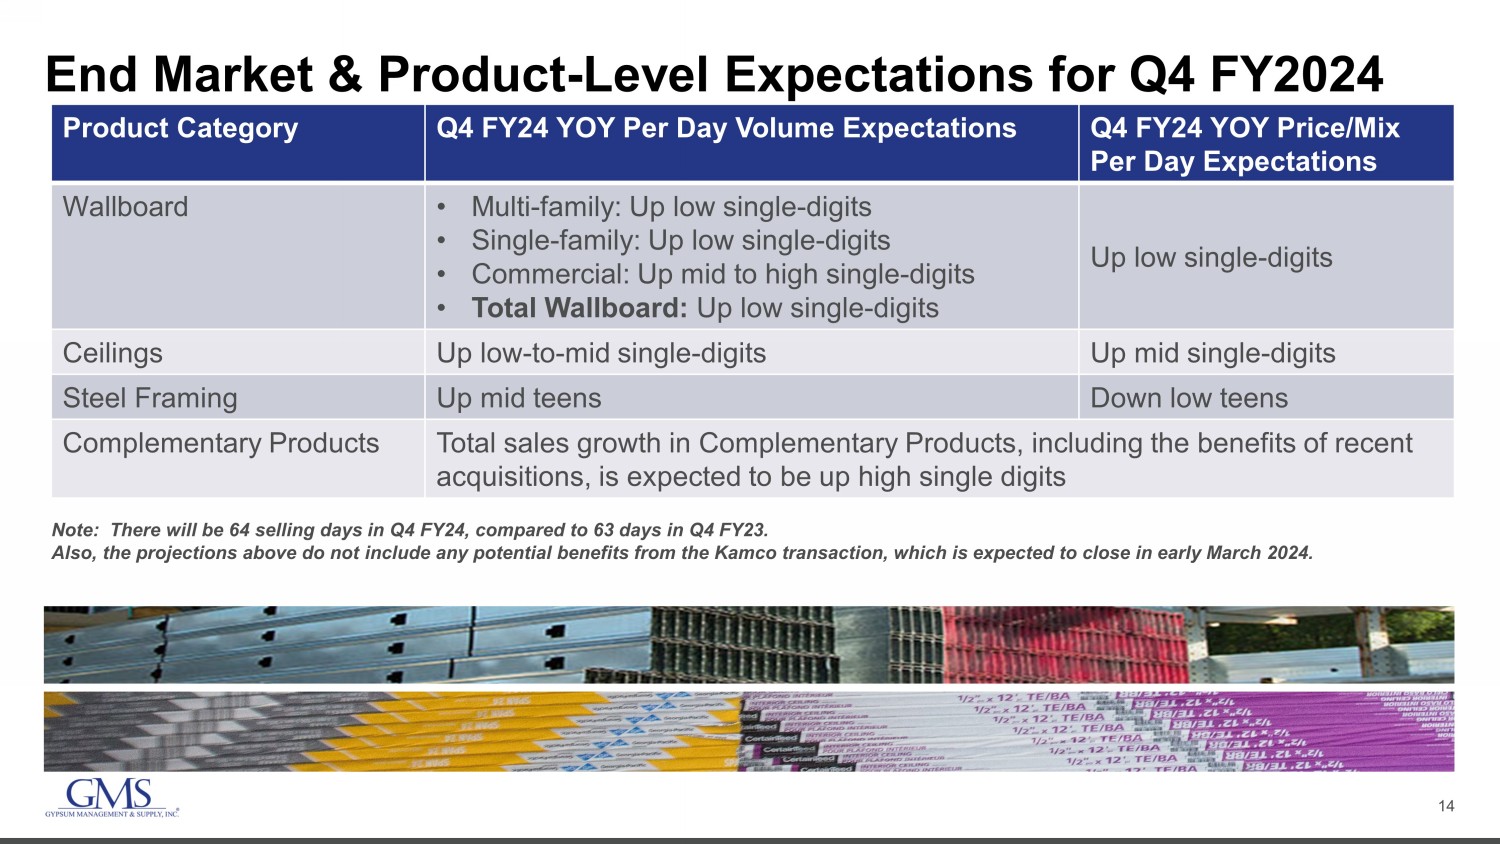
14 End Market & Product - Level Expectations for Q4 FY2024 Product Category Q4 FY24 YOY Per Day Volume Expectations Q4 FY24 YOY Price/Mix Per Day Expectations Wallboard • Multi - family: Up low single - digits • Single - family: Up low single - digits • Commercial: Up mid to high single - digits • Total Wallboard: Up low single - digits Up low single - digits Ceilings Up low - to - mid single - digits Up mid single - digits Steel Framing Up mid teens Down low teens Complementary Products Total sales growth in Complementary Products, including the benefits of recent acquisitions, is expected to be up high single digits Note: There will be 64 selling days in Q4 FY24, compared to 63 days in Q4 FY23. Also, the projections above do not include any potential benefits from the Kamco transaction, which is expected to close in e arl y March 2024.

15 Consolidated GMS Expectations for Q4 FY24 and Full Year Fiscal 2024 Metric for Q4 FY24 Q4 FY24 Expectation (on a Per Day Basis) Net Sales Up mid single - digits Gross Margin Approximately 32.2% Net Income $66 million - $69 million Adjusted EBITDA 1 $145 million - $150 million Metric for Full Year FY24 Full Year FY24 Expectation Interest Expense ~$73 million Capital Expenditures ~$56 million - $58 million Free Cash Flow 1 ~ 55% - 60% of FY24 Adj. EBITDA 1 Tax Rate 2 ~25.5% - 26.0% 1 For a reconciliation of Adjusted EBITDA, Adjusted Net Income or Free Cash Flow to the most directly comparable GAAP metrics, see Appendix. 2 Tax rate refers to the normalized cash tax rate excluding the impact of acquisition accounting and certain other deferred tax am ounts. Note: There will be 64 selling days in Q4 FY24, compared to 63 days in Q4 FY23. Also, the projections above do not include any potential benefits from the Kamco transaction, which is expected to close in e arl y March 2024.
16 Appendix
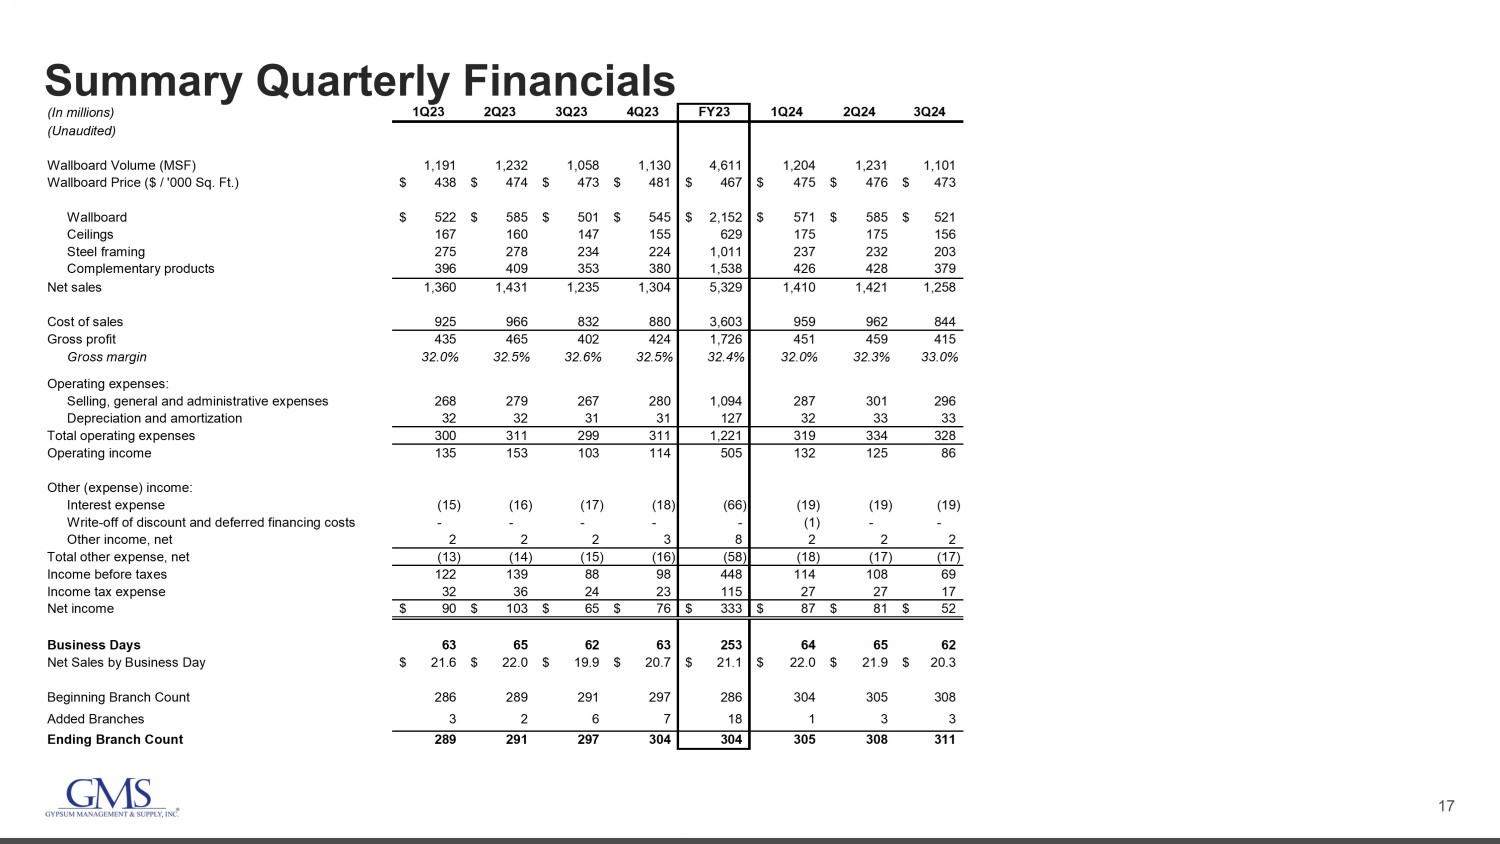
17 Summary Quarterly Financials (In millions) 1Q23 2Q23 3Q23 4Q23 FY23 1Q24 2Q24 3Q24 (Unaudited) Wallboard Volume (MSF) 1,191 1,232 1,058 1,130 4,611 1,204 1,231 1,101 Wallboard Price ($ / '000 Sq. Ft.) 438$ 474$ 473$ 481$ 467$ 475$ 476$ 473$ Wallboard 522$ 585$ 501$ 545$ 2,152$ 571$ 585$ 521$ Ceilings 167 160 147 155 629 175 175 156 Steel framing 275 278 234 224 1,011 237 232 203 Complementary products 396 409 353 380 1,538 426 428 379 Net sales 1,360 1,431 1,235 1,304 5,329 1,410 1,421 1,258 Cost of sales 925 966 832 880 3,603 959 962 844 Gross profit 435 465 402 424 1,726 451 459 415 Gross margin 32.0% 32.5% 32.6% 32.5% 32.4% 32.0% 32.3% 33.0% Operating expenses: Selling, general and administrative expenses 268 279 267 280 1,094 287 301 296 Depreciation and amortization 32 32 31 31 127 32 33 33 Total operating expenses 300 311 299 311 1,221 319 334 328 Operating income 135 153 103 114 505 132 125 86 Other (expense) income: Interest expense (15) (16) (17) (18) (66) (19) (19) (19) Write-off of discount and deferred financing costs - - - - - (1) - - Other income, net 2 2 2 3 8 2 2 2 Total other expense, net (13) (14) (15) (16) (58) (18) (17) (17) Income before taxes 122 139 88 98 448 114 108 69 Income tax expense 32 36 24 23 115 27 27 17 Net income 90$ 103$ 65$ 76$ 333$ 87$ 81$ 52$ Business Days 63 65 62 63 253 64 65 62 Net Sales by Business Day 21.6$ 22.0$ 19.9$ 20.7$ 21.1$ 22.0$ 21.9$ 20.3$ Beginning Branch Count 286 289 291 297 286 304 305 308 Added Branches 3 2 6 7 18 1 3 3 Ending Branch Count 289 291 297 304 304 305 308 311
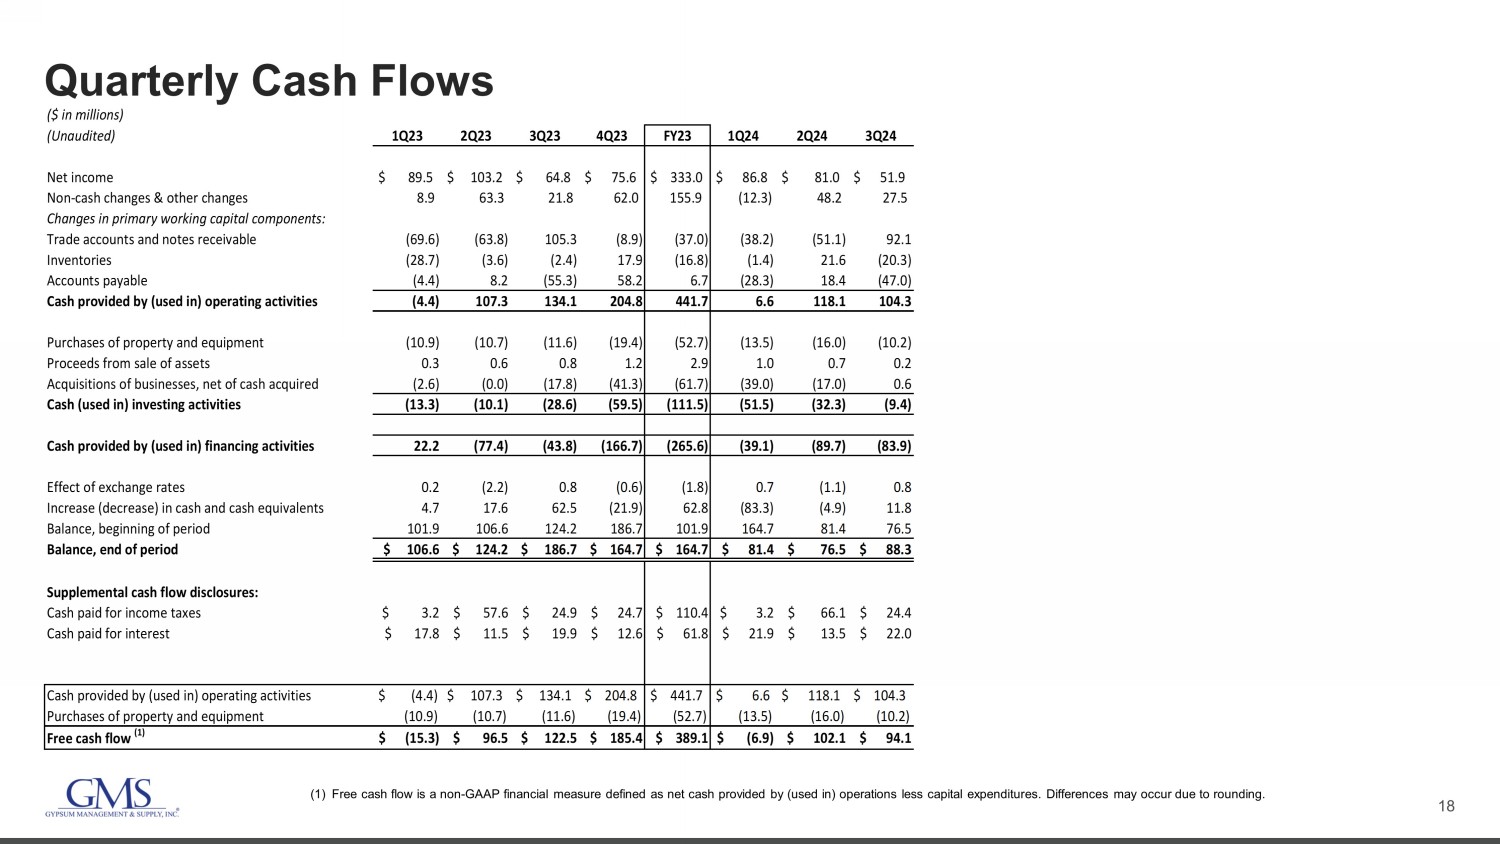
18 Quarterly Cash Flows (1) Free cash flow is a non - GAAP financial measure defined as net cash provided by (used in) operations less capital expenditures. D ifferences may occur due to rounding. ($ in millions) (Unaudited) 1Q23 2Q23 3Q23 4Q23 FY23 1Q24 2Q24 3Q24 Net income $ 89.5 $ 103.2 $ 64.8 $ 75.6 $ 333.0 $ 86.8 $ 81.0 $ 51.9 Non-cash changes & other changes 8.9 63.3 21.8 62.0 155.9 (12.3) 48.2 27.5 Changes in primary working capital components: Trade accounts and notes receivable (69.6) (63.8) 105.3 (8.9) (37.0) (38.2) (51.1) 92.1 Inventories (28.7) (3.6) (2.4) 17.9 (16.8) (1.4) 21.6 (20.3) Accounts payable (4.4) 8.2 (55.3) 58.2 6.7 (28.3) 18.4 (47.0) Cash provided by (used in) operating activities (4.4) 107.3 134.1 204.8 441.7 6.6 118.1 104.3 Purchases of property and equipment (10.9) (10.7) (11.6) (19.4) (52.7) (13.5) (16.0) (10.2) Proceeds from sale of assets 0.3 0.6 0.8 1.2 2.9 1.0 0.7 0.2 Acquisitions of businesses, net of cash acquired (2.6) (0.0) (17.8) (41.3) (61.7) (39.0) (17.0) 0.6 Cash (used in) investing activities (13.3) (10.1) (28.6) (59.5) (111.5) (51.5) (32.3) (9.4) Cash provided by (used in) financing activities 22.2 (77.4) (43.8) (166.7) (265.6) (39.1) (89.7) (83.9) Effect of exchange rates 0.2 (2.2) 0.8 (0.6) (1.8) 0.7 (1.1) 0.8 Increase (decrease) in cash and cash equivalents 4.7 17.6 62.5 (21.9) 62.8 (83.3) (4.9) 11.8 Balance, beginning of period 101.9 106.6 124.2 186.7 101.9 164.7 81.4 76.5 Balance, end of period $ 106.6 $ 124.2 $ 186.7 $ 164.7 $ 164.7 $ 81.4 $ 76.5 $ 88.3 Supplemental cash flow disclosures: Cash paid for income taxes $ 3.2 $ 57.6 $ 24.9 $ 24.7 $ 110.4 $ 3.2 $ 66.1 $ 24.4 Cash paid for interest $ 17.8 $ 11.5 $ 19.9 $ 12.6 $ 61.8 $ 21.9 $ 13.5 $ 22.0 Cash provided by (used in) operating activities $ (4.4) $ 107.3 $ 134.1 $ 204.8 $ 441.7 $ 6.6 $ 118.1 $ 104.3 Purchases of property and equipment (10.9) (10.7) (11.6) (19.4) (52.7) (13.5) (16.0) (10.2) Free cash flow (1) $ (15.3) $ 96.5 $ 122.5 $ 185.4 $ 389.1 $ (6.9) $ 102.1 $ 94.1
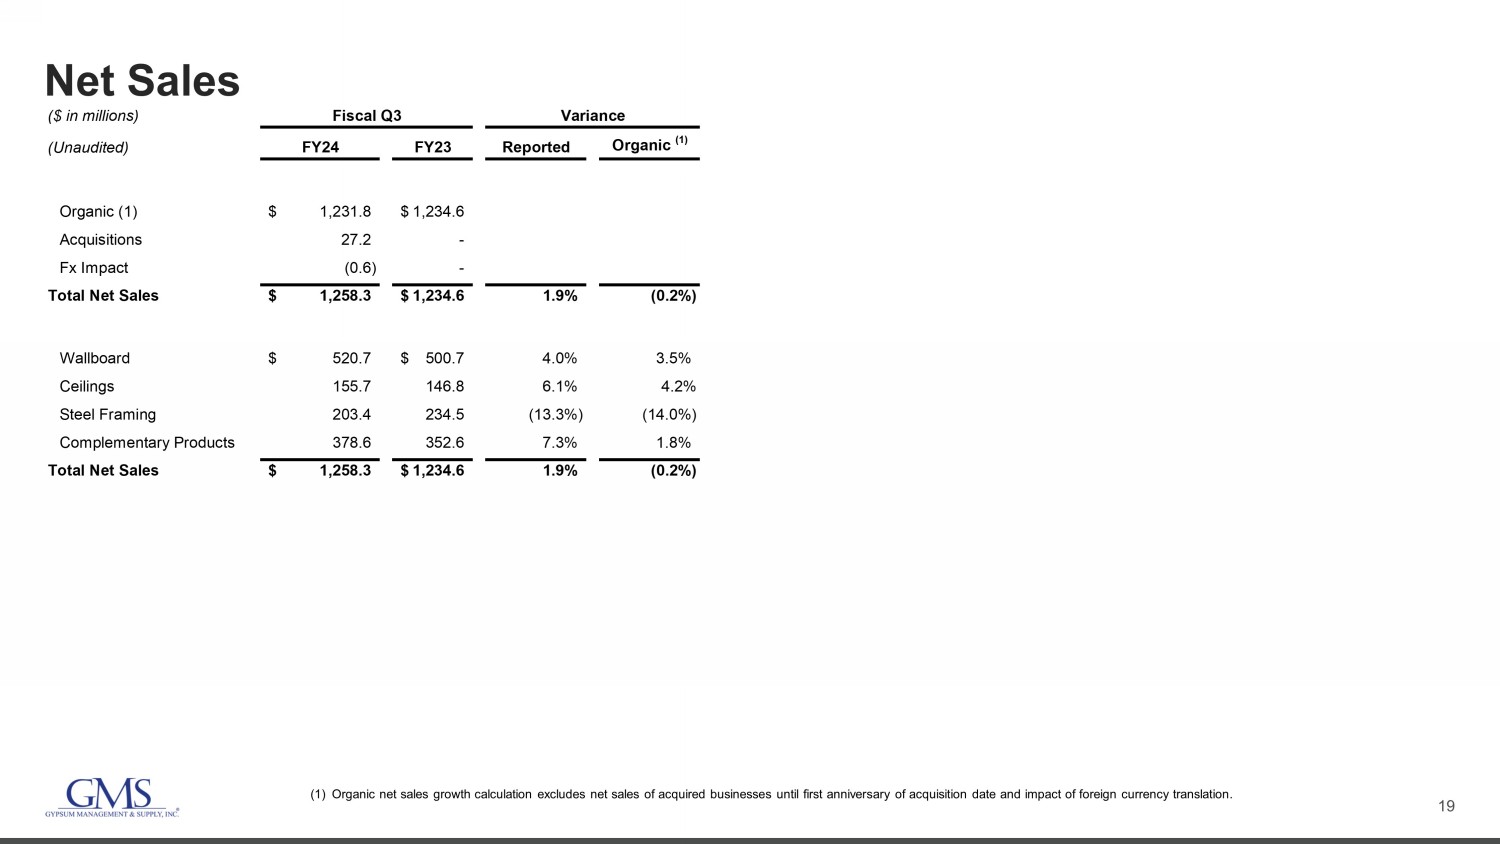
19 Net Sales (1) Organic net sales growth calculation excludes net sales of acquired businesses until first anniversary of acquisition date an d i mpact of foreign currency translation. ($ in millions) (Unaudited) FY24 FY23 Reported Organic (1) Organic (1) 1,231.8$ 1,234.6$ Acquisitions 27.2 - Fx Impact (0.6) - Total Net Sales 1,258.3$ 1,234.6$ 1.9% (0.2%) Wallboard 520.7$ 500.7$ 4.0% 3.5% Ceilings 155.7 146.8 6.1% 4.2% Steel Framing 203.4 234.5 (13.3%) (14.0%) Complementary Products 378.6 352.6 7.3% 1.8% Total Net Sales 1,258.3$ 1,234.6$ 1.9% (0.2%) Fiscal Q3 Variance
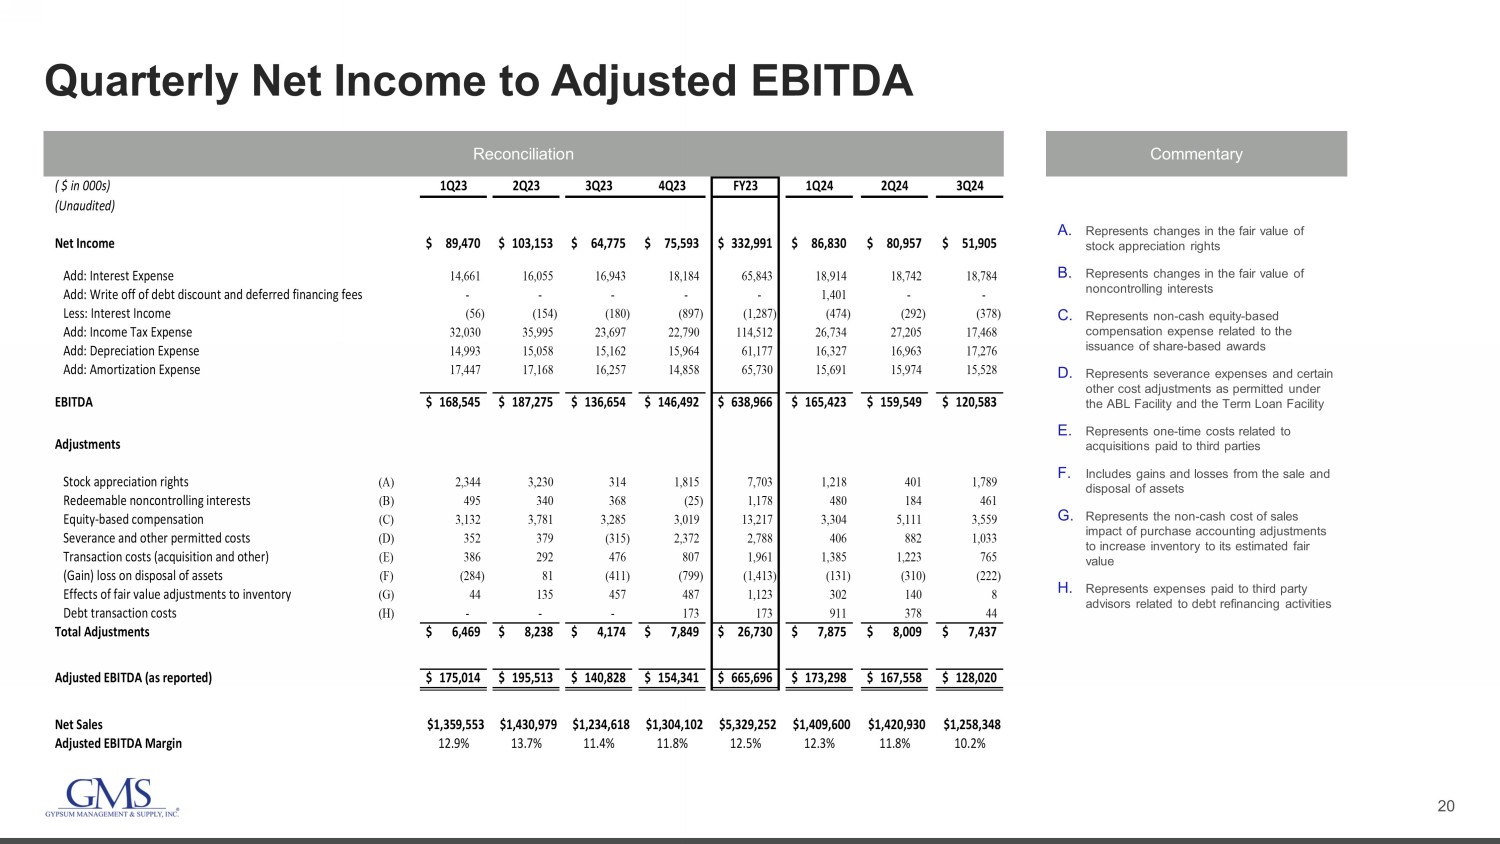
20 Quarterly Net Income to Adjusted EBITDA Reconciliation Commentary A. Represents changes in the fair value of stock appreciation rights B. Represents changes in the fair value of noncontrolling interests C. Represents non - cash equity - based compensation expense related to the issuance of share - based awards D. Represents severance expenses and certain other cost adjustments as permitted under the ABL Facility and the Term Loan Facility E. Represents one - time costs related to acquisitions paid to third parties F. Includes gains and losses from the sale and disposal of assets G. Represents the non - cash cost of sales impact of purchase accounting adjustments to increase inventory to its estimated fair value H. Represents expenses paid to third party advisors related to debt refinancing activities ( $ in 000s) 1Q23 2Q23 3Q23 4Q23 FY23 1Q24 2Q24 3Q24 (Unaudited) Net Income 89,470$ 103,153$ 64,775$ 75,593$ 332,991$ 86,830$ 80,957$ 51,905$ Add: Interest Expense 14,661 16,055 16,943 18,184 65,843 18,914 18,742 18,784 Add: Write off of debt discount and deferred financing fees - - - - - 1,401 - - Less: Interest Income (56) (154) (180) (897) (1,287) (474) (292) (378) Add: Income Tax Expense 32,030 35,995 23,697 22,790 114,512 26,734 27,205 17,468 Add: Depreciation Expense 14,993 15,058 15,162 15,964 61,177 16,327 16,963 17,276 Add: Amortization Expense 17,447 17,168 16,257 14,858 65,730 15,691 15,974 15,528 EBITDA 168,545$ 187,275$ 136,654$ 146,492$ 638,966$ 165,423$ 159,549$ 120,583$ Adjustments Stock appreciation rights (A) 2,344 3,230 314 1,815 7,703 1,218 401 1,789 Redeemable noncontrolling interests (B) 495 340 368 (25) 1,178 480 184 461 Equity-based compensation (C) 3,132 3,781 3,285 3,019 13,217 3,304 5,111 3,559 Severance and other permitted costs (D) 352 379 (315) 2,372 2,788 406 882 1,033 Transaction costs (acquisition and other) (E) 386 292 476 807 1,961 1,385 1,223 765 (Gain) loss on disposal of assets (F) (284) 81 (411) (799) (1,413) (131) (310) (222) Effects of fair value adjustments to inventory (G) 44 135 457 487 1,123 302 140 8 Debt transaction costs (H) - - - 173 173 911 378 44 Total Adjustments 6,469$ 8,238$ 4,174$ 7,849$ 26,730$ 7,875$ 8,009$ 7,437$ Adjusted EBITDA (as reported) 175,014$ 195,513$ 140,828$ 154,341$ 665,696$ 173,298$ 167,558$ 128,020$ Net Sales $1,359,553 $1,430,979 $1,234,618 $1,304,102 $5,329,252 $1,409,600 $1,420,930 $1,258,348 Adjusted EBITDA Margin 12.9% 13.7% 11.4% 11.8% 12.5% 12.3% 11.8% 10.2%
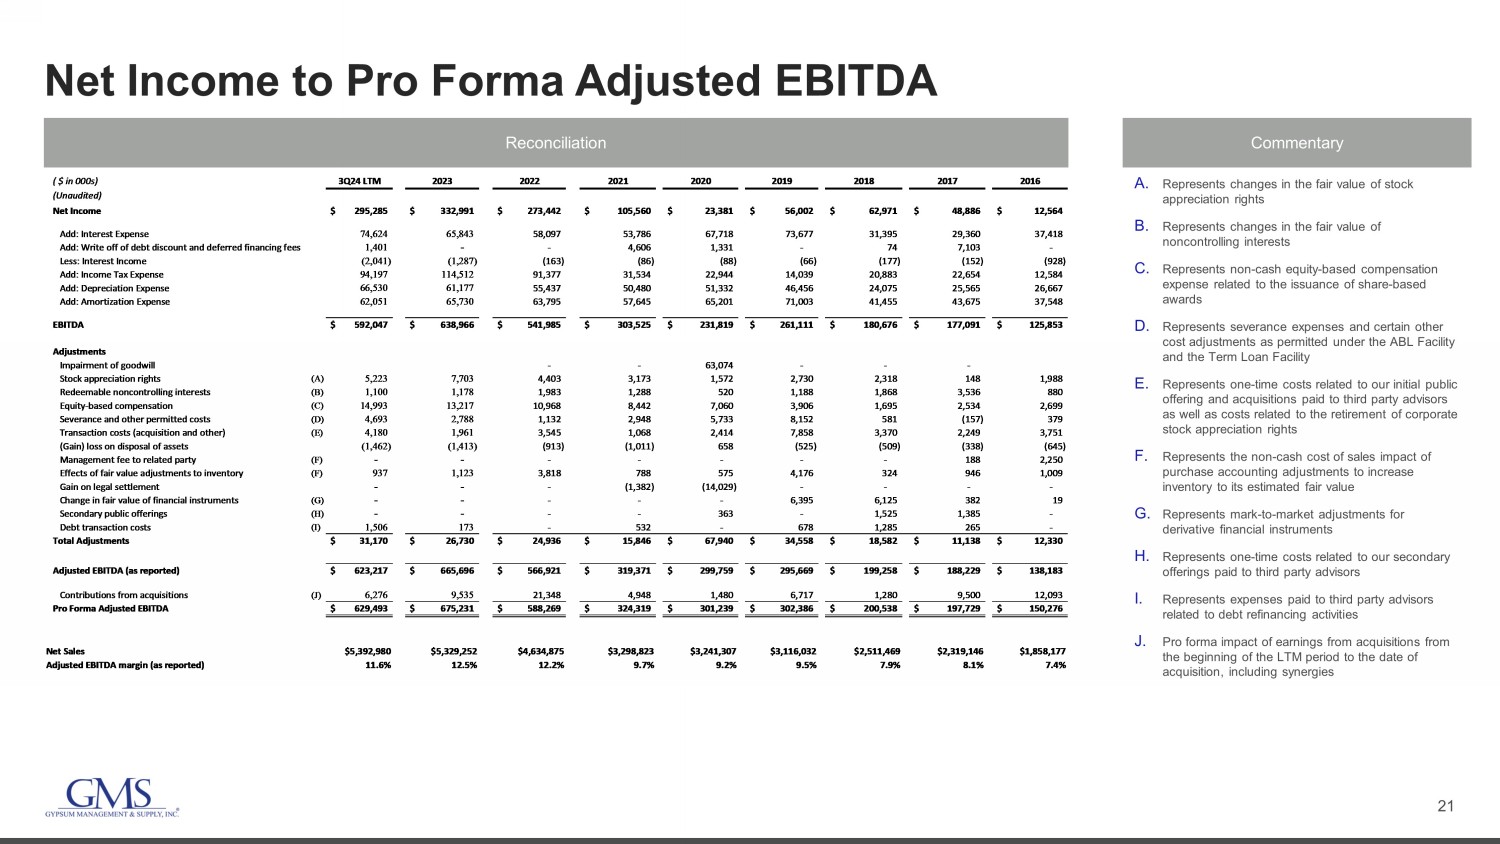
21 Net Income to Pro Forma Adjusted EBITDA Reconciliation Commentary A. Represents changes in the fair value of stock appreciation rights B. Represents changes in the fair value of noncontrolling interests C. Represents non - cash equity - based compensation expense related to the issuance of share - based awards D. Represents severance expenses and certain other cost adjustments as permitted under the ABL Facility and the Term Loan Facility E. Represents one - time costs related to our initial public offering and acquisitions paid to third party advisors as well as costs related to the retirement of corporate stock appreciation rights F. Represents the non - cash cost of sales impact of purchase accounting adjustments to increase inventory to its estimated fair value G. Represents mark - to - market adjustments for derivative financial instruments H. Represents one - time costs related to our secondary offerings paid to third party advisors I. Represents expenses paid to third party advisors related to debt refinancing activities J. Pro forma impact of earnings from acquisitions from the beginning of the LTM period to the date of acquisition, including synergies ( $ in 000s) 3Q24 LTM 2023 2022 2021 2020 2019 2018 2017 2016 (Unaudited) Net Income 295,285$ 332,991$ 273,442$ 105,560$ 23,381$ 56,002$ 62,971$ 48,886$ 12,564$ Add: Interest Expense 74,624 65,843 58,097 53,786 67,718 73,677 31,395 29,360 37,418 Add: Write off of debt discount and deferred financing fees 1,401 - - 4,606 1,331 - 74 7,103 - Less: Interest Income (2,041) (1,287) (163) (86) (88) (66) (177) (152) (928) Add: Income Tax Expense 94,197 114,512 91,377 31,534 22,944 14,039 20,883 22,654 12,584 Add: Depreciation Expense 66,530 61,177 55,437 50,480 51,332 46,456 24,075 25,565 26,667 Add: Amortization Expense 62,051 65,730 63,795 57,645 65,201 71,003 41,455 43,675 37,548 EBITDA 592,047$ 638,966$ 541,985$ 303,525$ 231,819$ 261,111$ 180,676$ 177,091$ 125,853$ Adjustments Impairment of goodwill - - 63,074 - - - Stock appreciation rights (A) 5,223 7,703 4,403 3,173 1,572 2,730 2,318 148 1,988 Redeemable noncontrolling interests (B) 1,100 1,178 1,983 1,288 520 1,188 1,868 3,536 880 Equity-based compensation (C) 14,993 13,217 10,968 8,442 7,060 3,906 1,695 2,534 2,699 Severance and other permitted costs (D) 4,693 2,788 1,132 2,948 5,733 8,152 581 (157) 379 Transaction costs (acquisition and other) (E) 4,180 1,961 3,545 1,068 2,414 7,858 3,370 2,249 3,751 (Gain) loss on disposal of assets (1,462) (1,413) (913) (1,011) 658 (525) (509) (338) (645) Management fee to related party (F) - - - - - - - 188 2,250 Effects of fair value adjustments to inventory (F) 937 1,123 3,818 788 575 4,176 324 946 1,009 Gain on legal settlement - - - (1,382) (14,029) - - - - Change in fair value of financial instruments (G) - - - - - 6,395 6,125 382 19 Secondary public offerings (H) - - - - 363 - 1,525 1,385 - Debt transaction costs (I) 1,506 173 - 532 - 678 1,285 265 - Total Adjustments 31,170$ 26,730$ 24,936$ 15,846$ 67,940$ 34,558$ 18,582$ 11,138$ 12,330$ Adjusted EBITDA (as reported) 623,217$ 665,696$ 566,921$ 319,371$ 299,759$ 295,669$ 199,258$ 188,229$ 138,183$ Contributions from acquisitions (J) 6,276 9,535 21,348 4,948 1,480 6,717 1,280 9,500 12,093 Pro Forma Adjusted EBITDA 629,493$ 675,231$ 588,269$ 324,319$ 301,239$ 302,386$ 200,538$ 197,729$ 150,276$ Net Sales $5,392,980 $5,329,252 $4,634,875 $3,298,823 $3,241,307 $3,116,032 $2,511,469 $2,319,146 $1,858,177 Adjusted EBITDA margin (as reported) 11.6% 12.5% 12.2% 9.7% 9.2% 9.5% 7.9% 8.1% 7.4%

22 Income Before Taxes to Adjusted Net Income Reconciliation Commentary A. Depreciation and amortization from the increase in value of certain long - term assets associated with the April 1, 2014 acquisition of the predecessor company and amortization of intangible assets from the acquisitions of Titan, Westside Building Materials, and AMES Taping Tools B. Normalized cash tax rate determined based on our estimated taxes excluding the impact of purchase accounting and certain other deferred tax amounts ($ in 000s) 3Q24 3Q23 (Unaudited) Income before taxes 69,373$ 88,472$ EBITDA adjustments 7,437 4,174 Purchase accounting depreciation and amortization (A) 10,396 12,485 Adjusted pre-tax income 87,206 105,131 Adjusted income tax expense 22,238 26,808 Adjusted net income 64,968$ 78,323$ Effective tax rate (B) 25.5% 25.5% Weighted average shares outstanding: Basic 39,864 41,578 Diluted 40,512 42,232 Adjusted net income per share: Basic 1.63$ 1.88$ Diluted 1.60$ 1.85$

23 Reported SG&A to Adjusted SG&A Reconciliation Commentary A. Represents changes in the fair value of stock appreciation rights B. Represents changes in the fair value of noncontrolling interests C. Represents non - cash equity - based compensation expense related to the issuance of share - based awards D. Represents severance expenses and certain other cost adjustments as permitted under the ABL Facility and the Term Loan Facility E. Represents one - time costs related to acquisitions paid to third parties (Unaudited) 1Q23 2Q23 3Q23 4Q23 FY2023 1Q24 2Q24 3Q24 ($ in millions) SG&A - Reported 267.7$ 279.0$ 267.4$ 279.8$ 1,093.8$ 286.8$ 300.9$ 295.7$ Adjustments Stock appreciation rights (A) (2.3) (3.2) (0.3) (1.8) (7.7) (1.2) (0.4) (1.8) Redeemable noncontrolling interests (B) (0.5) (0.3) (0.4) 0.0 (1.2) (0.5) (0.2) (0.5) Equity-based compensation (C) (3.1) (3.8) (3.3) (3.0) (13.2) (3.3) (5.1) (3.6) Severance and other permitted costs (D) (0.4) (0.4) 0.3 (2.4) (2.9) (0.4) (0.9) (1.0) Transaction costs (acquisition and other) (E) (0.4) (0.3) (0.5) (0.8) (2.0) (1.4) (1.2) (0.8) Gain (loss) on disposal of assets (F) 0.3 (0.1) 0.4 0.8 1.4 0.1 0.3 0.2 Debt transaction costs (H) - - - (0.2) (0.2) (0.9) (0.4) (0.0) SG&A - Adjusted 261.3$ 270.9$ 263.6$ 272.4$ 1,068.1$ 279.2$ 293.0$ 288.3$ Net Sales 1,359.6$ 1,431.0$ 1,234.6$ 1,304.1$ 5,329.3$ 1,409.6$ 1,420.9$ 1,258.3$ Adjusted SG&A Margin 19.2% 18.9% 21.4% 20.9% 20.0% 19.8% 20.6% 22.9%
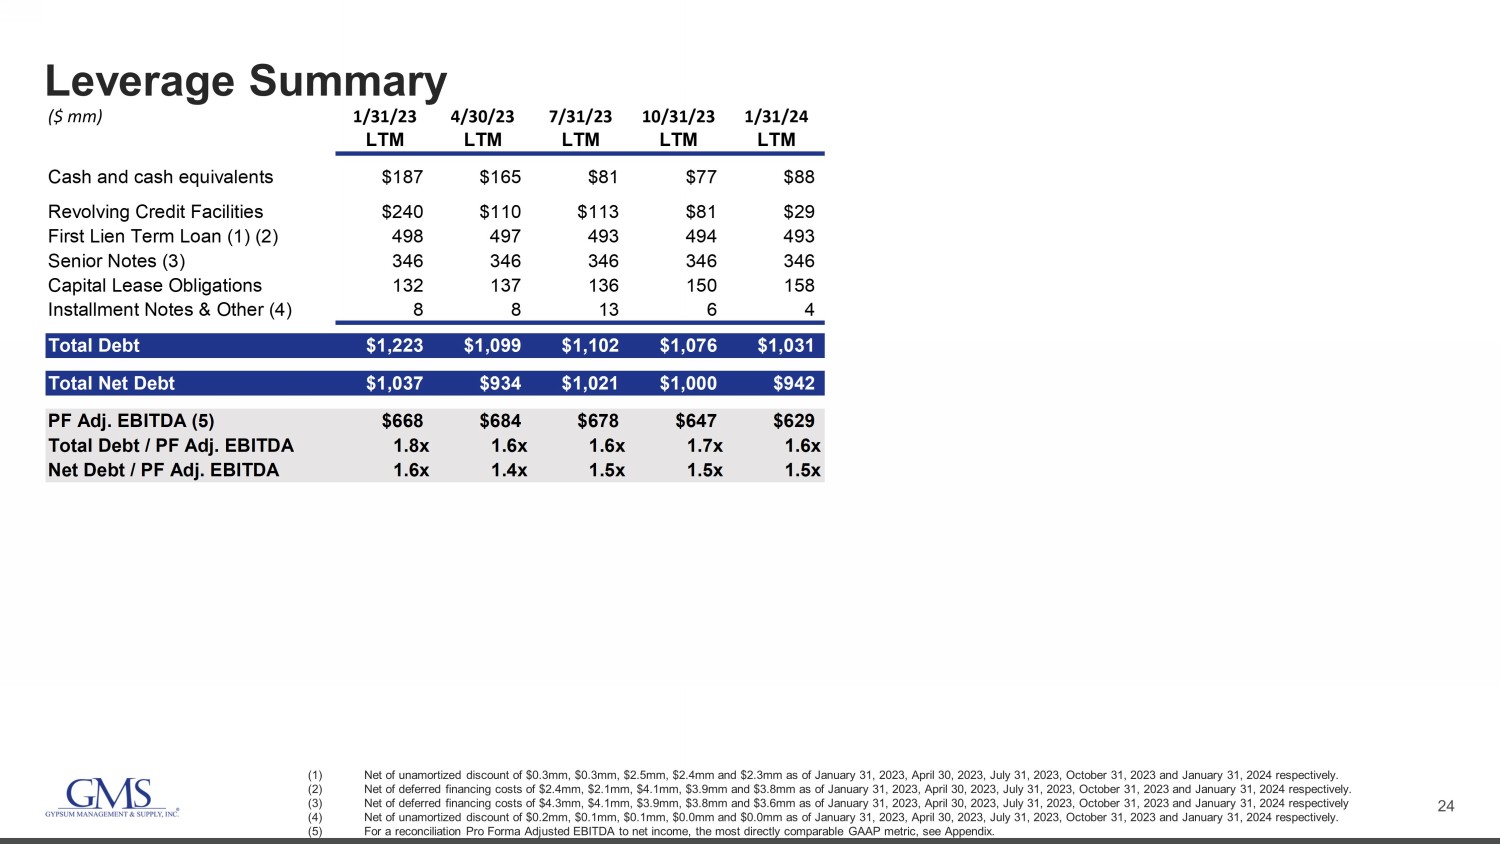
24 Leverage Summary (1) Net of unamortized discount of $0.3mm, $0.3mm, $2.5mm, $2.4mm and $2.3mm as of January 31, 2023, April 30, 2023, July 31, 20 23, October 31, 2023 and January 31, 2024 respectively. (2) Net of deferred financing costs of $2.4mm, $2.1mm, $4.1mm, $3.9mm and $3.8mm as of January 31, 2023, April 30, 2023, July 31 , 2023, October 31, 2023 and January 31, 2024 respectively. (3) Net of deferred financing costs of $4.3mm, $4.1mm, $3.9mm, $3.8mm and $3.6mm as of January 31, 2023, April 30, 2023, July 31 , 2023, October 31, 2023 and January 31, 2024 respectively (4) Net of unamortized discount of $0.2mm, $0.1mm, $0.1mm, $0.0mm and $0.0mm as of January 31, 2023, April 30, 2023, July 31, 20 23, October 31, 2023 and January 31, 2024 respectively. (5) For a reconciliation Pro Forma Adjusted EBITDA to net income, the most directly comparable GAAP metric, see Appendix. ($ mm) 1/31/23 4/30/23 7/31/23 10/31/23 1/31/24 LTM LTM LTM LTM LTM Cash and cash equivalents $187 $165 $81 $77 $88 Revolving Credit Facilities $240 $110 $113 $81 $29 First Lien Term Loan (1) (2) 498 497 493 494 493 Senior Notes (3) 346 346 346 346 346 Capital Lease Obligations 132 137 136 150 158 Installment Notes & Other (4) 8 8 13 6 4 Total Debt $1,223 $1,099 $1,102 $1,076 $1,031 Total Net Debt $1,037 $934 $1,021 $1,000 $942 PF Adj. EBITDA (5) $668 $684 $678 $647 $629 Total Debt / PF Adj. EBITDA 1.8x 1.6x 1.6x 1.7x 1.6x Net Debt / PF Adj. EBITDA 1.6x 1.4x 1.5x 1.5x 1.5x

25 Net Income to Adjusted EBITDA Outlook Reconciliation Q4 FY24 Net Income $66 - $69 Interest expense, net 15.6 - 16.3 Provision for income taxes 23.0 - 23.9 Depreciation and amortization expense 32.0 - 33.3 Other Adjustments 7.0 Adjusted EBITDA $145 - $150 $ in millions Note: There will be 64 selling days in Q4 FY24, compared to 63 days in Q4 FY23. Also, the projections above do not include any potential benefits from the Kamco transaction, which is expected to close in e arl y March 2024.
v3.24.0.1
| X |
- DefinitionBoolean flag that is true when the XBRL content amends previously-filed or accepted submission.
| Name: |
dei_AmendmentFlag |
| Namespace Prefix: |
dei_ |
| Data Type: |
xbrli:booleanItemType |
| Balance Type: |
na |
| Period Type: |
duration |
|
| X |
- DefinitionFor the EDGAR submission types of Form 8-K: the date of the report, the date of the earliest event reported; for the EDGAR submission types of Form N-1A: the filing date; for all other submission types: the end of the reporting or transition period. The format of the date is YYYY-MM-DD.
| Name: |
dei_DocumentPeriodEndDate |
| Namespace Prefix: |
dei_ |
| Data Type: |
xbrli:dateItemType |
| Balance Type: |
na |
| Period Type: |
duration |
|
| X |
- DefinitionThe type of document being provided (such as 10-K, 10-Q, 485BPOS, etc). The document type is limited to the same value as the supporting SEC submission type, or the word 'Other'.
| Name: |
dei_DocumentType |
| Namespace Prefix: |
dei_ |
| Data Type: |
dei:submissionTypeItemType |
| Balance Type: |
na |
| Period Type: |
duration |
|
| X |
- DefinitionAddress Line 1 such as Attn, Building Name, Street Name
| Name: |
dei_EntityAddressAddressLine1 |
| Namespace Prefix: |
dei_ |
| Data Type: |
xbrli:normalizedStringItemType |
| Balance Type: |
na |
| Period Type: |
duration |
|
| X |
- DefinitionAddress Line 2 such as Street or Suite number
| Name: |
dei_EntityAddressAddressLine2 |
| Namespace Prefix: |
dei_ |
| Data Type: |
xbrli:normalizedStringItemType |
| Balance Type: |
na |
| Period Type: |
duration |
|
| X |
- Definition
+ References
+ Details
| Name: |
dei_EntityAddressCityOrTown |
| Namespace Prefix: |
dei_ |
| Data Type: |
xbrli:normalizedStringItemType |
| Balance Type: |
na |
| Period Type: |
duration |
|
| X |
- DefinitionCode for the postal or zip code
| Name: |
dei_EntityAddressPostalZipCode |
| Namespace Prefix: |
dei_ |
| Data Type: |
xbrli:normalizedStringItemType |
| Balance Type: |
na |
| Period Type: |
duration |
|
| X |
- DefinitionName of the state or province.
| Name: |
dei_EntityAddressStateOrProvince |
| Namespace Prefix: |
dei_ |
| Data Type: |
dei:stateOrProvinceItemType |
| Balance Type: |
na |
| Period Type: |
duration |
|
| X |
- DefinitionA unique 10-digit SEC-issued value to identify entities that have filed disclosures with the SEC. It is commonly abbreviated as CIK. Reference 1: http://www.xbrl.org/2003/role/presentationRef
-Publisher SEC
-Name Exchange Act
-Number 240
-Section 12
-Subsection b-2
| Name: |
dei_EntityCentralIndexKey |
| Namespace Prefix: |
dei_ |
| Data Type: |
dei:centralIndexKeyItemType |
| Balance Type: |
na |
| Period Type: |
duration |
|
| X |
- DefinitionIndicate if registrant meets the emerging growth company criteria. Reference 1: http://www.xbrl.org/2003/role/presentationRef
-Publisher SEC
-Name Exchange Act
-Number 240
-Section 12
-Subsection b-2
| Name: |
dei_EntityEmergingGrowthCompany |
| Namespace Prefix: |
dei_ |
| Data Type: |
xbrli:booleanItemType |
| Balance Type: |
na |
| Period Type: |
duration |
|
| X |
- DefinitionCommission file number. The field allows up to 17 characters. The prefix may contain 1-3 digits, the sequence number may contain 1-8 digits, the optional suffix may contain 1-4 characters, and the fields are separated with a hyphen.
| Name: |
dei_EntityFileNumber |
| Namespace Prefix: |
dei_ |
| Data Type: |
dei:fileNumberItemType |
| Balance Type: |
na |
| Period Type: |
duration |
|
| X |
- DefinitionTwo-character EDGAR code representing the state or country of incorporation.
| Name: |
dei_EntityIncorporationStateCountryCode |
| Namespace Prefix: |
dei_ |
| Data Type: |
dei:edgarStateCountryItemType |
| Balance Type: |
na |
| Period Type: |
duration |
|
| X |
- DefinitionThe exact name of the entity filing the report as specified in its charter, which is required by forms filed with the SEC. Reference 1: http://www.xbrl.org/2003/role/presentationRef
-Publisher SEC
-Name Exchange Act
-Number 240
-Section 12
-Subsection b-2
| Name: |
dei_EntityRegistrantName |
| Namespace Prefix: |
dei_ |
| Data Type: |
xbrli:normalizedStringItemType |
| Balance Type: |
na |
| Period Type: |
duration |
|
| X |
- DefinitionThe Tax Identification Number (TIN), also known as an Employer Identification Number (EIN), is a unique 9-digit value assigned by the IRS. Reference 1: http://www.xbrl.org/2003/role/presentationRef
-Publisher SEC
-Name Exchange Act
-Number 240
-Section 12
-Subsection b-2
| Name: |
dei_EntityTaxIdentificationNumber |
| Namespace Prefix: |
dei_ |
| Data Type: |
dei:employerIdItemType |
| Balance Type: |
na |
| Period Type: |
duration |
|
| X |
- DefinitionLocal phone number for entity.
| Name: |
dei_LocalPhoneNumber |
| Namespace Prefix: |
dei_ |
| Data Type: |
xbrli:normalizedStringItemType |
| Balance Type: |
na |
| Period Type: |
duration |
|
| X |
- DefinitionBoolean flag that is true when the Form 8-K filing is intended to satisfy the filing obligation of the registrant as pre-commencement communications pursuant to Rule 13e-4(c) under the Exchange Act. Reference 1: http://www.xbrl.org/2003/role/presentationRef
-Publisher SEC
-Name Exchange Act
-Number 240
-Section 13e
-Subsection 4c
| Name: |
dei_PreCommencementIssuerTenderOffer |
| Namespace Prefix: |
dei_ |
| Data Type: |
xbrli:booleanItemType |
| Balance Type: |
na |
| Period Type: |
duration |
|
| X |
- DefinitionBoolean flag that is true when the Form 8-K filing is intended to satisfy the filing obligation of the registrant as pre-commencement communications pursuant to Rule 14d-2(b) under the Exchange Act. Reference 1: http://www.xbrl.org/2003/role/presentationRef
-Publisher SEC
-Name Exchange Act
-Number 240
-Section 14d
-Subsection 2b
| Name: |
dei_PreCommencementTenderOffer |
| Namespace Prefix: |
dei_ |
| Data Type: |
xbrli:booleanItemType |
| Balance Type: |
na |
| Period Type: |
duration |
|
| X |
- DefinitionTitle of a 12(b) registered security. Reference 1: http://www.xbrl.org/2003/role/presentationRef
-Publisher SEC
-Name Exchange Act
-Number 240
-Section 12
-Subsection b
| Name: |
dei_Security12bTitle |
| Namespace Prefix: |
dei_ |
| Data Type: |
dei:securityTitleItemType |
| Balance Type: |
na |
| Period Type: |
duration |
|
| X |
- DefinitionName of the Exchange on which a security is registered. Reference 1: http://www.xbrl.org/2003/role/presentationRef
-Publisher SEC
-Name Exchange Act
-Number 240
-Section 12
-Subsection d1-1
| Name: |
dei_SecurityExchangeName |
| Namespace Prefix: |
dei_ |
| Data Type: |
dei:edgarExchangeCodeItemType |
| Balance Type: |
na |
| Period Type: |
duration |
|
| X |
- DefinitionBoolean flag that is true when the Form 8-K filing is intended to satisfy the filing obligation of the registrant as soliciting material pursuant to Rule 14a-12 under the Exchange Act. Reference 1: http://www.xbrl.org/2003/role/presentationRef
-Publisher SEC
-Name Exchange Act
-Section 14a
-Number 240
-Subsection 12
| Name: |
dei_SolicitingMaterial |
| Namespace Prefix: |
dei_ |
| Data Type: |
xbrli:booleanItemType |
| Balance Type: |
na |
| Period Type: |
duration |
|
| X |
- DefinitionTrading symbol of an instrument as listed on an exchange.
| Name: |
dei_TradingSymbol |
| Namespace Prefix: |
dei_ |
| Data Type: |
dei:tradingSymbolItemType |
| Balance Type: |
na |
| Period Type: |
duration |
|
| X |
- DefinitionBoolean flag that is true when the Form 8-K filing is intended to satisfy the filing obligation of the registrant as written communications pursuant to Rule 425 under the Securities Act. Reference 1: http://www.xbrl.org/2003/role/presentationRef
-Publisher SEC
-Name Securities Act
-Number 230
-Section 425
| Name: |
dei_WrittenCommunications |
| Namespace Prefix: |
dei_ |
| Data Type: |
xbrli:booleanItemType |
| Balance Type: |
na |
| Period Type: |
duration |
|
GMS (NYSE:GMS)
Gráfico Histórico do Ativo
De Dez 2024 até Jan 2025

GMS (NYSE:GMS)
Gráfico Histórico do Ativo
De Jan 2024 até Jan 2025
