Form FWP - Filing under Securities Act Rules 163/433 of free writing prospectuses
05 Agosto 2024 - 10:24AM
Edgar (US Regulatory)

3 Year Callable Contingent Coupon Securities Linked to the Worst of SX5E, NDX and RTY
Preliminary Terms
This summary of terms is not complete and should be read with the preliminary pricing supplement below
|
Issuer:
|
Citigroup Global Markets Holdings Inc.
|
|
Guarantor:
|
Citigroup Inc.
|
|
Underlyings:
|
The EURO STOXX 50® Index (ticker: “SX5E”), the Nasdaq-100 Index® (ticker: “NDX”) and the Russell 2000® Index (ticker: “RTY”)
|
|
Pricing date:
|
August 7, 2024
|
|
Valuation dates:
|
Quarterly
|
|
Maturity date:
|
August 12, 2027
|
|
Contingent coupon:
|
10.00% per annum, paid quarterly only if the closing value of the worst performer is greater than or equal to its coupon barrier value on the related valuation date. You are not assured of receiving any contingent coupon.
|
|
Coupon barrier value:
|
For each underlying, 70.00% of its initial underlying value
|
|
Final barrier value:
|
For each underlying, 70.00% of its initial underlying value
|
|
Redemption:
|
We may call the securities, in whole and not in part, for mandatory redemption on any potential redemption date upon not less than three business days' notice
|
|
Potential redemption dates:
|
Quarterly on valuation dates beginning after six months
|
|
CUSIP / ISIN:
|
17332MUA0 / US17332MUA07
|
|
Initial underlying value:
|
For each underlying, its closing value on the pricing date
|
|
Final underlying value:
|
For each underlying, its closing value on the final valuation date
|
|
Underlying return:
|
For each underlying on any valuation date, (i) its current closing value minus initial underlying value, divided by (ii) its initial underlying value
|
|
Worst performer:
|
On any valuation date, the underlying with the lowest underlying return
|
|
Payment at maturity:
|
•
If the final underlying value of the worst performer is greater than or equal to its final barrier value: $1,000
•
If the final underlying value of the worst performer is less than its final barrier value: $1,000 + ($1,000 × the underlying return of the worst performer on the final valuation date)
If the securities are not redeemed prior to maturity and the final underlying value of the worst performer on the final valuation date is less than its final barrier value, you will receive significantly less than the stated principal amount of your securities, and possibly nothing, at maturity, and you will not receive any contingent coupon payment at maturity.
All payments on the securities are subject to the credit risk of Citigroup Global Markets Holdings Inc. and Citigroup Inc.
|
|
Stated principal amount:
|
$1,000 per security
|
|
Preliminary pricing supplement:
|
|
* Assumes the securities have not been previously redeemed on any interim valuation date
Hypothetical Interim Payment per Security
|
Hypothetical Worst Underlying Return on Interim Valuation Date
|
Hypothetical Payment for Interim Valuation Date*
|
|
100.00%
|
$25.00
|
|
50.00%
|
$25.00
|
|
25.00%
|
$25.00
|
|
0.00%
|
$25.00
|
|
-30.00%
|
$25.00
|
|
-30.01%
|
$0.00
|
|
-50.00%
|
$0.00
|
|
-75.00%
|
$0.00
|
|
-100.00%
|
$0.00
|
Hypothetical Payment at Maturity per Security
Assumes the securities have not been redeemed prior to maturity and does not include the final contingent coupon payment, if any.
|
Hypothetical Worst Underlying Return on Final Valuation Date
|
Hypothetical Payment at Maturity
|
|
100.00%
|
$1,000.00
|
|
50.00%
|
$1,000.00
|
|
25.00%
|
$1,000.00
|
|
0.00%
|
$1,000.00
|
|
-30.00%
|
$1,000.00
|
|
-30.01%
|
$699.90
|
|
-50.00%
|
$500.00
|
|
-75.00%
|
$250.00
|
|
-100.00%
|
$0.00
|

Selected Risk Considerations |
|
|
Additional Information |
•
You may lose a significant portion or all of your investment. Unlike conventional debt securities, the securities do not provide for the repayment of the stated principal amount at maturity in all circumstances. If the securities are not redeemed prior to maturity, your payment at maturity will depend on the final underlying value of the worst performer on the final valuation date. If the final underlying value of the worst performer on the final valuation date is less than its final barrier value, you will lose 1% of the stated principal amount of your securities for every 1% by which the worst performer on the final valuation date has declined from its initial underlying value. There is no minimum payment at maturity on the securities, and you may lose up to all of your investment.
•
You will not receive any contingent coupon following any valuation date on which the closing value of the worst performer on that valuation date is less than its coupon barrier value.
•
We may redeem the securities at our option, which will limit your ability to receive the contingent coupon payments.
•
The securities are subject to heightened risk because they have multiple underlyings.
•
The return on the securities depends solely on the performance of the worst performer. As a result, the securities are subject to the risks of each of the underlyings and will be negatively affected if any one underlying performs poorly.
•
You will be subject to risks relating to the relationship between the underlyings. The less correlated the underlyings, the more likely it is that any one of the underlyings will perform poorly over the term of the securities. All that is necessary for the securities to perform poorly is for one of the underlyings to perform poorly.
•
The securities offer downside exposure, but no upside exposure, to the underlyings.
•
The securities are particularly sensitive to the volatility of the closing values of the underlyings on or near the valuation dates.
•
The securities are subject to the credit risk of Citigroup Global Markets Holdings Inc. and Citigroup Inc. If Citigroup Global Markets Holdings Inc. defaults on its obligations under the securities and Citigroup Inc. defaults on its guarantee obligations, you may not receive anything owed to you under the securities.
•
The securities will not be listed on any securities exchange and you may not be able to sell them prior to maturity.
•
The estimated value of the securities on the pricing date will be less than the issue price. For more information about the estimated value of the securities, see the accompanying preliminary pricing supplement.
•
The value of the securities prior to maturity will fluctuate based on many unpredictable factors.
•
The Russell 2000® Index is subject to risks associated with small capitalization stocks.
•
The issuer and its affiliates may have conflicts of interest with you.
•
The U.S. federal tax consequences of an investment in the securities are unclear.
|
|
|
Citigroup Global Markets Holdings Inc. and Citigroup Inc. have filed registration statements (including the accompanying preliminary pricing supplement, product supplement, underlying supplement, prospectus supplement and prospectus) with the Securities and Exchange Commission (“SEC”) for the offering to which this communication relates. Before you invest, you should read the accompanying preliminary pricing supplement, product supplement, underlying supplement, prospectus supplement and prospectus in those registration statements (File Nos. 333-270327 and 333-270327-01) and the other documents Citigroup Global Markets Holdings Inc. and Citigroup Inc. have filed with the SEC for more complete information about Citigroup Global Markets Holdings Inc., Citigroup Inc. and this offering. You may obtain these documents without cost by visiting EDGAR on the SEC website at www.sec.gov. Alternatively, you can request these documents by calling toll-free 1-800-831-9146.
Filed pursuant to Rule 433
|
|
The above summary of selected risks does not describe all of the risks associated with an investment in the securities. You should read the accompanying preliminary pricing supplement and product supplement for a more complete description of risks relating to the securities.
|
|
|
This offering summary does not contain all of the material information an investor should consider before investing in the securities. This offering summary is not for distribution in isolation and must be read together with the accompanying preliminary pricing supplement and the other documents referred to therein, which can be accessed via the link on the first page.
|
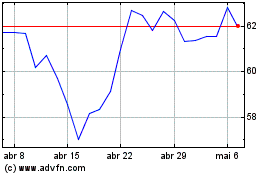
Citigroup (NYSE:C)
Gráfico Histórico do Ativo
De Dez 2024 até Jan 2025

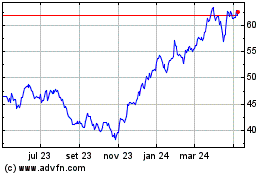
Citigroup (NYSE:C)
Gráfico Histórico do Ativo
De Jan 2024 até Jan 2025
