Form FWP - Filing under Securities Act Rules 163/433 of free writing prospectuses
18 Setembro 2024 - 12:54PM
Edgar (US Regulatory)

Citigroup Global Markets Holdings Inc. Guaranteed by Citigroup Inc. 5 Year Autocallable Contingent Coupon Securities Linked to the Worst of SPXDPU1 and SMH Preliminary Terms This summary of terms is not complete and should be read with the preliminary pricing supplement below I ssuer : Citigroup Global Markets Holdings Inc . G uarantor : Citigroup Inc . Underlyings : The S&P 500 Dynamic Participation Index (ticker : “SPXDPU 1 ”) and the VanEck Vectors ® Semiconductor ETF (ticker : “SMH”) P ricing date : October 4 , 2024 Valuation dates : Monthly M aturity date : October 10 , 2029 Contingent coupon: At least 7.00% per annum*, paid monthly only if the closing value of the worst performer is greater than or equal to its coupon barrier value on the related valuation date. You are not assured of receiving any contingent coupon. If the closing value of the worst performer on one or more valuation dates is less than its coupon barrier value and, on a subsequent valuation date, the closing value of the worst performer on that subsequent valuation date is greater than or equal to its coupon barrier value, your contingent coupon payment for that subsequent valuation date will include all previously unpaid contingent coupon payments Coupon barrier value: For each underlying, 60.00% of its initial underlying value F inal buffer value: For each underlying, 85.00% of its initial underlying value B uffer percentage: 15.00% Automatic early redemption: If on any autocall date the closing value of the worst performer is greater than or equal to its initial underlying value, the securities will be automatically called for an amount equal to the principal plus the related contingent coupon A utocall dates: Monthly on valuation dates beginning after one year C USIP / ISIN: 173070 DC 4 / US 173070 DC 45 I nitial underlying value: For each underlying, its closing value on the pricing date F inal underlying value: For each underlying, its closing value on the final valuation date Underlying return: For each underlying on any valuation date, (i) its current closing value minus initial underlying value, divided by (ii) its initial underlying value Worst performer: On any valuation date, the underlying with the lowest underlying return Payment at maturity (if not autocalled): • If the final underlying value of the worst performer is greater than or equal to its final buffer value: $1,000 • If the final underlying value of the worst performer is less than its final buffer value: $1,000 + [$1,000 п (the underlying return of the worst performer on the final valuation date + the buffer percentage)] If the securities are not automatically redeemed prior to maturity and the final underlying value of the worst performer on the final valuation date is less than its final buffer value, which means that the worst performer on the final valuation date has depreciated from its initial underlying value by more than the buffer percentage, you will lose 1% of the stated principal amount of your securities at maturity for every 1% by which that depreciation exceeds the buffer percentage. All payments on the securities are subject to the credit risk of Citigroup Global Markets Holdings Inc. and Citigroup Inc. S tated principal amount: $1,000 per security Preliminary pricing supplement: P reliminary Pricing Supplement dated September 17, 2024 * The actual contingent coupon rate will be determined on the pricing date. ** The hypotheticals assume that the contingent coupon will be set at the lowest value indicated in this offering summary. *** Assumes the interim valuation date is also an autocall date. **** Plus any previously paid contingent coupon payments. Hypothetical Interim Payment per Security ** Hypothetical Worst Underlying Return on Hypothetical Payment for Interim Valuation Interim Valuation Date Date Hypothetical Redemption *** 100.00% 50.00% 25.00% 0.00% $1,005.833 **** $1,005.833 **** $1,005.833 **** $1,005.833 **** R e d e emed R e d e emed R e d e emed R e d e emed - 0.01% - 25. 0 0% - 40. 0 0% $5.833 **** $5.833 **** $5.833 **** Securities not redeemed Securities not redeemed Securities not redeemed - 40.01% - 50.00% - 75.00% - 100 . 00% $0.00 $0.00 $0.00 $0.00 Securities not redeemed Securities not redeemed Securities not redeemed Securities not redeemed Hypothetical Payment at Maturity per Security Assumes the securities have not been automatically redeemed prior to maturity and does not include the final contingent coupon payment, if any. Hypothetical Worst Underlying Return Hypothetical Payment at Maturity on Final Valuation Date $1,000.00 1 0 0 . 0 0 % $1,000.00 5 0 . 0 0 % $1,000.00 2 5 . 0 0 % $1,000.00 0 . 0 0 % $1,000.00 - 1 5 . 0 0 % $999.90 - 1 5 . 0 1 % $900.00 - 2 5 . 0 0 % $650.00 - 5 0 . 0 0 % $400.00 - 7 5 . 0 0 % $150.00 -

Citigroup Global Markets Holdings Inc. Guaranteed by Citigroup Inc. Selected Risk Considerations • You may lose a significant portion of your investment. Unlike conventional debt securities, the securities do not provide for the repayment of the stated principal amount at maturity in all circumstances. If the securities are not automatically redeemed prior to maturity, your payment at maturity will depend on the final underlying value of the worst performer on the final valuation date. If the final underlying value of the worst performer on the final valuation date is less than its final buffer value, which means that the worst performer on the final valuation date has depreciated from its initial underlying value by more than the buffer percentage, you will lose 1% of the stated principal amount of your securities for every 1% by which that depreciation exceeds the buffer percentage. • You will not receive any contingent coupon following any valuation date on which the closing value of the worst performer on that valuation date is less than its coupon barrier value. You will only receive a contingent coupon payment that has not been paid on a subsequent contingent coupon payment date if and only if the closing value of the worst performer on the related valuation date is greater than or equal to its coupon barrier value. • The securities are subject to heightened risk because they have multiple underlyings. • The return on the securities depends solely on the performance of the worst performer. As a result, the securities are subject to the risks of each of the underlyings and will be negatively affected if any one underlying performs poorly. • You will be subject to risks relating to the relationship between the underlyings. The less correlated the underlyings, the more likely it is that any one of the underlyings will perform poorly over the term of the securities. All that is necessary for the securities to perform poorly is for one of the underlyings to perform poorly. • The securities may be automatically redeemed prior to maturity, limiting your opportunity to receive contingent coupons if the worst performer performs in a way that would otherwise be favorable. • The securities offer downside exposure, but no upside exposure, to the underlyings. • The securities are particularly sensitive to the volatility of the closing values of the underlyings on or near the valuation dates . • The securities are subject to the credit risk of Citigroup Global Markets Holdings Inc . and Citigroup Inc . If Citigroup Global Markets Holdings Inc . defaults on its obligations under the securities and Citigroup Inc . defaults on its guarantee obligations, you may not receive anything owed to you under the securities . • The securities will not be listed on any securities exchange and you may not be able to sell them prior to maturity . • The estimated value of the securities on the pricing date will be less than the issue price . For more information about the estimated value of the securities, see the accompanying preliminary pricing supplement . • The value of the securities prior to maturity will fluctuate based on many unpredictable factors . • The VanEck Vectors ® Semiconductor ETF is subject to risks associated with the semiconductor production and equipment sector. • The issuer and its affiliates may have conflicts of interest with you. • The U.S. federal tax consequences of an investment in the securities are unclear. Additional Information Citigroup Global Markets Holdings Inc. and Citigroup Inc. have filed registration statements (including the accompanying preliminary pricing supplement, product supplement, underlying supplement, prospectus supplement and prospectus) with the Securities and Exchange Commission (“SEC”) for the offering to which this communication relates. Before you invest, you should read the accompanying preliminary pricing supplement, product supplement, underlying supplement, prospectus supplement and prospectus in those registration statements (File Nos. 333 - 270327 and 333 - 270327 - 01) and the other documents Citigroup Global Markets Holdings Inc. and Citigroup Inc. have filed with the SEC for more complete information about Citigroup Global Markets Holdings Inc., Citigroup Inc. and this offering. You may obtain these documents without cost by visiting EDGAR on the SEC website at www.sec.gov. Alternatively, you can request these documents by calling toll - free 1 - 800 - 831 - 9146. Filed pursuant to Rule 433 The a b o v e su m mary of se l e ct ed r i s ks d o e s n ot d e s cr i be al l of t he r i s k s as s o c i a t e d w i t h a n i n v e st m e nt i n t h e se c ur i t i e s. You s h o u l d r e a d t h e a cc o mp an y i n g p r e l i m i nary p r i c i ng s u p pl em e nt and p r odu c t s u p p l e m e n t for a m o re c o m p l e t e de sc ri p t i on o f risks r e l a t i n g to t h e s e c u r i t i e s . This offering summary does not contain all of the material information an investor should consider before investing in the securities. This offering summary is not for distribution in isolation and must be read together with the accompanying preliminary pricing supplement and the other documents referred to therein, which can be accessed via the link on the first page.
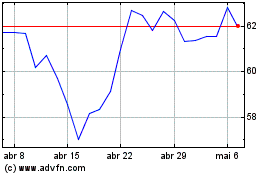
Citigroup (NYSE:C)
Gráfico Histórico do Ativo
De Dez 2024 até Jan 2025

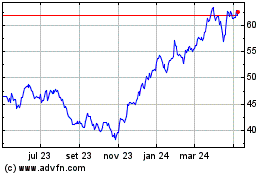
Citigroup (NYSE:C)
Gráfico Histórico do Ativo
De Jan 2024 até Jan 2025
