Pay vs Performance Disclosure
|
12 Months Ended |
|
Dec. 31, 2024
USD ($)
|
Dec. 31, 2023
USD ($)
|
Dec. 31, 2022
USD ($)
|
Dec. 31, 2021
USD ($)
|
| Pay vs Performance Disclosure |
|
|
|
|
| Pay vs Performance Disclosure, Table |
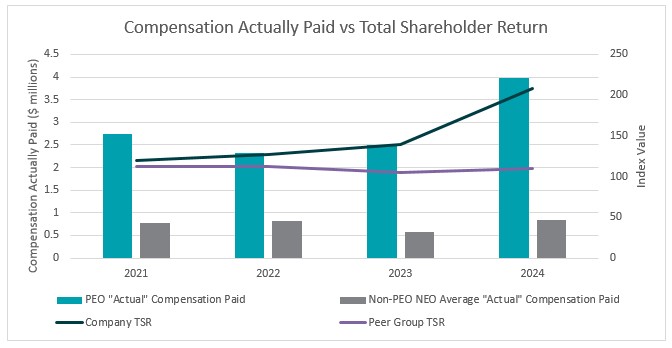
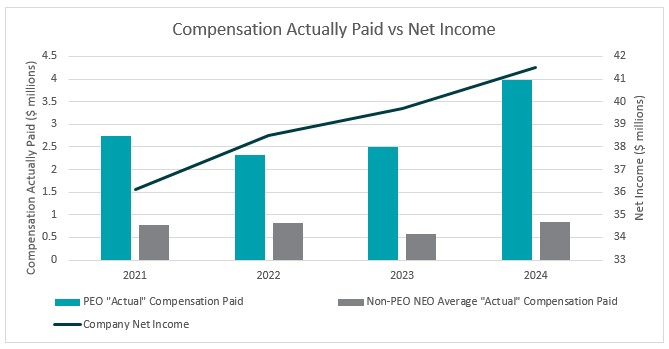
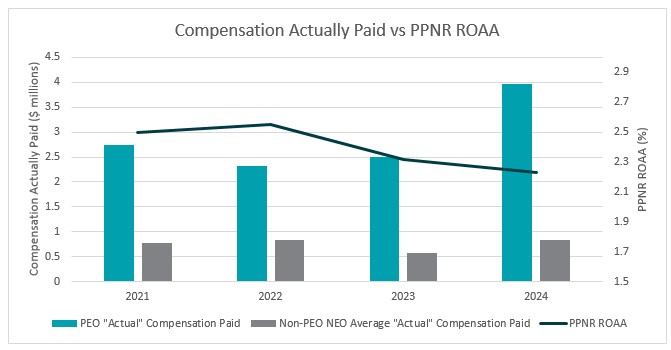
| | | | | | | | | | | | | | | | | | | Summary | | Average Summary | Average | Value of Initial Fixed | | Bank | | Compensation | Compensation | Compensation Table | Compensation | $100 Investment Based On: | | Pre Provision | | Table Total For | Actually Paid to | Total for Non-PEO | Actually Paid to | Total Shareholder | Peer Group Total | Net Income | Net Revenue | Year | PEO ($) | PEO ($) | NEOs ($) | Non-PEO NEOs ($) | Return ($) | Shareholder Return ($) | (in millions) | (PPNR) ROAA | | (1) | (1) | (2) | (2) | | (3) | | | 2024 | 3,300,108 | 3,972,908 | 679,591 | 843,398 | 207.94 | 110.50 | 41.5 | 2.23 | 2023 | 2,360,462 | 2,503,103 | 544,748 | 575,735 | 139.49 | 104.92 | 39.7 | 2.32 | 2022 | 2,207,257 | 2,323,003 | 797,723 | 827,847 | 126.86 | 112.59 | 38.5 | 2.55 | 2021 | 2,373,879 | 2,733,535 | 613,293 | 772,845 | 120.00 | 112.83 | 36.1 | 2.50 |
| 1) | The Company’s Principal Executive Officer “PEO” is James A. Hughes. |
| 2) | The Company’s current Non-PEO NEOs consist of George Boyan, Vincent Geraci, James Donovan, and Daniel Sharabba. Prior periods include Laureen Cook who resigned as Senior Vice President and Chief Accounting Officer on April 8, 2022, Janice Bolomey who resigned as Executive Vice President and Chief Administrator Officer on June 30, 2023, John Kauchak who retired as Executive Vice President and Chief Operating Officer on June 30, 2023, and James Davies Senior Vice President and Controller who was reported on the 2024 Proxy. |
| 3) | For the years in which public shareholder return data was available, the Company’s peer group total shareholder consists of data compiled on the following banks: American Bank, BCB Community Bank, Blue Foundry Bank, ConnectOne Bank, Embassy Bank for the Lehigh Valley, ESSA Bank & Trust, First Bank, First Commerce Bank, Kearny Bank, Lakeland Bank, Magyar Bank, Parke Bank, Peapack-Gladstone Bank, Provident Bank, QNB Bank, The Bank of Princeton, and Univest Bank and Trust Co. |
|
|
|
|
| Company Selected Measure Name |
Bank Pre Provision Net Revenue (PPNR) ROAA
|
|
|
|
| Named Executive Officers, Footnote |
| 1) | The Company’s Principal Executive Officer “PEO” is James A. Hughes. |
| 2) | The Company’s current Non-PEO NEOs consist of George Boyan, Vincent Geraci, James Donovan, and Daniel Sharabba. Prior periods include Laureen Cook who resigned as Senior Vice President and Chief Accounting Officer on April 8, 2022, Janice Bolomey who resigned as Executive Vice President and Chief Administrator Officer on June 30, 2023, John Kauchak who retired as Executive Vice President and Chief Operating Officer on June 30, 2023, and James Davies Senior Vice President and Controller who was reported on the 2024 Proxy. |
|
|
|
|
| Peer Group Issuers, Footnote |
| 3) | For the years in which public shareholder return data was available, the Company’s peer group total shareholder consists of data compiled on the following banks: American Bank, BCB Community Bank, Blue Foundry Bank, ConnectOne Bank, Embassy Bank for the Lehigh Valley, ESSA Bank & Trust, First Bank, First Commerce Bank, Kearny Bank, Lakeland Bank, Magyar Bank, Parke Bank, Peapack-Gladstone Bank, Provident Bank, QNB Bank, The Bank of Princeton, and Univest Bank and Trust Co. |
|
|
|
|
| PEO Total Compensation Amount |
$ 3,300,108
|
$ 2,360,462
|
$ 2,207,257
|
$ 2,373,879
|
| PEO Actually Paid Compensation Amount |
$ 3,972,908
|
2,503,103
|
2,323,003
|
2,733,535
|
| Adjustment To PEO Compensation, Footnote |
Below is a summary of the adjustments used to determine compensation “actually paid” for the Company’s PEO and Non-PEO NEOs: | | | | | | | | | | | | | 2024 | 2023 | 2022 | 2021 | Deduction for Amounts Reported under the "Stock Awards" Column | $ | (1,080,415) | (774,000) | (1,378,660) | (923,512) | Deduction for Amounts Reported under "Option Awards" Column | | — | — | — | (416,967) | Increase for Fair Value of Awards Granted during year that Remain Unvested as of Year-End | | 1,678,985 | 1,109,625 | 1,339,170 | 1,385,248 | Increase for Fair Value of Awards Granted during year that Vest during year | | — | — | — | — | Increase for Change in Fair Value from Prior-Year End to Current Year-End of Awards Granted Prior to year that were Outstanding and Unvested as of Year-End | | 677,334 | 182,683 | 98,841 | 795,659 | Increase (decrease) for Change in Fair Value from Prior Year-End to Vesting Date of Awards Granted Prior to year that Vested during year | | 1,960 | (240,298) | 138,592 | 293,855 | Deduction of Fair Value of Awards Granted Prior to Year that were Forfeited during year | | — | — | — | — | Increase based upon Incremental Fair Value of Awards Modified during year | | — | — | — | — | Increase based on Dividends or Other Earnings Paid during year prior to Vesting Date of Award | | 50,161 | 50,556 | 38,300 | 23,135 |
|
|
|
|
| Non-PEO NEO Average Total Compensation Amount |
$ 679,591
|
544,748
|
797,723
|
613,293
|
| Non-PEO NEO Average Compensation Actually Paid Amount |
$ 843,398
|
575,735
|
827,847
|
772,845
|
| Adjustment to Non-PEO NEO Compensation Footnote |
Below is a summary of the adjustments used to determine compensation “actually paid” for the Company’s PEO and Non-PEO NEOs: | | | | | | | | | | | | | 2024 | 2023 | 2022 | 2021 | Deduction for Amounts Reported under the "Stock Awards" Column | $ | (1,080,415) | (774,000) | (1,378,660) | (923,512) | Deduction for Amounts Reported under "Option Awards" Column | | — | — | — | (416,967) | Increase for Fair Value of Awards Granted during year that Remain Unvested as of Year-End | | 1,678,985 | 1,109,625 | 1,339,170 | 1,385,248 | Increase for Fair Value of Awards Granted during year that Vest during year | | — | — | — | — | Increase for Change in Fair Value from Prior-Year End to Current Year-End of Awards Granted Prior to year that were Outstanding and Unvested as of Year-End | | 677,334 | 182,683 | 98,841 | 795,659 | Increase (decrease) for Change in Fair Value from Prior Year-End to Vesting Date of Awards Granted Prior to year that Vested during year | | 1,960 | (240,298) | 138,592 | 293,855 | Deduction of Fair Value of Awards Granted Prior to Year that were Forfeited during year | | — | — | — | — | Increase based upon Incremental Fair Value of Awards Modified during year | | — | — | — | — | Increase based on Dividends or Other Earnings Paid during year prior to Vesting Date of Award | | 50,161 | 50,556 | 38,300 | 23,135 |
|
|
|
|
| Compensation Actually Paid vs. Total Shareholder Return |
|
|
|
|
| Compensation Actually Paid vs. Net Income |
|
|
|
|
| Compensation Actually Paid vs. Company Selected Measure |
|
|
|
|
| Total Shareholder Return Vs Peer Group |
|
|
|
|
| Tabular List, Table |
| | | | Financial Measure | Description | Pre-Provision Net Revenue (PPNR) ROAA | Pre-provision Net Revenue("PPNR") is a Non-GAAP measure and is defined as the Bank's income before provision for income taxes, less provision for credit losses divided by average total assets. Information obtained from Call Report data. | Pre-Provision Net Revenue (PPNR) ROAE | Pre-provision Net Revenue("PPNR") ROAE is a Non-GAAP measure and is defined as the Bank's income before provision for income taxes, less provision for credit losses divided by average total equity. Information obtained from Call Report data. |
|
|
|
|
| Total Shareholder Return Amount |
$ 207.94
|
139.49
|
126.86
|
120
|
| Peer Group Total Shareholder Return Amount |
110.5
|
104.92
|
112.59
|
112.83
|
| Net Income (Loss) |
$ 41,500,000
|
$ 39,700,000
|
$ 38,500,000
|
$ 36,100,000
|
| Company Selected Measure Amount |
2.23
|
2.32
|
2.55
|
2.5
|
| PEO Name |
James A. Hughes.
|
|
|
|
| Measure:: 1 |
|
|
|
|
| Pay vs Performance Disclosure |
|
|
|
|
| Name |
Pre-Provision Net Revenue (PPNR) ROAA
|
|
|
|
| Measure:: 2 |
|
|
|
|
| Pay vs Performance Disclosure |
|
|
|
|
| Name |
Pre-Provision Net Revenue (PPNR) ROAE
|
|
|
|
| Year-end Fair Value of Equity Awards Granted in Covered Year that are Outstanding and Unvested |
|
|
|
|
| Pay vs Performance Disclosure |
|
|
|
|
| Adjustment to Compensation, Amount |
$ 1,678,985
|
$ 1,109,625
|
$ 1,339,170
|
$ 1,385,248
|
| Year-over-Year Change in Fair Value of Equity Awards Granted in Prior Years That are Outstanding and Unvested |
|
|
|
|
| Pay vs Performance Disclosure |
|
|
|
|
| Adjustment to Compensation, Amount |
677,334
|
182,683
|
98,841
|
795,659
|
| Prior Year End Fair Value of Equity Awards Granted in Any Prior Year that Fail to Meet Applicable Vesting Conditions During Covered Year |
|
|
|
|
| Pay vs Performance Disclosure |
|
|
|
|
| Adjustment to Compensation, Amount |
1,960
|
(240,298)
|
138,592
|
293,855
|
| Dividends or Other Earnings Paid on Equity Awards not Otherwise Reflected in Total Compensation for Covered Year |
|
|
|
|
| Pay vs Performance Disclosure |
|
|
|
|
| Adjustment to Compensation, Amount |
50,161
|
50,556
|
38,300
|
23,135
|
| Deduction for Amounts Reported under the "Stock Awards" Column |
|
|
|
|
| Pay vs Performance Disclosure |
|
|
|
|
| Adjustment to Compensation, Amount |
$ (1,080,415)
|
$ (774,000)
|
$ (1,378,660)
|
(923,512)
|
| Deduction for Amounts Reported under "Option Awards" Column |
|
|
|
|
| Pay vs Performance Disclosure |
|
|
|
|
| Adjustment to Compensation, Amount |
|
|
|
$ (416,967)
|
