All figures are in United States dollars and
all production figures are on a 100%-basis and continuing
operations basis, unless otherwise stated. This news release
contains forward-looking information regarding Centerra Gold’s
business and operations. See “Caution Regarding Forward-Looking
Information” in Centerra Gold’s Management’s Discussion &
Analysis for the three and nine months ended
September 30, 2022 (“MD&A”) included in this
press release. All references in this document denoted with
NG indicate a “specified financial measure”
within the meaning of National Instrument 52-112 Non-GAAP and Other
Financial Measures Disclosure of the Canadian Securities
Administrators. None of these specified measures is a standardized
financial measure under International Financial Reporting Standards
(“IFRS”) and these measures might not be comparable to similar
financial measures disclosed by other issuers. See “Non-GAAP and
Other Financial Measures” in the MD&A included in this press
release for a discussion of the specified financial measures used
in this document and a reconciliation to the most directly
comparable IFRS measure.
TORONTO, Nov. 07, 2022 (GLOBE NEWSWIRE) --
Centerra Gold Inc. (“Centerra” or the “Company”) (TSX: CG and NYSE:
CGAU) today reported its third quarter of 2022 results.
Significant financial and operating results of
the third quarter ended September 30, 2022 included:
- Net loss for the
quarter of $33.9 million or $0.14 per common share (basic),
including a deferred income tax expense of $27.6 million.
- Adjusted
lossNG for the quarter of
$15.9 million or $0.06 per common share (basic).
- Cash used in operating
activities for the quarter of $17.0 million, was primarily
due to a suspension of gold room operations at the ADR plant at the
Öksüt Mine. No gold ounces were sold at the Öksüt Mine in the
period but cash used in operating activities was $18.0 million with
continued mining and stacking of ore. Mount Milligan Mine generated
cash provided by mine operating activities of $33.4 million during
the quarter.
- Free cash flow
deficitNG for the quarter of
$35.5 million.
- Gold production
for the quarter of 54,134 ounces, solely from the Mount Milligan
Mine. At the Öksüt Mine, approximately 40,000 ounces were processed
into stored gold-in-carbon inventory during the quarter, increasing
the total stored gold-in-carbon inventory balance to approximately
100,000 recoverable ounces at the end of September.
- Copper production
for the quarter of 19.0 million pounds.
- Gold production
costs for the quarter of $729 per ounce.
- Copper production
costs for the quarter of $1.51 per pound.
- All-in sustaining costs on
a by-product basisNG for the
quarter of $941 per ounce was impacted by no gold ounces sold at
the lower cost Öksüt Mine during the quarter, but partially offset
by higher gold production and lower capital expenditures at the
Mount Milligan Mine.
- All-in costs on a
by-product basisNG for the
quarter of $1,376 per ounce due to higher exploration and project
development costs incurred primarily at the Company’s Goldfield
project and existing operating mines.
- Strong balance
sheet with a cash position at the quarter-end of $580.8
million.
- Öksüt Mine’s leaching
operations were suspended in August but mining, crushing and
stacking activities continue. Following discussions with
Turkish officials relating to the Öksüt Mine’s Environment Impact
Assessment (“EIA”) the Company has ceased leaching ore on its heap
leach pad and using activated carbon to process gold into
gold-in-carbon form effective August 2022. The Company’s mercury
abatement retrofit to the ADR plant is expected to be completed in
late 2022. In August 2022, the Company submitted an application to
update its EIA and expects to make a further detailed submission,
inclusive of all required technical studies, by the end of 2022.
The Company expects to work with Turkish officials and other
stakeholders thereafter on the regulatory review and approval of
its EIA and such other permits that may be required to allow a
timely full restart of all operations. For further details, see
“Update on Öksüt Mine Operations”.
- Centerra closed the global
arrangement agreement with Kyrgyzaltyn JSC (“Kyrgyzaltyn”) and
Kyrgyz Republic to effect a separation of Centerra from
Kyrgyzaltyn and the Kyrgyz Republic. The Company cancelled all of
Kyrgyzaltyn’s 77.4 million Centerra common shares upon closing of
the this transaction. For further details, see the Company’s news
releases dated April 4, 2022 and July 29, 2022.
- Goldfield District Project
drilling activities continue with four rigs currently at
site at the end of the quarter. The Company is targeting an initial
resource estimate by mid-year 2023 and an updated resource estimate
accompanied by the completion of a feasibility study
thereafter.
- The Molybdenum Business
Unit continued to implement a new streamlined business
plan at its Langeloth Facility, reducing inventories held
and overall working capital to generate free cash flow from
operationsNG of $7.2 million during the quarter. With
improving molybdenum prices, the Company continues to evaluate
strategic options for the business unit, including a potential
restart of the Thompson Creek Mine.
- The Company announced a
Normal Course Issuer Bid (“NCIB”) which was accepted by
the Toronto Stock Exchange in October 2022. The Company expects to
commence the market purchase of shares subsequent to filing its
third quarter results, subject to market conditions.
- The Company announced the
highlights of the new life of mine (“LOM”) plan for the Mount
Milligan Mine with the mine life extended by over four years to
2033 and an increase in the proven and probable reserves of 1.1
million contained ounces of gold and 260 million contained pounds
of copper. A detailed overview of the LOM can be found in the NI
43-101 Technical Report, titled “Technical Report on The Mount
Milligan Mine” with an effective date of December 31, 2021, being
filed on SEDAR at www.sedar.com and EDGAR at www.sec.gov/edgar on November 7, 2022.
- 2022 guidance remains
unchanged from the revised guidance issued in the second
quarter. The Company remains on track for 2022 copper production
guidance and cost guidance and is trending towards the lower end of
gold production guidance.
- Quarterly Dividend
declared of CAD$0.07 per common share.
CEO
Discussion
Paul Wright, Interim President and Chief
Executive Officer of Centerra stated, “Since accepting the role of
Interim President and Chief Executive Officer on September 6, 2022,
I’ve been able to use my first 60 days to visit all of our
operating sites and engage many of our shareholders, The
overarching impression that I’ve been left with is that we have
solid operating teams managing our assets, and I’m excited for the
future of the Company.”
“In the third quarter of 2022, the Company
continued to demonstrate that safety remains Centerra’s top
priority, with the Öksüt Mine’s team achieving one million hours
without a lost time injury. Subsequent to the quarter-end, the
Company announced highlights from the Mount Milligan Mine’s LOM,
including an extension of the mine life to 2033 and an increase in
proven and probable gold and copper reserves of 1.1 million
contained ounces and 260 million contained pounds,
respectively.”
“On the operational front, the Mount Milligan
Mine produced 54,134 ounces of gold and 19.0 million pounds of
copper in the third quarter, and at the Öksüt Mine, approximately
40,000 ounces were added to the stored in gold-in-carbon inventory.
The Mount Milligan Mine 2022 gold and copper production remains on
track and the mine continues to forecast strong cash flows for the
year.”
“At the Öksüt Mine, the retrofit of the ADR
plant remains on track to be completed in late 2022. The Company
suspended leaching operations at the Öksüt Mine in August 2022
while it advances its applications for an updated EIA, but mining,
crushing and stacking activities continue at the mine. The extent
of mining, crushing and stacking activity for the remainder of the
year will continue to be evaluated as the Company advances through
the permitting process and may be reduced significantly prior to
the end of the year.”
“Financially, in the third quarter, we recorded
a consolidated free cash flow deficitNG of $35.5
million; however, the free cash flow from mine
operationsNG generated at the Mount Milligan Mine of
$20.9 million was able to offset a majority of the free cash flow
deficit from mine operationsNG at the Öksüt Mine of
$23.0 million. The Company ended the quarter with a cash position
at the end of the period of $580.8 million. Based on the Company’s
strong financial position, the Board approved a quarterly dividend
of CAD$0.07 per share on November 4, 2022 to shareholders of
record on November 18, 2022. In consideration of Centerra’s current
market valuation and to increase shareholder returns, in October
the Company also announced a normal course issuer bid.”
Update on Öksüt Mine
Operations
On March 18, 2022, Centerra announced that it
had suspended gold doré bar production at the Öksüt Mine due to
mercury detected in the gold room at the ADR plant. An engineered
solution was developed with the assistance of external consultants
to ensure that mercury levels are detected, monitored and captured
to prevent exposure to personnel and to safeguard the environment.
The Company is currently constructing a mercury retort system to
allow mercury to be safely vaporized from the sludge with the vapor
condensed and collected in a fully contained system. The furnace
off-gas system will also be replaced to ensure that any remaining
mercury is scrubbed from the gas and captured.
All of the major equipment is mostly fabricated
and has largely been delivered to site. Construction is progressing
well and is expected to be completed in late 2022, with total
capital costs expected to be approximately $5 million. The Company
will work with relevant authorities to obtain the required
approvals to restart gold room operations at the ADR plant which
the Company now expects will occur once shortly after the new EIA
for the Öksüt Mine is approved.
From the date of suspension of gold room
operations through to August 2022, the Company continued to process
ore into gold-in-carbon form and has approximately 100,000
recoverable ounces of stored gold-in-carbon as at
September 30, 2022.
Permitting
In May 2022 the Öksüt Mine was inspected by the
Ministry of Environment, Urbanization and Climate Change (the
“Ministry of Environment”). The Ministry of Environment informed
the Öksüt Mine of a number of deficiencies relating to the Öksüt
Mine’s environmental impact assessment (“EIA”). The Company has
worked to address the majority of the deficiencies and following
several further discussions with the Ministry of Environment, the
Company: (i) determined that an updated EIA should be prepared and
submitted to clarify various production and other capacity limits
and to align the EIA permit levels with expected operating plans;
(ii) the Öksüt Mine suspended leaching of ore on the heap leach pad
and ceased using activated carbon on site effective late August
2022 though mining, crushing and stacking activities continue in
line with existing EIA limits. The extent of mining, crushing and
stacking activity for the remainder of the year will continue to be
evaluated as the Company advances through the permitting process
and may be reduced significantly prior to the end of the year.
The Öksüt Mine’s application to update its EIA
was submitted to regulators at the end of August 2022 and the full
EIA submission, inclusive of all supporting technical studies, is
expected to be submitted before the end of 2022. Following the
final EIA submission, the Company expects to work with Turkish
officials and other stakeholders on the regulatory review and
approval of its EIA and such other permits that may be required to
allow a timely full restart of all operations. Once
operations resume, the ADR plant is expected to have sufficient
production capacity to process up to approximately 35,000 ounces of
gold per month, which would allow the stored gold-in-carbon
inventory to be processed on a timely basis.
The Company is also in pursuit of other ordinary
course permits, including: (i) an enlarged grazing land permit to
allow expansion of the existing operation to the currently defined
EIA boundary of the Keltepe and Güneytepe pits; and (ii) an
extension of the Öksüt Mine’s overall operating license which is
scheduled to expire in January 2023.
Exploration Update
Exploration activities in the third quarter of
2022 included drilling, surface sampling, geological mapping and
geophysical surveying at the Company’s various projects and earn-in
properties, targeting gold and copper mineralization in Canada,
Türkiye, and the United States of America. Exploration expenditures
in the third quarter of 2022 were $23.2 million. The activities
were primarily focused on expanded drilling programs at the Mount
Milligan Mine in British Columbia, the Öksüt Mine in Türkiye, the
Goldfield Project in Nevada, and greenfield projects in the USA and
Türkiye.
At the Mount Milligan Mine, 32 diamond drill
holes, totalling 16,653 metres, were completed in the third quarter
of 2022, including brownfield exploration drilling (11,801 metres
in 22 drill holes) and resource expansion drilling (4,852 metres in
10 drill holes). The Company expects to continue exploration
drilling in the fourth quarter of 2022.
At the Öksüt Mine, 43 drill holes and 18 reverse
circulation (“RC”) drill holes, totalling 15,840 metres, were
completed in the third quarter of 2022. Exploration drilling
activities were mainly undertaken at the Keltepe, Güneytepe,
Keltepe North, Keltepe Northwest, and Keltepe North-Northwest
deposits with the aim of expanding known oxide gold mineralization
resources. Drilling also continued testing peripheral targets, such
as the Yelibelen and Büyüktepe prospects. The Company expects to
continue this work in the fourth quarter.
At the Goldfield Project, exploration activities
in the third quarter of 2022 included brownfield diamond core and
RC drilling at the Gemfield and Goldfield Main deposits. Drill
programs included infill, resource expansion, and exploration
drilling, as well metallurgical, geotechnical, and hydrogeochemical
drilling in support of the preparation of an initial resource
estimate in 2023 and a feasibility study thereafter. Drilling
comprised 12,400 metres of exploration drilling and technical
services drilling in 54 drill holes, including 24 RC drill holes
for 5,400 metres and 30 diamond drill holes for 7,000 metres. Late
in the quarter, two additional rigs were added to increase drill
production for the total of four rigs at site as of September 30,
2022. As of the end of the third quarter, 16,500 metres of
exploration and technical services drilling have been completed in
80 drill holes in 2022. All assay results are pending. The Company
expects to continue this work in the fourth quarter of 2022.
Selected drill program results and intercepts
are highlighted in the supplementary data at the end of this news
release. The drill collar locations and associated graphics are
available at the following: https://ml.globenewswire.com/media/b54b7caa-fb95-4b8b-99ad-1ac639294106/document/?v=11042022080500.
About Centerra
Centerra Gold Inc. is a Canadian-based mining
company focused on operating, developing, exploring and acquiring
gold and copper properties in North America, Türkiye, and other
markets worldwide. Centerra operates two mines: the Mount Milligan
Mine in British Columbia, Canada, and the Öksüt Mine in Türkiye.
The Company also owns the Goldfield District Project in Nevada,
United States, the Kemess Underground Project in British Columbia,
Canada, and owns and operates the Molybdenum Business Unit in the
United States and Canada. Centerra's shares trade on the Toronto
Stock Exchange (“TSX”) under the symbol CG and on the New York
Stock Exchange (“NYSE”) under the symbol CGAU. The Company is based
in Toronto, Ontario, Canada.
Conference Call
Centerra invites you to join its 2022 third
quarter conference call on Monday, November 7, 2022 at 9:00 AM
Eastern Time. The call is open to all investors and the media. To
join the call, please dial toll-free in North America 1 (800)
750-9140. International participants may access the call at +1
(416) 981-0157. Results summary presentation slides are available
on Centerra’s website at www.centerragold.com.
Alternatively, an audio feed webcast will be broadcast live by
Notified and can be accessed live at Centerra’s website at
www.centerragold.com. A
recording of the call will be available after the call and via
telephone until midnight Eastern Standard Time on November 21, 2022
by calling +1 (416) 626-4100 or (800) 558-5253 and using passcode
22021107.
For more
information:
Additional information on Centerra is
available on the Company’s website at www.centerragold.com and at SEDAR at
www.sedar.com and EDGAR
at www.sec.gov/edgar.
Management’s
Discussion and
Analysis
For the Three and
Nine Months Ended September 30,
2022 and 2021
This Management’s Discussion and Analysis
(“MD&A”) has been prepared as of November 4,
2022 and is intended to provide a review of the financial
position and results of operations of Centerra Gold Inc.
(“Centerra” or the “Company”) for the nine months
ended September 30, 2022 in comparison with
the corresponding period ended September 30,
2021. This discussion should be read in conjunction with
the Company’s unaudited condensed consolidated interim financial
statements and the notes thereto for the three and
nine months ended September 30, 2022
prepared in accordance with International Financial Reporting
Standards (“IFRS”). The Company’s unaudited condensed consolidated
interim financial statements and the notes thereto for the
three and nine months ended
September 30, 2022, are available at
www.centerragold.com and on the
System for Electronic Document Analysis and Retrieval (“SEDAR”)
at www.sedar.com and
EDGAR at www.sec.gov/edgar.
In addition, this discussion contains forward-looking
information regarding Centerra’s business and operations. Such
forward-looking statements involve risks, uncertainties and other
factors that could cause actual results to differ materially from
those expressed or implied by such forward-looking statements. See
“Caution Regarding Forward-Looking Information” below. All dollar
amounts are expressed in United States dollars (“USD”), except as
otherwise indicated. All references in this document denoted
with NG indicate a “specified
financial measure” within the meaning of National Instrument 52-112
Non-GAAP and Other Financial Measures Disclosure of the Canadian
Securities Administrators. None of these measures is a standardized
financial measure under IFRS and these measures might not be
comparable to similar financial measures disclosed by other
issuers. See section “Non-GAAP and Other Financial Measures” below
for a discussion of the specified financial measures used in this
document and a reconciliation to the most directly comparable IFRS
measure.
Caution Regarding Forward-Looking
Information
Information contained in this document which
is not a statement of historical fact, and the documents
incorporated by reference herein, may be “forward-looking
information” for the purposes of Canadian securities laws and
within the meaning of the United States Private Securities
Litigation Reform Act of 1995. Such forward-looking information
involves risks, uncertainties and other factors that could cause
actual results, performance, prospects and opportunities to differ
materially from those expressed or implied by such forward-looking
information. The words “believe”, “expect”, “anticipate”,
“contemplate”, “plan”, “intends”, “continue”, “budget”, “estimate”,
“may”, “will”, “schedule”, “understand” and similar expressions
identify forward-looking information. These forward-looking
statements relate to, among other things: statements regarding 2022
Outlook, including production, costs, capital expenditures,
depreciation, depletion and amortization expenses and taxes; the
effects of inflation on the Company’s costs; the weakening of the
Canadian dollar and Turkish lira relative to the U.S. dollar;
expectations regarding copper credits and copper prices in the
fourth quarter of 2022; the expected trend of the Company’s
performance toward achieving guidance; expected cash outflows at
the Oksut Mine for the fourth quarter of 2022; completion of
mercury abatement, containment and safety work in the gold room of
the ADR plant at the Öksüt Mine, including construction progress;
the expected restart of gold room operations, related regulatory
approvals and the expected timing thereof; the capacity of the
Öksüt Mine’s ADR plant to process inventories of loaded gold in
carbon ; preparation and timing of further submissions relating to
the EIA amendment for the Öksüt Mine and further discussions and
regulatory review thereof; progress on ordinary course permitting
at the Öksüt Mine and the ability to mine the Keltepe and Guneytepe
pits; expectations for continued mining, crushing and stacking
operations at the Öksüt Mine in the fourth quarter of 2022;
highlights of a new life of mine plan for the Mount Milligan Mine,
including reserves and resources, costs, inflationary pressures and
expectations regarding the release of further guidance;
expectations for optimization of Mount Milligan Mine’s staged
flotation reactors; strategic options for the Molybdenum BU,
including a potential restart of the Thompson Creek Mine, net cash
required to maintain the business and expectations for molybdenum
prices; expectations for ongoing activities at the Goldfield
project, including drilling, resource estimation and a feasibility
study; expectations for market purchases under a normal course
issuer bid; possible impact to operations relating to COVID-19;
leadership transition of the Chief Executive Officer position; and
expectations regarding contingent payments to be received from the
sale of Greenstone Partnership.
Forward-looking information is necessarily
based upon a number of estimates and assumptions that, while
considered reasonable by Centerra, are inherently subject to
significant technical, political, business, economic and
competitive uncertainties and contingencies. Known and unknown
factors could cause actual results to differ materially from those
projected in the forward-looking information. Factors and
assumptions that could cause actual results or events to differ
materially from current expectations include, among other things:
(A) strategic, legal, planning and other risks, including:
political risks associated with the Company’s operations in
Türkiye, the USA and Canada, including potential uncertainty
created by upcoming presidential elections in Türkiye and their
potential to disrupt or delay Turkish bureaucratic processes and
decision making, including potential uncertainty created by
upcoming presidential elections in Türkiye and their potential to
disrupt or delay Turkish bureaucratic processes and decision
making; resource nationalism including the management of external
stakeholder expectations; the impact of changes in, or to the more
aggressive enforcement of, laws, regulations and government
practices, including unjustified civil or criminal action against
the Company, its affiliates, or its current or former employees;
risks that community activism may result in increased contributory
demands or business interruptions; the risks related to outstanding
litigation affecting the Company; risks of actions taken by the
Kyrgyz Republic, or any of its instrumentalities, in connection
with the Company’s prior ownership of the Kumtor Mine or the Global
Arrangement Agreement; including unjustified civil or criminal
action against the Company, its affiliates, or its current or
former employees; the impact of constitutional changes or political
events or elections in Türkiye; risks that Turkish regulators
pursue aggressive enforcement of the Öksüt Mine’s current EIA and
permits or that the Company experiences delay or disruption in its
applications for new or amended EIA or other permits; the impact of
any sanctions imposed by Canada, the United States or other
jurisdictions against various Russian and Turkish individuals and
entities; potential defects of title in the Company’s properties
that are not known as of the date hereof; the inability of the
Company and its subsidiaries to enforce their legal rights in
certain circumstances; risks related to anti-corruption
legislation; Centerra not being able to replace mineral reserves;
Indigenous claims and consultative issues relating to the Company’s
properties which are in proximity to Indigenous communities; and
potential risks related to kidnapping or acts of terrorism; (B)
risks relating to financial matters, including: sensitivity of the
Company’s business to the volatility of gold, copper and other
mineral prices; the use of provisionally-priced sales contracts for
production at the Mount Milligan Mine; reliance on a few key
customers for the gold-copper concentrate at the Mount Milligan
Mine; use of commodity derivatives; the imprecision of the
Company’s mineral reserves and resources estimates and the
assumptions they rely on; the accuracy of the Company’s production
and cost estimates; the impact of restrictive covenants in the
Company’s credit facilities which may, among other things, restrict
the Company from pursuing certain business activities or making
distributions from its subsidiaries; changes to tax regimes; the
Company’s ability to obtain future financing; the impact of global
financial conditions; the impact of currency fluctuations; the
effect of market conditions on the Company’s short-term
investments; the Company’s ability to make payments, including any
payments of principal and interest on the Company’s debt
facilities, which depends on the cash flow of its subsidiaries; and
(C) risks related to operational matters and geotechnical issues
and the Company’s continued ability to successfully manage such
matters, including the stability of the pit walls at the Company’s
operations; the integrity of tailings storage facilities and the
management thereof, including as to stability, compliance with
laws, regulations, licenses and permits, controlling seepages and
storage of water where applicable; the risk of having sufficient
water to continue operations at the Mount Milligan Mine and achieve
expected mill throughput; changes to, or delays in the Company’s
supply chain and transportation routes, including cessation or
disruption in rail and shipping networks whether caused by
decisions of third-party providers or force majeure events
(including, but not limited to, flooding, wildfires, COVID-19, or
other global events such as wars); the success of the Company’s
future exploration and development activities, including the
financial and political risks inherent in carrying out exploration
activities; inherent risks associated with the use of sodium
cyanide in the mining operations; the adequacy of the Company’s
insurance to mitigate operational and corporate risks; mechanical
breakdowns; the occurrence of any labour unrest or disturbance and
the ability of the Company to successfully renegotiate collective
agreements when required; the risk that Centerra’s workforce and
operations may be exposed to widespread epidemic including, but not
limited to, the COVID-19 pandemic; seismic activity; wildfires;
long lead-times required for equipment and supplies given the
remote location of some of the Company’s operating properties and
disruptions caused by global events and disruptions caused by
global events; reliance on a limited number of suppliers for
certain consumables, equipment and components; the ability of the
Company to address physical and transition risks from climate
change and sufficiently manage stakeholder expectations on
climate-related issues; the Company’s ability to accurately predict
decommissioning and reclamation costs; the Company’s ability to
attract and retain qualified personnel; competition for mineral
acquisition opportunities; risks associated with the conduct of
joint ventures/partnerships; and, the Company’s ability to manage
its projects effectively and to mitigate the potential lack of
availability of contractors, budget and timing overruns and project
resources. For additional risk factors, please see section titled
“Risks Factors” in the Company’s most recently filed Annual
Information Form (“AIF”) available on SEDAR at www.sedar.com and EDGAR at
www.sec.gov/edgar.
There can be no assurances that
forward-looking information and statements will prove to be
accurate, as many factors and future events, both known and unknown
could cause actual results, performance or achievements to vary or
differ materially from the results, performance or achievements
that are or may be expressed or implied by such forward-looking
statements contained herein or incorporated by reference.
Accordingly, all such factors should be considered carefully when
making decisions with respect to Centerra, and prospective
investors should not place undue reliance on forward-looking
information. Forward-looking information is as of
November 4, 2022. Centerra assumes no obligation
to update or revise forward-looking information to reflect changes
in assumptions, changes in circumstances or any other events
affecting such forward-looking information, except as required by
applicable law.
TABLE OF CONTENTS
|
Overview |
1 |
|
Overview of Consolidated Financial and Operational
Highlights |
2 |
|
Overview of Consolidated
Results |
3 |
|
Outlook |
6 |
|
Recent Events and
Developments |
13 |
|
Liquidity and Capital
Resources |
16 |
|
Financial
Performance |
17 |
|
Financial
Instruments |
21 |
|
Balance Sheet
Review |
22 |
|
Operating Mines and
Facilities |
23 |
|
Discontinued
Operations |
34 |
|
Quarterly Results – Previous Eight
Quarters |
36 |
|
Related Party
Transactions |
36 |
|
Accounting Estimates, Policies and
Changes |
37 |
|
Disclosure Controls and Procedures and Internal Control
Over Financial
Reporting |
37 |
|
Non-GAAP and Other Financial
Measures |
38 |
|
Qualified Person & QA/QC – Production, Mineral Reserves
and Mineral
Resources |
45 |
|
|
|
Overview
Centerra’s
Business
Centerra is a Canadian-based mining company
focused on operating, developing, exploring and acquiring gold and
copper properties in North America, Türkiye, and other markets
worldwide. Centerra’s principal continuing operations are the Mount
Milligan gold-copper mine located in British Columbia, Canada (the
“Mount Milligan Mine”), and the Öksüt gold mine located in Türkiye
(the “Öksüt Mine”). The Company also owns the Goldfield District
Project (the “Goldfield Project”) in Nevada, United States, the
Kemess Underground Project (the “Kemess Project”) in British
Columbia, Canada as well as exploration properties in Canada, the
United States of America and Türkiye and has options to acquire
exploration joint venture properties in Canada, Türkiye, and the
United States. The Company owns and operates a Molybdenum Business
Unit (the “Molybdenum BU”), which includes the Langeloth
metallurgical processing facility, operating in Pennsylvania, USA
(the “Langeloth Facility”), and two primary molybdenum mines on
care and maintenance: the Thompson Creek Mine in Idaho, USA, and
the Endako Mine (75% ownership) in British Columbia, Canada.
Prior to May 15, 2021, the Company also
consolidated the results of the Kumtor mine, located in the Kyrgyz
Republic, (the “Kumtor Mine”), through its wholly-owned subsidiary,
Kumtor Gold Company CJSC (“KGC”). The seizure of the Kumtor Mine
and the actions of the Kyrgyz Republic and Kyrgyzaltyn JSC
(“Kyrgyzaltyn”) resulted in the following: (i) the carrying value
of the net assets of the mine were derecognized from the Company’s
balance sheet, (ii) no value was ascribed to the Company’s interest
in KGC, (iii) the Company recognized a loss on the change of
control in the second quarter of 2021, and (iv) results of the
Kumtor Mine’s operations are now presented as a discontinued
operation in the Company’s financial statements. The Company
entered into a global arrangement agreement (“Arrangement
Agreement”) dated April 4, 2022 with, among others, Kyrgyzaltyn and
the Kyrgyz Republic to effect a separation of the parties,
including through the disposition of Centerra’s ownership of the
Kumtor Mine and its investment in the Kyrgyz Republic, the purchase
for cancellation by Centerra of Kyrgyzaltyn’s Centerra common
shares, the termination of Kyrgyzaltyn’s involvement in the
Company, and the resolution of disputes (the “Transaction”). The
Transaction closed on July 29, 2022.
As of September 30, 2022, Centerra’s
significant subsidiaries were as follows:
|
Entity |
Property - Location |
|
Current Status |
|
Ownership |
Thompson Creek Metals Company Inc.
|
Mount Milligan Mine - Canada |
|
Operation |
|
100 |
% |
|
Endako Mine - Canada |
|
Care and maintenance |
|
75 |
% |
|
Öksüt Madencilik A.S. |
Öksüt Mine - Türkiye |
|
Operation |
|
100 |
% |
|
Langeloth Metallurgical Company LLC |
Langeloth - USA |
|
Operation |
|
100 |
% |
|
Gemfield Resources LLC |
Goldfield Project - USA |
|
Advanced exploration |
|
100 |
% |
|
AuRico Metals Inc. |
Kemess Project - Canada |
|
Advanced exploration |
|
100 |
% |
|
Thompson Creek Mining Co. |
Thompson Creek Mine - USA |
|
Care and maintenance |
|
100 |
% |
The Company’s common shares are listed on the
Toronto Stock Exchange and the New York Stock Exchange and trade
under the symbols “CG” and “CGAU”, respectively.
Following the completion of the Transaction on July
29, 2022, the number of the Company’s issued and outstanding common
shares was reduced by 77,401,766. As of November 4, 2022,
there are 220,355,953 common shares issued and outstanding, options
to acquire 2,810,413 common shares outstanding under the Company’s
stock option plan, and 728,653 restricted share units outstanding
under the Company’s restricted share unit plan (exercisable on a
1:1 basis for common shares).
Overview of Consolidated Financial and
Operating Highlights
|
($millions, except as noted) |
Three months ended
September 30, |
Nine months ended
September 30, |
|
|
2022 |
|
2021 |
|
% Change |
2022 |
|
2021 |
|
% Change |
|
Financial Highlights (continuing operations basis, except
as noted) |
|
|
|
|
|
|
|
Revenue |
179.0 |
|
220.5 |
|
(19 |
)% |
641.9 |
|
649.1 |
|
(1 |
)% |
|
Production costs |
132.0 |
|
121.6 |
|
9 |
% |
416.5 |
|
355.7 |
|
17 |
% |
|
Depreciation, depletion, and amortization ("DDA") |
14.4 |
|
30.4 |
|
(53 |
)% |
79.9 |
|
89.5 |
|
(11 |
)% |
|
Earnings from mine operations |
32.6 |
|
68.5 |
|
(52 |
)% |
145.5 |
|
203.9 |
|
(29 |
)% |
|
Net (loss) earnings from continuing operations |
(33.9 |
) |
27.6 |
|
(223 |
)% |
52.9 |
|
172.1 |
|
(69 |
)% |
|
Adjusted net (loss) earnings from continuing
operations(1) |
(15.9 |
) |
35.7 |
|
(145 |
)% |
4.3 |
|
113.9 |
|
(96 |
)% |
|
Net loss from discontinued operations |
— |
|
— |
|
— |
% |
— |
|
(828.7 |
) |
(100 |
)% |
|
Net (loss) earnings(2) |
(33.9 |
) |
27.6 |
|
(223 |
)% |
52.9 |
|
(656.6 |
) |
108 |
% |
|
Adjusted net (loss) earnings(1)(2) |
(15.9 |
) |
35.7 |
|
(145 |
)% |
4.3 |
|
198.3 |
|
(98 |
)% |
|
Cash (used in) provided by operating activities from continuing
operations |
(17.0 |
) |
62.4 |
|
(127 |
)% |
7.8 |
|
209.1 |
|
(96 |
)% |
|
Free cash flow (deficit) from continuing
operations(1) |
(35.5 |
) |
41.0 |
|
(187 |
)% |
(57.6 |
) |
139.7 |
|
(141 |
)% |
|
Adjusted free cash flow (deficit) from continuing
operations(1) |
(29.5 |
) |
45.3 |
|
(165 |
)% |
(36.7 |
) |
148.6 |
|
(125 |
)% |
|
Cash provided by operating activities from discontinued
operations |
— |
|
— |
|
— |
% |
— |
|
143.9 |
|
(100 |
)% |
|
Net cash flow from discontinued operations(3) |
— |
|
— |
|
— |
% |
— |
|
47.8 |
|
(100 |
)% |
|
Additions to property, plant and equipment (“PP&E”) |
11.7 |
|
24.8 |
|
(53 |
)% |
247.2 |
|
72.0 |
|
243 |
% |
|
Capital expenditures - total(1) |
16.1 |
|
20.1 |
|
(20 |
)% |
57.8 |
|
65.2 |
|
(11 |
)% |
|
Sustaining capital expenditures(1) |
16.0 |
|
18.7 |
|
(14 |
)% |
55.8 |
|
62.3 |
|
(10 |
)% |
|
Non-sustaining capital expenditures(1) |
0.1 |
|
1.4 |
|
(93 |
)% |
2.0 |
|
2.9 |
|
(31 |
)% |
|
Net (loss) earnings from continuing operations per common share -
basic(4) |
(0.14 |
) |
0.09 |
|
(256 |
)% |
0.19 |
|
0.58 |
|
(67 |
)% |
|
Net (loss) earnings per common share - $/share
basic(2)(4) |
(0.14 |
) |
0.09 |
|
(256 |
)% |
0.19 |
|
(2.21 |
) |
(109 |
)% |
|
Adjusted net (loss) earnings from continuing operations per common
share - basic(1)(4) |
(0.06 |
) |
0.12 |
|
(150 |
)% |
0.02 |
|
0.38 |
|
(95 |
)% |
|
Adjusted net (loss) earnings per common share - $/share
basic(1)(2)(4) |
(0.06 |
) |
0.12 |
|
(150 |
)% |
0.02 |
|
0.67 |
|
(97 |
)% |
|
Operating highlights (continuing operations
basis) |
|
|
|
|
|
|
|
|
|
|
Gold produced (oz) |
54,134 |
|
76,913 |
|
(30 |
)% |
190,646 |
|
216,944 |
|
(12 |
)% |
|
Additions to stored gold-in-carbon inventory
(Koz)(5) |
40-45 |
— |
|
100 |
% |
100-105 |
— |
|
100 |
% |
|
Gold sold (oz) |
56,245 |
|
75,721 |
|
(26 |
)% |
192,750 |
|
224,445 |
|
(14 |
)% |
|
Average market gold price ($/oz) |
1,728 |
|
1,790 |
|
(3 |
)% |
1,826 |
|
1,800 |
|
1 |
% |
|
Average realized gold price ($/oz )(6) |
1,204 |
|
1,542 |
|
(22 |
)% |
1,580 |
|
1,477 |
|
7 |
% |
|
Copper produced (000s lbs) |
19,045 |
|
17,861 |
|
7 |
% |
56,955 |
|
56,282 |
|
1 |
% |
|
Copper sold (000s lbs) |
19,647 |
|
18,512 |
|
6 |
% |
58,019 |
|
60,833 |
|
(5 |
)% |
|
Average market copper price ($/lb) |
3.52 |
|
4.26 |
|
(17 |
)% |
4.12 |
|
4.17 |
|
(1 |
)% |
|
Average realized copper price ($/lb)(6) |
2.49 |
|
2.55 |
|
(2 |
)% |
2.82 |
|
2.73 |
|
3 |
% |
|
Molybdenum sold (000s lbs) |
3,291 |
|
2,615 |
|
26 |
% |
9,406 |
|
9,100 |
|
3 |
% |
|
Average market molybdenum price ($/lb) |
16.12 |
|
19.06 |
|
(15 |
)% |
17.86 |
|
15.02 |
|
19 |
% |
|
Unit costs (continuing operations basis) |
|
|
|
|
|
|
|
|
|
|
Gold production costs ($/oz) |
729 |
|
630 |
|
16 |
% |
653 |
|
626 |
|
4 |
% |
|
All-in sustaining costs on a by-product basis
($/oz)(1) |
941 |
|
781 |
|
20 |
% |
826 |
|
672 |
|
23 |
% |
|
All-in costs on a by-product basis ($/oz)(1) |
1,376 |
|
932 |
|
48 |
% |
1,105 |
|
806 |
|
37 |
% |
|
Gold - All-in sustaining costs on a co-product basis
($/oz)(1) |
1,190 |
|
928 |
|
28 |
% |
1,062 |
|
916 |
|
16 |
% |
|
Copper production costs ($/lb) |
1.51 |
|
1.50 |
|
1 |
% |
1.63 |
|
1.44 |
|
13 |
% |
|
Copper - All-in sustaining costs on a co-product basis –
($/lb)(1) |
1.78 |
|
1.95 |
|
(9 |
)% |
2.04 |
|
1.21 |
|
69 |
% |
(1) Non-GAAP
financial measure. All per unit costs metrics are expressed on a
metal sold basis. See discussion under “Non-GAAP and Other
Financial Measures”.
(2) Inclusive of the results from
the Kumtor Mine prior to the loss of control on May 15,
2021.
(3) Calculated as the sum of cash
flow provided by operating activities from discontinued operations,
cash flow used in investing activities from discontinued operations
and cash flow used in financing activities from discontinued
operations.
(4) As at September 30, 2022,
the Company had 220,086,775 common shares issued and
outstanding.
(5) Represents a portion of the
recoverable ounces in the adsorption, desorption and recovery
(“ADR”) inventory as at September 30, 2022.
(6) This supplementary financial
measure within the meaning of 52-112 is calculated as a ratio of
revenue from the consolidated financial statements and units of
metal sold and includes the impact from the Mount Milligan
Streaming Arrangement, copper hedges and mark-to-market adjustments
on metal sold that had not yet been finally settled.
Overview of Consolidated Results
Although during 2021, the Company remained the
legal owner of KGC, due to the seizure of the Kumtor Mine and the
related actions by the Kyrgyz Republic and Kyrgyzaltyn, the Company
derecognized the assets and liabilities of the Kumtor Mine in the
statements of financial position and presented its financial and
operating results prior to the loss of control as discontinued
operations for the nine months ended September 30, 2021. As a
result, the Company’s consolidated results from continuing
operations discussed in this MD&A exclude the Kumtor Mine’s
operations, unless otherwise noted.
Third
Quarter 2022
compared to
Third Quarter
2021
Net loss of $33.9 million was recognized in the
third quarter 2022, compared to net earnings of $27.6 million in
the third quarter 2021. Decrease in net earnings was primarily due
to:
- earnings from mine operations of
$32.6 million in the third quarter of 2022 compared to earnings
from mine operations of $68.5 million in the third quarter of 2021
primarily due to no ounces of gold sold at the Öksüt Mine. In
addition, there were higher production costs at the Mount Milligan
Mine and the Molybdenum BU. Higher production costs at the Mount
Milligan Mine were mainly due to higher mining, processing and
administrative expenses due to the impact of rising inflation in
Canada and onset of price pressures on input costs. Higher
production costs at the Molybdenum BU were primarily due to higher
average molybdenum prices paid for product in inventory, an
increase in pounds of molybdenum roasted, and the effect of higher
production costs from the mix of products produced and sold in the
period. The decrease in earnings from mine operations was partially
offset by higher ounces of gold sold and copper pounds sold at the
Mount Milligan Mine, the weakening of the Canadian dollar relative
to the US dollar between the periods, lower production costs and
DDA at the Öksüt Mine due to the suspension of gold room operations
at the ADR plant and lower DDA at the Mount Milligan Mine primarily
attributable to the increase in proven and probable reserves,
- higher exploration and development
costs primarily relating to various drilling activities and
technical studies undertaken at the Goldfield Project and at the
Mount Milligan Mine, and
- higher deferred income tax expense
primarily resulting from the net impact of foreign exchange rate
changes on the temporary differences between accounting and tax
bases relating to the Mount Milligan Mine, the Kemess Project, and
other comprehensive income components.
The decrease in net earnings was partially
offset by a reclamation provision revaluation recovery of $7.7
million in the third quarter of 2022 compared to $0.9 million
reclamation expense in the third quarter of 2021, resulting from an
increase in the risk-free interest rates applied to discount the
estimated future reclamation cash flows, partially offset by an
increase in scope of planned reclamation activities and higher
inflation applied to the reclamation cash flows at the Endako Mine
and Thompson Creek Mine. In addition, there was a decrease in other
non-operating expenses due to higher foreign exchange gains and
interest income earned on the Company’s cash balance from rising
interest rates as well as lower litigation and related costs
incurred in connection with the seizure and the loss of control of
the Kumtor Mine.
Adjusted net lossNG of $15.9 million
was recognized in the third quarter of 2022, compared to adjusted
net earningsNG of $35.7 million in the third quarter of
2021. The decrease in adjusted net earningsNG was
primarily due to lower earnings from mine operations and higher
exploration and development costs and income tax expense as
outlined above.
The most significant adjusting items to net loss
in the third quarter of 2022 were:
- $20.4 million income tax expense
resulting from the impact of foreign exchange rate changes on the
temporary differences between accounting and tax bases of the Mount
Milligan Mine, the Kemess Project, and other comprehensive income
components;
- $7.7 million reclamation provision
revaluation recovery at sites on care and maintenance in the
Molybdenum BU primarily attributable to an increase in the
risk-free interest rates applied to discount the estimated future
reclamation cash flows; and
- $5.3 million in legal and other costs
directly related to the seizure of the Kumtor Mine.
The most significant adjusting items to net
earnings from continuing operations in the third quarter of 2021
was $8.1 million of legal and other costs related to the seizure of
the Kumtor Mine.
Cash used in operating activities was $17.0
million in the third quarter of 2022, compared to cash provided by
operating activities of $62.4 million in the third quarter of 2021.
The decrease in cash provided by operating activities was primarily
due to no ounces of gold sold at the Öksüt Mine, lower average
realized gold prices at the Mount Milligan Mine and lower average
realized molybdenum prices at the Molybdenum BU. In addition, there
were higher production costs at the Mount Milligan Mine primarily
due to higher mining, processing and administrative costs, as noted
above and an unfavourable working capital change at the Mount
Milligan Mine as a result of the effect of timing of cash
collection on concentrate shipments and the effect of timing of
vendor payments. The overall decrease in cash provided by operating
activities was partially offset by an increase in ounces of gold
and pounds of copper and molybdenum sold and a favourable in
working capital change at the Molybdenum BU.
Free cash flow deficitNG of $35.5
million was recognized in the third quarter of 2022, compared to
free cash flowNG of $41.0 million in the third quarter
of 2021. The decrease in free cash flowNG was primarily
due to lower cash provided by operating activities as outlined
above, partially offset by slightly lower sustaining capital
expendituresNG.
Nine
months ended September 30,
2022 compared to
2021
Net earnings of $52.9 million were recognized in
2022, compared to net loss of $656.6 million in 2021. The increase
was primarily due to the loss of $926.4 million recognized on the
change of control of the Kumtor Mine in 2021.
Net earnings from continuing operations of $52.9
million were recognized in 2022, compared to $172.1 million in
2021. The decrease was primarily due to:
- lower earnings from mine operations
of $145.5 million in 2022 compared to $203.9 million in 2021
primarily due to lower ounces of gold sold at the Öksüt Mine. In
addition, there were higher production costs at the Molybdenum BU
from higher average molybdenum prices paid to obtain product
inventory to be processed, an increase in pounds of molybdenum
roasted, higher maintenance costs associated with an unplanned acid
plant shutdown extending for longer than one month in the first
quarter of 2022 and the effect of higher unit costs from the mix of
products produced and sold in the period. In addition, there was a
decrease in earnings from mine operations at the Mount Milligan
Mine from higher production costs and lower gold ounces and copper
pounds sold. The decrease in earnings from mine operations was
partially offset by higher average realized gold, copper and
molybdenum prices, the weakening of the Canadian dollar relative to
the US dollar between the periods, and lower production costs and
DDA at the Öksüt Mine due to the suspension of gold room operations
at the ADR plant,
- higher exploration and development
costs primarily due to various drilling activities and technical
studies undertaken at the Goldfield Project, and brownfield
exploration activities at the Mount Milligan,
- higher corporate administration
costs primarily due to management changes and associated severance
payments, an increase in consulting costs and software costs from
various information technology projects, including the
implementation of the Company-wide enterprise resource planning
system and an increase in travel expenses. Partially offsetting an
increase in corporate administration costs was a decrease in the
provision for share-based compensation was primarily due to the
effect of the decline in the Company’s share price,
- a gain of $72.3 million on the sale
of the Company’s interest in the Greenstone Partnership recognized
in 2021, and
- higher current income tax expense
due to a smaller Investment Incentive Certificate benefit during
2022 and higher deferred income tax expense primarily resulting
from the net impact of foreign exchange rate changes on the
temporary differences between accounting and tax bases relating to
the Mount Milligan Mine, the Kemess Project, and other
comprehensive income components.
The decrease in net earnings from continuing
operations was partially offset by a $90.6 million reclamation
provision revaluation recovery at sites on care and maintenance in
the Molybdenum BU primarily attributable to an increase in the
risk-free interest rates applied to discount the estimated future
reclamation cash flows. In addition, there was a decrease in other
non-operating expenses from higher foreign exchange gains and
interest income earned on the Company’s cash balance from rising
interest rates, partially offset by an increase in litigation and
related costs incurred in connection with the seizure and the loss
of control of the Kumtor Mine.
The Company did not report any earnings related
to discontinued operations in 2022. Net loss from discontinued
operations was 828.7 million in 2021.
Adjusted net earnings from continuing
operationsNG were $4.3 million in 2022, compared to
adjusted net earningsNG from continuing operations of
$113.9 million in 2021. The decrease in adjusted net earnings from
continuing operationsNG was due to lower earnings from
mine operations and higher corporate administration costs,
exploration and development costs and income tax expense as
outlined above.
Significant adjusting items to net earnings in
2022 include:
- $90.8 million reclamation provision
revaluation at sites on care and maintenance in the Molybdenum BU,
resulting primarily from the change in the estimated future
reclamation cash flows and an increase in the discount rate applied
to these cash flows;
- $27.2 million of deferred income
tax adjustments mainly resulting from the effect of foreign
exchange rate changes on the temporary differences between
accounting and tax bases of the Mount Milligan Mine, the Kemess
Project, and other comprehensive income; and
- $15.0 million of legal and other
related costs directly related to the seizure of the Kumtor
Mine.
The most significant adjusting items to net
earnings from continuing operations in 2021 were a $72.3 million
gain on the sale of Greenstone project and $14.2 million of
litigation and other related costs related to the Kumtor Mine.
Cash provided by operating activities from
continuing operations was $7.8 million in 2022 compared to $209.1
million in 2021. The decrease in cash provided by operating
activities from continuing operations was primarily due to a
decrease in gold ounces sold at the Öksüt Mine and an unfavourable
change in working capital from the build up of stored
gold-in-carbon inventories, higher cash taxes paid related to the
Öksüt Mine from a withholding tax expense incurred on dividend
distributions and taxation at the full statutory income tax rate
due utilization of Öksüt’s Investment Incentive Certificate as of
the end of 2021 and the recognition of taxable gains from the
effect of foreign exchange rate changes on monetary assets and
liabilities in taxable income. In addition, there was a decrease in
gold ounces and copper pounds sold and higher production costs at
the Mount Milligan Mine as noted above and an unfavourable working
capital change from the effect of timing of vendor payments,
partially offset by the effect of timing of cash collection on
concentrate sales at the Mount Milligan Mine and higher average
realized copper prices.
Free cash flow deficitNG from
continuing operations of $57.6 million was recognized in 2022
compared to free cash flowNG from continuing operations
of $139.7 million in 2021. The decrease in free cash
flowNG was primarily due to lower cash provided by
operating activities as outlined above, partially offset by
slightly lower sustaining capital expendituresNG.
2022 Outlook
The Company remains on track to achieve its
revised guidance for 2022 that was issued as part of the MD&A
for the second quarter of 2022 (“Current Guidance”). The Mount
Milligan Mine expects to achieve both gold and copper production
Current Guidance for the 2022 year, though expects gold production
to trend towards the lower end of the guidance range. Due to the
suspension of leaching and gold room activities at the Öksüt Mine,
no further gold production is expected from the Öksüt Mine in 2022.
The mercury abatement retrofit at the ADR plant and the formal
submission of an updated EIA are both in progress and expected to
be completed by late 2022. Subsequent to the filing of the EIA, the
Company will seek approval from regulators to restart full
operations as quickly as possible. With mining, crushing, stacking
and capital project activities continuing at the Öksüt Mine, the
Company expects total cash outflows relating to the Öksüt Mine
during the fourth quarter of 2022 to be similar to those incurred
during the third quarter of 2022.
The full year 2022 outlook and comparative
actual results for nine months ended September 30, 2022 are
set out in the following table:
|
|
Units |
Mount Milligan(1) |
|
Öksüt |
|
Consolidated(2) |
|
|
|
Nine months
ended
September 30,
2022 |
2022
Current
Guidance |
|
Nine months
ended
September 30,
2022 |
2022
Current
Guidance |
|
Nine months
ended
September 30,
2022 |
2022
Current
Guidance |
|
Production |
|
|
|
|
|
|
|
|
|
|
Unstreamed gold production |
(Koz) |
88 |
123 - 136 |
|
55 |
55 |
|
143 |
178 - 191 |
|
Streamed gold production |
(Koz) |
48 |
67 - 74 |
|
— |
— |
|
48 |
67 - 74 |
|
Total gold
production(3) |
(Koz) |
136 |
190 - 210 |
|
55 |
55 |
|
191 |
245 - 265 |
| |
|
|
|
|
|
|
|
|
|
|
Unstreamed copper production |
(Mlb) |
46 |
57 - 65 |
|
— |
— |
|
46 |
57 - 65 |
|
Streamed copper production |
(Mlb) |
11 |
13 - 15 |
|
— |
— |
|
11 |
13 - 15 |
|
Copper
production(3) |
(Mlb) |
57 |
70 - 80 |
|
— |
— |
|
57 |
70 - 80 |
|
Costs |
|
|
|
|
|
|
|
|
|
|
Gold production costs |
($/oz) |
759 |
775 - 825 |
|
386 |
386 |
|
653 |
675 - 725 |
All-in sustaining costs
on a by-product basisNG(4) |
($/oz) |
629 |
775 - 825 |
|
680 |
875 - 925 |
|
826 |
1,000 - 1,050 |
All-in costs
on a by-product basisNG(4) |
($/oz) |
713 |
825 - 875 |
|
732 |
950 - 1,000 |
|
1,105 |
1,225 - 1,275 |
All-in sustaining costs
on a co-product basisNG(4) |
($/oz) |
958 |
1,000 - 1,050 |
|
680 |
875 - 925 |
|
1,062 |
1,175 - 1,225 |
|
Copper production costs |
($/lb) |
1.63 |
1.55 - 1.70 |
|
— |
— |
|
1.63 |
1.55 - 1.70 |
All-in sustaining costs
on a co-product basisNG |
($/lb) |
2.04 |
2.25 - 2.40 |
|
— |
— |
|
2.04 |
2.25 - 2.40 |
|
Capital Expenditures |
|
|
|
|
|
|
|
|
|
|
Additions to PP&E |
($M) |
34.6 |
60 - 65 |
|
9.1 |
20 - 25 |
|
247.2 |
285 - 295 |
|
Total Capital
ExpendituresNG |
($M) |
44.7 |
70 - 75 |
|
11.4 |
20 - 25 |
|
57.8 |
95 - 105 |
|
SustainingNG(5) |
($M) |
43.2 |
65 - 70 |
|
11.4 |
20 - 25 |
|
55.8 |
90 - 100 |
|
Non-sustainingNG |
($M) |
1.5 |
5 |
|
— |
— |
|
2.0 |
5 |
|
Other Costs |
|
|
|
|
|
|
|
|
|
|
Goldfield Project |
($M) |
— |
— |
|
— |
— |
|
15.3 |
17-20 |
|
All other exploration projects |
($M) |
12 |
12 |
|
3 |
5 |
|
30.9 |
33-45 |
|
Total Exploration and Project
Development(5) |
($M) |
— |
— |
|
— |
— |
|
46.2 |
50 - 65 |
|
Kemess Project |
($M) |
— |
— |
|
— |
— |
|
10.0 |
13 - 15 |
|
Molybdenum BU |
($M) |
— |
— |
|
— |
— |
|
19.0 |
15 - 20 |
|
Corporate administration |
($M) |
— |
— |
|
— |
— |
|
35.5 |
40 - 45 |
|
DDA |
($M) |
63.4 |
95 - 105 |
|
12.6 |
13 |
|
79.9 |
110 - 130 |
|
Taxes |
($M) |
3.4 |
‘5 - 10 |
|
21.7 |
20 - 30 |
|
36.5 |
25 - 40 |
- The Mount Milligan Streaming
Arrangement entitles Royal Gold to 35% and 18.75% of gold ounces
and copper pounds sold, respectively, and requires Royal Gold to
pay $435 per ounce of gold and 15% of the spot price per metric
tonne of copper delivered. Assuming a market gold price of $1,650
per ounce and market copper price of $3.25 per pound in the fourth
quarter of 2022, Mount Milligan Mine’s average realized gold and
copper price would be $1,220 per ounce and $2.65 per pound in the
fourth quarter of 2022, respectively, after giving effect to the
hedges and further mark-to-market adjustments on 25.0 million
copper pounds outstanding and 41,559 ounces of gold outstanding at
September 30, 2022 under contracts awaiting final pricing in
future months.
- Unit costs and consolidated unit
costs include a credit for forecasted copper sales treated as
by-product for all-in sustaining costs. Production for copper and
gold reflects estimated metallurgical losses resulting from
handling of the concentrate and metal deductions, subject to metal
content, levied by smelters.
- Gold and copper production at the
Mount Milligan Mine assumes recoveries of 68% and 81%,
respectively. 2022 gold ounces and copper pounds sold are expected
to be consistent with production.
- Costs do not include the impact of
any future standby charges at the Öksüt Mine as the Company
assesses the operational implications of suspending certain
activities.
- The exploration and project
development cost Current Guidance reflects the addition of the
Goldfield Project exploration and project development costs.
Exploration and project development costs include both expensed
exploration and project development costs as well as capitalized
exploration costs and exclude business development expenses.
Project development costs related to the Goldfield Project were
$10.8 million in the nine months ended September 30, 2022.
Capitalized exploration costs are included in sustaining capital
expendituresNG.
Production Profile
The Company’s consolidated 2022 gold production
outlook of 245,000 to 265,000 ounces is unchanged from the Current
Guidance disclosed in the Company’s MD&A for the second quarter
of 2022. The consolidated gold production Current Guidance reflects
only 54,691 ounces of the actual gold produced at the Öksüt Mine in
the first quarter of 2022 in addition to Mount Milligan Mine’s gold
production range of 190,000 to 210,000 ounces. The expected gold
production from the Mount Milligan Mine remains unchanged from
Current Guidance, however, primarily due to localized adjustments
to the oxide transition zone on the current bench in the
higher-grade gold areas (HGLC ore) which were observed in October
2022, the Company expects its full year gold production will be
towards the lower end of the guidance range. Mount Milligan Mine’s
2022 production outlook for copper production remains in the range
of 70 to 80 million pounds, unchanged from the Current
Guidance.
At the Öksüt Mine, 2022 gold production guidance
includes only the gold produced in the first quarter of 2022, prior
to the suspension of gold room operations at the ADR plant. The
Öksüt Mine continued mining, crushing, stacking and leaching
activities in order to process ore and extract contained gold into
a gold-in-carbon form through to late-August 2022. Leaching and
gold extraction activities have been suspended since late-August
awaiting submission and approval of the mine’s amended EIA. The
extent of mining activity for the remainder of the year will be
evaluated as the Company works through ongoing permitting matters
and may be significantly reduced before the end of the year. Please
refer to the “Update on Öksüt Mine Operations” section for further
details. The gold-in-carbon inventory is expected to be stored
until the re-start of the electrowinning process, where the
recovery of gold from concentrated solution occurs. As of
September 30, 2022, the Öksüt Mine accumulated a total of
approximately 100,000 recoverable ounces in stored
gold-in-carbon.
The Company expects to complete the capital
equipment upgrades to remove the mercury generated in the gold
recovery process by the end of 2022 and will resume gold doré bar
production at the ADR plant as soon as all regulatory approvals are
obtained. Once the electrowinning process has resumed and is at
steady state capacity, the ADR plant is expected to have sufficient
production capacity to process up to approximately 35,000 ounces of
gold-in-carbon inventory per month, which would allow stored
gold-in-carbon inventory to be processed on a timely basis.
Cost Profile
Consolidated gold production costs in the nine
months ended September 30, 2022 were $653 per ounce sold,
including $759 per ounce sold at the Mount Milligan Mine and $386
per ounce sold at the Öksüt Mine. Full year consolidated gold
production costs are expected to be in the range of $675 to $725
per ounce sold in 2022, which is unchanged from the Current
Guidance. The consolidated gold production cost of $653 per ounce
sold in the nine months ended September 30, 2022 was lower
than the full year Current Guidance range primarily due to a higher
cost of ounces produced at the Mount Milligan Mine through the
remainder of the year. With no further gold sales at the Öksüt Mine
assumed for the remainder of the year, Mount Milligan Mine’s higher
cost gold production component will constitute a larger share of
consolidated production for the year than that of the Öksüt Mine,
resulting in higher average consolidated production cost through
the remainder of the year.
The gold production cost outlook at the Mount
Milligan Mine is unchanged from the Current Guidance range of $775
to $825 per ounce sold. Gold production costs in the nine months
ended September 30, 2022 were $759 per ounce sold, similar to
the low end of the full year Current Guidance range. Full year gold
production cost per ounce sold Current Guidance is slightly higher
than the result through the first nine months of 2022 primarily due
to higher allocation of production costs to gold due to changes in
the relative market prices of gold and copper assumed for the
fourth quarter of the year compared to those in the nine month
period ended September 30, 2022. Production costs at the Mount
Milligan Mine have not changed significantly from amounts
incorporated in the Current Guidance for 2022 as inflationary
pressures on consumables and labour costs were anticipated in the
revised full year guidance.
Gold production costs at the Öksüt Mine are
expected to remain $386 per ounce sold for full year, consistent
with the gold production costs per once sold in the nine months
ended September 30, 2022 due to no further gold sales
projected for the remainder of the year as a result of the
suspension of certain operations.
Copper production costs at the Mount Milligan
Mine in the nine months ended September 30, 2022 were $1.63
per copper pound sold and are expected to be in the range of $1.55
to $1.70 per pound sold for the full year, which is unchanged from
the Current Guidance.
The Mount Milligan Mine’s all-in sustaining
costs on a by-product basisNG for the full year of 2022
are expected to be in the range of $775 to $825 per ounce sold,
unchanged from the Current Guidance. Mount Milligan Mine’s all-in
sustaining costs on a by-product basisNG were $629 per
ounce sold in the nine months ended September 30, 2022 and are
expected to continue to trend towards the Current Guidance range.
Full year all-in sustaining costs on a by-product
basisNG are expected to increase from the result from
the first nine months of 2022 due to lower copper credits from
lower copper prices assumed in the fourth quarter than for the
first nine months of the year and higher production costs forecast
in the fourth quarter of 2022, partially offset by lower full-year
capital expenditures and the impact of the weakening of the
Canadian dollar relative to the US dollar.
The Öksüt Mine’s all-in sustaining costs on a
by-product basis per ounceNG for the full year of 2022
are expected to be in the range of $875 to $925 per ounce sold,
unchanged from the Current Guidance range. Actual all-in sustaining
costs on a by-product basisNG were $680 per ounce sold
in the nine months ended September 30, 2022, but are expected
to increase through the end of the year on the expectation that
gold doré bar production and sales at the Öksüt Mine will continue
to be suspended through the end of the year while sustaining
capital expendituresNG will continue to be incurred
during the fourth quarter of 2022. The potential impact of future
standby charges from the suspension of certain operating activities
has not been included in all-in sustaining costs.
The Current Guidance range for consolidated
all-in sustaining costs on a by-product basis per
ounceNG of $1,000 to $1,050 is higher than the
consolidated all-in sustaining costs on a by-product basis per
ounceNG of $826 in the nine months ended
September 30, 2022 primarily due to lower copper credits from
lower copper prices and higher operating costs at the Mount
Milligan Mine forecast in the fourth quarter of 2022, compared to
the nine months ended September 30, 2022 and the expected
continued suspension of gold production and sales at the Öksüt Mine
through the end of 2022.
Consolidated all-in costs on a by-product
basisNG are expected to be in the range of $1,225 to
$1,275 per ounce sold for the full year of 2022, compared to $1,105
per ounce sold in the nine months ended September 30, 2022 and
are unchanged from the Current Guidance. The Mount Milligan Mine’s
all-in costs on a by-product basisNG are expected to be
in the range of $825 to $875 per ounce sold for the full year of
2022, unchanged from the Current Guidance. Mount Milligan Mine’s
all-in costs on a by-product basisNG were $713 per ounce
sold in the nine months ended September 30, 2022 and were
lower than the revised full year Current Guidance range due to an
increase in all-in sustaining costs on a by-product basis per
ounceNG expected in the fourth quarter of 2022. The
Öksüt Mine’s all-in costs on a by-product basisNG are
expected to be in the range of $950 to $1,000 per ounce sold, a
significant increase compared to $732 per ounce sold in the nine
months ended September 30, 2022 due to additional capital
expenditures planned in the fourth quarter of 2022, and no further
gold sales expected during 2022.
Capital
Expenditures
Additions to PP&E, which is an IFRS
accounting figure, include certain non-cash additions to PP&E
such as changes in future reclamation costs and capitalization of
leases, while capital expendituresNG, comprised of
sustaining capital expendituresNG and non-sustaining
capital expendituresNG, which are both non-GAAP
measures, exclude them. Consolidated additions to PP&E in 2022
are expected to be in the range of $285 to $295 million compared to
$247.2 million in the nine months ended September 30, 2022 and
are unchanged from the Current Guidance. The consolidated additions
to PP&E Current Guidance range includes the acquisition of the
Goldfield Project of $208.2 million and net additions to ARO and
Right-of-Use assets amounting to approximately $19.0 million.
Sustaining capital expendituresNG in
2022 are expected to be in the range of $90 to $100 million, which
is unchanged from the Current Guidance, though the Company expects
sustaining capital expendituresNG to be closer to the
lower end of the Current Guidance range due to lower capital
expenditures at both the Mount Milligan Mine and the Öksüt Mine.
Sustaining capital expendituresNG in 2022 at the Mount
Milligan Mine are estimated to be in the range of $65 to $70
million, which is unchanged from the Current Guidance and relates
primarily to the tailings storage facility (“TSF”) costs, a
tailings pumping system, major overhauls and water management
costs. Sustaining capital expendituresNG in 2022 at the
Öksüt Mine are expected to be $20 to $25 million, which is
unchanged from the Current Guidance, and includes the estimated $5
million cost for the gold room retrofit at the ADR plant. As noted
above, sustaining capital expendituresNG in 2022 at both
sites are expected to be closer to the lower end of the Current
Guidance range due to postponement of certain capital projects to
2023 and reduced costs due to the weakening of the Canadian dollar
and Turkish lira relative to the US dollar.
Non-sustaining capital expendituresNG
expected in 2022 are consistent with the Current Guidance and
relate to the staged flotation reactor project at Mount Milligan
Mine, which was commissioned in May 2022 and is expected to improve
future metal recoveries.
Molybdenum Business
Unit
In the nine months ended September 30,
2022, the Company incurred $12.8 million of care and maintenance
expenses related to the Molybdenum BU and $3.1 million of
reclamation expenditures at the Endako Mine. The free cash flow
deficitNG at the Molybdenum BU in the nine months ended
September 30, 2022, was $19.0 million due to care and
maintenance and reclamation expenses noted and the effect of timing
of cash collection on molybdenum sales driven by longer average
collection periods at the Langeloth Facility. These impacts were
partially offset by a reduction in molybdenum inventories held at
site. The Company is maintaining its full year Current Guidance for
the Molybdenum BU with care and maintenance expenses estimated to
be between $20 and $25 million, including approximately $5 to $7
million of reclamation expenditures at the Endako Mine. The free
cash flow deficitNG at the Langeloth Facility in the
first nine months of 2022 is expected to decline in the fourth
quarter of the year with further expected reductions in working
capital resulting from lower inventories. The net cash required to
maintain the Molybdenum BU is expected to be in the range of $15 to
$20 million, which is unchanged from the Current Guidance. The
Company’s assumed molybdenum price for 2022 is $17.50 per pound,
compared to $17.00 per pound assumed in the Current Guidance.
Depreciation, Depletion, and
Amortization
Consolidated DDA expense included in the costs
of sales for 2022 is expected to be in the range of $110 to $130
million, compared to $79.9 million in the nine months ended
September 30, 2022 and is unchanged from the Current Guidance.
The Mount Milligan Mine’s DDA expense in the nine months ended
September 30, 2022 was $63.4 million and the full year of 2022
DDA expense is expected to be in the range of $95 to $105 million,
which is unchanged from the Current Guidance. The Öksüt Mine’s DDA
expense in the nine months ended September 30, 2022 was $12.6
million and is expected to remain unchanged for the rest of 2022 as
DDA continues to be capitalized to inventory during the period of
the suspension of leaching operations at the heap leach pad and
refinery operations at the ADR plant.
Taxes
Income tax related to the Öksüt Mine in the nine
months ended September 30, 2022 was $21.7 million and is
estimated to be between $20 to $30 million, unchanged from the
Current Guidance range. The Mount Milligan Mine is subject to
British Columbia mineral tax which was approximately $3.4 million
in the nine months ended September 30, 2022 and is expected to
be between $5 and $10 million for the full year of 2022, which is
unchanged from the Current Guidance.
2022 Material
Assumptions
Material assumptions or factors used to forecast
production and costs for the fourth quarter of 2022, after giving
effect to the hedges in place as at September 30, 2022,
include the following:
- no gold doré production or sales at
the Öksüt Mine for the remainder of the year.
- a market gold price of $1,650 per
ounce, compared to $1,700 per ounce in the Current Guidance, and an
average realized gold price at the Mount Milligan Mine of $1,220
per ounce in the fourth quarter of 2022 after reflecting the
streaming arrangement with Royal Gold (35% of the Mount Milligan
Mine’s gold is sold for $435 per ounce) and mark-to-market
adjustments on gold ounces that have yet to settle at
September 30, 2022 compared to the previous assumption of
$1,230 per ounce.
- a market copper price of $3.25 per
pound and an average realized copper price at the Mount Milligan
Mine of $2.65 per pound in the fourth quarter of 2022 after
reflecting the streaming arrangement with Royal Gold (18.75% of the
Mount Milligan Mine’s copper is sold at 15% of the spot price per
metric tonne) and further mark-to-market adjustments on copper
pounds that have yet to settle at September 30, 2022, compared
to the assumptions of $3.25 per pound and $2.34 per pound,
respectively, which reflects changes in the commodities markets,
and settlements of some of the outstanding copper sales under
contracts awaiting final settlement during the third quarter of
2022.
- molybdenum price of $17.50 per
pound, compared to $17.00 per pound previously assumed.
- revised exchange rates: $1USD:$1.30
CAD; $1USD:18.0 Turkish lira; with a Turkish inflation assumption
of approximately 80% for the full year, compared to the previous
assumptions of $1USD:$1.27 CAD; $1USD:15.0 Turkish lira; a Turkish
inflation assumption of 80%.
- diesel fuel price assumption of
$0.90/litre (CAD$1.17/litre) compared to the previous assumption of
$0.90/litre (CAD$1.14/litre) at the Mount Milligan Mine.
Mount Milligan Streaming
Arrangement
The Mount Milligan Mine is an open pit mine
located in north central British Columbia, Canada producing a gold
and copper concentrate. Production at the Mount Milligan Mine is
subject to an arrangement with RGLD Gold AG and Royal Gold, Inc.
(together, “Royal Gold”) pursuant to which Royal Gold is entitled
to purchase 35% of the gold produced and 18.75% of the copper
production at the Mount Milligan Mine for $435 per ounce of gold
delivered and 15% of the spot price per metric tonne of copper
delivered (the “Mount Milligan Streaming Arrangement”). To satisfy
its obligations under the Mount Milligan Streaming Arrangement the
Company purchases refined gold and copper warrants and arranges for
delivery to Royal Gold. The difference between the cost of the
purchases of refined gold and copper warrants, and the
corresponding amounts payable to the Company under the Mount
Milligan Streaming Arrangement is recorded as a reduction of
revenue and not a cost of operating the mine.
Other Material
Assumptions
Other material assumptions used in forecasting
production and costs for the fourth quarter of 2022 can be found
under the heading “Caution Regarding Forward-Looking
Information” in this document. Production, cost, and capital
expenditure forecasts for the fourth quarter of 2022 are
forward-looking information and are based on key assumptions and
subject to material risk factors that could cause actual results to
differ materially and which are discussed under the heading “Risks
That Can Affect Centerra’s Business” in the Company’s most recent
AIF.
2022 Sensitivities
Centerra’s revenues, earnings, and cash flows
for the fourth quarter of 2022 are sensitive to changes in certain
key inputs or currencies. The Company has estimated the impact of
any such changes on revenues, net earnings, and cash flows on the
fourth quarter as follows:
|
|
|
Impact on
($millions) |
Impact on
($ per ounce
sold) |
|
|
|
Production
Costs &
Taxes |
|
Capital
Costs |
|
Revenues |
|
Cash flows |
|
Net Earnings
(after tax) |
All-in
sustaining costs
on a
by-product basis
per ounceNG |
|
Gold price |
$50/oz |
0.1 - 0.2 |
|
— |
|
4.5 - 5.2 |
|
4.4 - 5.0 |
|
4.4 - 5.0 |
1.5 - 1.7 |
|
Copper price(1)(2) |
10% |
0.3 - 0.4 |
|
— |
|
7.1 - 10.0 |
|
6.8 - 9.6 |
|
6.8 - 9.6 |
130.0 - 140.0 |
|
Diesel fuel(1) |
10% |
0.4 - 0.5 |
|
0.1 - 0.2 |
|
— |
|
0.5 - 0.7 |
|
0.4 - 0.5 |
8.0 - 9.5 |
|
Canadian dollar(1)(3) |
10 cents |
2.5 - 2.6 |
|
0.3 - 0.5 |
|
— |
|
2.8 - 3.1 |
|
2.5 - 2.6 |
35.0 - 55.0 |
(1) Includes
the effect of the Company’s copper, diesel fuel and Canadian dollar
hedging programs, with current exposure coverage for the fourth
quarter of 2022 approximately 56%, 62% and 72%,
respectively.
(2) Includes the effect of
adjusting 25.0 million pounds of copper outstanding under contracts
awaiting final settlement in future months as of September 30,
2022 to a market price of $3.25 per pound from the copper price of
$3.42 used at the end of the quarter partially offset by the effect
of copper hedges bringing the expected average blended copper price
to $3.40 per pound in the fourth quarter of 2022.
(3) Appreciation of currency
against the US dollar results in higher costs and lower cash flow
and earnings, depreciation of currency against the US dollar
results in decreased costs and increased cash flow and
earnings.
Recent Events and
Developments
Update on Öksüt Mine
Operations
On March 18, 2022, Centerra announced that it
had temporarily suspended gold doré bar production at the Öksüt
Mine due to mercury detected in the gold room at the ADR plant.
Subsequent to the detection of mercury in the gold room, urine
samples were collected from full-time employees and contractors
working in and around the gold room and analyzed at an independent
certified medical laboratory. Although elevated mercury values were
detected in 12 individuals, following their medical examinations,
each of them have been cleared to return to full time duty at the
mine. The Company continues to monitor and support the health care
needs of its workers. In conjunction with the engineered solution
for the gold room at the ADR plant, the Company is revising all
related health and safety protocols necessary for the installation
and safe operation of the new equipment and systems in accordance
with the manufacturer instructions and regulatory standards.
After identifying mercury in the gold room of
the ADR plant, all stripping, electrowinning, refining, and pouring
operations were stopped. The affected areas were professionally
cleaned, and any contaminated material was removed and properly
disposed of. An engineered solution was developed with the
assistance of external consultants to ensure that mercury levels
are detected, monitored and captured to prevent exposure to
personnel and to safeguard the environment. The Company is
currently constructing a mercury retort system to allow mercury to
be safely vaporized from the sludge with the vapor condensed and
collected in a fully contained system. The furnace off-gas system
will also be replaced to ensure that any remaining mercury is
scrubbed from the gas and captured.
All of the major equipment is nearly fabricated
and has largely been delivered to site, construction is progressing
well and is expected to be completed in late 2022, with total
capital costs expected to be $5 million. The Company will work with
relevant authorities to obtain the required approvals to restart
gold room operations at the ADR plant which the Company now expects
will occur shortly after the new EIA for the Öksüt Mine is
approved.
From the date of suspension of gold room
operations through to August 2022, the Company continued to process
ore into gold-in-carbon form and has approximately 100,000
recoverable ounces of stored gold-in-carbon as at September 30,
2022.
Permitting
In May 2022 the Öksüt Mine was inspected by the
Ministry of Environment, Urbanization and Climate Change (the
“Ministry of Environment”). The Ministry of Environment informed
the Öksüt Mine of a number of deficiencies relating to the Öksüt
Mine’s environmental impact assessment (“EIA”). The Company worked
to address the majority of the deficiencies and following several
further discussions with the Ministry of Environment, and (i) the
Company determined that an updated EIA should be prepared and
submitted to clarify various production and other capacity limits
and to align the EIA permit levels with expected operating plans;
(ii) the Öksüt Mine suspended leaching of ore on the heap leach pad
and ceased using activated carbon on site effective late August
2022 through mining, crushing and stacking activities continue in
line with existing EIA limits. The extent of mining, crushing and
stacking activity for the remainder of the year will continue to be
evaluated as the Company advances through the permitting process
and may be reduced significantly prior to the end of the year.
The Öksüt Mine’s application to update its EIA
was submitted to regulators at the end of August 2022 and the full
EIA submission, inclusive of all supporting technical studies, is
expected to be submitted before the end of 2022. Following the
final EIA submission, the Company expects to work with Turkish
officials and other stakeholders on the regulatory review and
approval of its EIA and such other permits that may be required to
allow for a timely full restart of all operations. Once operations
resume, the ADR plant is expected to have sufficient production
capacity to process up to approximately 35,000 ounces of gold per
month, which would allow the stored gold-in-carbon inventory to be
processed on a timely basis.
The Company is also in pursuit of other ordinary
course permits, including: (i) an enlarged grazing land permit to
allow expansion of the existing operation to the currently defined
EIA boundary of the Keltepe and Güneytepe pits; and (ii) an
extension of the Öksüt Mine’s overall operating license which is
scheduled to expire in January 2023.
While the Company will continue to pursue an
updated EIA and all other required permits, there can be no
assurance that the Company will be able to successfully obtain all
or any such approvals nor can there be any assurance as to the
timing of any of the foregoing. The inability to successfully
obtain such approvals could have a significant material adverse
impact on the Company’s mining, stacking, leaching and production
activities at the Öksüt Mine, and future cash flows, earnings,
results of operations and financial condition.
Update on the Mount Milligan Mine’s
life of mine (“LOM”) plan
On October 4, the Company announced a mine life
extension for the Mount Milligan Mine by over four years extending
operations into 2033 and an increase in proven and probable gold
mineral reserves from the 2021 year-end mineral reserve and
resources summary by 1.1 million contained ounces (1.8 million to
2.9 million) and copper mineral reserves by 260 million contained
pounds (736 million to 996 million).
The LOM includes payable gold production of 1.9
million ounces at a production cost of $502 per ounce, an all-in
sustaining cost on a by-product basisNG of $756 per
ounce and all-in cost on a by-product basisNG of $770
per ounce.
The associated NI 43-101 Technical Report,
titled “Technical Report on The Mount Milligan Mine” with an
effective date of December 31, 2021, is being filed on SEDAR at
www.sedar.com and EDGAR
at www.sec.gov/edgar on
November 7, 2022.
Acquisition of Goldfield
Project
On February 28, 2022, Centerra announced the
completion of the acquisition of Gemfield Resources LLC, owner of
the Goldfield Project, from Waterton Nevada Splitter, LLC. The
final purchase consideration comprised $176.7 million in cash paid
at closing, including reimbursement of $1.7 million incurred by the
seller for the construction of a water supply infrastructure, and a
$31.5 million deferred milestone payment. At the option of
Centerra, the deferred milestone payment is payable in cash or
common shares of the Company and becomes payable the earlier of 18
months following the closing of the transaction or the date a
construction decision is approved by its Board of Directors with
respect to the project, among other things.
The Goldfield Project is a conventional
open-pit, heap leach project located in Nevada, USA, a Tier 1
mining jurisdiction, and contains three known deposits. The Company
believes that the project has upside potential from its large,
under-explored land position in an established mining area in
Nevada. The project increases Centerra's exposure to North America
and provides an asset that can act as a foothold for further
opportunities in the United States. In the third quarter of 2022,
drill programs included infill, resource expansion, and exploration
drilling as well as metallurgical, geotechnical, and
hydrogeochemical drilling, in support of an initial resource
estimate by mid-year 2023 and an updated resource estimate
accompanied by the completion of a feasibility study thereafter.
Drilling comprised 12,400 metres of exploration drilling and
technical services drilling in 54 drill holes, including 24 RC
drill holes for 5,400 metres and 30 diamond drill holes for 7,000
metres. Late in the quarter, two additional rigs were added to
increase drill production for the total of four rigs at site as of
September 30, 2022. As of the end of the third quarter, 16,500
metres of exploration and technical services drilling have been
completed in 80 drill holes in 2022. All assay results were pending
as of the end of the quarter. The Company expects to continue this
work in the fourth quarter of 2022.
Normal Course Issuer
Bid
On October 11, 2022, Centerra announced the
Toronto Stock Exchange had accepted its notice of intention to
proceed with a normal course issuer bid (“NCIB”). Under the NCIB,
Centerra may purchase for cancellation up to an aggregate of
15,610,813 common shares in the capital of the Company (“Common
Shares”) during the twelve-month period commencing on October 13,
2022 and ending on October 12, 2023, representing 10% of the public
float. Any tendered Common Shares taken up and paid for Centerra
under the NCIB will be cancelled. Under the NCIB, daily purchases
would be limited to 226,201 Common Shares, other than purchases
made under block purchase exemptions. Once the NCIB is commenced,
the exact timing and amount of any purchases will depend on market
conditions and other factors. Centerra will not be obligated to
acquire any Common Shares and may suspend or discontinue purchases
under the NCIB at any time.
The Company expects to commence the market
purchase of shares subsequent to filing its third quarter results,
subject to market conditions.
COVID-19, Global Supply Chain
Disruption and Inflation Pressures
Centerra continues to take steps to manage the
effect of the COVID-19 pandemic on its business. The Company’s
operations have not been adversely impacted by COVID-19 in any
significant way as employee absences due to COVID-19, or any other
illnesses, have so far been successfully managed. However, the
Company notes that the effects of COVID-19 on its business could
change rapidly.
Centerra continues to assess the resiliency of
its supply chains, maintaining increased mine site inventories of
key materials and fixed asset components and has increased its
stock of key supplies to mitigate supply chain risks. Additionally,
the Company is pursuing an active sourcing strategy to identify
potential alternatives for its critical supplies that can be
purchased in alternative countries to reduce the risk of extended
lead-times while trying to maintain an optimal cost structure. The
Company also continues to monitor for any adverse impact on the
global supply chain and consequences from the Russian invasion in
Ukraine; however, the supply of critical consumables and reagents
to the Company’s sites has not been affected to date.
The Company is affected by the current
inflationary environment and its impact on certain operating costs.
A significant portion of the upward pressure on prices has been
attributed to the rising costs of labour, energy and consumables.
At the Mount Milligan Mine, labour costs have increased with the
market and price increases have occurred in the areas of grinding
media, tires, equipment parts and diesel fuel compared to prior
year pricing. The Company expects further price escalation in 2023.
The weighted average price increase across all production cost
categories compared to 2021 is in the range of 10%, which was
partially offset by the weakening of the Canadian dollar relative
to the US dollar, and the gains realized through the Company’s fuel
hedging program. At the Öksüt Mine, the impact of hyperinflation on
labour costs and slightly higher electricity costs was more than
offset by the continuing devaluation of the Turkish lira. While
there has been minimal impact to date, the Company anticipates
potential increases in cyanide and activated carbon prices.
Executive Management
Changes
The Company announced appointment of Paul
Chawrun as its new Chief Operating Officer in August 2022.
On September 6, Paul Wright, a director of
Centerra replaced Scott Perry as President and Chief Executive
Officer of Centerra. Mr. Wright, a director of Centerra, will act
as interim President and Chief Executive Officer to manage the
Company through a leadership transition period as the Board works
with an executive search firm to select Centerra’s next Chief
Executive Officer. In connection with this leadership transition,
Mr. Perry also resigned as a director of Centerra.
Kumtor Mine
On July 29, 2022, Centerra announced that it had
completed the Transaction contemplated by the Arrangement Agreement
with, among others, Kyrgyzaltyn and the Kyrgyz Republic to effect a
separation of the parties, including through the disposition of
Centerra’s ownership of the Kumtor Mine and its investment in the
Kyrgyz Republic, the purchase for cancellation by Centerra of
Kyrgyzaltyn’s 77,401,766 Centerra common shares, the termination of
Kyrgyzaltyn’s involvement in the Company, and the resolution of
disputes.
As a result of the completion of the
Transaction, Centerra has repurchased and cancelled all of
Kyrgyzaltyn’s 77,401,766 Centerra common shares in exchange for,
among other things, Centerra’s 100% equity interest in its two
Kyrgyz subsidiaries, and indirectly, the Kumtor Mine, with
Kyrgyzaltyn and the Kyrgyz Republic assuming all responsibility for
the Kumtor mine, including all reclamation and environmental
obligations, and aggregate cash payments of approximately $93
million (a portion of which was withheld on account of Canadian
withholding taxes payable by Kyrgyzaltyn and a portion of which was
paid to the Company’s financial advisors as transaction costs). The
completion of the Transaction resulted in:
- Full and final releases of all
past, present and future claims of the parties.
- Termination of legal proceedings
involving the parties in all jurisdictions with no admissions of
liability. This includes:
- Any and all cases, proceedings,
investigations, inquiries or other actions by the Kyrgyz Republic,
Kyrgyzaltyn or any other Kyrgyz governmental entity or any person
acting on behalf of and/or for the benefit of any such person
against Centerra and the other persons and entities released under
the Arrangement Agreement (the “Kyrgyz Proceedings”) were withdrawn
and terminated to Centerra’s sole satisfaction;
- The parties have jointly sought the
termination of the international arbitration proceedings that were
previously commenced by the Company, KGC and Kumtor Operating
Company (“KOC”) against the Kyrgyz Republic and Kyrgyzaltyn;
- Centerra has agreed to consent to
an order setting aside the judgement issued in the Ontario Superior
Court of Justice against Mr. Tengiz Bolturuk on February 15, 2022;
and
- Chapter 11 proceedings in U.S.
Bankruptcy Court for the Southern District of New York involving
KGC and KOC were dismissed.
- Resolution of the inter-company
balance between Centerra and KGC in part by paying $50 million to
KGC on closing of the Arrangement and, as to the balance, by way of
set off against an offsetting dividend to be declared by KGC
immediately prior to closing of the Arrangement.
- The resignation from Centerra’s
Board of Directors of Kyrgyzaltyn’s two nominees and the
termination of the shareholders agreement between, among others,
Centerra and Kyrgyzaltyn.
- Termination of all agreements
entered into by Centerra in respect of the Kumtor Mine vis-à-vis
Centerra’s rights and obligations.
Further details on the terms of the Arrangement
Agreement and the Transaction can be found in Centerra’s April 4,
2022 news release and in Centerra’s management information circular
in respect of the special meeting of Centerra shareholders held on
July 25, 2022 to approve the Transaction, copies of which are
available on SEDAR at www.sedar.com and on
EDGAR at www.sec.gov/edgar.
Employee Health and
Safety
The Company recognized the following notable
developments in the course of the third quarter of 2022:
- The Kemess Project achieved two
years without a reportable injury.
- Endako Mine achieved nine years
without a lost time injury.
- The Öksüt Mine achieved one million
work hours without a lost-time injury.
- Thompson Creek Mine achieved two years
without a lost time injury.
- There were nine reportable injuries
company-wide, including two lost-time injury, six medical aid
injuries, and one restricted work injury.
Liquidity and Capital
Resources
The Company’s total liquidity position as
September 30, 2022 was $972.8 million, representing a cash
balance of $580.8 million and $392 million available under a
corporate credit facility. Credit Facility availability is reduced
by outstanding letters of credit, amounting to $8.0 million as at
September 30, 2022.
As a result of the loss of control of the Kumtor
Mine in the second quarter of 2021, the Company derecognized the
assets and liabilities of the Kumtor Mine in the statements of
financial position and presented its financial and operating
results prior to the loss of control as discontinued operations for
the first quarter of 2021. As a result, the Company’s consolidated
cash flow results from continuing operations discussed in this
MD&A (including prior periods) exclude the Kumtor Mine’s
operations, unless otherwise noted.
Third
Quarter 2022
compared to
Third Quarter
2021
See the Overview of Consolidated
Results section in this MD&A for the discussion of cash
used in operating activities.
Cash used in investing activities of $18.5
million was recognized in the third quarter of 2022 compared to
cash used in investing activities from continuing operations of
$20.3 million in the third quarter of 2021. The decrease is
primarily due to timing of capital expenditures between
periods.
Cash used in financing activities during the
third quarter of 2022 was $107.1 million compared to $13.3 million
in the third quarter of 2021. The increase was primarily due to the
repurchase and cancellation of 77,401,766 Centerra common shares
held by Kyrgyzaltyn in the third quarter of 2022 as part of the
Transaction contemplated by the Arrangement Agreement.
Nine
months ended
September 30, 2022
compared to
2021
See the Overview of Consolidated
Results section in this MD&A for the discussion of cash
provided by operating activities.
Cash used in investing activities of $240.1
million was recognized in 2022 compared to cash provided by
investing activities from continuing operations of $145.6 million
in 2021. The cash used in investing activities from continuing
operations was primarily due to the acquisition of the Goldfield
Project of $176.7 million. Cash provided by investing activities
from continuing operations in 2021 was primarily due to proceeds
received from the sale of the Company’s 50% interest in the
Greenstone Partnership of $210.3 million.
Cash used in financing activities of $134.2
million was recognized in 2022 compared to $36.0 million in 2021.
The increase was primarily due to repurchase and cancellation of
77,401,766 Centerra common shares held by Kyrgyzaltyn as part of
the Transaction contemplated by the Arrangement Agreement and
higher dividends paid.
Financial Performance
As previously disclosed, the Company lost
control of the Kumtor Mine in May 2021 and, accordingly, the Kumtor
Mine has been classified as a discontinued operation. The financial
and operating data below is presented on a continuing operations
basis and thus excludes the Kumtor Mine for all periods discussed,
unless otherwise noted.
Third
Quarter 2022
compared to
Third Quarter
2021
Revenue of $179.0 million was recognized in the
third quarter of 2022 compared to $220.5 million in the third
quarter of 2021. The decrease in revenue was primarily due to no
ounces of gold sold at the Öksüt Mine, lower average realized gold
and copper prices at the Mount Milligan Mine and lower average
realized molybdenum prices. The overall decrease in revenue was
partially offset by higher ounces of gold and pounds of copper sold
at the Mount Milligan Mine and an increase in the pounds of
molybdenum sold at the Molybdenum BU.
Gold production was 54,134 ounces in the third
quarter of 2022 compared to 76,913 ounces in the third quarter of
2021. Gold production in the third quarter of 2022 included 54,134
ounces of gold from the Mount Milligan Mine compared to 39,658
ounces in the third quarter of 2021 primarily due to higher gold
grades, higher mill throughput and higher recoveries. There were no
gold ounces produced at the Öksüt Mine in the third quarter of 2022
compared to 37,255 ounces in the third quarter of 2021 due to the
continued suspension of gold room operations at the ADR plant.
Copper production at the Mount Milligan Mine was
19.0 million pounds in the third quarter of 2022 compared to 17.9
million pounds in the third quarter of 2021. The increase was
primarily due to higher mill throughput driven by higher mill
runtime and higher recoveries, partially offset by lower copper
grades.
The Langeloth Facility roasted and sold 4.2
million pounds and 3.3 million pounds of molybdenum, respectively,
in the third quarter of 2022, compared to 2.5 million pounds and
2.6 million pounds, respectively in the third quarter of 2021. The
increase in the molybdenum roasted and sold was primarily due to
increased activity to make up for an unplanned acid plant shutdown
in the first quarter of 2022 that impacted Langeloth Facility’s
ability to roast purchased molybdenum.
Cost of sales of $146.4 million was recognized
in the third quarter of 2022 compared to $152.1 million in the
third quarter of 2021. The decrease was primarily due to all
production costs and DDA being capitalized to production inventory
at the Öksüt Mine from the suspension of gold room operations of
the ADR plant and no production of doré bars, lower DDA at the
Mount Milligan Mine primarily attributable to the increase in
proven and probable reserves and the weakening of the Canadian
dollar relative to the US dollar between the periods. These were
partially offset by higher production costs at the Mount Milligan
Mine due to higher mining, processing and administrative expenses
from the impact of rising inflation in Canada. Mining costs were
impacted by higher diesel prices and higher consumption of diesel
in the period, partially offset by gains from the Company’s hedging
program. Processing costs were higher primarily due to higher
consumption and cost of liners, major equipment rebuilds, increased
grinding media costs as well as higher contractor costs associated
with a planned mill shutdown. Higher administrative costs were due
to an increase in insurance costs and higher consulting costs
related to various information technology and environmental
projects. In addition, there were higher production costs at the
Molybdenum BU as a result of higher average molybdenum prices paid
to obtain product inventory to be processed and an increase in
pounds of molybdenum roasted.
Gold production costs were $729 per ounce in the
third quarter of 2022 compared to $630 per ounce in the third
quarter of 2021. The increase was primarily due to lower gold
ounces sold, higher production costs at the Mount Milligan Mine as
noted above, and higher allocation of costs to gold production
costs at the Mount Milligan Mine from changes in the relative
market prices of gold and copper.
All-in sustaining costs on a by-product
basisNG from continuing operations were $941 per ounce
in the third quarter of 2022 compared to $781 per ounce in the
third quarter of 2021. The increase in all-in sustaining costs on a
by-product basisNG was primarily due to a decrease in
ounces of gold sold.
All-in costs on a by-product basisNG
from continuing operations were $1,376 per ounce in the third
quarter of 2022 compared to $932 per ounce in the third quarter of
2021. The increase was primarily due to higher all-in sustaining
costs on a by-product basisNG as noted above, and higher
exploration and project development costs mostly related to the
Goldfield Project.
Expensed exploration and development
expenditures of $21.4 million were recognized in the third quarter
of 2022 compared to $6.6 million in the third quarter of 2021. The
increase was primarily due to drilling activities and technical
studies undertaken as part of project development activities at the
Goldfield Project, and the brownfield exploration activities at the
Mount Milligan Mine. The total expenditures of $21.4 million
comprised $6.8 million of project development costs at the
Goldfield Project, $3.7 million of drilling and related costs at
the Goldfield Project and $10.9 million of drilling and related
costs across the Company’s other exploration projects.
Reclamation recovery was $7.7 million in the
third quarter of 2022 compared to $0.9 million in the third quarter
of 2021. The $7.7 million reclamation provision revaluation
recovery at sites on care and maintenance in the Molybdenum BU was
primarily attributable to an increase in the risk-free interest
rates applied to discount the estimated future reclamation cash
flows, partially offset by an increase in scope of planned
reclamation activities and higher inflation applied to the
reclamation cash flows at the Endako Mine and Thompson Creek
Mine.
Other non-operating expenses of $0.7 million
were recognized in the third quarter of 2022 compared to $7.0
million in the third quarter of 2021. The decrease was primarily
due to a decrease in litigation and related costs incurred in
connection with the seizure of the Kumtor Mine and an increase in
foreign exchange gains and interest income earned on the Company’s
cash balance from rising interest rates.
The Company recognized income tax expense of
$26.1 million in the third quarter of 2022, comprising current
income tax recovery of $1.4 million and deferred income tax expense
of $27.5 million, compared to income tax expense of $8.4 million in
the third quarter of 2021, comprising current income tax expense of
$2.6 million and deferred income tax expense of $5.8 million. The
increase in income tax expense was primarily due to the net impact
of foreign exchange rate changes on the temporary differences
between accounting and tax bases relating to the Mount Milligan
Mine, the Kemess Project, and other comprehensive income
components.
Nine
months ended September 30,
2022 compared to
2021
Revenue of $641.9 million was recognized in 2022
compared to $649.1 million in 2021. The decrease in revenue was
primarily due to a decrease in ounces of gold sold at the Öksüt
Mine and a decrease in ounces of gold and pounds of copper sold at
the Mount Milligan Mine, partially offset by higher average
realized copper and molybdenum prices and an increase in pounds of
molybdenum sold at the Molybdenum BU.
Gold production was 190,646 ounces in 2022
compared to 216,944 ounces in 2021. Gold production in 2022
included 135,955 ounces of gold from the Mount Milligan Mine,
compared to 136,909 ounces in 2021, primarily due to lower gold
grades, partially offset by higher recoveries and higher throughput
as a result of higher mill runtime. The Öksüt Mine produced 54,691
ounces of gold in 2022 compared to 80,035 ounces of gold in 2021,
primarily due to suspension of gold room operations at the ADR
plant since March 2022.
Copper production at the Mount Milligan Mine was
57.0 million pounds in 2022 compared to 56.3 million pounds in
2021. The increase was primarily due to higher throughput, a result
of higher mill runtime, and higher recoveries, partially offset by
lower copper grades.
The Langeloth Facility roasted and sold 8.9
million pounds and 9.4 million pounds of molybdenum, respectively,
in 2022 compared to 7.8 million pounds and 9.1 million pounds,
respectively, in 2021. The increase in the molybdenum roasted was
primarily due to increased purchases of molybdenum concentrate and
higher utilization of plant capacity in 2022. The increase in the
molybdenum sold was primarily due to the Company’s execution of a
streamlined business plan to reduce total inventory held on site
and overall working capital.
Cost of sales of $496.4 million was recognized
in 2022 compared to $445.2 million in 2021. The increase was
primarily due to higher production costs at the Molybdenum BU
related to higher average molybdenum prices paid to obtain product
inventory to be processed and increase in the pounds of molybdenum
roasted. In addition, there were higher production costs at the
Mount Milligan Mine mainly driven by higher mining, processing and
administrative expenses due to the impact of rising inflation in
Canada and onset of pressures on input costs. Mining costs were
impacted by higher diesel prices and higher consumption of diesel
in the period, partially offset by the Company’s hedging program.
Processing costs were higher primarily due to higher liner,
electricity and contractor costs. Higher administrative costs were
primarily due to an increase in salaries and wages, an increase in
recruiting and insurance costs and higher consulting costs related
to various information technology and environment projects.
Partially offsetting the increase in production costs at the Mount
Milligan Mine was the weakening of the Canadian dollar relative to
the US dollar between the periods. In addition, there was a
decrease in production costs at the Öksüt Mine, primarily due to
lower production costs, including lower royalty costs. The decrease
in production costs was primarily due to the weakening of the
Turkish lira relative to the US dollar between the periods and
capitalization of all mining, processing and administrative costs
incurred in the second and third quarters of 2022 to production
inventory as no gold ounces were sold. The decrease in production
costs at the Öksüt Mine was partially offset by higher mining
contractor costs from higher fuel prices and a lower strip ratio,
resulting in a lower portion of mining costs being capitalized as
well as higher processing costs from an increase in tonnes of ore
stacked on the heap leach pads and increase in hauling costs from
higher fuel prices.
Gold production costs from continuing operations
were $653 per ounce in 2022 compared to $626 per ounce in 2021. The
increase in gold production costs per ounce from continuing
operations was primarily due to a decrease in gold sold at the
Mount Milligan Mine and the Öksüt Mine and the increase in
production costs at the Mount Milligan Mine, partially offset by a
decrease in gold production costs primarily due to a higher
allocation of costs to copper production costs at the Mount
Milligan Mine from changes in the relative market prices of gold
and copper.
All-in sustaining costs on a by-product
basisNG from continuing operations were $826 per ounce
in 2022 compared to $672 per ounce in 2021. The increase was
primarily due to a decrease in ounces of gold sold at the Mount
Milligan Mine and at the Öksüt Mine and higher corporate
administration costs.
All-in costs on a by-product basisNG
were $1,105 per ounce in 2022 compared to $806 per ounce in 2021.
The increase was due to higher all-in sustaining costs on a
by-product basisNG and higher exploration and project
development costs mostly related to the Goldfield Project.
Expensed exploration and development costs were
$43.0 million in 2022, compared to $18.8 million in 2021. The
increase was primarily due to various drilling activities and
technical studies undertaken as part of project development
activities at the Goldfield Project, and the brownfield exploration
activities at the Mount Milligan Mine. The total expenditures of
$43.0 million comprised $10.8 million of project development costs
at the Goldfield Project, $4.5 million of drilling and related
costs at the Goldfield Project and $27.7 million of drilling and
related costs across the Company’s other exploration projects.
Corporate administration expenses were $35.5
million in 2022, compared to $19.7 million in 2021. The increase
was primarily due to management changes and associated severance
payments, an increase in consulting costs and software costs from
various information technology projects, including the
implementation of the Company-wide enterprise resource planning
system and an increase in travel expenses. Partially offsetting an
increase in corporate administration costs was a decrease in the
provision for share-based compensation due to the effect of the
decline in the Company’s share price.
Reclamation recovery, which primarily relates to
movement in the reclamation liabilities in the Company’s Molybdenum
BU sites currently on care and maintenance, was $90.6 million in
2022 compared to $0.9 million in 2021. The increase in reclamation
recovery was primarily due to an increase in the risk-free interest
rates applied to discount the estimated future reclamation cash
flows. This was partially offset by an increase in underlying
future reclamation cash flows impacted by various factors,
including higher inflation and change in the scope of reclamation
activities.
A gain on sale of $72.3 million (excluding
contingent receivable consideration) was recognized in the first
quarter of 2021 on the disposal of the Company’s 50% interest in
the Greenstone Partnership.
Other non-operating expenses of $7.3 million
were recognized in the nine months ended September 30, 2022
compared to $14.1 million in the nine month ended September 30,
2021. The decrease was primarily due to an increase in foreign
exchange gains and interest income earned on the Company’s cash
balance from rising interest rates, partially offset by an increase
in litigation and related costs incurred in connection with the
seizure and the loss of control of the Kumtor Mine.
Income tax expense of $57.9 million, comprising
current income tax expense of $36.5 million and deferred income tax
expense of $21.4 million, was recognized in 2022, compared to an
income tax expense of $17.6 million, comprising current income tax
expense of $8.1 million and deferred income tax expense of $9.5
million in 2021. The increase in income tax expense was primarily
due to the taxation of the Öksüt Mine’s income at the full
statutory income tax rate as the Company had utilized all of
Öksüt’s Investment Incentive Certificate, the net impact of foreign
exchange fluctuation on monetary assets and liabilities of the
Öksüt Mine, and the impact of foreign exchange rate changes on the
temporary differences between accounting and tax bases of the Mount
Milligan Mine and Kemess Project, and other comprehensive income
components.
Net loss from discontinued operations was $828.7
million in the nine months ended September 30, 2021. Net loss
from discontinued operation was primarily due to the loss on the
change of control of the Kumtor Mine of $926.4 million recognized
in the second quarter of 2021.
Financial Instruments
The Company seeks to manage its exposure to
fluctuations in diesel fuel prices, commodity prices and foreign
exchange rates by entering into derivative financial instruments
from time-to-time. The hedge positions for each of these programs
as at September 30, 2022 are summarized as follows:
|
|
|
|
Average Strike Price |
Settlements
(% of exposure hedged) |
As at
September 30, 2022 |
|
Instrument |
Unit |
Type |
Q4
2022 |
2023 |
2024 |
Q4
2022 |
2023 |
2024 |
Total
position(2) |
Fair
value
($'000's) |
|
|
|
|
|
|
|
|
|
|
|
|
|
FX Hedges |
|
|
|
|
|
|
|
|
|
|
|
USD/CAD zero-cost collars |
CAD |
Fixed |
$1.26/$1.33 |
$1.27/$1.34 |
$1.27/$1.34 |
$50.0 M (39%) |
$254.0 M |
$117.0 M |
$421.0 M |
(15,698 |
) |
|
USD/CAD forward contracts |
CAD |
Fixed |
1.29 |
1.28 |
1.30 |
$60.0 M (33%) |
$145.0 M |
$81.0 M |
$286.0 M |
(15,049 |
) |
|
Total |
|
|
|
|
|
$110.0 M (72%) |
$399.0 M |
$198.0 M |
$707.0 M |
(30,747 |
) |
|
|
|
|
|
|
|
|
|
|
|
|
|
Fuel Hedges |
|
|
|
|
|
|
|
|
|
|
|
ULSD zero-cost collars |
Barrels |
Fixed |
$59/$64 |
$73/$78 |
N/A |
7,100 (19%) |
13,500 |
N/A |
20,600 |
1,005 |
|
|
ULSD swap contracts |
Barrels |
Fixed |
$68 |
$79 |
$82 |
16,000 (43%) |
44,000 |
15,600 |
75,600 |
3,017 |
|
|
Total |
|
|
|
|
|
23,100 (62%) |
57,500 |
15,600 |
96,200 |
4,022 |
|
|
|
|
|
|
|
|
|
|
|
|
|
|
Copper
Hedges(1): |
|
|
|
|
|
|
|
|
|
|
Copper zero-cost collars |
Pounds |
Fixed |
$3.64/$4.78 |
$4.00/$4.91 |
$4.00/$5.06 |
8.7 M (56%) |
22.8 M |
9.9 M |
41.4 M |
24,863 |
|
|
|
|
|
|
|
|
|
|
|
|
|
|
Gold/Copper Hedges (Royal Gold
deliverables):(2) |
|
|
|
|
|
|
|
|
Gold forward contracts |
Ounces |
Float |
N/A |
N/A |
N/A |
20,960 |
N/A |
N/A |
20,960 |
(1,155 |
) |
|
Copper forward contracts |
Pounds |
Float |
N/A |
N/A |
N/A |
1.8M |
N/A |
N/A |
1.8 M |
(20 |
) |
(1) The copper
hedge ratio is based on the forecasted copper pounds sold, net of
the streaming arrangement with Royal Gold.
(2) Royal Gold hedging program
with a market price determined on closing of the
contract.
The realized (loss) gain recorded in the
consolidated statements of earnings was as follows:
| |
Three months ended September 30, |
|
Nine months ended September 30, |
|
($millions) |
2022 |
|
2021 |
|
% Change |
|
2022 |
|
2021 |
|
% Change |
|
Foreign exchange hedges |
(95 |
) |
4,101 |
|
(102 |
)% |
|
3,570 |
|
14,042 |
|
(75 |
)% |
|
Fuel hedges |
2,157 |
|
993 |
|
117 |
% |
|
7,286 |
|
19,379 |
|
(62 |
)% |
|
Copper hedges |
1,922 |
|
(12,934 |
) |
(115 |
)% |
|
1,922 |
|
(36,984 |
) |
(105 |
)% |
The Company’s zero-cost copper collars are
settled based on monthly average copper prices, protecting a price
floor with participation to the upside of the call strike. See more
details on the Company’s policy and accounting treatment in note 19
of the condensed consolidated interim financial statements for the
three and nine months ended September 30, 2022.
As at September 30, 2022, Centerra has not
entered into any off-balance sheet arrangements with special
purpose entities, nor does it have any unconsolidated
affiliates.
Balance Sheet Review
|
($millions) |
September 30, 2022 |
December 31, 2021 |
% Change
|
|
Total Assets |
2,449.8 |
2,676.6 |
(8 |
)% |
|
Total Liabilities |
488.4 |
633.0 |
(23 |
)% |
|
Total Equity |
1,961.5 |
2,043.6 |
(4 |
)% |
As a result of the loss of control of the Kumtor
Mine in the second quarter of 2021, the Company deconsolidated the
assets and liabilities of KGC, a 100%-owned subsidiary that holds
the Kumtor Mine, in the Company’s consolidated statements of
financial position. The assets and liabilities presented as at
September 30, 2022 and December 31, 2021 do not include
the Kumtor Mine.
Cash as at September 30, 2022 was $580.8
million compared to $947.2 million as at December 31, 2021.
The decrease was primarily due to cash consideration of $176.7
million paid on closing for the acquisition of Goldfield Project,
consideration of $93.3 million paid to repurchase and cancel
Kyrgyzaltyn’s 77,401,766 Centerra common shares as part of the
Transaction contemplated by the Arrangement Agreement, a free cash
flow deficitNG of $57.6 million and dividends paid of
$36.2 million during the nine months ended September 30,
2022.
Total inventories as at September 30, 2022
were $244.4 million compared to $221.2 million at December 31,
2021. The increase in inventories was primarily due to stored
gold-in-carbon inventory being accumulated at the Öksüt Mine due to
the suspension of gold room operations at the ADR plant, partially
offset by a decrease in molybdenum inventory at the Langeloth
Facility primarily due to execution of the new business strategy to
reduce working capital.
The carrying value of PP&E as at
September 30, 2022 was $1.42 billion compared to $1.27 billion
as at December 31, 2021. The increase was primarily due to
additions of $208.2 million of property, plant and equipment
resulting from the acquisition of the Goldfield Project, partially
offset by DDA of PP&E in the normal course of operations during
the period.
Deferred income tax assets as at
September 30, 2022 were $68.0 million compared to $101.3
million as at December 31, 2021. The decrease was primarily
due to the tax effects of reversal of temporary differences between
accounting and tax bases of the balances related to the Mount
Milligan Mine, including the impact of foreign exchange rate
changes on the temporary differences.
Accounts payable and accrued liabilities as at
September 30, 2022 were $135.6 million compared to $186.8
million at December 31, 2021. The decrease was primarily due
to lower amounts due to Royal Gold under the Mount Milligan
Streaming Arrangement from lower copper prices as well as lower
amount due on the settlement of derivatives from the payments made
in 2022. In addition, there were lower trade payables accrued
expenses due to effect of timing of vendor payments and lower
provision for share-based compensation primarily due to the effect
of the decrease in the Company’s share price.
Income tax payable as at September 30, 2022
was $0.2 million compared to $25.3 million at December 31,
2021. The decrease was primarily due to tax payments made during
the period and the decrease in current income taxes on income from
the Öksüt Mine as a result of the suspension of gold room
operations at the ADR plant.
The other current liabilities as at
September 30, 2022 were $65.5 million compared to $15.3
million at December 31, 2021. The increase was primarily due to
increase in the fair value of derivative liabilities and the
deferred milestone payment of $30.6 million related to the
acquisition of the Goldfield Project, now classified as a current
liability.
Deferred income tax liabilities as at
September 30, 2022 were $40.8 million compared to $54.9
million at December 31, 2021. The decrease was primarily due
to the tax effects of reversal of temporary differences between
accounting and tax bases of the balances related to the Kemess
Project and the Öksüt Mine, including the impact of foreign
exchange rate changes on the temporary differences.
The long-term portion of the provision for
reclamation as at September 30, 2022 was $220.9 million
compared to $331.3 million at December 31, 2021. The decrease
was primarily due to an increase in the risk-free interest rates
applied to discount the estimated future reclamation cash flows,
partially offset by an increase in the underlying future
reclamation cash flows at all of the sites due to a variety of
factors, including higher short-term inflation rates, timing of
reclamation activities and updates to the reclamation closure
plans.
Share capital as at September 30, 2022 was
$893.8 million compared to $984.1 million at December 31,
2021. The decrease was primarily result of the completion of the
Arrangement Agreement and the repurchase and cancellation of all of
Kyrgyzaltyn’s 77,401,766 Centerra common shares in exchange for the
aggregate cash payments of approximately $93.3 million, inclusive
of withholding taxes and certain transaction costs.
Operating Mines and
Facilities
Mount Milligan
Mine
The Mount Milligan Mine is an open-pit mine
located in north central British Columbia, Canada producing a gold
and copper concentrate. Production at the Mount Milligan Mine is
subject to an arrangement with Royal Gold pursuant to which Royal
Gold is entitled to purchase 35% of the gold produced and 18.75% of
the copper production at the Mount Milligan Mine for $435 per ounce
of gold delivered and 15% of the spot price per metric tonne of
copper delivered. To satisfy its obligations under the Mount
Milligan Streaming Arrangement, the Company purchases refined gold
ounces and copper warrants and arranges for delivery to Royal Gold.
The difference between the cost of the purchases of refined gold
ounces and copper warrants and the corresponding amounts payable to
the Company under the Mount Milligan Streaming Arrangement is
recorded as a reduction of revenue and not a cost of operating the
mine.
Mount Milligan Mine Financial and Operating
Results
| |
Three months ended
September 30,
|
|
Nine months ended
September 30,
|
|
($millions, except as noted) |
2022 |
|
|
2021 |
|
|
% Change |
|
2022 |
|
|
2021 |
|
|
% Change |
|
Financial Highlights: |
|
|
|
|
|
|
|
|
|
|
|
|
Gold revenue |
67.7 |
|
|
50.8 |
|
|
33 |
% |
|
181.8 |
|
|
189.0 |
|
|
(4 |
)% |
|
Copper revenue |
49.0 |
|
|
47.1 |
|
|
4 |
% |
|
163.8 |
|
|
166.0 |
|
|
(1 |
)% |
|
Other by-product revenue |
1.5 |
|
|
1.7 |
|
|
(12 |
)% |
|
5.7 |
|
|
8.3 |
|
|
(31 |
)% |
|
Total revenue |
118.2 |
|
|
99.6 |
|
|
19 |
% |
|
351.3 |
|
|
363.3 |
|
|
(3 |
)% |
|
Production costs |
70.7 |
|
|
57.4 |
|
|
23 |
% |
|
199.1 |
|
|
186.8 |
|
|
7 |
% |
|
Depreciation, depletion, and amortization ("DDA") |
13.5 |
|
|
19.5 |
|
|
(31 |
)% |
|
63.5 |
|
|
62.2 |
|
|
2 |
% |
|
Earnings from mine operations |
34.0 |
|
|
22.7 |
|
|
50 |
% |
|
88.7 |
|
|
114.3 |
|
|
(22 |
)% |
|
Earnings from operations(1) |
28.2 |
|
|
19.4 |
|
|
45 |
% |
|
70.3 |
|
|
101.4 |
|
|
(31 |
)% |
|
Cash provided by mine operations |
33.4 |
|
|
43.3 |
|
|
(23 |
)% |
|
135.1 |
|
|
206.6 |
|
|
(35 |
)% |
|
Free cash flow from mine operations(2) |
20.9 |
|
|
25.9 |
|
|
(19 |
)% |
|
84.8 |
|
|
156.5 |
|
|
(46 |
)% |
|
Additions to property, plant and equipment |
6.6 |
|
|
20.8 |
|
|
(68 |
)% |
|
34.6 |
|
|
54.8 |
|
|
(37 |
)% |
|
Capital expenditures - total(2) |
10.4 |
|
|
16.4 |
|
|
(37 |
)% |
|
44.7 |
|
|
48.4 |
|
|
(8 |
)% |
|
Sustaining capital expenditures(2) |
10.4 |
|
|
15.5 |
|
|
(33 |
)% |
|
43.2 |
|
|
46.5 |
|
|
(7 |
)% |
|
Non-sustaining capital expenditures(2) |
— |
|
|
0.9 |
|
|
(100 |
)% |
|
1.5 |
|
|
1.9 |
|
|
(21 |
)% |
|
Operating Highlights: |
|
|
|
|
|
|
|
|
|
|
|
|
|
|
Tonnes mined (000s) |
11,924 |
|
|
11,131 |
|
|
7 |
% |
|
34,177 |
|
|
33,436 |
|
|
2 |
% |
|
Tonnes ore mined (000s) |
5,294 |
|
|
4,644 |
|
|
14 |
% |
|
14,842 |
|
|
14,769 |
|
|
0 |
% |
|
Tonnes processed (000s) |
5,538 |
|
|
5,053 |
|
|
10 |
% |
|
15,844 |
|
|
15,452 |
|
|
3 |
% |
|
Process plant head grade gold (g/t) |
0.47 |
|
|
0.38 |
|
|
24 |
% |
|
0.41 |
|
|
0.43 |
|
|
(5 |
)% |
|
Process plant head grade copper (%) |
0.20 |
% |
|
0.21 |
% |
|
(5 |
)% |
|
0.21 |
% |
|
0.22 |
% |
|
(5 |
)% |
|
Gold recovery (%) |
66.2 |
% |
|
65.5 |
% |
|
1 |
% |
|
67.5 |
% |
|
65.8 |
% |
|
3 |
% |
|
Copper recovery (%) |
82.4 |
% |
|
80.2 |
% |
|
3 |
% |
|
82.6 |
% |
|
79.4 |
% |
|
4 |
% |
|
Concentrate produced (dmt) |
39,749 |
|
|
39,546 |
|
|
1 |
% |
|
123,696 |
|
|
125,089 |
|
|
(1 |
)% |
|
Gold produced (oz) (3) |
54,134 |
|
|
39,658 |
|
|
37 |
% |
|
135,955 |
|
|
136,909 |
|
|
(1 |
)% |
|
Gold sold (oz)(3) |
56,245 |
|
|
38,517 |
|
|
46 |
% |
|
138,046 |
|
|
144,461 |
|
|
(4 |
)% |
|
Average realized gold price - combined ($/oz)(3)(4) |
1,204 |
|
|
1,317 |
|
|
(9 |
)% |
|
1,317 |
|
|
1,308 |
|
|
1 |
% |
|
Copper produced (000s lbs)(3) |
19,045 |
|
|
17,861 |
|
|
7 |
% |
|
56,955 |
|
|
56,282 |
|
|
1 |
% |
|
Copper sold (000s lbs)(3) |
19,647 |
|
|
18,512 |
|
|
6 |
% |
|
58,019 |
|
|
60,833 |
|
|
(5 |
)% |
|
Average realized copper price - combined
($/lb)(3)(4) |
2.49 |
|
|
2.55 |
|
|
(2 |
)% |
|
2.82 |
|
|
2.73 |
|
|
3 |
% |
|
Unit Costs: |
|
|
|
|
|
|
|
|
|
|
|
|
|
|
Gold production costs ($/oz) |
729 |
|
|
774 |
|
|
(6 |
)% |
|
759 |
|
|
689 |
|
|
10 |
% |
|
All-in sustaining costs on a by-product basis
($/oz)(2) |
615 |
|
|
727 |
|
|
(15 |
)% |
|
629 |
|
|
504 |
|
|
25 |
% |
|
All-in costs on a by-product basis ($/oz)(2)(5) |
679 |
|
|
781 |
|
|
(13 |
)% |
|
713 |
|
|
549 |
|
|
30 |
% |
|
Gold - All-in sustaining costs on a co-product basis
($/oz)(2) |
865 |
|
|
1,014 |
|
|
(15 |
)% |
|
958 |
|
|
883 |
|
|
8 |
% |
|
Copper production costs ($/lb) |
1.51 |
|
|
1.50 |
|
|
1 |
% |
|
1.63 |
|
|
1.44 |
|
|
13 |
% |
|
Copper - All-in sustaining costs on a co-product basis
($/lb)(2) |
1.78 |
|
|
1.95 |
|
|
(9 |
)% |
|
2.04 |
|
|
1.21 |
|
|
69 |
% |
(1) Includes
exploration costs and marketing and selling costs.
(2) Non-GAAP financial measure.
See discussion under “Non-GAAP and Other Financial
Measures”.
(3) Mount Milligan production and
sales are presented on a 100%-basis. Under the Mount Milligan
Streaming Arrangement, Royal Gold is entitled to 35% of gold ounces
sold and 18.75% of copper sold. Royal Gold pays $435 per ounce of
gold delivered and 15% of the spot price per metric tonne of copper
delivered.
(4) This supplementary financial
measure within the meaning of 52-112 is calculated as a ratio of
revenue from the consolidated financial statements and units of
metal sold includes the impact from the Mount Milligan Streaming
Arrangement, copper hedges and mark-to-market adjustments on metal
sold that had not yet settled under contract.
(5) Includes the impact from the
Mount Milligan Streaming Arrangement and the impact of copper
hedges.
Third
Quarter 2022
compared to
Third Quarter
2021
Earnings from mine operations of $34.0 million
were recognized in the third quarter of 2022 compared to $22.7
million in the third quarter of 2021. The increase was primarily
due to higher copper pounds sold, higher gold ounces sold and lower
DDA primarily attributable to the increase in proven and probable
reserves as a result of a life-of-mine update in 2022. Partially
offsetting the increase in earnings from mine operations were lower
average realized gold prices and higher production costs.
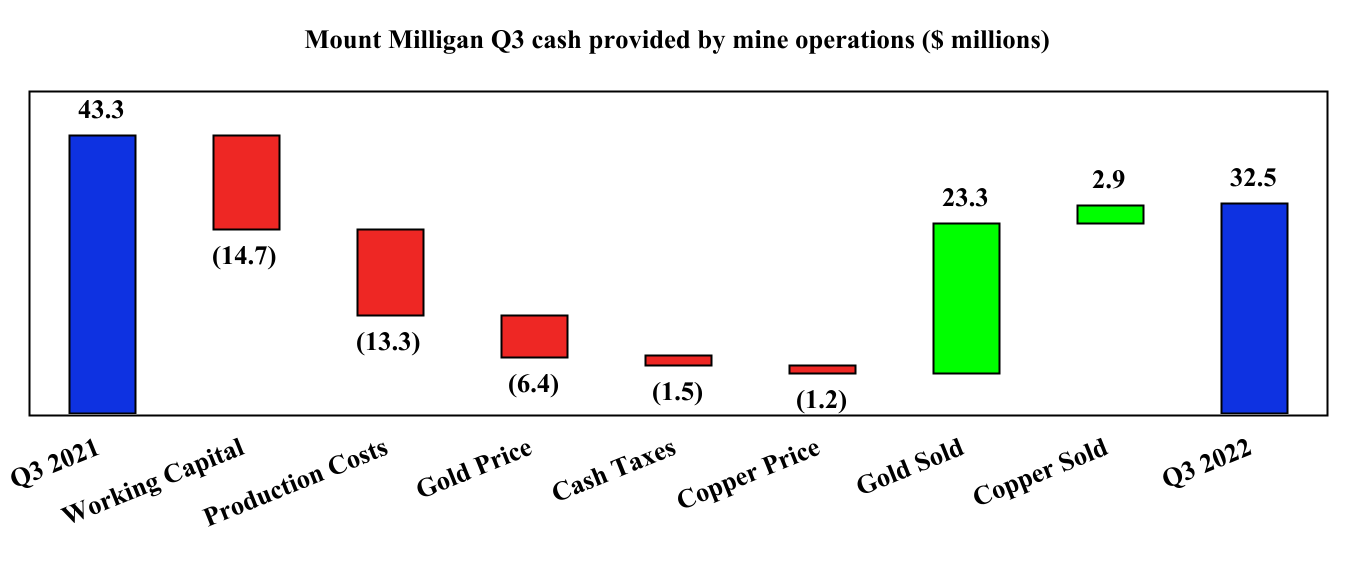
Cash provided by mine operations of $33.4
million was recognized in the third quarter of 2022 compared to
$43.3 million in the third quarter of 2021. The decrease was
primarily due to higher production costs, an unfavourable working
capital change and lower average realized gold prices, partially
offset by higher gold ounces sold. The unfavourable working capital
change in the third quarter of 2022 as compared to the third
quarter of 2021 was primarily due to the effect of timing of cash
collection on concentrate shipments and timing of vendor
payments.
Free cash flowNG from mine operations
of $20.9 million was recognized in the third quarter of 2022
compared to $25.9 million in the third quarter of 2021 primarily
due to a decrease in cash provided by mine operations, partially
offset by lower sustaining capital expendituresNG.
During the third quarter of 2022, mining
activities were carried out in phases 4, 7, and 9 of the open pit.
Total tonnes mined were 11.9 million tonnes in the third quarter of
2022 and 11.1 million in the third quarter of 2021. The increased
tonnage was primarily due to an increase in truck hours, partially
offset by changes in haulage cycles.
Total process plant throughput for the third
quarter of 2022 was 5.5 million tonnes, averaging 60,195 tonnes per
calendar day, compared to 5.1 million tonnes, averaging 54,928
tonnes per calendar day in the third quarter of 2021. The increase
in throughput in the third quarter of 2022 was primarily due to
higher SAG mill runtime compared to the third quarter of 2021,
which had a longer scheduled shutdown for the SAG mill
relining.
Gold production was 54,134 ounces in the third
quarter of 2022 compared to 39,658 ounces in the third quarter of
2021 due to higher gold head grades, higher mill throughput and
higher recoveries. During the third quarter of 2022, the average
gold grades and recoveries were 0.47 g/t and 66.2% compared to 0.38
g/t and 65.5% in the third quarter of 2021. Total copper production
was 19.0 million pounds in the third quarter of 2022 compared to
17.9 million pounds in the third quarter of 2021. The increase was
primarily due to higher mill throughput and higher recoveries,
partially offset by lower copper grades. During the third quarter
of 2022, the average copper grade and recoveries were 0.20% and
82.4% compared to 0.21% and 80.2% in the third quarter of 2021. The
Staged Flotation Reactors circuit has been operating since
beginning of May and optimization continues. Initial results
indicate elevated recoveries. Circuit optimization and closure of
commissioning deficiencies is ongoing and expected to last through
the fourth quarter of 2022.
Gold production costs were $729 per ounce in the
third quarter of 2022 compared to $774 per ounce in third quarter
of 2021. The decrease was primarily due to higher gold ounces sold,
partially offset by the higher production costs. Higher production
costs were mainly due to higher mining, processing and
administrative expenses due to the impact of rising inflation in
Canada and onset of price pressure on input costs, including diesel
fuel, grinding media, liners, and equipment rebuilds, partially
offset by the weakening of the Canadian dollar relative to the US
dollar between the periods. Mining costs were impacted by higher
diesel prices and higher consumption of diesel in the period,
partially offset by the effect of the Company’s hedging program.
Processing costs were higher primarily due to higher consumption
and cost of liners, major equipment rebuilds, increased grinding
media costs as well as higher contractor costs associated with the
planned mill shutdown. Higher administrative costs were due to an
increase in insurance costs and higher consulting costs related to
various information technology and environmental projects.
Copper production costs were $1.51 per pound in
the third quarter of 2022 similar to the $1.50 per pound in the
third quarter of 2021. The increase was primarily due to higher
production costs as outlined above, partially offset by higher
copper pounds sold and and lower allocation of production costs to
copper from changes in the relative market prices of gold and
copper.
Mount Milligan Q3 All-in sustaining costs
on a by-product basis per
ounceNG
($/oz)
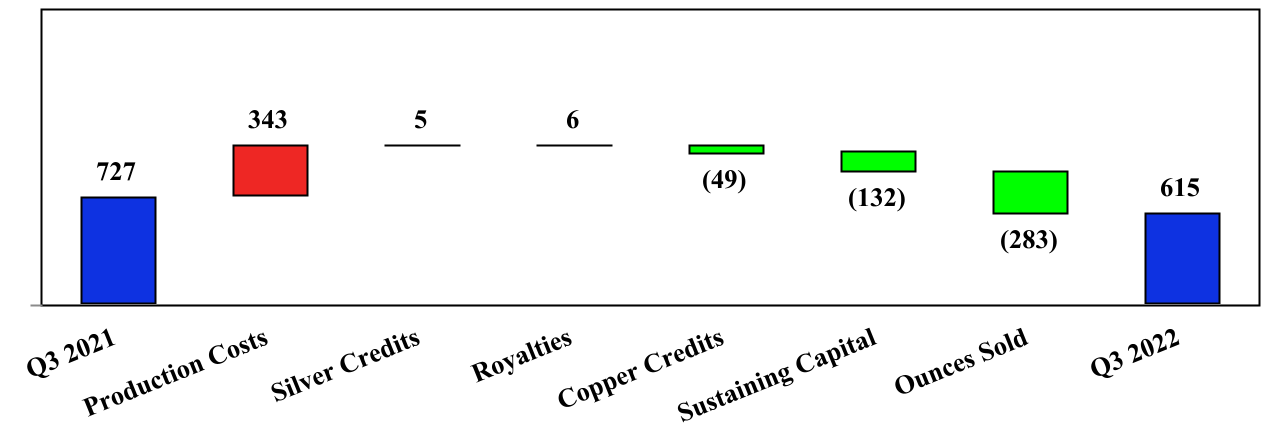
All-in sustaining costs on a by-product
basisNG were $615 per ounce in the third quarter of 2022
compared to $727 per ounce in the third quarter of 2021. The
decrease was primarily due to higher gold ounces sold, higher
copper credits as a result of higher copper pounds sold and lower
sustaining capital expendituresNG, partially offset by
higher production costs.
All-in costs on a by-product basisNG
were $679 per ounce in the third quarter of 2022 compared to $781
per ounce in the third quarter of 2021. The decrease was due to
lower all-in-sustaining costs on a by-product basisNG as
noted above, partially offset by an increase in exploration
expenses.
Nine
months ended
September 30, 2022
compared to
2021
Earnings from mine operations of $88.7 million
were recognized in 2022 compared to $114.3 million in 2021. The
decrease was primarily due to lower gold ounces sold and higher
production costs.
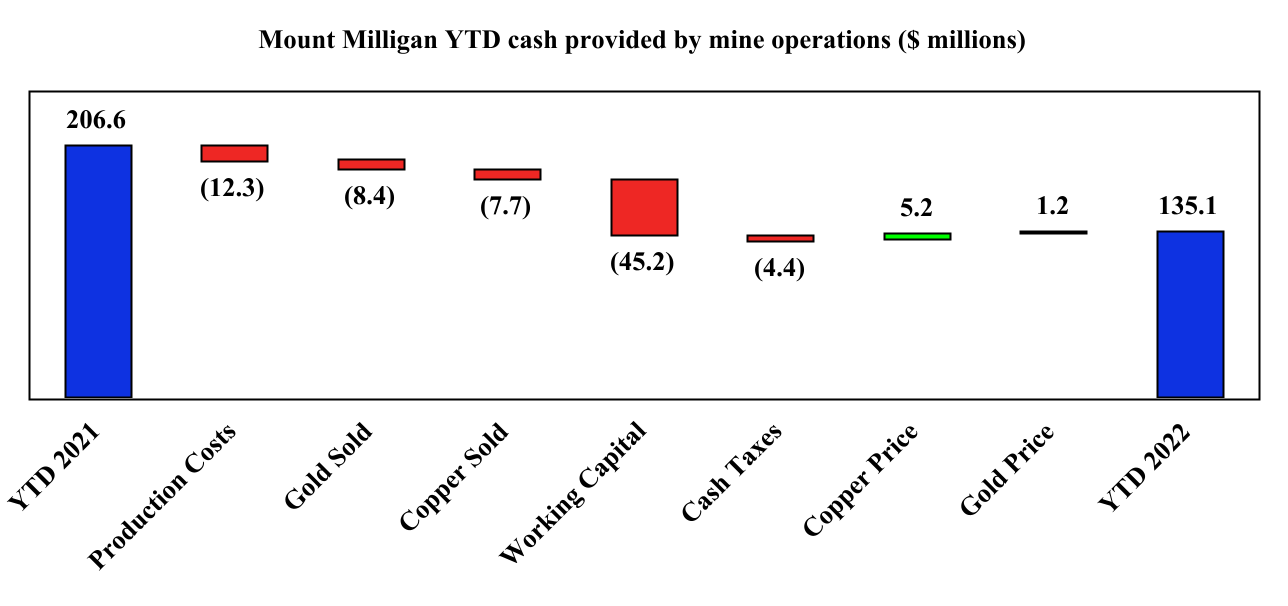
Cash provided by mine operations of $135.1
million was recognized in 2022 compared to $206.6 million in 2021.
The decrease was primarily due to a decrease in gold ounces sold,
higher production costs and an unfavourable change in working
capital from the effect of timing of vendor and other payments,
partially offset by the effect of timing of cash collection on
concentrate sales.
Free cash flowNG from mine operations
of $84.8 million was recognized in 2022 compared to $156.5 million
in 2021. The decrease was primarily due to lower cash provided by
mine operations.
During the nine months of 2022, mining
activities were carried out in Phases 4, 7, 8 and 9 of the open
pit. Total tonnes mined were 34.2 million tonnes in 2022 compared
to 33.4 million tonnes mined in 2021. The increased tonnage was
primarily due to an increase in truck hours, partially offset by
changes in haulage cycles.
The process plant throughput was 15.8 million
tonnes, averaging 58,036 tonnes per calendar day, compared to 15.5
million tonnes in 2021, averaging 56,600 tonnes per calendar day.
The increase in throughput was primarily due to higher mill runtime
as a result of lower number of shutdown executed in 2022 compared
to 2021.
Gold production was 135,955 ounces in 2022
compared to 136,909 ounces in 2021. The decrease was due to lower
gold grades, partially offset by higher recoveries and higher
throughput as a result of higher mill runtime. During 2022, the
average gold grade was 0.41 g/t and recoveries were 67.5% compared
to 0.43 g/t and 65.8% in 2021. Total copper production was 57.0
million pounds in 2022 compared to 56.3 million pounds in 2021. The
increase was primarily due to higher throughput a result of higher
mill runtime and higher recoveries, partially offset by lower
copper grades.
Gold production costs were $759 per ounce in
2022 compared to $689 per ounce in 2021. The increase was primarily
due to a decrease in gold ounces sold and higher production costs.
Higher production costs were mainly driven by higher mining,
processing and administrative expenses due to the impact of rising
inflation in Canada and onset of price pressure on input costs,
including diesel fuel, grinding media, liners, and equipment spare
parts, partially offset by the weakening of the Canadian dollar
relative to the US dollar between the periods. Mining costs were
impacted by higher diesel prices and higher consumption of diesel
in the period, partially offset by the effects of the Company’s
hedging program. Processing costs were higher primarily due to
higher liner, electricity and contractor costs. Administrative
costs were higher primarily due to an increase in salaries and
wages, an increase in recruiting and insurance costs and higher
consulting costs related to various information technology and
environment projects.
Copper production costs were $1.63 per pound in
2022 compared to $1.44 per pound in 2021, primarily as a result of
a decrease in copper pounds sold and higher production costs as
noted above.
Mount Milligan YTD All-in sustaining
costs on a by-product basis per
ounceNG
($/oz)
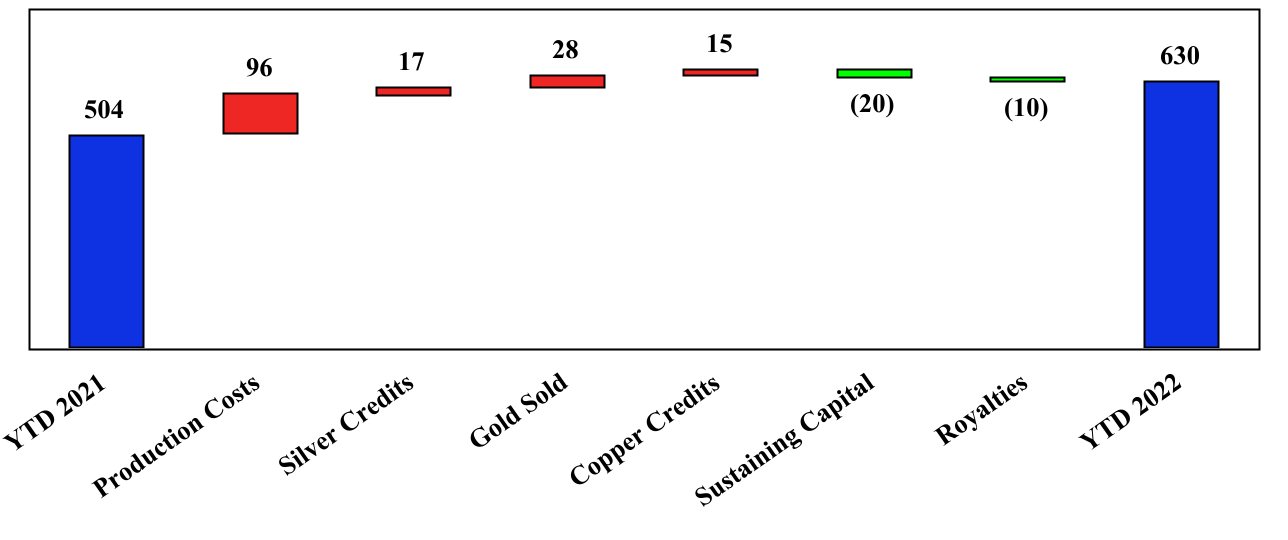
All-in sustaining costs on a by-product
basisNG were $629 per ounce for 2022 compared to $504
per ounce in 2021. The increase was primarily due to lower gold
ounces sold and higher production costs as noted above.
All-in costs on a by-product basisNG
were $713 per ounce in 2022 compared to $549 per ounce in 2021. The
increase was due to higher all-in sustaining costs on a by-product
basisNG and higher exploration expenses.
Öksüt Mine
The Öksüt Mine is located in Türkiye
approximately 300 kilometres southeast of Ankara and 48 kilometres
south of Kayseri, the provincial capital. The nearest
administrative centre is at Develi, located approximately 10
kilometres north of the mine site. The Öksüt Mine achieved
commercial production on May 31, 2020.
As outlined in the Recent Events and
Developments section in this MD&A above, the Öksüt Mine
suspended gold doré bar production at the Öksüt Mine in early March
2022 due to mercury having been detected in the gold room at the
ADR plant and subsequently suspended leaching operations in August
2022. Processing of material into stored gold-in-carbon inventory
also ceased during the third quarter. Due to the suspension of
leaching and the continued suspension of gold room operations
during the third quarter of 2022, some of the results for the three
and nine months ended of 2022 might not be directly comparable to
the corresponding prior periods.
Öksüt Mine Financial and Operating
Results
| |
Three months ended
September 30,
|
|
Nine months ended
September 30,
|
|
($millions, except as noted) |
2022 |
|
|
2021 |
|
|
% Change |
|
|
2022 |
|
|
2021 |
|
|
% Change |
|
|
Financial Highlights: |
|
|
|
|
|
|
|
|
|
|
|
|
|
|
|
|
Revenue |
— |
|
|
66.0 |
|
|
(100 |
)% |
|
101.6 |
|
|
142.5 |
|
|
(29 |
)% |
|
Production costs |
— |
|
|
17.9 |
|
|
(100 |
)% |
|
21.1 |
|
|
40.7 |
|
|
(48 |
)% |
|
Depreciation, depletion, and amortization ("DDA") |
— |
|
|
9.3 |
|
|
(100 |
)% |
|
12.6 |
|
|
22.4 |
|
|
(44 |
)% |
|
Earnings from mine operations |
— |
|
|
38.8 |
|
|
(100 |
)% |
|
67.9 |
|
|
79.4 |
|
|
(14 |
)% |
|
(Loss) earnings from operations(1) |
(1.3 |
) |
|
37.4 |
|
|
(103 |
)% |
|
64.7 |
|
|
77.2 |
|
|
(16 |
)% |
|
Cash (used in) provided by mine operations |
(18.0 |
) |
|
52.1 |
|
|
(135 |
)% |
|
(5.6 |
) |
|
92.2 |
|
|
(106 |
)% |
|
Free cash flow (deficit) from mine operations(2) |
(23.0 |
) |
|
48.9 |
|
|
(147 |
)% |
|
(17.0 |
) |
|
76.3 |
|
|
(122 |
)% |
|
Additions to property, plant and equipment |
4.0 |
|
|
3.4 |
|
|
19 |
% |
|
9.1 |
|
|
15.6 |
|
|
(42 |
)% |
|
Capital expenditures - total(2) |
5.0 |
|
|
3.1 |
|
|
61 |
% |
|
11.4 |
|
|
15.3 |
|
|
(25 |
)% |
|
Sustaining capital expenditures(2) |
5.0 |
|
|
3.0 |
|
|
67 |
% |
|
11.4 |
|
|
14.7 |
|
|
(22 |
)% |
|
Non-sustaining capital expenditures(2) |
— |
|
|
0.1 |
|
|
(100 |
)% |
|
— |
|
|
0.6 |
|
|
(100 |
)% |
|
Operating Highlights: |
|
|
|
|
|
|
|
|
|
|
|
|
|
|
|
|
Tonnes mined (000s) |
2,181 |
|
|
4,066 |
|
|
(46 |
)% |
|
8,164 |
|
|
11,432 |
|
|
(29 |
)% |
|
Tonnes ore mined (000s) |
1,779 |
|
|
1,480 |
|
|
20 |
% |
|
5,740 |
|
|
2,942 |
|
|
95 |
% |
|
Ore mined - grade (g/t) |
1.99 |
|
|
1.63 |
|
|
22 |
% |
|
1.88 |
|
|
1.23 |
|
|
53 |
% |
|
Ore crushed (000s) |
972 |
|
|
1,417 |
|
|
(31 |
)% |
|
2,929 |
|
|
2,901 |
|
|
1 |
% |
|
Tonnes of ore stacked (000s) |
1,015 |
|
|
1,421 |
|
|
(29 |
)% |
|
3,024 |
|
|
2,905 |
|
|
4 |
% |
|
Heap leach grade (g/t) |
1.96 |
|
|
1.63 |
|
|
20 |
% |
|
1.82 |
|
|
1.21 |
|
|
50 |
% |
|
Heap leach contained ounces stacked |
63,834 |
|
|
74,220 |
|
|
(14 |
)% |
|
176,805 |
|
|
113,047 |
|
|
56 |
% |
|
Gold produced (oz) |
— |
|
|
37,255 |
|
|
(100 |
)% |
|
54,691 |
|
|
80,035 |
|
|
(32 |
)% |
|
Additions to stored gold-in-carbon inventory
(Koz)(4) |
40-45 |
|
— |
|
|
100 |
% |
|
100-105 |
|
— |
|
|
100 |
% |
|
Gold sold (oz) |
— |
|
|
37,204 |
|
|
(100 |
)% |
|
54,704 |
|
|
79,984 |
|
|
(32 |
)% |
|
Average realized gold price ($/oz)(3) |
— |
|
|
1,774 |
|
|
(100 |
)% |
|
1,857 |
|
|
1,782 |
|
|
4 |
% |
|
Unit Costs: |
|
|
|
|
|
|
|
|
|
|
|
|
|
|
|
|
Gold production costs ($/oz) |
n/a |
|
481 |
|
|
0 |
% |
|
386 |
|
|
509 |
|
|
(24 |
)% |
|
All-in sustaining costs on a by-product basis
($/oz)(2) |
n/a |
|
603 |
|
|
0 |
% |
|
680 |
|
|
736 |
|
|
(8 |
)% |
|
All-in costs on a by-product basis ($/oz)(2) |
n/a |
|
644 |
|
|
0 |
% |
|
732 |
|
|
770 |
|
|
(5 |
)% |
(1) Includes
exploration costs.
(2) Non-GAAP financial measure.
See discussion under “Non-GAAP and Other Financial
Measures”.
(3) This supplementary financial
measure, within the meaning of 52-112, is calculated as a ratio of
revenue from the consolidated financial statements and units of
metal sold.
(4) Represents a subset of the
recoverable ounces in the ADR inventory as at September 30,
2022.
Third
Quarter 2022
compared to
Third Quarter
2021
No earnings from mine operations were reported
in the third quarter of 2022 as a result of no ounces of gold sold
due to the suspension of gold room operations at the ADR plant.
Earnings from mine operations were $38.8 million in the third
quarter of 2021.
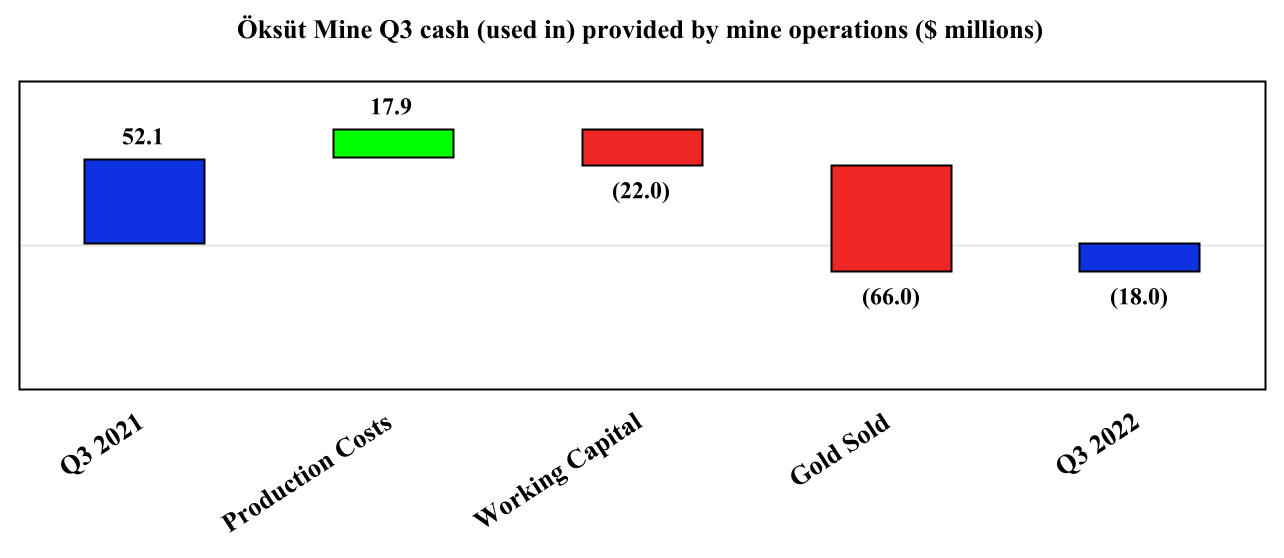
Cash used in mine operations of $18.0 million
was recognized in the third quarter of 2022, compared to cash
provided by mine operations of $52.1 million in the third quarter
of 2021. The decrease was primarily due to no ounces of gold sold
and unfavourable working capital change, partially offset by lower
production costs. The unfavourable change in working capital was
primarily due to build up of stored gold-in-carbon inventory,
partially offset by collection of VAT refund.
Free cash flow deficit from mine
operationsNG of $23.0 million was recognized in the
third quarter of 2022, compared to the free cash flow from mining
operationsNG of $48.9 million in the third quarter of
2021. The decrease was primarily due to a decrease in cash provided
by mine operations due to the continued suspension of gold pouring
leading to no ounces of gold being sold during the quarter.
Mining activities in the third quarter of 2022
were carried out in phase 4 of the Keltepe pit and in phase 2 of
the Güneytepe pit. Total tonnes mined were 2.2 million tonnes in
the third quarter of 2022 compared to 4.1 million tonnes in the
third quarter of 2021. The decrease in tonnes mined was primarily
due to not receiving a pasture land permit that would otherwise
have allowed the Company to expand the footprint of the current
pits and increase the amount of waste available to be mined.
Processing activities in the third quarter of
2022 were focused on the preparation and stacking of the heap leach
pad. In the third quarter of 2022 the Öksüt Mine stacked 1.0
million tonnes at an average grade of 1.96 g/t, containing 63,834
ounces of gold, compared to 1.4 million tonnes stacked at an
average grade of 1.63 g/t, containing 74,220 ounces of gold in the
third quarter of 2021. The decrease in contained ounces stacked in
the third quarter of 2022 was primarily due to current EIA crusher
limits.
No gold production was reported in the third
quarter of 2022 due to the suspension of gold room operations at
the ADR plant. Gold production in the third quarter of 2021 was
37,255 ounces. No gold production costs were reported in the third
quarter of 2022 due to no ounces of gold sold. Gold production
costs per ounce were $481 in the third quarter of 2021.
During third quarter of 2022, mining,
stockpiling, crushing and stacking continued at the site throughout
the quarter and leaching continued until August 2022. Gold material
inventory was being accumulated in carbon and stored in bags
onsite. As at September 30, 2022, there was a balance of
recoverable ounces of approximately 100,000 in the stored
gold-in-carbon inventory as compared to nil as at December 31,
2021. These stored gold-in-carbon recoverable ounces represent
additional ounces to 54,691 ounces produced as gold doré prior to
the suspension of gold room operations at the ADR plant.
As at September 30, 2022, the weighted
average cost in inventory per recoverable ounce, which excludes the
royalty costs, was $438 as compared to $500 as at December 31,
2021. The weighted average cost in inventory per recoverable ounce
includes an attributable portion of mining costs and an
attributable portion of DDA capitalized to production
inventory.
|
ADR plant inventory |
September 30, 2022 |
December 31, 2021 |
|
Weighted average mining cost in inventory per recoverable
ounce |
$ |
228 |
$ |
251 |
|
Weighted average DDA in inventory per recoverable ounce |
|
210 |
|
249 |
|
Weighted average cost in inventory per recoverable ounce |
$ |
438 |
$ |
500 |
The decrease in the weighted average mining cost
in inventory per recoverable ounce between September 30, 2022
and December 31, 2021 was primarily due to higher ore tonnes mined
and lower production costs from the weakening of the Turkish lira
relative to the US dollar between the periods, partially offset by
the impact of high rate of inflation in Türkiye. The
weighted-average mining cost in inventory per ounce of gold was in
line with the Company’s expected cost profile for the year, and has
not been significantly affected by the suspension of gold room
operations at the ADR plant. In the third quarter of 2022, the
Company did not experience any significant impact on the operation
of the Öksüt Mine from the Russian invasion in Ukraine as no
critical consumables or reagents are sourced directly from Ukraine
or Russia. Certain reagents and consumables may be indirectly
impacted by the Russian invasion in Ukraine in the future, and the
Company continues to monitor for any impact on operations.
All-in sustaining costs on a by-product
basisNG or all-in costs on a by-product
basisNG per ounce were not reported in the third quarter
of 2022 as no ounces of gold were sold. All-in sustaining costs on
a by-product basisNG and all-in costs on a by-product
basisNG in the third quarter of 2021 were $603 and $644
per ounce, respectively.
Nine
months ended
September 30, 2022
compared to
2021
Earnings from mine operations were $67.9 million
in 2022 compared with $79.4 million in 2021. The decrease was
primarily due to a decrease in ounces of gold sold, partially
offset by lower production costs and DDA.
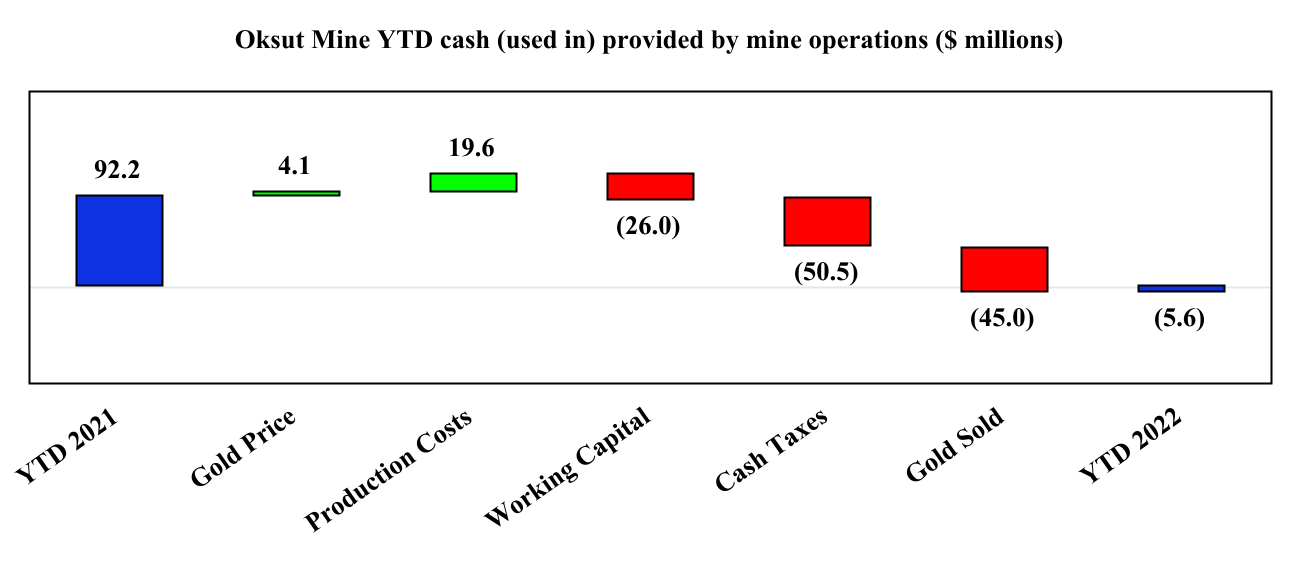
Cash used in mine operations was $5.6 million in
2022 compared with cash provided by mine operations of $92.2
million in 2021. The decrease was primarily due to lower ounces of
gold sold, higher cash taxes paid and an unfavourable working
capital change, partially offset by lower production costs. The
higher cash taxes paid were primarily due to a withholding tax
expense incurred on a dividend distribution and taxation at the
full statutory income tax rate due to full utilization of
investment incentive certificate as of the end of 2021 and the
recognition of taxable gains from the effect of foreign exchange
rate changes on monetary assets and liabilities. The unfavourable
working capital change was primarily due to cash utilized to
build-up stored gold-in-carbon inventory, partially offset by
collection of a VAT refund.
Free cash flow deficitNG from mine
operations was $17.0 million in 2022 compared with the free cash
flowNG of $76.3 million in 2021. The decrease was
primarily due to lower cash provided by mine operations partially
offset by lower sustaining capital expendituresNG mainly
from lower capitalized stripping costs.
Mining activities in 2022 were carried out in
phase 4 of the Keltepe pit and in phase 2 of the Güneytepe pit.
Total tonnes mined were 8.2 million tonnes during the first nine
months of 2022 compared to 11.4 million tonnes in the first nine
months of 2021. The decrease in tonnes mined was primarily due to
not receiving a pasture land permit that would otherwise have
allowed the Company to expand the footprint of the current pits and
increase the amount of waste available to be mined.
Processing activities in 2022 were mostly
focused on the preparation, stacking and irrigation of the heap
leach pad, with 3.0 million tonnes stacked at an average grade of
1.82 g/t containing 176,805 ounces of gold compared with 2.9
million tonnes stacked in 2021 at an average grade of 1.21 g/t
containing 113,047 ounces of gold. The increase in ore tonnes was
primarily due to the lower strip ratio, resulting in a higher
number of tonnes of ore mined and stacked, partially offset by
current EIA crusher limits. The increase in contained ounces
stacked in 2022 was primarily due to ore mined from a portion of
the Keltepe pit with higher grade mineralization.
Gold production was 54,691 ounces in 2022
compared to 80,035 ounces in 2021, primarily due to suspension of
gold room operations at the ADR plant.
Gold production costs were $386 per ounce in
2022 compared with $509 per ounce in 2021. The decrease was
primarily due to lower production costs, including lower royalty
costs, partially offset by lower ounces sold. The decrease in
production costs was primarily due to the weakening of the Turkish
lira relative to the US dollar and capitalization of all mining,
processing and administrative costs incurred in the second and
third quarter of 2022 to production inventory as no gold ounces
were sold. The decrease in production costs was partially offset by
higher mining contractor costs from higher fuel prices and a lower
strip ratio, resulting in a lower portion of mining costs being
capitalized as well as higher processing costs from an increase in
tonnes of ore stacked on the heap leach pads and increase in
hauling costs from higher fuel prices. In 2022, the Company did not
experience significant impact on the operation of the Öksüt Mine
from the Russian invasion in Ukraine as the no critical consumables
or reagents are sourced directly from Ukraine or Russia.
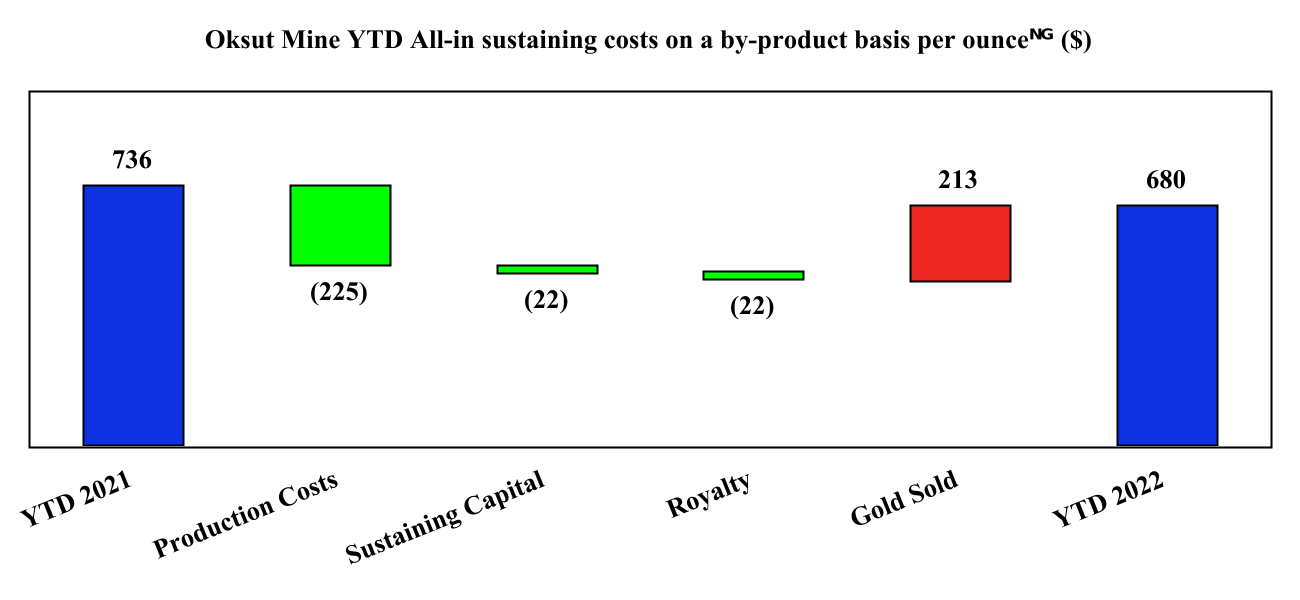
All-in sustaining costs on a by-product
basisNG were $680 per ounce in 2022 compared with $736
per ounce in 2021. The decrease was primarily due to lower
production costs and lower sustaining capital
expendituresNG mainly from lower capitalized stripping
expenditures, partially offset by a decrease in ounces of gold
sold.
All-in costs on a by-product basisNG
were $732 per ounce in 2022 compared with $770 per ounce in 2021.
The decrease was primarily due to lower all-in sustaining costs on
a by-product basisNG.
Molybdenum Business
Unit
The Molybdenum BU includes the Langeloth
Facility in Pennsylvania and two North American molybdenum mines
that are currently on care and maintenance: the Thompson Creek Mine
in Idaho and the 75%-owned Endako Mine in British Columbia.
Molybdenum BU Financial and Operating
Results
|
|
Three months ended
September 30,
|
|
Nine months ended
September 30,
|
|
($millions, except as noted) |
2022 |
|
|
2021 |
|
|
% Change |
|
|
2022 |
|
|
2021 |
|
|
% Change |
|
|
Financial Highlights: |
|
|
|
|
|
|
|
|
|
|
|
|
|
|
Molybdenum revenue |
56.7 |
|
|
51.6 |
|
|
10 |
% |
|
180.5 |
|
|
135.9 |
|
|
33 |
% |
|
Other revenue |
4.1 |
|
|
3.3 |
|
|
24 |
% |
|
8.5 |
|
|
7.3 |
|
|
16 |
% |
|
Total revenue |
60.8 |
|
|
54.9 |
|
|
11 |
% |
|
189.0 |
|
|
143.2 |
|
|
32 |
% |
|
Production costs |
61.2 |
|
|
46.3 |
|
|
32 |
% |
|
196.2 |
|
|
128.2 |
|
|
53 |
% |
|
Depreciation, depletion, and amortization ("DDA") |
1.0 |
|
|
1.7 |
|
|
(41 |
)% |
|
3.9 |
|
|
4.9 |
|
|
(20 |
)% |
|
(Loss) earnings from mine operations |
(1.4 |
) |
|
6.9 |
|
|
(120 |
)% |
|
(11.1 |
) |
|
10.1 |
|
|
(210 |
)% |
|
Care and maintenance costs - Molybdenum mines |
4.8 |
|
|
3.6 |
|
|
33 |
% |
|
12.8 |
|
|
10.3 |
|
|
24 |
% |
|
Reclamation recovery |
(7.7 |
) |
|
(0.9 |
) |
|
756 |
% |
|
(90.6 |
) |
|
(0.9 |
) |
|
9967 |
% |
|
Other operating expenses |
0.6 |
|
|
0.3 |
|
|
100 |
% |
|
1.4 |
|
|
1.7 |
|
|
(18 |
)% |
|
Net earnings (loss) from operations |
1.0 |
|
|
3.9 |
|
|
(74 |
)% |
|
65.3 |
|
|
(1.0 |
) |
|
(6630 |
)% |
|
Cash provided by (used in) operations |
8.0 |
|
|
(13.7 |
) |
|
(158 |
)% |
|
(17.9 |
) |
|
(21.5 |
) |
|
(17 |
)% |
|
Free cash flow (deficit) from operations(1) |
7.2 |
|
|
(14.0 |
) |
|
(151 |
)% |
|
(19.0 |
) |
|
(22.6 |
) |
|
(16 |
)% |
|
Additions to property, plant and equipment |
0.5 |
|
|
0.3 |
|
|
67 |
% |
|
1.0 |
|
|
1.1 |
|
|
(9 |
)% |
|
Total capital expenditures(1) |
0.5 |
|
|
0.3 |
|
|
67 |
% |
|
1.1 |
|
|
1.1 |
|
|
0 |
% |
|
Operating Highlights: |
|
|
|
|
|
|
|
|
|
|
|
|
|
|
Mo purchased (lbs) |
2,528 |
|
|
2,505 |
|
|
1 |
% |
|
8,500 |
|
|
7,709 |
|
|
10 |
% |
|
Mo roasted (lbs) |
4,182 |
|
|
2,456 |
|
|
70 |
% |
|
8,947 |
|
|
7,811 |
|
|
15 |
% |
|
Mo sold (lbs) |
3,291 |
|
|
2,615 |
|
|
26 |
% |
|
9,406 |
|
|
9,100 |
|
|
3 |
% |
|
Average market Mo price ($/lb) |
16.12 |
|
|
19.06 |
|
|
(15 |
)% |
|
17.86 |
|
|
15.02 |
|
|
19 |
% |
(1) Non-GAAP
financial measure. See discussion under “Non-GAAP and Other
Financial Measures”.
Third
Quarter 2022
compared to
Third Quarter
2021
Net earnings from operations of $1.0 million
were recognized in the third quarter of 2022 compared to net
earnings of $3.9 million in the third quarter of 2021. The decrease
in net earnings from operations was mainly from a loss from mine
operations, partially offset by a higher reclamation recovery
primarily due to an increase in the risk-free interest rates
applied to the underlying future reclamation cash flows. The loss
from mine operations was primarily due to lower average realized
molybdenum prices in the quarter and higher average molybdenum
prices paid for product sold and the effect of higher production
costs from the mix of products produced and sold in the period. The
market molybdenum price as at September 30, 2022 was $17.29
per pound.
Cash provided by operations of $8.0 million was
recognized in the third quarter of 2022, compared to cash used in
operations of $13.7 million in the third quarter of 2021. The
increase in cash provided by operations is primarily due to a
favourable working capital movement from the effect of a reduction
in molybdenum inventory. The total working capital balance of the
Molybdenum BU was $121.8 at September 30, 2022 compared to
$136.4 at June 30, 2022.
In 2022, site management developed a streamlined
business plan to eliminate up to $8.0 million in annual operating
costs and reduce working capital balances. The Company realized
some of the benefit of this new strategy during the third quarter
of 2022, with the reduction in molybdenum inventory held on hand
driving a release of working capital and positive cash flows for
the quarter. The Company expects to achieve further reductions in
working capital during the fourth quarter of 2022. The Company
continues to evaluate different strategic options for the
Molybdenum BU.
Free cash flow from operationsNG of
$7.2 million was recognized in the third quarter of 2022, compared
to free cash flow deficit from operationsNG of $14.0
million in the third quarter of 2021. The increase was primarily
due to a decrease in working capital as noted above.
The Langeloth Facility roasted and sold 4.2
million pounds and 3.3 million pounds of molybdenum, respectively,
in the third quarter of 2022, compared to 2.5 million pounds and
2.6 million pounds, respectively in the third quarter of 2021. This
increase in the molybdenum roasted was primarily due to execution
on the business plan to reduce its working capital balance.
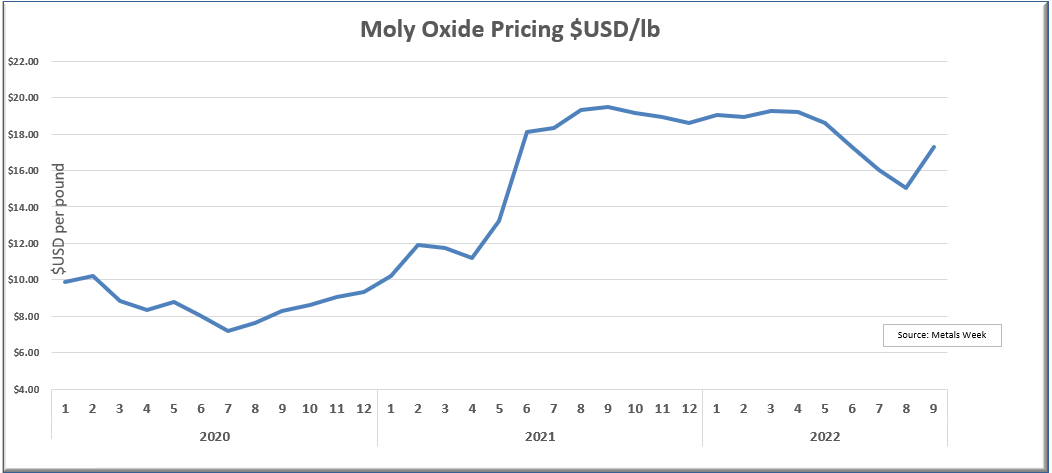
Nine
months ended
September 30, 2022
compared to
2021
Net earnings from operations of $65.3 million
were recognized in 2022 compared to net loss from operations of
$1.0 million in 2021. The increase in net earnings from operations
was mainly from a reclamation recovery primarily due to an increase
in the risk-free interest rates applied to the underlying future
reclamation cash flows, partially offset by an increase in loss
from mine operations. An increase in loss from mine operations was
primarily due to higher average molybdenum prices paid to obtain
product inventory to be processed, higher maintenance costs
associated with an unplanned acid plant shutdown extending for
longer than one month in the first quarter of 2022 and the effect
of higher unit costs from the mix of products produced and sold in
the period.
Cash used in operations was $17.9 million in
2022 compared to cash used in operations of $21.5 million in 2021.
The decrease in cash used in operations was primarily due to higher
pounds of molybdenum sold, higher average molybdenum realized
prices and favourable working capital movement due to
implementation of a revised business plan to reduce inventory. This
was partially offset by higher maintenance costs associated with an
unplanned acid plant shutdown extending for longer than one month
early in 2022.
Free cash flow deficit from
operationsNG of $19.0 million was recognized in 2022
compared to $22.6 million in 2021, primarily due to lower cash used
in operations, as noted above.
The Langeloth Facility roasted and sold 8.9
million pounds and 9.4 million pounds of molybdenum, respectively,
in 2022 compared to 7.8 million pounds and 9.1 million pounds,
respectively, in 2021. The increase in the molybdenum roasted was
primarily due to availability of concentrates. The increase in the
molybdenum sold was primarily due to increase in the pounds of
molybdenum roasted to make up for an unplanned acid plant shutdown
in the first quarter of 2022 that impacted the Facility’s ability
to roast purchased molybdenum.
Discontinued Operations
Kumtor Mine
As a result of the loss of control, the Kumtor
Mine was reclassified as a discontinued operation in the second
quarter of 2021. Consequently, the Company is presenting no
financial and operating results pertaining to the first nine months
of 2022.
Kumtor Mine Financial and Operating
Results
|
($millions, except as noted) |
|
Three months ended
September 30, |
|
Nine months ended
September 30, |
|
|
|
2022 |
|
2021 |
|
2022 |
|
2021 |
|
|
Financial Highlights: |
|
|
|
|
|
|
|
|
|
Revenue |
|
— |
|
— |
|
— |
|
264.1 |
|
|
Production costs |
|
— |
|
— |
|
— |
|
72.6 |
|
|
Depreciation, depletion and amortization |
|
— |
|
— |
|
— |
|
57.9 |
|
|
Earnings from mine operations |
|
— |
|
— |
|
— |
|
133.6 |
|
|
Loss on the change of control of the Kumtor Mine |
|
— |
|
— |
|
— |
|
(926.4) |
|
|
Net earnings from discontinued operations |
|
— |
|
— |
|
— |
|
(828.7) |
|
|
Cash provided by operating activities from discontinued
operations |
|
— |
|
— |
|
— |
|
143.9 |
|
|
Cash used in investing activities from discontinued operations |
|
— |
|
— |
|
— |
|
96.1 |
|
|
Net cash flow from discontinued operations |
|
— |
|
— |
|
— |
|
47.8 |
|
|
Free cash flow from discontinued operations(1) |
|
— |
|
— |
|
— |
|
53.7 |
|
|
Operating Highlights: |
|
|
|
|
|
|
|
|
|
Tonnes mined (000s) |
|
— |
|
— |
|
— |
|
74,261 |
|
|
Tonnes ore mined (000s) |
|
— |
|
— |
|
— |
|
1,298 |
|
|
Tonnes processed (000s) |
|
— |
|
— |
|
— |
|
2,343 |
|
|
Process plant head grade (g/t) |
|
— |
|
— |
|
— |
|
2.52 |
|
|
Gold recovery (%)(2) |
|
— |
|
— |
|
— |
|
71.5% |
|
|
Gold produced (oz) |
|
— |
|
— |
|
— |
|
139,830 |
|
|
Gold sold (oz) |
|
— |
|
— |
|
— |
|
147,800 |
|
|
Unit Costs: |
|
|
|
|
|
|
|
|
|
Gold production costs ($/oz) |
|
— |
|
— |
|
— |
|
491 |
|
|
All-in sustaining costs on a by-product basis
($/oz)(1) |
|
— |
|
— |
|
— |
|
929 |
|
|
All-in costs on a by-product basis ($/oz)(1) |
|
— |
|
— |
|
— |
|
1,414 |
|
(1) Non-GAAP
measure. See discussion under “Non-GAAP and Other Financial
Measures”.
(2) Metallurgical recoveries are
based on recovered gold, not produced gold.
Sale of Interest in Greenstone
Partnership
On January 19, 2021, the Company completed the
sale of its 50% interest in the Greenstone Partnership with final
cash consideration received of $210.0 million, net of adjustments,
and recognized an initial gain on sale of $72.3 million (excluding
any contingent consideration). Pursuant to an agreement dated
December 15, 2020, with Orion Resource Partners (USA) LP and
Premier Gold Mines Limited, the Company was entitled to receive
further contingent consideration, payable no later than 24 months
after the construction decision on the Greenstone project and upon
the project achieving certain production milestones.
In the fourth quarter of 2021, the Greenstone
project was approved for construction and thus the initial
contingency payment of $25.0 million became receivable and owing
from Orion, payable no later than December 2023. As a result, the
Company recognized an additional gain on the sales of its interest
in the Greenstone Partnership of $25.0 million in the fourth
quarter of 2021.
The remaining contingent payments are payable no
later than 30 days following the date on which a cumulative
production milestone of (i) 250,000 ounces; (ii) 500,000 ounces;
and, (iii) 750,000 ounces have been achieved. The amounts are
payable in US dollars, equal to the product of 11,111 and the
20-day average gold market price on the business day immediately
prior to the date of the payment. The Company did not attribute any
value to these contingent payments as of September 30, 2022
due to significant uncertainty associated with the Greenstone
project.
Quarterly Results – Previous Eight
Quarters
As a result of the loss of control of the Kumtor
Mine, the Company deconsolidated the results of the Kumtor Mine and
presented its financial results as a discontinued operation,
separate from the Company’s consolidated financial results.
Accordingly, the quarterly results presented below were updated
retrospectively to reflect the impact of discontinued operations
accounting.
|
$millions, except per share data |
2022 |
2021 |
2020
|
|
quarterly data unaudited |
Q3 |
Q2 |
Q1
|
Q4
|
Q3
|
Q2 |
Q1 |
|
Q4
|
|
Revenue |
179 |
|
168 |
|
295 |
|
251 |
|
221 |
|
202 |
|
226 |
|
212 |
|
|
Net (loss) earnings from continuing operations(1) |
(34 |
) |
(3 |
) |
89 |
|
275 |
|
28 |
|
33 |
|
111 |
|
31 |
|
|
Basic (loss) earnings per share - continuing operations |
(0.14 |
) |
(0.01 |
) |
0.30 |
|
0.93 |
|
0.09 |
|
0.11 |
|
0.37 |
|
0.10 |
|
|
Diluted (loss) earnings per share - continuing operations |
(0.15 |
) |
(0.01 |
) |
0.30 |
|
0.92 |
|
0.09 |
|
0.10 |
|
0.36 |
|
0.10 |
|
|
Net (loss) earnings(2) |
(34 |
) |
(3 |
) |
89 |
|
275 |
|
28 |
|
(852 |
) |
167 |
|
95 |
|
|
Basic (loss) earnings per share(2) |
(0.14 |
) |
(0.01 |
) |
0.30 |
|
0.93 |
|
0.09 |
|
(2.87 |
) |
0.57 |
|
0.32 |
|
|
Diluted (loss) earnings per share(2) |
(0.15 |
) |
(0.01 |
) |
0.30 |
|
0.92 |
|
0.09 |
|
(2.87 |
) |
0.55 |
|
0.32 |
|
(1) Net
earnings from continuing operations in Q4 2021 reflects the impact
of impairment reversal at the Mount Milligan Mine.
(2) Net loss in Q2 2021 reflects
the impact of derecognition of the Kumtor Mine.
Related Party Transactions
Kyrgyzaltyn
The breakdown of sales transactions in the
normal course of business with Kyrgyzaltyn, prior to the loss of
control event in respect of the Kumtor Mine, is as follows:
|
|
Three months ended
September 30, |
|
Nine months ended
September 30, |
|
|
|
2022 |
|
|
|
2021 |
|
|
|
2022 |
|
|
|
2021 |
|
|
Gross gold and silver sales to Kyrgyzaltyn |
$ |
— |
|
|
$ |
— |
|
|
$ |
— |
|
|
$ |
265,407 |
|
|
Deduct: refinery and financing charges |
|
— |
|
|
|
— |
|
|
|
— |
|
|
|
(1,248 |
) |
|
Net revenue received from
Kyrgyzaltyn(1) |
$ |
— |
|
|
$ |
— |
|
|
$ |
— |
|
|
$ |
264,159 |
|
(1) Presented
in results from discontinued operations.
On July 29, 2022, the Company announced the
closing of the Arrangement Agreement. As a result of the completion
of the Arrangement Agreement, the Company repurchased and cancelled
all of Kyrgyzaltyn’s 77,401,766 Centerra common shares in exchange
for the aggregate cash payments of approximately $93.3 million,
including a portion of which was withheld on account of Canadian
withholding taxes payable by Kyrgyzaltyn and $7.0 million paid in
direct and incremental transaction costs to effect the
Transaction.
Sojitz Corporation
The Endako Mine is operated as a joint operation
between the Company, holding a 75% interest, and Sojitz Corporation
(“Sojitz”), a Japanese company, holding a 25% interest. The
Langeloth Facility which is part of the Molybdenum BU segment sells
refined molybdenum concentrate product to Sojitz.
The breakdown of the Company’s transactions in
the normal course of business with Sojitz is as follows:
|
|
Three months ended
September 30, |
|
Nine months ended
September 30, |
|
|
|
2022 |
|
|
|
2021 |
|
|
|
2022 |
|
|
|
2021 |
|
|
Sales to Sojitz |
$ |
1,761 |
|
|
$ |
3,757 |
|
|
$ |
11,361 |
|
|
$ |
15,256 |
|
|
Deduct: commission charges |
|
(14 |
) |
|
|
(40 |
) |
|
|
(36 |
) |
|
|
(205 |
) |
|
Revenue(1) |
$ |
1,747 |
|
|
$ |
3,717 |
|
|
$ |
11,325 |
|
|
$ |
15,051 |
|
(1) Amount
receivable from Sojitz as at September 30, 2022 was $nil
(December 31, 2021 - $2.6 million).
Accounting Estimates, Policies and
Changes
Accounting Estimates
The preparation of the Company’s consolidated
financial statements in accordance with IFRS requires management to
make estimates and judgments that affect the amounts reported in
the consolidated financial statements and accompanying notes. The
critical estimates and judgments applied in the preparation of the
Company’s condensed consolidated interim financial statements for
the three and nine months ended September 30, 2022 are
consistent with those used in the Company’s consolidated financial
statements for the year ended December 31, 2021.
Management’s estimates and underlying
assumptions are reviewed on an ongoing basis. Any changes or
revisions to estimates and underlying assumptions are recognized in
the period in which the estimates are revised and in any future
periods affected. Changes to these critical accounting estimates
could have a material impact on the consolidated financial
statements.
The key sources of estimation uncertainty and
judgment used in the preparation of the consolidated financial
statements that might have a significant risk of causing a material
adjustment to the carrying value of assets and liabilities and
earnings are outlined in note 4 of the consolidated financial
statements for the year ended December 31, 2021 and note 8 of the
condensed consolidated interim financial statements for the three
and nine months ended September 30, 2022.
Accounting Policies and Changes
The accounting policies applied in the condensed
consolidated interim financial statements for the three and nine
months ended September 30, 2022 are consistent with those used
in the Company's consolidated financial statements for the year
ended December 31, 2021, with the exception of those disclosed in
note 3 of the condensed consolidated interim financial statements
for the three and nine months ended September 30, 2022.
Disclosure Controls and Procedures and
Internal Control Over Financial Reporting
The Company’s management, including the CEO and
CFO, is responsible for the design of disclosure controls and
procedures (“DC&P”) and internal controls over financial
reporting (“ICFR”). Centerra adheres to the Committee of Sponsoring
Organizations of the Treadway Commission’s (“COSO”) revised 2013
Internal Control Framework for the design of its ICFR. There
was no material change to the Company’s internal controls over
financial reporting that occurred during 2022 that has materially
affected, or is reasonably likely to materially affect, the
Company’s internal controls over financial reporting.
The evaluation of DC&P and ICFR was carried
out under the supervision of and with the participation of
management, including Centerra’s Interim CEO and CFO. Based on
these evaluations, the Interim CEO and the CFO concluded that the
design of these DC&P and ICFR was effective throughout the nine
months of 2022.
Non-GAAP and Other Financial
Measures
This MD&A contains “specified financial
measures” within the meaning of NI 52-112, specifically the
non-GAAP financial measures, non-GAAP ratios and supplementary
financial measures described below. Management believes that the
use of these measures assists analysts, investors and other
stakeholders of the Company in understanding the costs associated
with producing gold and copper, understanding the economics of gold
and copper mining, assessing operating performance, the Company’s
ability to generate free cash flow from current operations and on
an overall Company basis, and for planning and forecasting of
future periods. However, the measures have limitations as
analytical tools as they may be influenced by the point in the life
cycle of a specific mine and the level of additional exploration or
other expenditures a company has to make to fully develop its
properties. The specified financial measures used in this MD&A
do not have any standardized meaning prescribed by IFRS and may not
be comparable to similar measures presented by other issuers, even
as compared to other issuers who may be applying the World Gold
Council (“WGC”) guidelines. Accordingly, these specified financial
measures should not be considered in isolation, or as a substitute
for, analysis of the Company’s recognized measures presented in
accordance with IFRS.
Definitions
As a result of the seizure of the Kumtor Mine by
the Kyrgyz Republic on May 15, 2021 and the loss of control of the
mine, the Company presented the results from the Kumtor Mine as a
discontinued operation, separate from the Company’s continuing
operations. Consequently, the following non-GAAP financial measures
were added in this MD&A: adjusted net (loss) earnings from
continuing operations; free cash flow (deficit) from continuing
operations and adjusted free cash flow (deficit) from continuing
operations, and the following non-GAAP ratio was added in this
MD&A: adjusted net (loss) earnings from continuing operations
per common share (basic and diluted). These measures are calculated
in a similar fashion as the equivalent non-GAAP financial measures
and ratios presented on a total basis, inclusive of both continuing
operations and discontinued operations.
The following is a description of the non-GAAP
financial measures, non-GAAP ratios and supplementary financial
measures used in this MD&A:
- All-in sustaining costs on a
by-product basis per ounce is a non-GAAP ratio
calculated as all-in sustaining costs on a by-product basis divided
by ounces of gold sold. All-in sustaining costs on a by-product
basis is a non-GAAP financial measure calculated as the aggregate
of production costs as recorded in the consolidated statements of
earnings, refining and transport costs, the cash component of
capitalized stripping and sustaining capital expenditures, lease
payments related to sustaining assets, corporate general and
administrative expenses, accretion expenses, asset retirement
depletion expenses, copper and silver revenue and the associated
impact of hedges of by-product sales revenue (added in the current
period and applied retrospectively to the previous period). When
calculating all-in sustaining costs on a by-product basis, all
revenue received from the sale of copper from the Mount Milligan
Mine, as reduced by the effect of the copper stream, is treated as
a reduction of costs incurred. All-in sustaining costs on a
by-product basis for the Kumtor Mine excludes revenue-based taxes.
A reconciliation of all-in sustaining costs on a by-product basis
to the nearest IFRS measure is set out below. Management uses these
measures to monitor the cost management effectiveness of each of
its operating mines.
- All-in sustaining costs on a
co-product basis per ounce of gold or per pound of copper, is
a non-GAAP ratio calculated as all-in sustaining costs on a
co-product basis divided by ounces of gold or pounds of copper
sold, as applicable. All-in sustaining costs on a co-product basis
is a non-GAAP financial measure based on an allocation of
production costs between copper and gold based on the conversion of
copper production to equivalent ounces of gold. The Company uses a
conversion ratio for calculating gold equivalent ounces for its
copper sales calculated by multiplying the copper pounds sold by
estimated average realized copper price and dividing the resulting
figure by estimated average realized gold price. For the third
quarter and nine month ended September 30, 2022, 483 pounds and 466
pounds, respectively, of copper were equivalent to one ounce of
gold. All-in sustaining costs on a co-product basis for the Kumtor
Mine excludes revenue-based taxes. A reconciliation of all-in
sustaining costs on a co-product basis to the nearest IFRS measure
is set out below. Management uses these measures to monitor the
cost management effectiveness of each of its operating mines.
- Sustaining capital
expenditures and Non-sustaining capital expenditures
are non-GAAP financial measures. Sustaining capital expenditures
are defined as those expenditures required to sustain current
operations and exclude all expenditures incurred at new operations
or major projects at existing operations where these projects will
materially benefit the operation. Non-sustaining capital
expenditures are primarily costs incurred at ‘new operations’
and costs related to ‘major projects at existing operations’ where
these projects will materially benefit the operation. A material
benefit to an existing operation is considered to be at least a 10%
increase in annual or life of mine production, net present value,
or reserves compared to the remaining life of mine of the
operation. A reconciliation of sustaining capital expenditures and
non-sustaining capital expenditures to the nearest IFRS measures is
set out below. Management uses the distinction of the sustaining
and non-sustaining capital expenditures as an input into the
calculation of all-in sustaining costs per ounce and all-in costs
per ounce.
- All-in costs on a by-product
basis per ounce is a non-GAAP ratio calculated as
all-in costs on a by-product basis divided by ounces sold. All-in
costs on a by-product basis is a non-GAAP financial measure which
includes all-in sustaining costs on a by-product basis. exploration
and study costs, non-sustaining capital expenditures, care and
maintenance and predevelopment costs. All-in costs on a by-product
basis per ounce for the Kumtor Mine include revenue-based taxes. A
reconciliation of all-in costs on a by-product basis to the nearest
IFRS measures is set out below. Management uses these measures to
monitor the cost management effectiveness of each of its operating
mines.
- Adjusted net (loss)
earnings is a non-GAAP financial measure calculated by
adjusting net earnings as recorded in the consolidated statements
of earnings and comprehensive income for items not associated with
ongoing operations. The Company believes that this generally
accepted industry measure allows the evaluation of the results of
continuing income-generating capabilities and is useful in making
comparisons between periods. This measure adjusts for the impact of
items not associated with ongoing operations. A reconciliation of
adjusted net earnings to the nearest IFRS measures is set out
below. Management uses this measure to monitor and plan for the
operating performance of the Company in conjunction with other data
prepared in accordance with IFRS.
- Adjusted net (loss) earnings
from continuing operations is a non-GAAP financial measure
calculated by adjusting net earnings from continuing operations as
recorded in the consolidated statements of earnings and
comprehensive income for items not associated with continuing
operations. This measure adjusts for the impact of items not
associated with continuing operations. A reconciliation of adjusted
net earnings from continuing operations to the nearest IFRS
measures is set out below. Management uses this measure to monitor
and plan for the operating performance of continuing operations of
the Company in conjunction with other data prepared in accordance
with IFRS.
- Free cash flow (deficit) from
continuing operations is a non-GAAP financial measure
calculated as cash provided by operating activities from continuing
operations less property, plant and equipment additions. A
reconciliation of free cash flow from continuing operations to the
nearest IFRS measures is set out below. Management uses this
measure to monitor the amount of cash available to reinvest in the
Company and allocate for shareholder returns.
- Free cash flow (deficit) from
mine operations is a non-GAAP financial measure calculated as
cash provided by mine operations less property, plant and equipment
additions. A reconciliation of free cash flow from mine operations
to the nearest IFRS measures is set out below. Management uses this
measure to monitor the degree of self-funding of each of its
operating mines and facilities.
- Free cash flow from
discontinued operations is a non-GAAP financial measure
calculated as cash provided by operating activities from
discontinued operations less property, plant and equipment
additions associated with discontinued operations. A reconciliation
of free cash flow from discontinued operations to the nearest IFRS
measures is set out below.
- Adjusted free cash flow
(deficit) from operations is a non-GAAP financial measure
calculated as free cash flow adjusted for items not associated with
ongoing operations. A reconciliation of adjusted free cash flow
from operations to the nearest IFRS measures is set out below.
Management uses this measure to monitor the amount of cash from
ongoing operations available to reinvest in the Company and
allocate for shareholder returns.
- Average realized gold
price is a supplementary financial measure calculated by
dividing the different components of gold sales (including third
party sales, mark-to-market adjustments, final pricing adjustments
and the fixed amount received under the Mount Milligan Streaming
Arrangement) by the number of ounces sold. Management uses this
measure to monitor its sales of gold ounces against the average
market gold price.
- Average realized copper
price is a supplementary financial measure calculated by
dividing the different components of copper sales (including third
party sales, mark-to-market adjustments, final pricing adjustments
and the fixed amount received under the Mount Milligan Streaming
Arrangement) by the number of pounds sold. Management uses this
measure to monitor its sales of gold ounces against the average
market copper price.
- Total liquidity is a
supplementary financial measure calculated as cash and cash
equivalents and amount available under the corporate credit
facility. Credit Facility availability is reduced by outstanding
letters of credit. Management uses this measure to determine if the
Company can meet all of its commitments, execute on the business
plan, and to mitigate the risk of economic downturns.
Certain unit costs, including all-in
sustaining costs on a by-product basis (including and excluding
revenue-based taxes) per ounce, are non-GAAP ratios which include
as a component certain non-GAAP financial measures including all-in
sustaining costs on a by-product basis which can be reconciled as
follows:
|
|
Three months ended September 30, |
|
|
Consolidated(2) |
Mount Milligan |
Öksüt
|
|
Kumtor(3) |
|
(Unaudited - $millions, unless otherwise
specified) |
2022 |
|
2021 |
|
2022 |
|
2021 |
|
2022 |
|
2021 |
|
|
2022 |
|
2021 |
|
|
Production costs attributable to gold |
41.0 |
|
47.7 |
|
41.0 |
|
29.8 |
|
— |
|
17.9 |
|
|
— |
|
— |
|
|
Production costs attributable to copper |
29.7 |
|
27.7 |
|
29.7 |
|
27.7 |
|
— |
|
— |
|
|
— |
|
— |
|
|
Total production costs excluding molybdenum segment, as
reported |
70.7 |
|
75.4 |
|
70.7 |
|
57.5 |
|
— |
|
17.9 |
|
|
— |
|
— |
|
|
Adjust for: |
|
|
|
|
|
|
|
|
|
|
|
|
|
|
Third party smelting, refining and transport costs |
2.4 |
|
2.4 |
|
2.4 |
|
2.3 |
|
— |
|
0.1 |
|
|
— |
|
— |
|
|
By-product and co-product credits |
(50.5 |
) |
(48.9 |
) |
(50.5 |
) |
(48.9 |
) |
— |
|
— |
|
|
— |
|
— |
|
|
Community costs related to current operations |
— |
|
— |
|
— |
|
— |
|
— |
|
— |
|
|
— |
|
— |
|
|
Adjusted production costs |
22.6 |
|
28.9 |
|
22.6 |
|
10.9 |
|
— |
|
18.0 |
|
|
— |
|
— |
|
|
Corporate general administrative and other costs |
11.7 |
|
8.8 |
|
0.1 |
|
0.1 |
|
— |
|
— |
|
|
— |
|
— |
|
|
Reclamation and remediation - accretion (operating sites) |
1.8 |
|
1.6 |
|
0.2 |
|
0.4 |
|
1.6 |
|
1.2 |
|
|
— |
|
— |
|
|
Sustaining capital expenditures |
15.4 |
|
18.5 |
|
10.4 |
|
15.5 |
|
5.0 |
|
3.0 |
|
|
— |
|
— |
|
|
Sustaining leases |
1.4 |
|
1.3 |
|
1.3 |
|
1.2 |
|
0.1 |
|
0.2 |
|
|
— |
|
— |
|
|
All-in sustaining costs on a by-product basis |
52.9 |
|
59.1 |
|
34.6 |
|
28.1 |
|
6.7 |
|
22.4 |
|
|
— |
|
— |
|
|
Revenue-based taxes |
— |
|
— |
|
— |
|
— |
|
— |
|
— |
|
|
— |
|
— |
|
|
Exploration and study costs |
21.1 |
|
6.0 |
|
3.6 |
|
1.2 |
|
0.8 |
|
1.4 |
|
|
— |
|
— |
|
|
Non-sustaining capital expenditures(1) |
0.1 |
|
1.4 |
|
— |
|
0.9 |
|
— |
|
0.1 |
|
|
— |
|
— |
|
|
Care and maintenance and other costs |
3.3 |
|
4.0 |
|
— |
|
— |
|
0.3 |
|
— |
|
|
— |
|
— |
|
|
All-in costs on a by-product basis |
77.4 |
|
70.5 |
|
38.2 |
|
30.2 |
|
7.8 |
|
23.9 |
|
|
— |
|
— |
|
|
Ounces sold (000s) |
56.2 |
|
75.7 |
|
56.2 |
|
38.5 |
|
— |
|
37.2 |
|
|
— |
|
— |
|
|
Pounds sold (millions) |
19.6 |
|
18.5 |
|
19.6 |
|
18.5 |
|
— |
|
— |
|
|
— |
|
— |
|
|
Gold production costs ($/oz) |
729 |
|
630 |
|
729 |
|
774 |
|
n/a |
|
481 |
|
|
— |
|
— |
|
|
All-in sustaining costs on a by-product basis ($/oz) |
941 |
|
781 |
|
615 |
|
727 |
|
n/a |
|
603 |
|
|
— |
|
— |
|
|
All-in costs on a by-product basis ($/oz) |
1,376 |
|
932 |
|
679 |
|
781 |
|
n/a |
|
644 |
|
|
— |
|
— |
|
|
Gold - All-in sustaining costs on a co-product basis ($/oz) |
1,190 |
|
928 |
|
865 |
|
1,014 |
|
n/a |
|
603 |
|
|
— |
|
— |
|
|
Copper production costs ($/pound) |
1.51 |
|
1.50 |
|
1.51 |
|
1.50 |
|
n/a |
|
n/a |
|
|
n/a |
|
n/a |
|
|
Copper - All-in sustaining costs on a co-product basis
($/pound) |
1.78 |
|
1.95 |
|
1.78 |
|
1.95 |
|
n/a |
|
n/a |
|
|
n/a |
|
n/a |
|
(1) Non-sustaining capital
expenditures are distinct projects designed to have a significant
increase in the net present value of the mine. In the current
quarter, non-sustaining capital expenditures include costs related
to the installation of the staged flotation reactors at the Mount
Milligan Mine.
(2) Presented on a continuing
operations basis, excluding the results from the Kumtor
Mine.
(3) Results from the period ended
September 30, 2021 from the Kumtor Mine are prior to the seizure of
the mine on May 15, 2021.
Certain unit costs, including all-in
sustaining costs on a by-product basis (including and excluding
revenue-based taxes) per ounce, are non-GAAP ratios which include
as a component certain non-GAAP financial measures including all-in
sustaining costs on a by-product basis which can be reconciled as
follows:
|
|
Nine months ended September 30, |
|
|
Consolidated(2) |
Mount Milligan |
Öksüt |
|
Kumtor(3) |
|
(Unaudited - $millions, unless otherwise
specified) |
2022 |
|
2021 |
|
2022 |
|
2021 |
|
2022 |
|
2021 |
|
|
2022 |
|
2021 |
|
|
Production costs attributable to gold |
125.9 |
|
140.2 |
|
104.8 |
|
99.5 |
|
21.1 |
|
40.7 |
|
|
— |
|
72.6 |
|
|
Production costs attributable to copper |
94.3 |
|
87.3 |
|
94.3 |
|
87.3 |
|
— |
|
— |
|
|
— |
|
— |
|
|
Total production costs excluding molybdenum segment, as
reported |
220.2 |
|
227.5 |
|
199.1 |
|
186.8 |
|
21.1 |
|
40.7 |
|
|
— |
|
72.6 |
|
|
Adjust for: |
|
|
|
|
|
|
|
|
|
|
|
|
|
|
Third party smelting, refining and transport costs |
8.6 |
|
8.8 |
|
8.4 |
|
7.9 |
|
0.2 |
|
0.9 |
|
|
— |
|
1.2 |
|
|
By-product and co-product credits |
(169.5 |
) |
(174.3 |
) |
(169.5 |
) |
(174.3 |
) |
— |
|
— |
|
|
— |
|
— |
|
|
Community costs related to current operations |
— |
|
— |
|
— |
|
— |
|
— |
|
— |
|
|
— |
|
2.6 |
|
|
Adjusted production costs |
59.4 |
|
62.0 |
|
37.9 |
|
20.4 |
|
21.3 |
|
41.6 |
|
|
— |
|
76.4 |
|
|
Corporate general administrative and other costs |
35.7 |
|
20.3 |
|
0.6 |
|
1.1 |
|
— |
|
— |
|
|
— |
|
— |
|
|
Reclamation and remediation - accretion (operating sites) |
5.4 |
|
3.4 |
|
1.3 |
|
1.3 |
|
4.1 |
|
2.1 |
|
|
— |
|
0.3 |
|
|
Sustaining capital expenditures |
54.6 |
|
61.2 |
|
43.2 |
|
46.5 |
|
11.4 |
|
14.7 |
|
|
— |
|
60.6 |
|
|
Sustaining lease payments |
4.3 |
|
4.0 |
|
3.9 |
|
3.5 |
|
0.4 |
|
0.5 |
|
|
— |
|
— |
|
|
All-in sustaining costs on a by-product basis |
159.3 |
|
150.9 |
|
86.9 |
|
72.8 |
|
37.2 |
|
58.9 |
|
|
— |
|
137.3 |
|
|
Revenue-based taxes |
— |
|
— |
|
— |
|
— |
|
— |
|
— |
|
|
— |
|
37.0 |
|
|
Exploration and study costs |
42.6 |
|
17.1 |
|
10.1 |
|
4.5 |
|
2.5 |
|
2.1 |
|
|
— |
|
8.8 |
|
|
Non-sustaining capital expenditures(1) |
2.0 |
|
2.9 |
|
1.5 |
|
1.9 |
|
— |
|
0.6 |
|
|
— |
|
25.9 |
|
|
Care and maintenance and other costs |
9.1 |
|
10.1 |
|
— |
|
— |
|
0.4 |
|
— |
|
|
— |
|
— |
|
|
All-in costs on a by-product basis |
213.0 |
|
181.0 |
|
98.5 |
|
79.2 |
|
40.1 |
|
61.6 |
|
|
— |
|
209.0 |
|
|
Ounces sold (000s) |
192.8 |
|
224.5 |
|
138.0 |
|
144.5 |
|
54.7 |
|
80.0 |
|
|
— |
|
147.8 |
|
|
Pounds sold (millions) |
58.0 |
|
60.8 |
|
58.0 |
|
60.8 |
|
— |
|
— |
|
|
— |
|
— |
|
|
Gold production costs ($/oz) |
653 |
|
626 |
|
759 |
|
689 |
|
386 |
|
509 |
|
|
— |
|
491 |
|
|
All-in sustaining costs on a by-product basis ($/oz) |
826 |
|
672 |
|
629 |
|
504 |
|
680 |
|
736 |
|
|
— |
|
929 |
|
|
All-in costs on a by-product basis ($/oz) |
1,105 |
|
806 |
|
713 |
|
549 |
|
732 |
|
770 |
|
|
— |
|
1,414 |
|
|
Gold - All-in sustaining costs on a co-product basis ($/oz) |
1,062 |
|
916 |
|
958 |
|
883 |
|
680 |
|
736 |
|
|
— |
|
929 |
|
|
Copper production costs ($/pound) |
1.63 |
|
1.44 |
|
1.63 |
|
1.44 |
|
n/a |
|
n/a |
|
|
n/a |
|
n/a |
|
|
Copper - All-in sustaining costs on a co-product basis
($/pound) |
2.04 |
|
1.21 |
|
2.04 |
|
1.21 |
|
n/a |
|
n/a |
|
|
n/a |
|
n/a |
|
(1) Non-sustaining capital
expenditures are distinct projects designed to have a significant
increase in the net present value of the mine. In the current year,
non-sustaining capital expenditures include costs related to the
installation of the staged flotation reactors at the Mount Milligan
Mine.
(2) Presented on a continuing
operations basis, excluding the results from the Kumtor
Mine.
(3) Results from the period ended
September 30, 2021 from the Kumtor Mine are prior to the seizure of
the mine on May 15, 2021.
Adjusted net (loss) earnings is a non-GAAP financial measure and
can be reconciled as follows:
|
|
Three months ended
September 30, |
|
Nine months ended
September 30, |
|
($millions, except as noted) |
|
2022 |
|
|
2021 |
|
|
|
2022 |
|
|
2021 |
|
|
Net (loss) earnings |
$ |
(33.9 |
) |
$ |
27.6 |
|
|
$ |
52.9 |
|
$ |
(656.6 |
) |
|
Adjust for items not associated with ongoing operations: |
|
|
|
|
|
|
Loss of control of the Kumtor Mine |
|
— |
|
|
— |
|
|
|
— |
|
|
926.4 |
|
|
Kumtor Mine legal costs and other related costs |
|
5.3 |
|
|
8.1 |
|
|
|
15.0 |
|
|
16.2 |
|
|
Gain from the discontinuance of Kumtor Mine hedge instruments |
|
— |
|
|
— |
|
|
|
— |
|
|
(15.3 |
) |
|
Gain on the sale of Greenstone property |
|
— |
|
|
— |
|
|
|
— |
|
|
(72.3 |
) |
|
Reclamation recovery at sites on care and maintenance |
|
(7.7 |
) |
|
— |
|
|
|
(90.8 |
) |
|
(0.1 |
) |
|
Income tax adjustments(1) |
|
20.4 |
|
|
— |
|
|
|
27.2 |
|
|
— |
|
|
Adjusted net (loss) earnings |
$ |
(15.9 |
) |
$ |
35.7 |
|
|
$ |
4.3 |
|
$ |
198.3 |
|
|
|
|
|
|
|
|
|
Net (loss) earnings per share - basic |
$ |
(0.14 |
) |
$ |
0.09 |
|
|
$ |
0.19 |
|
$ |
(2.21 |
) |
|
Net (loss) earnings per share - diluted |
$ |
(0.15 |
) |
$ |
0.09 |
|
|
$ |
0.17 |
|
$ |
(2.23 |
) |
|
Adjusted net (loss) earnings per share -
basic |
$ |
(0.06 |
) |
$ |
0.12 |
|
|
$ |
0.02 |
|
$ |
0.67 |
|
|
Adjusted net (loss) earnings per share -
diluted |
$ |
(0.06 |
) |
$ |
0.12 |
|
|
$ |
0.02 |
|
$ |
0.65 |
|
(1) Income tax
adjustments reflect the impact of foreign currency translation on
deferred income taxes.
Adjusted net (loss) earnings from continuing operations is a
non-GAAP financial measure and can be reconciled as
follows:
|
|
Three months ended
September 30, |
|
Nine months ended
September 30, |
|
($millions, except as noted) |
|
2022 |
|
|
2021 |
|
|
|
2022 |
|
|
2021 |
|
|
Net (loss) earnings from continuing
operations |
$ |
(33.9 |
) |
$ |
27.6 |
|
|
$ |
52.9 |
|
$ |
172.1 |
|
|
Adjust for items not associated with ongoing operations: |
|
|
|
|
|
|
Kumtor Mine litigation and other related costs |
|
5.3 |
|
|
8.1 |
|
|
|
15.0 |
|
|
14.2 |
|
|
Gain on the sale of Greenstone property |
|
— |
|
|
— |
|
|
|
— |
|
|
(72.3 |
) |
|
Reclamation recovery at sites on care and maintenance |
|
(7.7 |
) |
|
— |
|
|
|
(90.8 |
) |
|
(0.1 |
) |
|
Income tax adjustments(1) |
|
20.4 |
|
|
— |
|
|
|
27.2 |
|
|
— |
|
|
Adjusted net (loss) earnings from continuing
operations |
$ |
(15.9 |
) |
$ |
35.7 |
|
|
$ |
4.3 |
|
$ |
113.9 |
|
|
|
|
|
|
|
|
|
Net (loss) earnings from continuing operations per share -
basic |
$ |
(0.14 |
) |
$ |
0.09 |
|
|
$ |
0.19 |
|
$ |
0.58 |
|
|
Net (loss) earnings from continuing operations per share -
diluted |
$ |
(0.15 |
) |
$ |
0.09 |
|
|
$ |
0.17 |
|
$ |
0.56 |
|
|
Adjusted net (loss) earnings from continuing operations per
share - basic |
$ |
(0.06 |
) |
$ |
0.12 |
|
|
$ |
0.02 |
|
$ |
0.38 |
|
|
Adjusted net (loss) earnings from continuing operations per
share - diluted |
$ |
(0.06 |
) |
$ |
0.12 |
|
|
$ |
0.02 |
|
$ |
0.36 |
|
(1)
Income tax adjustments reflect the impact of foreign currency
translation on deferred income taxes.
Free cash flow (deficit) from continuing operations and adjusted
free cash flow (deficit) from continuing operations are non-GAAP
financial measures and can be reconciled as
follows:
|
|
Three months ended September 30, |
|
|
Consolidated |
Mount
Milligan |
Öksüt |
Molybdenum |
Other |
|
|
|
2022 |
|
|
2021 |
|
|
2022 |
|
|
2021 |
|
|
2022 |
|
|
2021 |
|
|
2022 |
|
|
2021 |
|
|
2022 |
|
|
2021 |
|
|
Cash (used in) provided by operating activities from
continuing operations(1) |
$ |
(17.0 |
) |
$ |
62.4 |
|
$ |
33.4 |
|
$ |
43.2 |
|
$ |
(18.0 |
) |
$ |
52.1 |
|
$ |
8.0 |
|
$ |
(13.7 |
) |
$ |
(40.4 |
) |
$ |
(19.2 |
) |
|
Adjust for: |
|
|
|
|
|
|
|
|
|
|
|
Additions to property, plant & equipment from continuing
operations(1) |
|
(18.5 |
) |
|
(21.4 |
) |
|
(12.5 |
) |
|
(17.3 |
) |
|
(5.0 |
) |
|
(3.2 |
) |
|
(0.8 |
) |
|
(0.3 |
) |
|
(0.2 |
) |
|
(0.6 |
) |
|
Free cash flow (deficit) from continuing
operations |
$ |
(35.5 |
) |
$ |
41.0 |
|
$ |
20.9 |
|
$ |
25.9 |
|
$ |
(23.0 |
) |
$ |
48.9 |
|
$ |
7.2 |
|
$ |
(14.0 |
) |
$ |
(40.6 |
) |
$ |
(19.8 |
) |
|
Adjust for: |
|
|
|
|
|
|
|
|
|
|
|
Kumtor Mine legal and other related costs |
|
6.0 |
|
|
4.3 |
|
|
— |
|
|
— |
|
|
— |
|
|
— |
|
|
— |
|
|
— |
|
|
6.0 |
|
|
4.3 |
|
|
Adjusted free cash flow (deficit) from continuing
operations |
$ |
(29.5 |
) |
$ |
45.3 |
|
$ |
20.9 |
|
$ |
25.9 |
|
$ |
(23.0 |
) |
$ |
48.9 |
|
$ |
7.2 |
|
$ |
(14.0 |
) |
$ |
(34.6 |
) |
$ |
(15.5 |
) |
(1) As
presented in the Company’s consolidated statements of cash
flows.
|
|
Nine months ended September 30, |
|
|
Consolidated |
Mount
Milligan |
Öksüt |
Molybdenum |
Other |
|
|
|
2022 |
|
|
2021 |
|
|
2022 |
|
|
2021 |
|
|
2022 |
|
|
2021 |
|
|
2022 |
|
|
2021 |
|
|
2022 |
|
|
2021 |
|
|
Cash provided by (used in) operating activities from
continuing operations(1) |
$ |
7.8 |
|
$ |
209.1 |
|
$ |
135.1 |
|
$ |
206.6 |
|
$ |
(5.6 |
) |
$ |
92.2 |
|
$ |
(17.9 |
) |
$ |
(21.5 |
) |
$ |
(103.8 |
) |
$ |
(68.2 |
) |
|
Adjust for: |
|
|
|
|
|
|
|
|
|
|
|
Additions to property, plant & equipment at continuing
operations(1) |
|
(65.4 |
) |
|
(69.4 |
) |
|
(50.3 |
) |
|
(50.1 |
) |
|
(11.4 |
) |
|
(15.9 |
) |
|
(1.1 |
) |
|
(1.1 |
) |
|
(2.6 |
) |
|
(2.3 |
) |
|
Free cash flow (deficit) from continuing
operations |
$ |
(57.6 |
) |
$ |
139.7 |
|
$ |
84.8 |
|
$ |
156.5 |
|
$ |
(17.0 |
) |
$ |
76.3 |
|
$ |
(19.0 |
) |
$ |
(22.6 |
) |
$ |
(106.4 |
) |
$ |
(70.5 |
) |
|
Adjust for: |
|
|
|
|
|
|
|
|
|
|
|
Kumtor Mine legal and other related costs |
|
20.9 |
|
|
8.9 |
|
|
— |
|
|
— |
|
|
— |
|
|
— |
|
|
— |
|
|
— |
|
|
20.9 |
|
|
8.9 |
|
|
Adjusted free cash flow (deficit) from continuing
operations |
$ |
(36.7 |
) |
$ |
148.6 |
|
$ |
84.8 |
|
$ |
156.5 |
|
$ |
(17.0 |
) |
$ |
76.3 |
|
$ |
(19.0 |
) |
$ |
(22.6 |
) |
$ |
(85.5 |
) |
$ |
(61.6 |
) |
(1) As
presented in the Company’s consolidated statements of cash
flows.
Free cash flow from discontinued operations is a non-GAAP financial
measure and can be reconciled as follows:
|
|
Three months ended
September 30, |
Nine months ended
September 30, |
|
|
|
2022 |
|
|
2021 |
|
|
2022 |
|
|
2021 |
|
|
Cash provided by operating activities from discontinued
operations(1) |
$ |
— |
|
$ |
— |
|
$ |
— |
|
$ |
143.9 |
|
|
Adjust for: |
|
|
|
|
|
Additions to property, plant & equipment from discontinued
operations(1) |
|
— |
|
|
— |
|
|
— |
|
|
(90.2 |
) |
|
Free cash flow from discontinued operations |
$ |
— |
|
$ |
— |
|
$ |
— |
|
$ |
53.7 |
|
(1) As presented
in the Company’s consolidated statements of cash flows.
Sustaining capital expenditures and non-sustaining capital
expenditures are non-GAAP measures and can be reconciled as
follows:
|
|
Three months ended September 30, |
|
|
Consolidated |
Mount
Milligan |
Öksüt |
Molybdenum |
Other |
|
|
|
2022 |
|
2021 |
|
|
2022 |
|
|
2021 |
|
|
2022 |
|
2021 |
|
|
2022 |
|
2021 |
|
|
2022 |
|
|
2021 |
|
|
Additions to
PP&E(1) |
$ |
11.7 |
$ |
24.8 |
|
$ |
6.6 |
|
$ |
20.8 |
|
$ |
4.0 |
$ |
3.4 |
|
$ |
0.5 |
$ |
0.3 |
|
$ |
0.6 |
|
$ |
0.3 |
|
|
Adjust for: |
|
|
|
|
|
|
|
|
|
|
|
Costs capitalized to the ARO assets |
|
4.2 |
|
2.1 |
|
|
4.0 |
|
|
0.9 |
|
|
0.7 |
|
— |
|
|
— |
|
— |
|
|
(0.5 |
) |
|
1.2 |
|
|
Costs capitalized to the ROU assets |
|
— |
|
(4.8 |
) |
|
— |
|
|
(4.6 |
) |
|
— |
|
(0.2 |
) |
|
— |
|
— |
|
|
— |
|
|
— |
|
|
Other(2) |
|
0.2 |
|
(2.0 |
) |
|
(0.2 |
) |
|
(0.7 |
) |
|
0.4 |
|
— |
|
|
— |
|
(0.1 |
) |
|
— |
|
|
(1.2 |
) |
|
Capital expenditures |
$ |
16.1 |
$ |
20.1 |
|
$ |
10.4 |
|
$ |
16.4 |
|
$ |
5.1 |
$ |
3.2 |
|
$ |
0.5 |
$ |
0.2 |
|
$ |
0.1 |
|
$ |
0.3 |
|
|
Sustaining capital expenditures |
|
16.0 |
|
18.7 |
|
|
10.4 |
|
|
15.5 |
|
|
5.1 |
|
3.1 |
|
|
0.5 |
|
0.1 |
|
|
— |
|
|
— |
|
|
Non-sustaining capital expenditures |
|
0.1 |
|
1.4 |
|
|
— |
|
|
0.9 |
|
|
— |
|
0.1 |
|
|
— |
|
— |
|
|
0.1 |
|
|
0.3 |
|
(1) As presented
in the note 19 of the Company’s condensed consolidated interim
financial statements.
(2) Includes reclassification of
insurance and capital spares from supplies inventory to
PP&E.
|
|
Nine months ended September 30, |
|
|
Consolidated |
Mount Milligan |
Öksüt |
Molybdenum |
Other |
|
|
|
2022 |
|
|
2021 |
|
|
2022 |
|
2021 |
|
|
2022 |
|
|
2021 |
|
|
2022 |
|
2021 |
|
2022 |
|
|
2021 |
|
|
Additions to
PP&E(1) |
$ |
247.2 |
|
$ |
72.0 |
|
$ |
34.6 |
$ |
54.8 |
|
$ |
9.1 |
|
$ |
15.6 |
|
$ |
1.0 |
$ |
1.1 |
$ |
202.5 |
|
$ |
0.5 |
|
|
Adjust for: |
|
|
|
|
|
|
|
|
|
|
|
Costs capitalized to the ARO assets |
|
18.1 |
|
|
0.1 |
|
|
9.9 |
|
— |
|
|
1.9 |
|
|
— |
|
|
— |
|
— |
|
6.3 |
|
|
0.1 |
|
|
Costs capitalized to the ROU assets |
|
(0.2 |
) |
|
(5.6 |
) |
|
— |
|
(5.3 |
) |
|
(0.2 |
) |
|
(0.3 |
) |
|
— |
|
— |
|
— |
|
|
— |
|
|
Costs relating to the acquisition of Goldfield Project |
|
(208.2 |
) |
|
— |
|
|
— |
|
— |
|
|
— |
|
|
— |
|
|
— |
|
— |
|
(208.2 |
) |
|
— |
|
|
Other(2) |
|
0.9 |
|
|
(1.3 |
) |
|
0.2 |
|
(1.1 |
) |
|
0.6 |
|
|
— |
|
|
0.1 |
|
— |
|
— |
|
|
(0.2 |
) |
|
Capital expenditures |
$ |
57.8 |
|
$ |
65.2 |
|
$ |
44.7 |
$ |
48.4 |
|
$ |
11.4 |
|
$ |
15.3 |
|
$ |
1.1 |
$ |
1.1 |
$ |
0.6 |
|
$ |
0.4 |
|
|
Sustaining capital expenditures |
|
55.8 |
|
|
62.3 |
|
|
43.2 |
|
46.5 |
|
|
11.4 |
|
|
14.7 |
|
|
1.1 |
|
1.1 |
|
0.1 |
|
|
— |
|
|
Non-sustaining capital expenditures |
|
2.0 |
|
|
2.9 |
|
|
1.5 |
|
1.9 |
|
|
— |
|
|
0.6 |
|
|
— |
|
— |
|
0.5 |
|
|
0.4 |
|
(1) As presented
in the note 19 of the Company’s condensed consolidated interim
financial statements.
(2) Includes reclassification of
insurance and capital spares from supplies inventory to
PP&E.
Qualified Person & QA/QC –
Non-Exploration (including Production information)
The technical information contained in this
document relating to mineral reserve estimates of the Mount
Milligan Mine is based on, and fairly represents, information
compiled by Gordon Zurowski, P.Eng who is a member of the
Professional Engineers Ontario. Mr. Zurowski is independent within
the meaning of Canadian Securities Administrator’s NI-43-101, as a
full-time employee of AGP Mining Consultants, Inc. and not
Centerra. Mr. Zurowski has sufficient experience which is relevant
to the style of mineralization and type of deposit under
consideration and to the activity which he is undertaking to
qualify as a “Qualified Person” under NI 43-101 Standards of
Disclosure for Mineral Projects. Mr. Zurowski has consented to the
inclusion in this document of the mineral reserve estimates based
on his compiled information in the form and context in which it
appears in this document.
The technical Information contained In this news
release relating to the Mount Milligan Mine's mineral resource
estimates is based on, and fairly represents, information compiled
by Brian Thomas, P.Eng who is a member of the Professional
Geoscientists of Ontario. Mr. Thomas is independent within the
meaning of NI 43-101, as a full-time employee of WSP Global Inc.
and not Centerra. Mr. Thomas has sufficient experience which is
relevant to the style of mineralization and type of deposit under
consideration and to the activity which he is undertaking to
qualify as a “Qualified Person” under NI 43-101 Standards of
Disclosure for Mineral Projects. Mr. Thomas has consented to the
inclusion in this document of the mineral resource estimates based
on his compiled information in the form and context in which it
appears in this document.
All mineral reserve and resources have been
estimated in accordance with the standards of the Canadian
Institute of Mining, Metallurgy and Petroleum and NI 43-101.
All other scientific and technical
information presented in this document, including the production
estimates, were prepared in accordance with the standards of the
Canadian Institute of Mining, Metallurgy and Petroleum and NI
43-101 and were reviewed, verified, and compiled by Centerra’s
geological and mining staff under the supervision of W. Paul
Chawrun, Professional Engineer, member of the Professional
Engineers of Ontario (PEO) and Centerra’s Vice President and Chief
Operating Officer and Anna Malevich, Professional Engineer, member
of the Professional Engineers of Ontario (PEO) and Centerra’s
Senior Director, Projects each of whom is a qualified person for
the purpose of NI 43-101. Sample preparation, analytical
techniques, laboratories used and quality assurance and quality
control protocols are done consistent with industry standards and
independent certified assay labs are used.
The Mount Milligan Mine is described in a NI
43-101-compliant technical report dated November 7, 2022 and
filed on SEDAR at www.sedar.com and
EDGAR at www.sec.gov/edgar. The
technical report describes the exploration history, geology, and
style of gold mineralization at the Mount Milligan deposit. Sample
preparation, analytical techniques, laboratories used, and quality
assurance and quality control protocols used during the exploration
drilling programs are done consistent with industry standards while
independent certified assay labs are used.
The Öksüt Mine is described in a NI
43-101-compliant technical report dated September 3, 2015 and
filed on SEDAR at www.sedar.com. The
technical report describes the exploration history, geology, and
style of gold mineralization at the Öksüt deposit. Sample
preparation, analytical techniques, laboratories used, and quality
assurance and quality control protocols used during the exploration
drilling programs are done consistent with industry standards while
independent certified assay labs are used.
Centerra Gold Inc.
Condensed Consolidated Interim Statements of Financial
Position
|
(Expressed in thousands of United States
dollars) |
|
September 30,
2022 |
|
December 31,
2021 |
|
|
|
|
|
|
|
Assets |
|
|
|
|
|
Current assets |
|
|
|
|
|
Cash and cash equivalents |
|
$ |
580,772 |
|
|
$ |
947,230 |
|
|
Amounts receivable |
|
|
70,035 |
|
|
|
76,841 |
|
|
Inventories |
|
|
244,354 |
|
|
|
221,220 |
|
|
Other current assets |
|
|
25,621 |
|
|
|
25,802 |
|
| |
|
|
920,782 |
|
|
|
1,271,093 |
|
| |
|
|
|
|
|
Property, plant and equipment |
|
|
1,419,791 |
|
|
|
1,272,091 |
|
|
Deferred income tax assets |
|
|
68,000 |
|
|
|
101,300 |
|
|
Other non-current assets |
|
|
41,256 |
|
|
|
32,084 |
|
| |
|
|
1,529,047 |
|
|
|
1,405,475 |
|
|
Total assets |
|
$ |
2,449,829 |
|
|
$ |
2,676,568 |
|
| |
|
|
|
|
|
Liabilities and shareholders' equity |
|
|
|
|
|
Current liabilities |
|
|
|
|
|
Accounts payable and accrued liabilities |
|
$ |
135,623 |
|
|
$ |
186,820 |
|
|
Income tax payable |
|
|
194 |
|
|
|
25,253 |
|
|
Other current liabilities |
|
|
65,481 |
|
|
|
15,281 |
|
| |
|
|
201,298 |
|
|
|
227,354 |
|
| |
|
|
|
|
|
Deferred income tax liabilities |
|
|
40,804 |
|
|
|
54,861 |
|
|
Provision for reclamation |
|
|
220,875 |
|
|
|
331,312 |
|
|
Other non-current liabilities |
|
|
25,383 |
|
|
|
19,425 |
|
| |
|
|
287,062 |
|
|
|
405,598 |
|
|
Shareholders' equity |
|
|
|
|
|
Share capital |
|
|
893,813 |
|
|
|
984,095 |
|
|
Contributed surplus |
|
|
31,210 |
|
|
|
30,809 |
|
|
Accumulated other comprehensive (loss) income |
|
|
(2,118 |
) |
|
|
6,829 |
|
|
Retained earnings |
|
|
1,038,564 |
|
|
|
1,021,883 |
|
| |
|
|
1,961,469 |
|
|
|
2,043,616 |
|
|
Total liabilities and shareholders' equity |
|
$ |
2,449,829 |
|
|
$ |
2,676,568 |
|
| |
|
|
|
|
Centerra Gold Inc.
Condensed Consolidated Interim Statements of (Loss)
Earnings and Comprehensive Income (Loss)
| |
Three months ended
September 30, |
|
Nine months ended
September 30, |
|
(Expressed in thousands of United States
dollars) |
|
2022 |
|
|
|
2021 |
|
|
|
2022 |
|
|
|
2021 |
|
|
|
|
|
|
|
|
|
|
| |
|
|
|
|
|
|
|
|
Revenue |
$ |
179,013 |
|
|
$ |
220,561 |
|
|
$ |
641,890 |
|
|
$ |
649,059 |
|
| |
|
|
|
|
|
|
|
|
Cost of sales |
|
|
|
|
|
|
|
|
Production costs |
|
131,950 |
|
|
|
121,641 |
|
|
|
416,526 |
|
|
|
355,691 |
|
|
Depreciation, depletion and amortization |
|
14,456 |
|
|
|
30,413 |
|
|
|
79,884 |
|
|
|
89,461 |
|
|
Earnings from mine operations |
|
32,607 |
|
|
|
68,507 |
|
|
|
145,480 |
|
|
|
203,907 |
|
| |
|
|
|
|
|
|
|
|
Exploration and development costs |
|
21,426 |
|
|
|
6,597 |
|
|
|
43,035 |
|
|
|
18,819 |
|
|
Corporate administration |
|
11,683 |
|
|
|
8,881 |
|
|
|
35,472 |
|
|
|
19,676 |
|
|
Care and maintenance expense |
|
8,166 |
|
|
|
7,638 |
|
|
|
22,730 |
|
|
|
20,472 |
|
|
Reclamation recovery |
|
(7,678 |
) |
|
|
(871 |
) |
|
|
(90,552 |
) |
|
|
(913 |
) |
|
Other operating expenses |
|
3,167 |
|
|
|
2,627 |
|
|
|
10,287 |
|
|
|
10,392 |
|
|
(Loss) earnings from operations |
|
(4,157 |
) |
|
|
43,635 |
|
|
|
124,508 |
|
|
|
135,461 |
|
| |
|
|
|
|
|
|
|
|
Gain on sale of Greenstone Partnership |
|
— |
|
|
|
— |
|
|
|
— |
|
|
|
(72,274 |
) |
|
Other non-operating expenses |
|
699 |
|
|
|
6,975 |
|
|
|
7,284 |
|
|
|
14,067 |
|
|
Finance costs |
|
2,882 |
|
|
|
694 |
|
|
|
6,454 |
|
|
|
4,001 |
|
|
(Loss) earnings before income tax |
|
(7,738 |
) |
|
|
35,966 |
|
|
|
110,770 |
|
|
|
189,667 |
|
|
Income tax expense |
|
26,139 |
|
|
|
8,383 |
|
|
|
57,896 |
|
|
|
17,598 |
|
|
Net (loss) earnings from continuing
operations |
|
(33,877 |
) |
|
|
27,583 |
|
|
|
52,874 |
|
|
|
172,069 |
|
|
Net loss from discontinued operations |
|
— |
|
|
|
— |
|
|
|
— |
|
|
|
(828,717 |
) |
|
Net (loss) earnings |
$ |
(33,877 |
) |
|
$ |
27,583 |
|
|
$ |
52,874 |
|
|
$ |
(656,648 |
) |
| |
|
|
|
|
|
|
|
|
Other Comprehensive (Loss) Income |
|
|
|
|
|
|
|
|
Items that may be subsequently reclassified to
earnings: |
|
|
|
|
|
|
|
|
Net gain on translation of foreign operation |
$ |
— |
|
|
$ |
— |
|
|
$ |
— |
|
|
$ |
31 |
|
|
Net (loss) gain on derivative instruments |
|
(18,674 |
) |
|
|
3,799 |
|
|
|
(8,947 |
) |
|
|
(2,097 |
) |
|
Other comprehensive (loss) income |
|
(18,674 |
) |
|
|
3,799 |
|
|
|
(8,947 |
) |
|
|
(2,066 |
) |
|
Total comprehensive (loss) income |
$ |
(52,551 |
) |
|
$ |
31,382 |
|
|
$ |
43,927 |
|
|
$ |
(658,714 |
) |
| |
|
|
|
|
|
|
|
|
(Loss) earnings per share - continuing
operations: |
|
|
|
|
|
|
|
|
Basic |
$ |
(0.14 |
) |
|
$ |
0.09 |
|
|
$ |
0.19 |
|
|
$ |
0.58 |
|
|
Diluted |
$ |
(0.15 |
) |
|
$ |
0.09 |
|
|
$ |
0.17 |
|
|
$ |
0.56 |
|
|
(Loss) earnings per share: |
|
|
|
|
|
|
|
|
Basic |
$ |
(0.14 |
) |
|
$ |
0.09 |
|
|
$ |
0.19 |
|
|
$ |
(2.21 |
) |
|
Diluted |
$ |
(0.15 |
) |
|
$ |
0.09 |
|
|
$ |
0.17 |
|
|
$ |
(2.23 |
) |
| |
|
|
|
|
|
|
|
|
Cash dividends declared per common share (C$) |
$ |
0.07 |
|
|
$ |
0.07 |
|
|
$ |
0.21 |
|
|
$ |
0.17 |
|
|
|
|
|
|
|
|
|
|
|
|
|
|
|
|
|
|
Centerra Gold Inc.
Condensed Consolidated Interim Statements of Cash
Flows
| |
|
|
Three months ended
September 30, |
|
|
Nine months ended
September 30, |
|
(Expressed in thousands of United States
dollars) |
|
2022 |
|
|
|
2021 |
|
|
|
2022 |
|
|
|
2021 |
|
| |
|
|
|
|
|
|
|
|
|
|
|
|
|
Operating activities |
|
|
|
|
|
|
|
|
|
|
|
|
Net (loss) earnings from continuing operations |
$ |
(33,877 |
) |
|
$ |
27,583 |
|
|
$ |
52,874 |
|
|
$ |
172,069 |
|
| |
|
|
|
|
|
|
|
|
|
|
|
|
|
Adjustments: |
|
|
|
|
|
|
|
|
|
|
|
|
|
Depreciation, depletion and amortization |
|
15,806 |
|
|
|
31,873 |
|
|
|
83,803 |
|
|
|
93,941 |
|
| |
Reclamation recovery |
|
(7,678 |
) |
|
|
(871 |
) |
|
|
(90,552 |
) |
|
|
(913 |
) |
| |
Share-based compensation |
|
(2,847 |
) |
|
|
3,560 |
|
|
|
(1,080 |
) |
|
|
918 |
|
| |
Finance costs |
|
2,882 |
|
|
|
694 |
|
|
|
6,454 |
|
|
|
4,001 |
|
| |
Income tax expense |
|
26,139 |
|
|
|
8,383 |
|
|
|
57,896 |
|
|
|
17,598 |
|
| |
Income taxes paid |
|
(1,502 |
) |
|
|
(4,829 |
) |
|
|
(54,868 |
) |
|
|
(7,585 |
) |
| |
Gain on sale of Greenstone Partnership |
|
— |
|
|
|
— |
|
|
|
— |
|
|
|
(72,274 |
) |
| |
Other |
|
(3,318 |
) |
|
|
452 |
|
|
|
(2,175 |
) |
|
|
2,747 |
|
| |
|
(4,395 |
) |
|
|
66,845 |
|
|
|
52,352 |
|
|
|
210,502 |
|
|
Changes in working capital |
|
(12,574 |
) |
|
|
(4,477 |
) |
|
|
(44,510 |
) |
|
|
(1,406 |
) |
|
Cash (used in) provided by operating activities from
continuing operations |
|
(16,969 |
) |
|
|
62,368 |
|
|
|
7,842 |
|
|
|
209,096 |
|
| |
Cash provided by operating activities from discontinued
operations |
|
— |
|
|
|
— |
|
|
|
— |
|
|
|
143,853 |
|
|
Cash (used in) provided by operating
activities |
|
(16,969 |
) |
|
|
62,368 |
|
|
|
7,842 |
|
|
|
352,949 |
|
| |
|
|
|
|
|
|
|
|
|
|
|
|
|
Investing activities |
|
|
|
|
|
|
|
|
|
|
|
| |
Property, plant and equipment additions |
|
(18,530 |
) |
|
|
(21,416 |
) |
|
|
(65,435 |
) |
|
|
(69,383 |
) |
| |
Acquisition of Goldfield Project |
|
— |
|
|
|
— |
|
|
|
(176,737 |
) |
|
|
— |
|
| |
Proceeds from sale of Greenstone Partnership |
|
— |
|
|
|
— |
|
|
|
— |
|
|
|
210,291 |
|
| |
Proceeds from disposition of property, plant and equipment |
|
— |
|
|
|
1,154 |
|
|
|
2,025 |
|
|
|
1,889 |
|
| |
Decrease in other assets |
|
— |
|
|
|
3 |
|
|
|
— |
|
|
|
2,847 |
|
|
Cash (used in) provided by investing activities from
continuing operations |
|
(18,530 |
) |
|
|
(20,259 |
) |
|
|
(240,147 |
) |
|
|
145,644 |
|
| |
Cash used in investing activities from discontinued operations |
|
— |
|
|
|
— |
|
|
|
— |
|
|
|
(96,081 |
) |
|
Cash (used in) provided by investing
activities |
|
(18,530 |
) |
|
|
(20,259 |
) |
|
|
(240,147 |
) |
|
|
49,563 |
|
| |
|
|
|
|
|
|
|
|
|
|
|
|
|
Financing activities |
|
|
|
|
|
|
|
|
|
|
|
| |
Dividends paid |
|
(11,743 |
) |
|
|
(12,166 |
) |
|
|
(36,193 |
) |
|
|
(33,046 |
) |
| |
Payment of borrowing costs |
|
(535 |
) |
|
|
(488 |
) |
|
|
(1,657 |
) |
|
|
(2,093 |
) |
| |
Repayment of lease obligations |
|
(1,622 |
) |
|
|
(1,555 |
) |
|
|
(5,078 |
) |
|
|
(4,891 |
) |
| |
Proceeds from common shares issued |
|
170 |
|
|
|
927 |
|
|
|
2,115 |
|
|
|
4,040 |
|
| |
Repurchase and cancellation of shares |
|
(93,340 |
) |
|
|
— |
|
|
|
(93,340 |
) |
|
|
— |
|
|
Cash used in financing activities |
|
(107,070 |
) |
|
|
(13,282 |
) |
|
|
(134,153 |
) |
|
|
(35,990 |
) |
|
(Decrease) increase in cash during the period |
$ |
(142,569 |
) |
|
$ |
28,827 |
|
|
$ |
(366,458 |
) |
|
$ |
366,522 |
|
|
Cash at beginning of the period |
|
723,341 |
|
|
|
882,875 |
|
|
|
947,230 |
|
|
|
545,180 |
|
|
Cash at end of the period |
$ |
580,772 |
|
|
$ |
911,702 |
|
|
$ |
580,772 |
|
|
$ |
911,702 |
|
The interim consolidated financial statements
for the three months ended September 30, 2022 and 2021 and the
MD&A for the nine months ended September 30, 2022 and 2021
have been filed on SEDAR at www.sedar.com and
EDGAR at www.sec.gov/edgar and are available on
the Company’s website at: www.centerragold.com.
Supplementary Information:
Third Quarter
2022 Exploration Update
Mount Milligan
Mine
The 2022 planned diamond drilling programs at
the Mount Milligan Mine total 49,500 metres in 91 drill holes.
Resource expansion and brownfield exploration targets included
zones on the western margin of the open-pit, i.e., DWBX and
Goldmark zones, and on the eastern margin of the open-pit, i.e.,
Great Eastern Fault (“GEF”) zone, where positive drilling results
were returned in previous drilling campaigns from 2018-2021.
Mount Milligan Brownfield Drilling and
Exploration
Exploration and resource expansion drilling
continued in the third quarter of 2022 with the completion of 32
diamond drill holes totalling 16,653 metres. Resource expansion
drilling included seven drill holes, totalling 3,267 metres, were
completed in the Goldmark and DWBX zones. Three drill holes,
totalling 1,585 metres, were completed in the Great Eastern zones,
testing for both shallow mineralization associated with the GEF,
and deeper porphyry mineralization associated with the underlying
Great Eastern stock. Exploration drilling focused on the northern
margins of the pit in the Oliver zone where 11 drill holes,
totalling 5,681 metres were completed. Exploration drilling was
also completed south and west of the current ultimate pit boundary
in the Boundary zone including two drill holes totalling 1,110
metres; the South Boundary zone, including six drill holes
totalling 2,903 metres; the Southern Star zone including one drill
hole totalling 812 metres; and the North Slope zone including two
drill holes totalling 1,295 metres.
Throughout the third quarter of 2022, complete
or partial assay results were returned for 36 drill holes,
including results from one hole drilled in the first quarter of
2022, and 17 holes drilled in the second quarter of 2022, and 18
holes drilled in the third quarter of 2022. These include potential
significant mineralization from the western margin of the open-pit
in the DWBX and Goldmark zones, the eastern margin of the open-pit
in the Great Eastern zones, as well as the northern margin of the
open-pit in the Oliver zone.
Selected significant intersections are reported
below:
DWBX and Goldmark Zones (western margin of
the open-pit)
|
22-1389* |
31.3 metres @ 0.20 g/t Gold (“Au”), 0.16% Copper (“Cu”) from 62.8
metres
44.7 metres @ 0.20 g/t Au, 0.31% Cu from 269.4 metres
40.0 metres @ 0.21 g/t Au, 0.05% Cu from 430.0 metres
|
|
22-1392* |
21.0 metres @ 0.53 g/t Au, 0.07% Cu from 119.0 metres
including 3.4 metres @ 2.46 g/t Au, 0.04% Cu from 132.6
metres
24.0 metres @ 0.70 g/t Au, 0.09% Cu from 146.0 metres
including 9.0 metres @ 1.55 g/t Au, 0.21% Cu from 156.0
metres
and 3.0 metres @ 3.69 g/t Au, 0.11% Cu from 160.0
metres
38.0 metres @ 0.16 g/t Au, 0.15% Cu from 326.0 metres
17.2 metres @ 6.05 g/t Au, 0.13% Cu from 370.0 metres
including 2.0 metres @ 50.7 g/t Au, 0.21% Cu from 378.0
metres
67.2 metres @ 0.38 g/t Au, 0.23% Cu from 407.0 metres
including 2.2 metres @ 6.84 g/t Au, 0.52% Cu from 415.0
metres
41.9 metres @ 2.45 g/t Au, 0.03% Cu from 688.0 metres
including 6.0 metres @ 1.19 g/t Au, 0.00% Cu from 710.0
metres
and 6.0 metres @ 14.13 g/t Au, 0.18% Cu from 722.0
metres |
|
22-1396* |
255.0 metres @ 0.21 g/t Au, 0.33% Cu from 202.0 metres
154.0 metres @ 0.36 g/t Au, 0.26% Cu from 473.0 metres
including 3.0 metres @ 7.62 g/t Au, 0.10% Cu from 489.0
metres |
|
22-1398* |
98.0 metres @ 0.14 g/t Au, 0.29% Cu from 217.0 metres
31.5 metres @ 0.08 g/t Au, 0.13% Cu from 321.0 metres
26.4 metres @ 1.17 g/t Au, 0.18% Cu from 412.0 metres
including 1.6 metres @ 2.21 g/t Au, 0.31% Cu from 414.5
metres
and 3.3 metres @ 5.42 g/t Au, 0.25% Cu from 426.7
metres
and 2.0 metres @ 1.76 g/t Au, 0.17% Cu from 435.0
metres
68.0 metres @ 0.15 g/t Au, 0.20% Cu from 490.0 metres |
|
22-1399* |
41.5 metres @ 0.23 g/t Au, 0.03% Cu from 90.5 metres
96.0 metres @ 0.36 g/t Au, 0.42% Cu from 164.0 metres
including 2.0 metres @ 2.11 g/t Au, 0.17% Cu from 206.0
metres
and 6.0 metres @ 1.02 g/t Au, 0.70% Cu from 214.0
metres
17.6 metres @ 0.35 g/t Au, 0.05% Cu from 330.2 metres
including 1.8 metres @ 2.09 g/t Au, 0.02% Cu from 346.0
metres
68.0 metres @ 0.18 g/t Au, 0.27% Cu from 456.0 metres
58.0 metres @ 0.17 g/t Au, 0.13% Cu from 664.0 metres |
|
22-1400* |
6.5 metres @ 1.64 g/t Au, 0.04% Cu from 16.5 metres
including 1.0 metres @ 8.8 g/t Au, 0.01% Cu from 16.5
metres
10.0 metres @ 0.54 g/t Au, 0.10% Cu from 34.0 metres
including 2.0 metres @ 1.9 g/t Au, 0.06% Cu from 40.0
metres
47.0 metres @ 0.15 g/t Au, 0.42% Cu from 225.0 metres
22.0 metres @ 0.25 g/t Au, 0.73% Cu from 251.0 metres
21.0 metres @ 0.32 g/t Au, 0.10% Cu from 435.0 metres
including 2.0 metres @ 1.16 g/t Au, 0.12% Cu from 441.0
metres
and 0.9 metres @ 1.81 g/t Au, 0.00% Cu from 447.0
metres
133.0 metres @ 0.19 g/t Au, 0.28% Cu from 520.0 metres |
|
22-1404* |
42.3 metres @ 0.12 g/t Au, 0.24% Cu from 12.7 metres
51.9 metres @ 0.23 g/t Au, 0.30% Cu from 190.0 metres
20.3 metres @ 0.20 g/t Au, 0.23% Cu from 247.7 metres
46.0 metres @ 0.17 g/t Au, 0.24% Cu from 466.0 metres
44.7 metres @ 0.25 g/t Au, 0.23% Cu from 591.3 metres |
Great Eastern Zones (eastern margin of the open-pit)
|
22-1402* |
34.0 metres @ 0.55 g/t Au, 0.20% Cu from 263.0 metres
including 1.4 metres @ 1.61 g/t Au, 0.17% Cu from 263.0
metres
and 4.0 metres @ 1.17 g/t Au, 0.54% Cu from 286.0
metres
138.0 metres @ 0.31 g/t Au, 0.12% Cu from 306.0 metres
including 2.0 metres @ 1.16 g/t Au, 0.00% Cu from 374.0
metres
and 2.0 metres @ 1.04 g/t Au, 0.63% Cu from 400.0
metres
and 2.0 metres @ 1.06 g/t Au, 0.58% Cu from 408.0
metres
20.0 metres @ 0.31 g/t Au, 0.21% Cu from 463.0 metres
including 2.0 metres @ 1.30 g/t Au, 0.82% Cu from 477.0
metres
40.8 metres @ 1.07 g/t Au, 0.29% Cu from 511.3 metres
including 1.8 metres @ 17.3 g/t Au, 0.30% Cu from 511.3
metres
and 1.7 metres @ 1.68 g/t Au, 0.15% Cu from 528.3
metres |
|
22-1406 |
57.9 metres @ 0.13 g/t Au, 0.08% Cu from 297.0 metres
28.0 metres @ 0.52 g/t Au, 0.36% Cu from 360.0 metres
27.8 metres @ 0.12 g/t Au, 0.16% Cu from 483.2 metres |
|
22-1408 |
21.2 metres @ 0.33 g/t Au, 0.32% Cu from 21.0 metres
16.9 metres @ 0.21 g/t Au, 0.17% Cu from 49.0 metres
30.0 metres @ 0.24 g/t Au, 0.06% Cu from 80.2 metres
52.2 metres @ 0.18 g/t Au, 0.28% Cu from 188.3 metres |
|
22-1410 |
31.0 metres @ 0.16 g/t Au, 0.16% Cu from 333.0 metres
45.1 metres @ 0.17 g/t Au, 0.28% Cu from 387.0 metres
75.4 metres @ 0.15 g/t Au, 0.24% Cu from 491.7 metres |
Oliver Zone (northern margin of the open-pit)
|
22-1409 |
29.7 metres @ 0.29 g/t Au, 0.01% Cu from 123.0 metres
including 2.0 metres @ 1.37 g/t Au, 0.02% Cu from 123.0
metres
87.0 metres @ 0.57 g/t Au, 0.02% Cu from 178.0 metres
including 4.0 metres @ 1.18 g/t Au, 0.02% Cu from 200.0
metres
and 0.9 metres @ 4.84 g/t Au, 0.02% Cu from 211.5
metres
and 12.0 metres @ 1.54 g/t Au, 0.01% Cu from 217.0
metres
and 1.7 metres @ 1.31 g/t Au, 0.06% Cu from 251.3
metres |
|
22-1415 |
45.0 metres @ 0.33 g/t Au, 0.02% Cu from 387.0 metres
including 2.1 metres @ 2.71 g/t Au, 0.00% Cu from 420.0
metres
57.4 metres @ 0.39 g/t Au, 0.05% Cu from 473.6 metres
including 2.0 metres @ 2.06 g/t Au, 0.02% Cu from 520.0
metres
and 4.0 metres @ 1.59 g/t Au, 0.42% Cu from 527.0
metres |
|
22-1416 |
21.0 metres @ 0.19 g/t Au, 0.11% Cu from 18.0 metres
24.0 metres @ 0.14 g/t Au, 0.05% Cu from 45.0 metres
43.0 metres @ 0.24 g/t Au, 0.09% Cu from 76.0 metres
27.0 metres @ 0.35 g/t Au, 0.14% Cu from 153.1 metres
36.1 metres @ 0.29 g/t Au, 0.02% Cu from 429.5 metres
85.0 metres @ 0.16 g/t Au, 0.24% Cu from 516.0 metres |
|
22-1422 |
100.0 metres @ 0.63 g/t Au, 0.12% Cu from 97.0 metres
including 1.5 metres @ 3.04 g/t Au, 0.09% Cu from 112.4
metres
and 7.0 metres @ 3.43 g/t Au, 0.05% Cu from 118.0
metres
and 7.1 metres @ 1.37 g/t Au, 0.11% Cu from 141.0
metres
and 1.1 metres @ 5.45 g/t Au, 0.13% Cu from 157.7
metres |
South Boundary Zone (west of the open-pit)
|
22-1411 |
16.6 metres @ 0.59 g/t Au, 0.04% Cu from 112.4 metres
including 1.7 metres @ 1.14 g/t Au, 0.13% Cu from 114.0
metres
and 2.0 metres @ 2.33 g/t Au, 0.05% Cu from 121.0
metres
33.7 metres @ 0.54 g/t Au, 0.02% Cu from 278.9 metres
including 1.8 metres @ 1.45 g/t Au, 0.01% Cu from 287.2
metres
and 4.0 metres @ 1.61 g/t Au, 0.02% Cu from 299.0
metres
and 1.6 metres @ 2.33 g/t Au, 0.10% Cu from 311.0
metres |
The above mineralized intercepts were
calculated using a cut-off grade of 0.1 g/t Au or 0.1% Cu and a
maximum internal dilution interval of 4.0 metres. Higher grade
sub-intervals are greater than 1.00 g/t Au. Significant assay
intervals reported represent apparent widths due to the undefined
geometry of mineralization in this zone, relationship between fault
blocks, and conceptual nature of the exploration target. “*”
Indicates a drill hole completed in previous quarters, assay
results returned in current quarter. Drill collar locations and
associated graphics are available at the following
link: https://ml.globenewswire.com/media/b54b7caa-fb95-4b8b-99ad-1ac639294106/document/?v=11042022080500.
Assays returned throughout the third quarter of
2022 show potential for both shallow and deep resource addition
west of the ultimate pit boundary in the Goldmark zone and the
underlying DWBX zone. The Goldmark zone is centered on the
westerly-dipping Goldmark monzonite porphyry stock and dyke complex
that overlies the western extension of the DWBX composite stock and
associated mineralization. Shallow porphyry-style gold-copper
mineralization is concentrated at the margins of dykes and the
Goldmark stock, and at greater depth (~450 m and deeper) at the
margins of the underlying DWBX stock. High gold-low copper style
mineralization occurs throughout the zone and at shallow
levels.
Drilling in the Great Eastern zones throughout
2019-2022 continued to develop two targets, a shallow target
associated with the GEF, and an underlying target associated with
the recently discovered Great Eastern stock. Encouraging assay
results from the GEF shallow target indicate the potential for near
surface mineralization on the eastern margin of the current
pit.
Exploration drilling in the Oliver zone, along
the northern and northwestern margins of the ultimate pit boundary,
was completed in the third quarter of 2022. Assays returned
throughout the third quarter of 2022 show potential for both
shallow and deep resource addition adjacent to and below the
current ultimate pit boundary.
Öksüt Mine
The 2022 planned diamond and RC drilling
programs at the Öksüt Mine total 40,000 metres in 204 drill holes.
In the third quarter of 2022, resource infill and expansion
drilling continued at the Öksüt Mine for a total of 15,840 metres
in 43 diamond and 18 RC drill holes.
Drilling activities during the quarter were
mainly undertaken at the Keltepe, Güneytepe, Keltepe North, Keltepe
Northwest, and Keltepe North-Northwest deposits with the aim of
expanding the known oxide gold mineralization resources, also
continued with testing peripheral targets such as Yelibelen and
Büyüktepe prospects.
Selected significant intersections are reported
below:
Keltepe North (Oxide gold)
|
ODD0667 |
24.6 metres @ 0.43 g/t Au from 194.0 metres |
|
ODD0669 |
5.5 metres @ 0.21 g/t Au from 232.5 metres
16.6 metres @ 0.27 g/t Au from 263.0 metres |
|
ODD0675 |
15.5 metres @ 0.22 g/t Au from 166.9 metres |
|
ODD0681 |
15.5 metres @ 0.54 g/t Au from 219.9 metres |
|
ODD0685A |
14.8 metres @ 0.32 g/t Au from 182.0 metres
11.9 metres @ 0.43 g/t Au from 219.8 metres
39.2 metres @ 0.24 g/t Au from 244.0 metres
11.2 metres @ 0.29 g/t Au from 299.0 metres |
Keltepe Northwest (Oxide gold)
|
ODD0690 |
17.0 metres @ 0.21 g/t Au from 155.0 metres (sulphide) |
|
ODD0692 |
24.8 metres @ 0.22 g/t Au from 19.2 metres
8.0 metres @ 0.20 g/t Au from 68.1 metres |
|
ODD0703 |
8.0 metres @ 0.30 g/t Au from 53.7 metres
7.7 metres @ 0.36 g/t Au from 84.0 metres
|
Keltepe North-Northwest (Oxide gold)
|
ODD0672 |
9.7 metres @ 0.33 g/t Au from 286.4 metres |
|
ODD0679 |
20.4 metres @ 0.27 g/t Au from 153.0 metres
9.0 metres @ 0.23 g/t Au from 230.5 metres (sulphide) |
|
ODD0683 |
24.7 metres @ 0.34 g/t Au from 89.0 metres
21.8 metres @ 0.25 g/t Au from 133.5 metres (sulphide)
9.1 metres @ 0.29 % Cu from 154.2 metres |
|
ODD0688 |
5.3 metres @ 0.32 g/t Au from 69.0 metres (oxide) |
|
ODD0699 |
6.0 metres @ 0.38 g/t Au from 170.0 metres (partially oxide) |
Keltepe (Oxide gold)
|
ODD0668 |
5.6 metres @ 0.27 g/t Au from 136.3 metres |
|
ODD0671 |
19.6 metres @ 0.30 g/t Au from 146.7 metres
5.8 metres @ 0.37 g/t Au from 208.5 metres |
Güneytepe (Oxide gold)
|
ODD0677 |
7.4 metres @ 0.22 g/t Au from 72.8 metres
7.4 metres @ 0.79 g/t Au from 132.1 metres |
Büyüktepe (Oxide gold)
|
ODD0673 |
7.0 m @ 0.32 g/t Au from 348.4 m (oxide) |
The above mineralized intercepts were
calculated using a cut-off grade of 0.2 g/t Au and a maximum
internal dilution interval of 5.0 metres. Higher grade
sub-intervals are greater than 1.00 g/t Au. The true widths of the
mineralized intervals reported represent approximately 60% to 90%
of the stated downhole interval. Oxidation assignment is a visual
discrimination from core logging. Drill collar locations and
associated graphics are available at the following
link: https://ml.globenewswire.com/media/b54b7caa-fb95-4b8b-99ad-1ac639294106/document/?v=11042022080500.
A full listing of the drill results, drill hole
locations and plan map (including the azimuth, dip of drill holes,
and depth of the sample intervals) for the Öksüt Mine have been
filed on SEDAR at www.sedar.com and
EDGAR at www.sec.gov/edgar and are available on
the Company’s website at www.centerragold.com.
Other Projects
Türkiye
Sivritepe
The planned 2022 drilling program continued at
the Sivritepe project in the third quarter with the completion of
29 diamond drill holes for 8,692 metres. Drilling mainly targeted
the extensions of known mineralization with infill and step-out
holes at the Karaburun Main and Kızılçıbık prospects. Also,
previously untested gold-in-soil geochemical anomalism was drilled
at new targets called Karaburun South and Soğukpınar. At Karaburun,
drilling returned several significant intercepts of >1 g/t Au
along a NW-SE trend. Exploration drilling will continue in the
fourth quarter.
Selected significant intersections are reported
below:
Karaburun Main Prospect (sulphide
gold)
|
STE0043A |
19.9 metres @ 1.19 g/t Au from 46.1 metres
including 1.0 metres @ 3.04 g/t Au from 46.1 metres
and 3.0 metres @ 1.24 g/t Au from 51.3 metres
and 1.1 metres @ 1.05 g/t Au from 55.4 metres
and 2.0 metres @ 6.61 g/t Au from 63.0 metres
16.9 metres @ 0.80 g/t Au from 76.0 metres (partially oxidized)
including 1.0 metres @ 1.08 g/t Au from 80.5 metres
6.0 metres @ 1.56 g/t Au from 85.7 metres
1.0 metres @ 3.30 g/t Au from 100.5 metres |
|
STE0052A |
28.0 metres @ 0.81 g/t Au from 209.0 metres
including 1.0 metres @ 1.18 g/t Au from 211.0 metres
and 1.0 metres @ 1.03 g/t Au from 216.0 metres
and 2.0 metres @ 1.35 g/t Au from 222.0 metres
and 8.0 metres @ 1.3 g/t Au from 228.0 metres |
Karaburun South Prospect (sulphide gold)
|
STE0047 |
16.6 metres @ 0.58 g/t Au from 98.0 metres
including 1.0 metres @ 1.23 g/t Au from 90.5 metres
and 3.6 metres @ 1.46 g/t Au from 111.0 metres |
|
STE0048 |
1.0 metres @ 8.17 g/t Au from 88.0 metres
6.0 metres @ 1.19 g/t Au from 121.5 metres
including 1.0 metres @ 6.38 g/t Au from 125.5 metres |
|
STE0050 |
13.0 metres @ 0.22 g/t Au from 53.0 metres
5.0 metres @ 0.21 g/t Au from 223.5 metres
7.0 metres @ 1.06 g/t Au from 281.0 metres
including 1.0 metres @ 4.11 g/t Au from 281.0 metres
1.2 metres @ 1.71 g/t Au from 285.5 metres |
The above mineralized intercepts were
calculated using a cut-off grade of 0.2 g/t Au and a maximum
internal dilution interval of 5.0 metres. The true widths of the
mineralized intervals reported represent approximately 60%-90% of
the stated downhole interval. Drill collar locations and associated
graphics are available at the following
link: https://ml.globenewswire.com/media/b54b7caa-fb95-4b8b-99ad-1ac639294106/document/?v=11042022080500.
Qualified Person & QA/QC –
Exploration
Exploration information and related scientific
and technical information in this document regarding the Mount
Milligan Mine were prepared in accordance with the standards of NI
43-101 and were prepared, reviewed, verified, and compiled by
Cheyenne Sica, Member of the Association of Professional
Geoscientists Ontario and Member of Engineers and Geoscientists
British Columbia, Exploration Manager at Centerra’s Mount Milligan
Mine, who is the qualified person for the purpose of NI 43-101.
Sample preparation, analytical techniques, laboratories used, and
quality assurance and quality control protocols used during the
exploration drilling programs are done consistent with industry
standards while independent certified assay labs are used. The
Mount Milligan Mine’s deposit is described in the 2021 AIF and a
technical report dated March 26, 2020 (with an effective date of
December 31, 2019) prepared in accordance with NI 43-101, both of
which are available on SEDAR at www.sedar.com and
EDGAR at www.sec.gov/edgar.
Exploration information, and related scientific
and technical information, in this document, with respect to the
Öksüt Mine and the Sivritepe Project, were prepared, reviewed,
verified and compiled in accordance with NI 43-101 by Malcolm
Stallman, Member of the Australian Institute of Geoscientists and
Vice President, Exploration at Centerra Gold Inc., who is the
qualified person for the purpose of NI 43-101. Sample preparation,
analytical techniques, laboratories used, and quality assurance and
quality control protocols used during the exploration drilling
programs are done consistent with industry standards while
independent certified assay labs are used. The Öksüt deposit is
described in the Company’s 2021 AIF, which is available on SEDAR at
www.sedar.com and
EDGAR at www.sec.gov/edgar, and
in a technical report dated September 3, 2015 (with an effective
date of June 30, 2015) prepared in accordance with NI 43-101, which
is available on SEDAR at www.sedar.com.
A PDF accompanying this announcement is available
at
http://ml.globenewswire.com/Resource/Download/bc042b99-e917-4e4e-8884-ed41f7b6214f
Charts accompanying this announcement are available
at
https://www.globenewswire.com/NewsRoom/AttachmentNg/c0f64d73-e0cd-4e6a-9160-137aa90ea476
https://www.globenewswire.com/NewsRoom/AttachmentNg/0476e040-d4e1-42d7-a2fd-d514c17fd213
https://www.globenewswire.com/NewsRoom/AttachmentNg/77bea18e-dbd4-47ec-8ef4-4b48636d7fe0
https://www.globenewswire.com/NewsRoom/AttachmentNg/72c5ec97-f4f8-4310-90ef-00cca67672d5
https://www.globenewswire.com/NewsRoom/AttachmentNg/b90afda0-2ab2-41a1-b55a-e35300a66002
https://www.globenewswire.com/NewsRoom/AttachmentNg/2a8f2766-fccd-4631-8339-35d8228bc50e
https://www.globenewswire.com/NewsRoom/AttachmentNg/3527045d-fbcd-42b6-83c6-5fba59a8f4bc
https://www.globenewswire.com/NewsRoom/AttachmentNg/b78eb97e-a4e2-43bc-acee-fd028edeac7a


Centerra Gold (TSX:CG)
Gráfico Histórico do Ativo
De Fev 2025 até Mar 2025

Centerra Gold (TSX:CG)
Gráfico Histórico do Ativo
De Mar 2024 até Mar 2025

