All figures are in United States dollars.
All production figures reflect payable metal quantities and are on
a 100%-basis, unless otherwise stated. For references denoted with
NG, refer to the “Non-GAAP and Other Financial Measures” disclosure
at the end of this news release for a description of these
measures.
TORONTO, Feb. 23, 2023 (GLOBE NEWSWIRE) --
Centerra Gold Inc. (“Centerra” or the “Company”) (TSX: CG and NYSE:
CGAU) today reported its fourth quarter and full-year 2022
results.
Significant financial and operating results of
the fourth quarter and year ended December 31, 2022 included:
- Net
loss for the quarter of $130.1 million or $0.59 per common
share (basic), including a non-cash impairment loss on the Kemess
Project of $138.2 million (net of tax). The Kemess Project
impairment loss was recorded as the Company is now classifying the
project as non-core with no exploration or development-related
expenditures incurred in 2022 or committed for future years. An
adjusted lossNG of $13.7 million or $0.06 per common
share (basic). Net loss for the year of $77.2 million or $0.29 per
common share (basic) and an adjusted net lossNG of $9.4
million or $0.04 per common share (basic).
- Cash
used in operating activities and free cash flow
deficitNG for the quarter of
$9.8 million and $25.3 million, respectively was primarily due to a
temporary suspension of leaching activities at the Öksüt Mine. Cash
used in operating activities at the Öksüt Mine was $11.9 million
for the quarter with continued mining and stacking of ore. Mount
Milligan Mine generated cash provided by mine operating activities
and free cash flowNG of $26.5 million and $15.6 million
for the quarter, respectively. Cash used in operating activities
and free cash flow deficitNG for the year were $2.0
million and $82.9 million, respectively.
- In
January 2023, the Öksüt Mine received notice of approval of its
operating license extension application for a period of 10
years as well as approval of an enlarged grazing land
permit to allow expansion of the open pits. The regulatory review
of Öksüt Mine’s amended Environmental Impact Assessment (“EIA”),
which was submitted in mid-January 2023 for regulatory review,
remains on track.
- The Company’s mercury
abatement retrofit to the Öksüt Mine’s ADR plant is
complete. Upon restart of the ADR plant, and after
receiving regulatory approvals, the Company will be in a position
to process the gold-in-carbon inventory on hand of approximately
100,000 recoverable ounces. The ADR plant has capacity to produce
gold at a rate of approximately 35,000 ounces per month.
- The
Company continues to evaluate strategic options for the Molybdenum
Business Unit, including a potential restart of the
Thompson Creek Mine with improving global molybdenum
prices. The Company plans to issue a
Prefeasibility Study (“PFS”) on a restart of the Thompson Creek
Mine in the third quarter of 2023.
- Goldfield
Project drilling activities continued in the fourth
quarter of 2022. The Company plans to issue an initial resource
estimate by mid-year 2023 followed by an updated resource estimate
accompanied by a Feasibility Study.
- The
Company completed full rollout of Responsible Gold Mining
Principles in the fourth quarter of 2022.
- Strong balance
sheet with a cash position at the year-end of $531.9
million.
- Returns to
shareholders of $22.6 million for the quarter and $58.9
million for the year, through dividends and the buyback of shares
under a Normal Course Issuer Bid (“NCIB”).
- Gold
production for the quarter of 53,222 ounces, solely from
the Mount Milligan Mine.
- Copper
production for the quarter of 16.9 million pounds.
- Gold
production costs for the quarter of $790 per ounce.
- Copper
production costs for the quarter of $2.00 per pound.
- All-in
sustaining costs on a by-product
basisNG for the quarter of
$987 per ounce.
- All-in costs
on a by-product basisNG for
the quarter of $1,572 per ounce due to higher exploration and
project development costs incurred primarily at the Company’s
Goldfield Project.
- Quarterly
Dividend declared of CAD$0.07 per common share.
The Company’s 2022 full-year results on a
continuing basis, and previously disclosed full-year 2022 guidance
are summarized below:
|
|
|
2022
Guidance |
2022
Full-Year
results |
2022
Guidance |
2022
Full-Year
results |
|
|
|
Mount
Milligan |
Mount
Milligan |
Consolidated |
Consolidated |
|
Production |
|
|
|
|
|
|
Total gold production |
(Koz) |
190 - 210 |
189 |
245 - 265 |
244 |
|
Total copper production |
(Mlb) |
70 - 80 |
74 |
70 - 80 |
74 |
|
Costs |
|
|
|
|
|
|
Gold production costs |
($/oz) |
775 - 825 |
767 |
675 - 725 |
681 |
|
All-in sustaining costs on a by-product basisNG |
($/oz) |
775 - 825 |
630 |
1,000 - 1,050 |
860 |
|
All-in costs on a by-product basisNG |
($/oz) |
825 - 875 |
704 |
1,225 - 1,275 |
1,201 |
|
All-in sustaining costs on a co-product basisNG |
($/oz) |
1,000 - 1,050 |
956 |
1,175 - 1,225 |
1,112 |
|
Copper production costs |
($/lb) |
1.55 - 1.70 |
1.70 |
1.55 - 1.70 |
1.70 |
|
All-in sustaining costs on a co-product basisNG |
($/lb) |
2.25 - 2.40 |
2.12 |
2.25 - 2.40 |
2.12 |
CEO Discussion
Paul Wright, Interim President and Chief
Executive Officer of Centerra stated, “In 2022, the Company
continued to demonstrate that safety remains Centerra’s top
priority, with a number of our sites achieving milestones without a
lost time injury. We put a strategy in place to improve safety
performance at the Mount Milligan Mine during the year and
subsequent to the year-end, the Mount Milligan Mine’s team achieved
one million hours worked without a lost time injury.”
“Despite all other challenges in 2022, I want to
highlight Mount Milligan Mine’s record annual mill throughput in
2022 of 21.3 million tonnes. The Company continues to optimize the
life of mine plan for Mount Milligan and anticipates increases in
both gold and copper production for 2024 and 2025 when compared to
the annual figures included in the most recent Technical Report for
the mine. To streamline our corporate structure, we recently
implemented changes that will lead to the closure of our regional
Prince George office and reduced workforce levels at the corporate
office in Toronto.”
“I’m also pleased to say that steady progress is
being made at the Öksüt Mine toward a restart of operations. The
retrofit of the ADR plant at the Öksüt Mine, was completed early in
2023, and we continue to work with the Turkish officials on the
restart of gold room operations at the ADR plant as well as an
updated EIA for the mine. We have received a 10-year operating
license extension for the Öksüt Mine as well as the approval of an
enlarged grazing land permit. The people of Türkiye continue to
deal with the devastating impact of the earthquakes and aftershocks
that occurred in the southeastern portion of the country in early
February. An emergency response team from the Öksüt Mine assisted
the Turkish state emergency preparedness authorities and regional
disaster response organizations during the search and rescue stage.
The Company continues to provide equipment and material support to
the ongoing recovery activities where possible. Centerra offers its
condolences to the people of Türkiye and all those that have lost
loved ones in this natural disaster.”
Update on Öksüt Mine
Operations
In March 2022, Centerra announced it had
temporarily suspended gold doré bar production at the Öksüt Mine
due to mercury detected in the gold room at the ADR plant. From the
date of suspension of gold room operations through to August 2022,
the Company continued to process ore into gold-in-carbon and had
approximately 100,000 recoverable ounces of stored gold-in-carbon
as of December 31, 2022, having incurred substantially all
associated production costs (excluding royalty charges). In
addition, the Öksüt Mine had approximately 200,000 recoverable
ounces of gold in ore stockpiles and on the heap leach pad as at
December 31, 2022. The Company has completed construction of a
mercury abatement system to allow processing of mercury-bearing
ores with capital costs below the original $5 million budget and it
continues to work with relevant authorities to obtain the required
approvals to restart gold room operations at the ADR plant. Once
operations resume, the ADR plant is expected to have sufficient
production capacity to process up to approximately 35,000 ounces of
gold per month.
Permitting
Following inspection by the Ministry of
Environment, Urbanization and Climate Change (the “Ministry of
Environment”) and several further discussions, the Company
determined that an updated EIA should be prepared and submitted to
clarify various production and other capacity limits and to align
the EIA production levels with current operating plans. The Öksüt
Mine suspended leaching of ore on the heap leach pad and ceased
using activated carbon on site effective late August 2022 though
mining, crushing and stacking activities continued in line with
existing EIA limits for the remainder of 2022.
The Öksüt Mine has built substantial inventories
of gold-in-carbon, ore stacked on the heap leach pad and ore
stockpiles and has therefore paused crushing and stacking
activities. The Öksüt Mine is currently focusing mining activities
on the Phase 5 pit wall pushback to expand the Keltepe pit.
The Öksüt Mine’s application to update its EIA
was submitted to regulators at the end of August 2022 and the new
updated EIA was submitted in January 2023. The Company is working
with Turkish officials and other stakeholders on the regulatory
review and approval of its EIA and other permits that may be
required to allow for a timely full restart of all operations.
In January 2023, the Öksüt Mine received notice
of approval of its operating license extension application for a
period of 10 years as well as approval of an enlarged grazing land
permit to allow expansion of the Keltepe and Güneytepe pits as
planned.
Exploration Update
Exploration activities in the fourth quarter of
2022 included drilling, surface sampling, geological mapping and
geophysical surveying at the Company’s various projects and earn-in
properties, targeting gold and copper mineralization in Canada,
Türkiye, and the United States of America. Exploration expenditures
in the fourth quarter of 2022 were $16.2 million. The activities
were primarily focused on expanded drilling programs at the Mount
Milligan Mine in British Columbia, the Öksüt Mine in Türkiye, the
Goldfield Project in Nevada, and greenfield projects in the USA and
Türkiye.
At the Mount Milligan Mine, 27 diamond drill
holes, totalling 10,516 metres, were completed in the fourth
quarter of 2022, including brownfield exploration drilling (8,003
metres in 17 drill holes) and resource expansion drilling (2,513
metres in ten drill holes). The 2022 drill programs at the Mount
Milligan Mine targeted porphyry-style gold-copper mineralization
below and adjacent to the current ultimate open-pit boundary, as
well as continued to test targets with potential for shallower
porphyry-style gold-copper mineralization and high gold-low copper
style mineralization peripheral to the current pits.
The planned 2023 exploration drilling programs
at the Mount Milligan Mine are expected to commence late in the
first quarter of 2023, targeting porphyry-style gold-copper
mineralization on the northern and southwestern margins of the
current ultimate open pit, and peripheral greenfield targets within
the Mount Milligan claim block.
At the Öksüt Mine, 43 diamond drill holes and 18
reverse circulation (“RC”) drill holes, totalling 15,840 metres,
were completed in the fourth quarter of 2022. Exploration drilling
activities were mainly undertaken at the Keltepe, Güneytepe,
Keltepe North, Keltepe Northwest, and Keltepe North-Northwest
deposits with the aim of expanding known oxide gold mineralization
resources. Drilling also continued testing peripheral targets, such
as the Yelibelen, Büyüktepe, and Boztepe prospects.
The planned 2023 exploration drilling programs
at the Öksüt Mine are expected to commence early in the second
quarter of 2023, targeting oxide gold mineralisation proximal to
the known deposits and the potential for porphyry-style gold-
copper mineralization at depth within the property.
At the Goldfield Project, 21 diamond drill holes
and 134 RC drill holes, totaling 35,259 metres of drilling, were
completed in the fourth quarter of 2022. Completed holes include
26,590 metres in 117 exploration, infill, and resource expansion
holes, 3,995 metres in 18 condemnation drill holes, 2,920 metres in
ten metallurgical holes, 1,512 metres in eight geotechnical holes,
and two water monitoring wells for 241 metres.
The planned 2023 exploration drilling programs
at the Goldfield Project commenced early in the first quarter of
2023, principally targeting extensions to gold mineralization
proximal to the known deposits.
Conference Call
Centerra invites you to join its 2022 fourth
quarter conference call on Friday, February 24, 2023 at 9:00 AM
Eastern Time. The call is open to all investors and the media. To
join the call, please dial toll-free in North America 1 (877)
210-1510. International participants may access the call at +1
(416) 620-9188. Results summary presentation slides are available
on Centerra’s website at www.centerragold.com.
Alternatively, an audio feed webcast will be broadcast live by
Notified and can be accessed live at Centerra’s website at www.centerragold.com. A
recording of the call will be available after the call and via
telephone until midnight Eastern Standard Time on March 10, 2023 by
calling +1 (416) 626-4100 or (800) 558-5253 and using passcode
22026083.
Non-GAAP and Other Financial Measures
This document contains “specified financial
measures” within the meaning of NI 52-112, specifically the
non-GAAP financial measures and non-GAAP ratios described below.
Management believes that the use of these measures assists
analysts, investors and other stakeholders of the Company in
understanding the costs associated with producing gold and copper,
understanding the economics of gold and copper mining, assessing
operating performance, the Company’s ability to generate free cash
flow from current operations and on an overall Company basis, and
for planning and forecasting of future periods. However, the
measures have limitations as analytical tools as they may be
influenced by the point in the life cycle of a specific mine and
the level of additional exploration or other expenditures a company
has to make to fully develop its properties. The specified
financial measures used in this document do not have any
standardized meaning prescribed by IFRS and may not be comparable
to similar measures presented by other issuers, even as compared to
other issuers who may be applying the World Gold Council (“WGC”)
guidelines. Accordingly, these specified financial measures should
not be considered in isolation, or as a substitute for, analysis of
the Company’s recognized measures presented in accordance with
IFRS.
Definitions:
The following is a description of the non-GAAP
financial measures and non-GAAP ratios used in this news
release:
- All-in
sustaining costs on a by-product basis per ounce is a non-GAAP
ratio calculated as all-in sustaining costs on a by-product basis
divided by ounces of gold sold. All-in sustaining costs on a
by-product basis is a non-GAAP financial measure calculated as the
aggregate of production costs as recorded in the consolidated
statements of loss, refining and transport costs, the cash
component of capitalized stripping and sustaining capital
expenditures, lease payments related to sustaining assets,
corporate general and administrative expenses, accretion expenses,
asset retirement depletion expenses, copper and silver revenue and
the associated impact of hedges of by-product sales revenue (added
in the current period and applied retrospectively to the previous
period). When calculating all-in sustaining costs on a by-product
basis, all revenue received from the sale of copper from the Mount
Milligan Mine, as reduced by the effect of the copper stream, is
treated as a reduction of costs incurred. A reconciliation of
all-in sustaining costs on a by-product basis to the nearest IFRS
measure is set out below. Management uses these measures to monitor
the cost management effectiveness of each of its operating
mines.
- All-in
sustaining costs on a co-product basis per ounce of gold or per
pound of copper, is a non-GAAP ratio calculated as all-in
sustaining costs on a co-product basis divided by ounces of gold or
pounds of copper sold, as applicable. All-in sustaining costs on a
co-product basis is a non-GAAP financial measure based on an
allocation of production costs between copper and gold based on the
conversion of copper production to equivalent ounces of gold. The
Company uses a conversion ratio for calculating gold equivalent
ounces for its copper sales calculated by multiplying the copper
pounds sold by estimated average realized copper price and dividing
the resulting figure by estimated average realized gold price. For
the fourth quarter and year ended December 31, 2022, 394 pounds and
450 pounds, respectively, of copper were equivalent to one ounce of
gold. A reconciliation of all-in sustaining costs on a co-product
basis to the nearest IFRS measure is set out below. Management uses
these measures to monitor the cost management effectiveness of each
of its operating mines.
- Sustaining
capital expenditures and Non-sustaining capital
expenditures are non-GAAP financial measures. Sustaining
capital expenditures are defined as those expenditures required to
sustain current operations and exclude all expenditures incurred at
new operations or major projects at existing operations where these
projects will materially benefit the operation. Non-sustaining
capital expenditures are primarily costs incurred at ‘new
operations’ and costs related to ‘major projects at existing
operations’ where these projects will materially benefit the
operation. A material benefit to an existing operation is
considered to be at least a 10% increase in annual or life of mine
production, net present value, or reserves compared to the
remaining life of mine of the operation. A reconciliation of
sustaining capital expenditures and non-sustaining capital
expenditures to the nearest IFRS measures is set out below.
Management uses the distinction of the sustaining and
non-sustaining capital expenditures as an input into the
calculation of all-in sustaining costs per ounce and all-in costs
per ounce.
- All-in
costs on a by-product
basis per ounce is a non-GAAP ratio
calculated as all-in costs on a by-product basis divided by ounces
sold. All-in costs on a by-product basis is a non-GAAP financial
measure which includes all-in sustaining costs on a by-product
basis, exploration and study costs, non-sustaining capital
expenditures, care and maintenance and predevelopment costs. A
reconciliation of all-in costs on a by-product basis to the nearest
IFRS measures is set out below. Management uses these measures to
monitor the cost management effectiveness of each of its operating
mines.
- Adjusted net
(loss) earnings is a non-GAAP financial measure calculated by
adjusting net (loss) earnings as recorded in the consolidated
statements of loss and comprehensive loss for items not associated
with ongoing operations. The Company believes that this generally
accepted industry measure allows the evaluation of the results of
continuing income-generating capabilities and is useful in making
comparisons between periods. This measure adjusts for the impact of
items not associated with ongoing operations. A reconciliation of
adjusted net (loss) earnings to the nearest IFRS measures is set
out below. Management uses this measure to monitor and plan for the
operating performance of the Company in conjunction with other data
prepared in accordance with IFRS.
- Free cash
flow (deficit) from operations is a non-GAAP financial measure
calculated as cash provided by operating activities from continuing
operations less property, plant and equipment additions. A
reconciliation of free cash flow from continuing operations to the
nearest IFRS measures is set out below. Management uses this
measure to monitor the amount of cash available to reinvest in the
Company and allocate for shareholder returns.
- Free cash
flow (deficit) from mine operations is a non-GAAP financial
measure calculated as cash provided by mine operations less
property, plant and equipment additions. A reconciliation of free
cash flow from mine operations to the nearest IFRS measures is set
out below. Management uses this measure to monitor the degree of
self-funding of each of its operating mines and facilities.
Certain unit costs,
including all-in sustaining costs on a by-product basis (including
and excluding revenue-based taxes) per ounce, are non-GAAP ratios
which include as a component certain non-GAAP financial measures
including all-in sustaining costs on a by-product basis which can
be reconciled as follows:
|
|
Three months ended December 31, |
|
|
Consolidated(2) |
Mount Milligan |
Öksüt |
|
Kumtor |
|
(Unaudited - $millions, unless otherwise
specified) |
2022 |
|
2021 |
|
2022 |
|
2021 |
|
2022 |
2021 |
|
2022 |
2021 |
|
Production costs attributable to gold |
39.0 |
|
49.7 |
|
39.0 |
|
39.3 |
|
— |
10.4 |
|
— |
— |
|
Production costs attributable to copper |
30.8 |
|
30.7 |
|
30.8 |
|
30.7 |
|
— |
— |
|
— |
— |
| Total
production costs excluding molybdenum segment, as reported |
69.8 |
|
80.4 |
|
69.8 |
|
70.0 |
|
— |
10.4 |
|
— |
— |
| Adjust
for: |
|
|
|
|
|
|
|
|
|
| Third
party smelting, refining and transport costs |
3.5 |
|
2.3 |
|
3.5 |
|
2.2 |
|
— |
0.1 |
|
— |
— |
|
By-product and co-product credits |
(54.3 |
) |
(63.8 |
) |
(54.3 |
) |
(63.8 |
) |
— |
— |
|
— |
— |
| Adjusted
production costs |
19.0 |
|
18.9 |
|
19.0 |
|
8.4 |
|
— |
10.5 |
|
— |
— |
| Corporate
general administrative and other costs |
12.1 |
|
7.3 |
|
0.4 |
|
(0.1 |
) |
— |
— |
|
— |
— |
|
Reclamation and remediation - accretion (operating sites) |
1.7 |
|
1.5 |
|
0.5 |
|
0.5 |
|
1.2 |
1.0 |
|
— |
— |
|
Sustaining capital expenditures |
14.5 |
|
24.3 |
|
9.9 |
|
20.2 |
|
4.6 |
4.1 |
|
— |
— |
|
Sustaining leases |
1.5 |
|
1.4 |
|
1.3 |
|
1.3 |
|
0.2 |
0.1 |
|
— |
— |
| All-in
sustaining costs on a by-product basis |
48.8 |
|
53.4 |
|
31.1 |
|
30.3 |
|
6.0 |
15.7 |
|
— |
— |
|
Exploration and evaluation costs |
23.0 |
|
6.4 |
|
2.0 |
|
1.1 |
|
1.4 |
— |
|
— |
— |
|
Non-sustaining capital expenditures(1) |
0.1 |
|
2.4 |
|
0.1 |
|
2.2 |
|
— |
0.2 |
|
— |
— |
| Care and
maintenance and other costs |
5.8 |
|
4.0 |
|
— |
|
— |
|
1.3 |
— |
|
— |
— |
| All-in
costs on a by-product basis |
77.7 |
|
66.2 |
|
33.2 |
|
33.6 |
|
8.7 |
15.9 |
|
— |
— |
| Ounces
sold (000s) |
49.4 |
|
90.3 |
|
49.4 |
|
58.6 |
|
— |
31.7 |
|
— |
— |
| Pounds
sold (millions) |
15.4 |
|
17.2 |
|
15.4 |
|
17.2 |
|
— |
— |
|
— |
— |
| Gold
production costs ($/oz) |
790 |
|
550 |
|
790 |
|
670 |
|
n/a |
328 |
|
— |
— |
| All-in
sustaining costs on a by-product basis ($/oz) |
987 |
|
591 |
|
629 |
|
518 |
|
n/a |
495 |
|
— |
— |
| All-in
costs on a by-product basis ($/oz) |
1,572 |
|
732 |
|
672 |
|
573 |
|
n/a |
501 |
|
— |
— |
| Gold -
All-in sustaining costs on a co-product basis ($/oz) |
1,308 |
|
829 |
|
950 |
|
883 |
|
n/a |
495 |
|
— |
— |
| Copper
production costs ($/pound) |
2.00 |
|
1.79 |
|
2.00 |
|
1.79 |
|
n/a |
n/a |
|
n/a |
n/a |
|
Copper - All-in sustaining costs on a co-product basis
($/pound) |
2.40 |
|
2.34 |
|
2.40 |
|
2.34 |
|
n/a |
n/a |
|
n/a |
n/a |
(1) Non-sustaining capital
expenditures are distinct projects designed to have a significant
increase in the net present value of the mine. In the current
quarter, non-sustaining capital expenditures include costs related
to the installation of the staged flotation reactors at the Mount
Milligan Mine.
Certain unit costs, including all-in
sustaining costs on a by-product basis (including and excluding
revenue-based taxes) per ounce, are non-GAAP ratios which include
as a component certain non-GAAP financial measures including all-in
sustaining costs on a by-product basis which can be reconciled as
follows:
|
|
Years ended December 31, |
|
|
Consolidated(2) |
Mount Milligan |
Öksüt |
|
Kumtor(3) |
|
(Unaudited - $millions, unless otherwise
specified) |
2022 |
|
2021 |
|
2022 |
|
2021 |
|
2022 |
2021 |
|
2022 |
2021 |
|
Production costs attributable to gold |
164.9 |
|
189.9 |
|
143.8 |
|
138.8 |
|
21.1 |
51.1 |
|
— |
72.6 |
|
Production costs attributable to copper |
125.1 |
|
118.0 |
|
125.1 |
|
118.0 |
|
— |
— |
|
— |
— |
| Total
production costs excluding molybdenum segment, as reported |
290.0 |
|
307.9 |
|
268.9 |
|
256.8 |
|
21.1 |
51.1 |
|
— |
72.6 |
| Adjust
for: |
|
|
|
|
|
|
|
|
|
| Third
party smelting, refining and transport costs |
12.1 |
|
11.1 |
|
11.9 |
|
10.1 |
|
0.2 |
1.0 |
|
— |
1.2 |
|
By-product and co-product credits |
(223.8 |
) |
(238.0 |
) |
(223.8 |
) |
(238.0 |
) |
— |
— |
|
— |
— |
| Community
costs related to current operations |
— |
|
— |
|
— |
|
— |
|
— |
— |
|
— |
2.6 |
| Adjusted
production costs |
78.3 |
|
81.0 |
|
57.0 |
|
28.9 |
|
21.3 |
52.1 |
|
— |
76.4 |
| Corporate
general administrative and other costs |
47.8 |
|
27.7 |
|
1.1 |
|
1.0 |
|
— |
— |
|
— |
— |
|
Reclamation and remediation - accretion (operating sites) |
7.2 |
|
4.9 |
|
1.8 |
|
1.8 |
|
5.4 |
3.1 |
|
— |
0.3 |
|
Sustaining capital expenditures |
69.1 |
|
85.5 |
|
53.1 |
|
66.7 |
|
16.0 |
18.8 |
|
— |
60.6 |
|
Sustaining lease payments |
5.8 |
|
5.4 |
|
5.1 |
|
4.8 |
|
0.6 |
0.6 |
|
— |
— |
| All-in
sustaining costs on a by-product basis |
208.2 |
|
204.5 |
|
118.1 |
|
103.2 |
|
43.3 |
74.6 |
|
— |
137.3 |
|
Revenue-based taxes |
— |
|
— |
|
— |
|
— |
|
— |
— |
|
— |
37.0 |
|
Exploration and study costs |
65.7 |
|
23.6 |
|
12.2 |
|
5.6 |
|
3.8 |
2.1 |
|
— |
8.8 |
|
Non-sustaining capital expenditures(1) |
2.1 |
|
5.3 |
|
1.6 |
|
4.1 |
|
— |
0.8 |
|
— |
25.9 |
| Care and
maintenance and other costs |
14.8 |
|
14.1 |
|
— |
|
— |
|
1.7 |
— |
|
— |
— |
| All-in
costs on a by-product basis |
290.8 |
|
247.4 |
|
131.9 |
|
112.9 |
|
48.8 |
77.5 |
|
— |
209.0 |
| Ounces
sold (000s) |
242.2 |
|
314.8 |
|
187.5 |
|
203.1 |
|
54.7 |
111.7 |
|
— |
147.8 |
| Pounds
sold (millions) |
73.4 |
|
78.0 |
|
73.4 |
|
78.0 |
|
— |
— |
|
— |
— |
| Gold
production costs ($/oz) |
681 |
|
604 |
|
767 |
|
683 |
|
386 |
457 |
|
— |
491 |
| All-in
sustaining costs on a by-product basis ($/oz) |
860 |
|
649 |
|
630 |
|
508 |
|
791 |
668 |
|
— |
929 |
| All-in
costs on a by-product basis ($/oz) |
1,201 |
|
785 |
|
704 |
|
556 |
|
891 |
694 |
|
— |
1,414 |
| Gold -
All-in sustaining costs on a co-product basis ($/oz) |
1,112 |
|
891 |
|
956 |
|
883 |
|
791 |
668 |
|
— |
929 |
| Copper
production costs ($/pound) |
1.70 |
|
1.51 |
|
1.70 |
|
1.51 |
|
n/a |
n/a |
|
n/a |
n/a |
|
Copper - All-in sustaining costs on a co-product basis
($/pound) |
2.12 |
|
1.94 |
|
2.12 |
|
1.94 |
|
n/a |
n/a |
|
n/a |
n/a |
(1) Non-sustaining
capital expenditures are distinct projects designed to have a
significant increase in the net present value of the mine. In the
current year, non-sustaining capital expenditures include costs
related to the installation of the staged flotation reactors at the
Mount Milligan Mine.
(2) Presented on a continuing
operations basis, excluding the results from the Kumtor Mine.
(3) Results from the period ended
December 31, 2021 from the Kumtor Mine are prior to the seizure of
the mine on May 15, 2021.
Adjusted net (loss) earnings is a non-GAAP financial
measure and can be reconciled as follows:
|
|
Three months ended December 31, |
Years ended December 31, |
|
($millions, except as noted) |
|
2022 |
|
|
2021 |
|
|
2022 |
|
|
2021 |
|
|
Net (loss) earnings |
$ |
(130.1 |
) |
$ |
274.9 |
|
$ |
(77.2 |
) |
$ |
(381.8 |
) |
|
Adjust for items not associated with ongoing operations: |
|
|
|
|
|
Loss of control of the Kumtor Mine |
|
— |
|
|
— |
|
|
— |
|
|
926.4 |
|
|
Kumtor Mine legal costs and other related costs |
|
— |
|
|
11.3 |
|
|
15.0 |
|
|
27.5 |
|
|
Gain from the discontinuance of Kumtor Mine hedge instruments |
|
— |
|
|
— |
|
|
— |
|
|
(15.3 |
) |
|
Impairment loss (reversal), net of tax |
|
138.2 |
|
|
(117.3 |
) |
|
138.2 |
|
|
(117.3 |
) |
|
Gain on the sale of Greenstone property |
|
— |
|
|
(25.0 |
) |
|
— |
|
|
(97.3 |
) |
|
Reclamation (recovery) expense at sites on care and
maintenance |
|
(3.4 |
) |
|
24.2 |
|
|
(94.2 |
) |
|
24.1 |
|
|
Gain on derecognition of the employee health plan benefit provision
at the Langeloth Facility |
|
(4.4 |
) |
|
— |
|
|
(4.4 |
) |
|
— |
|
|
Income and mining tax adjustments(1) |
|
(14.0 |
) |
|
(132.7 |
) |
|
13.2 |
|
|
(132.7 |
) |
|
Adjusted net (loss) earnings |
$ |
(13.7 |
) |
$ |
35.4 |
|
$ |
(9.4 |
) |
$ |
233.6 |
|
Net (loss) earnings per share - basic |
$ |
(0.59 |
) |
$ |
0.93 |
|
$ |
(0.29 |
) |
$ |
(1.29 |
) |
|
Net (loss) earnings per share - diluted |
$ |
(0.59 |
) |
$ |
0.92 |
|
$ |
(0.31 |
) |
$ |
(1.29 |
) |
|
Adjusted net (loss) earnings per share -
basic |
$ |
(0.06 |
) |
$ |
0.12 |
|
$ |
(0.04 |
) |
$ |
0.79 |
|
|
Adjusted net (loss) earnings per share -
diluted |
$ |
(0.06 |
) |
$ |
0.12 |
|
$ |
(0.04 |
) |
$ |
0.77 |
|
(1) Income tax adjustments reflect
the impact of foreign currency translation on deferred income taxes
and an election made under local legislation to account for
inflation and increase the tax value of Öksüt Mine’s assets
Free cash flow (deficit) from
continuing operations and adjusted free cash flow (deficit) from
continuing operations are non-GAAP financial measures and can be
reconciled as follows:
|
|
Three months ended December 31, |
|
|
Consolidated |
Mount Milligan |
Öksüt |
Molybdenum |
Other |
|
|
|
2022 |
|
|
2021 |
|
|
2022 |
|
|
2021 |
|
|
2022 |
|
|
2021 |
|
|
2022 |
|
2021 |
|
|
2022 |
|
|
2021 |
|
|
Cash (used in) provided by operating activities from
continuing operations(1) |
$ |
(9.8 |
) |
$ |
61.8 |
|
$ |
26.5 |
|
$ |
63.5 |
|
$ |
(11.9 |
) |
$ |
39.5 |
|
$ |
8.6 |
$ |
(15.8 |
) |
$ |
(33.0 |
) |
$ |
(25.4 |
) |
|
Deduct: |
|
|
|
|
|
|
|
|
|
|
|
Property, plant & equipment additions(1) |
|
(15.5 |
) |
|
(23.1 |
) |
|
(10.9 |
) |
|
(17.3 |
) |
|
(4.6 |
) |
|
(4.2 |
) |
|
— |
|
(1.4 |
) |
|
— |
|
|
(0.2 |
) |
|
Free cash flow (deficit) from continuing
operations |
$ |
(25.3 |
) |
$ |
38.7 |
|
$ |
15.6 |
|
$ |
46.2 |
|
$ |
(16.5 |
) |
$ |
35.3 |
|
$ |
8.6 |
$ |
(17.2 |
) |
$ |
(33.0 |
) |
$ |
(25.6 |
) |
(1) As presented in
the Company’s consolidated statements of cash flows.
|
|
Years ended December 31, |
|
|
Consolidated |
Mount Milligan |
Öksüt |
Molybdenum |
Other |
|
|
|
2022 |
|
|
2021 |
|
|
2022 |
|
|
2021 |
|
|
2022 |
|
|
2021 |
|
|
2022 |
|
|
2021 |
|
|
2022 |
|
|
2021 |
|
|
Cash provided by (used in) operating activities from
continuing operations(1) |
$ |
(2.0 |
) |
$ |
270.9 |
|
$ |
161.6 |
|
$ |
268.9 |
|
$ |
(17.5 |
) |
$ |
131.7 |
|
$ |
(9.3 |
) |
$ |
(37.3 |
) |
$ |
(136.8 |
) |
$ |
(92.4 |
) |
|
Deduct: |
|
|
|
|
|
|
|
|
|
|
|
Property, plant & equipment additions at continuing
operations(1) |
|
(80.9 |
) |
|
(92.5 |
) |
|
(61.2 |
) |
|
(67.4 |
) |
|
(16.0 |
) |
|
(20.1 |
) |
|
(1.1 |
) |
|
(2.5 |
) |
|
(2.6 |
) |
|
(2.5 |
) |
|
Free cash flow (deficit) from continuing
operations |
$ |
(82.9 |
) |
$ |
178.4 |
|
$ |
100.4 |
|
$ |
201.5 |
|
$ |
(33.5 |
) |
$ |
111.6 |
|
$ |
(10.4 |
) |
$ |
(39.8 |
) |
$ |
(139.4 |
) |
$ |
(94.9 |
) |
(1) As presented in
the Company’s consolidated statements of cash flows.
Sustaining capital expenditures and
non-sustaining capital expenditures are non-GAAP measures and can
be reconciled as follows:
|
|
Three months ended December 31, |
|
|
Consolidated |
Mount Milligan |
Öksüt |
Molybdenum |
Other |
|
|
|
2022 |
|
|
2021 |
|
|
2022 |
|
|
2021 |
|
|
2022 |
|
|
2021 |
|
|
2022 |
|
2021 |
|
2022 |
|
|
2021 |
|
|
Additions to
PP&E(1) |
$ |
27.9 |
|
$ |
46.9 |
|
$ |
14.6 |
|
$ |
28.9 |
|
$ |
5.1 |
|
$ |
9.3 |
|
$ |
0.8 |
$ |
1.4 |
$ |
7.4 |
|
$ |
7.3 |
|
| Adjust
for: |
|
|
|
|
|
|
|
|
|
|
|
Costs capitalized to the ARO assets |
|
(11.7 |
) |
|
(17.9 |
) |
|
(4.4 |
) |
|
(5.3 |
) |
|
— |
|
|
(5.2 |
) |
|
— |
|
— |
|
(7.3 |
) |
|
(7.4 |
) |
|
Costs capitalized to the ROU assets |
|
(0.2 |
) |
|
(1.3 |
) |
|
— |
|
|
(1.5 |
) |
|
(0.2 |
) |
|
0.2 |
|
|
— |
|
— |
|
— |
|
|
— |
|
|
Other(2) |
|
(0.6 |
) |
|
0.4 |
|
|
(0.2 |
) |
|
0.3 |
|
|
(0.3 |
) |
|
— |
|
|
— |
|
— |
|
(0.1 |
) |
|
0.1 |
|
|
Capital expenditures |
$ |
15.4 |
|
$ |
28.1 |
|
$ |
10.0 |
|
$ |
22.4 |
|
$ |
4.6 |
|
$ |
4.3 |
|
$ |
0.8 |
$ |
1.4 |
$ |
— |
|
$ |
— |
|
|
Sustaining capital expenditures |
|
15.3 |
|
|
25.7 |
|
|
9.9 |
|
|
20.2 |
|
|
4.6 |
|
|
4.1 |
|
|
0.8 |
|
1.4 |
|
— |
|
|
— |
|
|
Non-sustaining capital expenditures |
|
0.1 |
|
|
2.4 |
|
|
0.1 |
|
|
2.2 |
|
|
— |
|
|
0.2 |
|
|
— |
|
— |
|
— |
|
|
— |
|
(1) As presented in
the Company’s consolidated financial statements.
(2) Includes reclassification of
insurance and capital spares from supplies inventory to
PP&E.
|
|
Years ended December 31, |
|
|
Consolidated |
Mount Milligan |
Öksüt |
Molybdenum |
Other |
|
|
|
2022 |
|
|
2021 |
|
|
2022 |
|
2021 |
|
|
2022 |
|
|
2021 |
|
|
2022 |
|
2021 |
|
2022 |
|
|
2021 |
|
|
Additions to
PP&E(1) |
$ |
275.1 |
|
$ |
118.9 |
|
$ |
49.2 |
$ |
83.7 |
|
$ |
14.2 |
|
$ |
24.9 |
|
$ |
1.8 |
$ |
2.5 |
$ |
209.9 |
|
$ |
7.8 |
|
| Adjust
for: |
|
|
|
|
|
|
|
|
|
|
|
Costs capitalized to the ARO assets |
|
6.4 |
|
|
(17.8 |
) |
|
5.5 |
|
(5.3 |
) |
|
1.9 |
|
|
(5.20 |
) |
|
— |
|
— |
|
(1.0 |
) |
|
(7.3 |
) |
|
Costs capitalized to the ROU assets |
|
(0.4 |
) |
|
(6.9 |
) |
|
— |
|
(6.8 |
) |
|
(0.4 |
) |
|
(0.1 |
) |
|
— |
|
— |
|
— |
|
|
— |
|
|
Costs relating to the acquisition of Goldfield Project |
|
(208.2 |
) |
|
— |
|
|
— |
|
— |
|
|
— |
|
|
— |
|
|
— |
|
— |
|
(208.2 |
) |
|
— |
|
|
Other(2) |
|
0.3 |
|
|
(0.9 |
) |
|
— |
|
(0.8 |
) |
|
0.3 |
|
|
— |
|
|
0.1 |
|
— |
|
(0.1 |
) |
|
(0.1 |
) |
|
Capital expenditures |
$ |
73.2 |
|
$ |
93.3 |
|
$ |
54.7 |
$ |
70.8 |
|
$ |
16.0 |
|
$ |
19.6 |
|
$ |
1.9 |
$ |
2.5 |
$ |
0.6 |
|
$ |
0.4 |
|
|
Sustaining capital expenditures |
|
71.1 |
|
|
88.0 |
|
|
53.1 |
|
66.7 |
|
|
16.0 |
|
|
18.8 |
|
|
1.9 |
|
2.5 |
|
0.1 |
|
|
— |
|
|
Non-sustaining capital expenditures |
|
2.1 |
|
|
5.3 |
|
|
1.6 |
|
4.1 |
|
|
— |
|
|
0.8 |
|
|
— |
|
— |
|
0.5 |
|
|
0.4 |
|
(1) As presented in
the Company’s consolidated financial statements.
(2) Includes reclassification of
insurance and capital spares from supplies inventory to
PP&E.
About Centerra
Centerra Gold Inc. is a Canadian-based mining
company focused on operating, developing, exploring and acquiring
gold and copper properties in North America, Türkiye, and other
markets worldwide. Centerra operates two mines: the Mount Milligan
Mine in British Columbia, Canada, and the Öksüt Mine in Türkiye.
The Company also owns the Goldfield Project in Nevada, United
States, the Kemess Underground Project in British Columbia, Canada,
and owns and operates the Molybdenum Business Unit in the United
States and Canada. Centerra's shares trade on the Toronto Stock
Exchange (“TSX”) under the symbol CG and on the New York Stock
Exchange (“NYSE”) under the symbol CGAU. The Company is based in
Toronto, Ontario, Canada.
Additional information on Centerra is available on the
Company’s website at www.centerragold.com and
at SEDAR at www.sedar.com and EDGAR
at www.sec.gov/edgar.
Management’s Discussion and
Analysis
For the Years Ended December 31, 2022
and 2021
This Management’s
Discussion and Analysis
(“MD&A”) has been prepared
as of February 23,
2023 and is intended
to provide a review of
the financial position and
results of operations of
Centerra Gold Inc. (“Centerra”
or the “Company”) for
the three and twelve months ended December
31, 2022 in comparison with the corresponding periods ended
December 31, 2021. This discussion should be read in conjunction
with the Company’s audited financial statements and the notes
thereto for the year ended December 31, 2022 prepared in accordance
with International Financial Reporting Standards (“IFRS”). The
Company’s audited financial statements
and the notes thereto
for the year ended
December 31, 2022, are
available at www.centerragold.com and
on the System for
Electronic Document Analysis
and Retrieval (“SEDAR”) at
www.sedar.com and EDGAR
at www.sec.gov/
edgar. In addition, this discussion contains
forward-looking information regarding Centerra’s business and
operations. Such forward-looking statements
involve risks, uncertainties
and other factors that
could cause actual results
to differ materially from those
expressed or implied by such forward-looking statements. See
“Caution Regarding Forward-Looking Information” below.
All dollar amounts are
expressed in United States
dollars (“USD”), except as
otherwise indicated. All
references in this document denoted
with NG indicate a “specified
financial measure” within the meaning of National Instrument 52-112
Non-GAAP and Other Financial Measures Disclosure of the Canadian
Securities Administrators. None of these measures is a standardized
financial measure under IFRS and these measures might not be
comparable to similar financial measures disclosed by other
issuers. See section “Non-GAAP
and Other Financial Measures”
below for a discussion
of the specified financial
measures used in this document and a reconciliation to
the most directly comparable IFRS measure.
Caution Regarding Forward-Looking
Information
Information contained in this document which
is not a statement of historical fact, and the documents
incorporated by reference herein, may be
“forward-looking information” for
the purposes of Canadian
securities laws and within
the meaning of the United
States Private Securities
Litigation Reform Act of
1995. Such forward-looking
information involves risks,
uncertainties and other factors that could
cause actual results, performance, prospects and opportunities to
differ materially from those expressed or implied by such
forward-looking information. The words “believe”, “expect”,
“anticipate”, “contemplate”, “plan”, “intends”, “continue”,
“budget”, “estimate”, “may”, “will”, “schedule”, “understand” and
similar expressions identify forward-looking information. These
forward-looking statements relate to, among other things:
statements regarding 2023 Outlook and 2023 Guidance, including
production, costs, capital expenditures, depreciation, depletion
and amortization expenses and taxes; the effects of inflation on
the Company’s costs; the weakening of the Canadian dollar and
Turkish lira relative to the U.S. dollar; expectations regarding
copper credits and copper prices in 2023; the expected trend of the
Company’s performance toward achieving guidance; expected cash
outflows at the Oksut Mine for 2023; completion of mercury
abatement, containment and safety work in the gold room of the ADR
plant at the Öksüt Mine, including construction progress; the
expected restart of gold room operations, related regulatory
approvals and the expected timing thereof; the capacity of the
Öksüt Mine’s ADR plant to process inventories of loaded gold in
carbon ; preparation and timing of further submissions relating to
the EIA amendment for the Öksüt Mine and further discussions and
regulatory review thereof; progress on ordinary course permitting,
including the formal issuance of such permits at the Öksüt Mine and
the ability to mine the Keltepe and Guneytepe pits; expectations
for continued mining, crushing and
stacking operations at the
Öksüt Mine in 2023;
highlights of a new
life of mine plan for
the Mount Milligan Mine, including reserves and
resources, costs, inflationary pressures and expectations regarding
the release of further guidance; expectations
for optimization of Mount
Milligan Mine’s staged
flotation reactors; strategic
options for the Molybdenum BU,
including a potential restart of the Thompson Creek Mine, net cash
required to maintain the business and expectations for molybdenum
prices; expectations for ongoing activities at the Goldfield
project, including drilling, resource estimation and a feasibility
study; expectations for market purchases under a normal course
issuer bid; possible impact to operations relating to COVID-19;
leadership transition of the Chief Executive Officer position; and
expectations regarding contingent payments to be received from the
sale of Greenstone Partnership.
Forward-looking information
is necessarily based upon
a number of estimates
and assumptions that, while
considered reasonable by Centerra, are inherently
subject to significant technical, political, business, economic and
competitive uncertainties and contingencies. Known and unknown
factors could cause actual results to differ materially from those
projected in the forward- looking information. Factors and
assumptions that could cause actual results or events to differ
materially from current expectations include,
among other things: (A)
strategic, legal, planning and
other risks, including:
political risks associated with the
Company’s operations in Türkiye, the USA and Canada, including
potential uncertainty created by upcoming presidential elections in
Türkiye and their potential to disrupt or delay Turkish
bureaucratic processes and decision making; resource nationalism
including the management of external stakeholder expectations; the
impact of changes in, or to the more aggressive enforcement of,
laws, regulations and government practices, including unjustified
civil or criminal action against the Company, its affiliates, or
its current or former employees; risks that community activism may
result in increased contributory demands or business interruptions;
the risks related to outstanding litigation affecting the Company;
risks of actions taken by the Kyrgyz Republic, or any of its
instrumentalities, in connection with the Company’s prior ownership
of the Kumtor Mine or the Global Arrangement
Agreement; including unjustified
civil or criminal action
against the Company, its
affiliates, or its current
or former employees; the impact of constitutional
changes or political events or elections in Türkiye; risks that
Turkish regulators pursue aggressive enforcement of the Öksüt
Mine’s current EIA and permits or that the Company experiences
delay or disruption in its applications for
new or amended EIA or
other permits, including the
formal issuance thereof; the
impact of any
sanctions imposed by Canada, the United States or
other jurisdictions against various Russian and Turkish individuals
and entities; potential defects of
title in the Company’s
properties that are not
known as of the date
hereof; the inability of
the Company and its
subsidiaries to enforce their
legal rights in certain
circumstances; risks related to
anti-corruption legislation; Centerra
not being able to replace mineral reserves; Indigenous
claims and consultative issues relating to the Company’s properties
which are in proximity to Indigenous
communities; and potential
risks related to kidnapping
or acts of terrorism;
(B) risks relating to
financial matters, including: sensitivity of the Company’s
business to the volatility of gold, copper and other mineral
prices; the use of provisionally-priced sales contracts for
production at the Mount Milligan Mine; reliance on a few key
customers for the gold- copper concentrate at the Mount Milligan
Mine; use of commodity derivatives; the imprecision of the
Company’s mineral reserves and resources
estimates and the assumptions
they rely on; the
accuracy of the Company’s
production and cost estimates; the
impact of restrictive covenants in the Company’s credit facilities
which may, among other things, restrict the Company from pursuing
certain business activities or making distributions from its
subsidiaries; changes to tax regimes; the Company’s ability to
obtain future financing; the impact of global financial conditions;
the impact of currency fluctuations; the effect of market
conditions on the Company’s short-term investments; the Company’s
ability to make payments, including any payments of principal
and interest on the
Company’s debt facilities,
which depends on the
cash flow of its
subsidiaries; and (C) risks
related to operational matters
and geotechnical issues and
the Company’s continued ability
to successfully manage such
matters, including the stability of the pit walls at
the Company’s operations; the integrity of tailings storage
facilities and the management thereof, including as to stability,
compliance with laws, regulations, licenses and permits,
controlling seepages and storage of water where
applicable; the risk of
having sufficient water to
continue operations at the
Mount Milligan Mine and
achieve expected mill throughput; changes to,
or delays in the Company’s supply chain and transportation routes,
including cessation or disruption in rail and shipping networks
whether caused by decisions of third-party providers or force
majeure events (including, but not limited to,
flooding, wildfires, earthquakes,
COVID-19, or other global
events such as wars);
the success of the
Company’s future exploration and development
activities, including the financial and political risks inherent in
carrying out exploration activities; inherent risks associated with
the use of sodium cyanide in the mining operations; the adequacy of
the Company’s insurance to mitigate operational and corporate
risks; mechanical breakdowns; the occurrence of any labour unrest
or disturbance and the ability of the Company to successfully
renegotiate collective agreements when required; the risk that
Centerra’s workforce and operations may be exposed to widespread
epidemic including, but not limited to, the COVID-19 pandemic;
seismic activity including earthquakes; wildfires; long lead-times
required for equipment and supplies given the remote location of
some of the Company’s operating properties and disruptions caused
by global events; reliance on a limited number of suppliers for
certain consumables, equipment and
components; the ability of
the Company to address
physical and transition risks
from climate change and sufficiently manage
stakeholder expectations on climate-related issues; the Company’s
ability to accurately predict decommissioning and
reclamation costs and the
assumptions they rely upon;
the Company’s ability to
attract and retain qualified
personnel; competition for mineral acquisition opportunities; risks
associated with the conduct of joint ventures/partnerships; and,
the Company’s ability to manage its projects effectively and to
mitigate the potential lack of availability of contractors, budget
and timing overruns and project resources. For additional risk
factors, please see section titled “Risks Factors” in the Company’s
most recently filed Annual Information Form (“AIF”) available on
SEDAR at www.sedar.com
and EDGAR at www.sec.gov/edgar.
There can be no assurances that
forward-looking information and statements will prove to be
accurate, as many factors and future events,
both known and unknown
could cause actual results,
performance or achievements to
vary or differ materially
from the results, performance or achievements that are or may
be expressed or implied by such forward-looking statements
contained herein or incorporated by reference. Accordingly, all
such factors should be considered carefully when making decisions
with respect to Centerra, and
prospective investors should
not place undue reliance
on forward-looking information.
Forward-looking information is as
of February 23, 2023.
Centerra assumes no obligation
to update or revise
forward-looking information to
reflect changes in assumptions, changes in circumstances or any
other events affecting such forward-looking information, except as
required by applicable law.
|
TABLE OF CONTENTS |
|
Overview |
1 |
| Overview of Consolidated
Financial and Operational Highlights |
2 |
| Overview of Consolidated
Results |
3 |
| Outlook |
6 |
| Recent Events and
Developments |
11 |
| Risks That Can Affect
Centerra's Business |
14 |
| Market
Conditions |
17 |
| Liquidity and Capital
Resources |
19 |
| Financial
Performance |
20 |
| Financial
Instruments |
24 |
| Balance Sheet
Review |
25 |
| Contractual
Obligations |
26 |
| 2023 Liquidity and
Capital Resources Analysis |
27 |
| Operating Mines and
Facilities |
27 |
| Discontinued
Operations |
39 |
| Annual Results – Previous
Three Years |
40 |
| Quarterly Results –
Previous Eight Quarters |
40 |
| Related Party
Transactions |
41 |
| Accounting Estimates,
Policies and Changes |
41 |
| Disclosure Controls and
Procedures and Internal Control Over Financial
Reporting |
42 |
| Non-GAAP and Other
Financial Measures |
42 |
| Mineral Reserves and
Mineral Resources |
49 |
| Qualified Person &
QA/QC – Production, Mineral Reserves and Mineral
Resources |
51 |
Overview
Centerra’s Business
Centerra is a Canada-based mining company
focused on operating, developing, exploring and acquiring gold and
copper properties in North America, Türkiye, and other markets
worldwide. Centerra’s principal continuing operations are the Mount
Milligan gold-copper mine located in British Columbia, Canada (the
“Mount Milligan Mine”), and the Öksüt gold mine located in Türkiye
(the “Öksüt Mine”). The Company also owns the Goldfield District
Project (the “Goldfield Project”) in Nevada, United States, the
Kemess Underground Project (the “Kemess Project”) in British
Columbia, Canada as well as exploration properties in Canada, the
United States of America and Türkiye and has options to acquire
exploration joint venture properties in Canada, Türkiye, and the
United States. The Company owns and operates a Molybdenum Business
Unit (the “Molybdenum BU”), which includes the Langeloth
metallurgical processing facility, operating in Pennsylvania, USA
(the “Langeloth Facility”), and two primary molybdenum mines on
care and maintenance: the Thompson Creek Mine in Idaho, USA, and
the Endako Mine (75% ownership) in British Columbia, Canada.
Prior to May 15, 2021, the Company also
consolidated the results of the Kumtor mine, located in the Kyrgyz
Republic, (the “Kumtor Mine”), through its wholly-owned subsidiary,
Kumtor Gold Company CJSC (“KGC”). The seizure of the Kumtor Mine
and the actions of the Kyrgyz Republic and Kyrgyzaltyn JSC
(“Kyrgyzaltyn”) resulted in the following: (i) the carrying value
of the net assets of the mine were derecognized from the Company’s
balance sheet, (ii) no value was ascribed to the Company’s interest
in KGC, (iii) the Company recognized a loss on the change of
control in the second quarter of 2021, and (iv) results of the
Kumtor Mine’s operations are now presented as a discontinued
operation in the Company’s financial statements. The Company
entered into a global arrangement agreement (“Arrangement
Agreement”) dated April 4, 2022 with, among others, Kyrgyzaltyn and
the Kyrgyz Republic to effect a separation of the parties,
including through the disposition of Centerra’s ownership of the
Kumtor Mine and its investment in the Kyrgyz Republic, the purchase
for cancellation by Centerra of Kyrgyzaltyn’s Centerra common
shares, the termination of Kyrgyzaltyn’s involvement in the
Company, and the resolution of disputes (the “Transaction”). The
Transaction closed on July 29, 2022.
As of December 31, 2022, Centerra’s significant
subsidiaries were as follows:
|
Entity |
Property - Location |
Current Status |
Ownership |
|
Thompson Creek Metals Company Inc. |
Mount Milligan Mine - Canada |
Operation |
100% |
| |
Endako Mine - Canada |
Care and maintenance |
75% |
| Öksüt Madencilik A.S. |
Öksüt Mine - Türkiye |
Operation |
100% |
| Langeloth Metallurgical Company
LLC |
Langeloth - USA |
Operation |
100% |
| Gemfield Resources LLC |
Goldfield Project - USA |
Advanced exploration |
100% |
| AuRico Metals Inc. |
Kemess Project - Canada |
Care and maintenance |
100% |
| Thompson Creek Mining Co. |
Thompson Creek Mine - USA |
Care and maintenance |
100% |
The Company’s common shares are listed on the
Toronto Stock Exchange and the New York Stock Exchange and trade
under the symbols “CG” and “CGAU”, respectively.
As of February 23, 2023, there
are 218,494,646 common shares issued and outstanding, options
to acquire 3,686,129 common shares outstanding under the
Company’s stock option plan, and 983,933 restricted share
units outstanding under the Company’s restricted share unit plan
(exercisable on a 1:1 basis for common shares).
Overview of Consolidated Financial and
Operating Highlights
($millions,
except as
noted)
|
Three months ended December
31,
|
Years ended December 31, |
|
Financial Highlights (continuing operations basis, except
as noted) |
2022 |
2021 |
%
Change |
2022 |
2021 |
%
Change |
|
Revenue |
208.3 |
|
251.1 |
(17 |
)% |
850.2 |
|
900.1 |
|
(6 |
)% |
| Production costs |
158.1 |
|
132.0 |
20 |
% |
574.6 |
|
487.7 |
|
18 |
% |
|
Depreciation, depletion, and amortization ("DDA") |
17.2 |
|
31.0 |
(45 |
)% |
97.1 |
|
120.5 |
|
(19 |
)% |
|
Earnings from mine operations |
33.0 |
|
88.1 |
(63 |
)% |
178.5 |
|
292.0 |
|
(39 |
)% |
| Net (loss) earnings from
continuing operations |
(130.1 |
) |
274.9 |
(147 |
)% |
(77.2 |
) |
446.9 |
|
(117 |
)% |
| Adjusted net (loss) earnings
from continuing operations(1) |
(13.7 |
) |
35.4 |
(139 |
)% |
(9.4 |
) |
149.2 |
|
(106 |
)% |
| Net loss from discontinued
operations(2) |
— |
|
— |
— |
% |
— |
|
(828.7 |
) |
(100 |
)% |
| Net (loss)
earnings(2) |
(130.1 |
) |
274.9 |
(147 |
)% |
(77.2 |
) |
(381.8 |
) |
80 |
% |
| Adjusted net (loss)
earnings(1)(2) |
(13.7 |
) |
35.4 |
(139 |
)% |
(9.4 |
) |
233.6 |
|
(104 |
)% |
| Cash (used in) provided by
operating activities from continuing operations |
(9.8 |
) |
61.8 |
(116 |
)% |
(2.0 |
) |
270.9 |
|
(101 |
)% |
| Free cash flow (deficit) from
continuing operations(1) |
(25.3 |
) |
38.7 |
(165 |
)% |
(82.9 |
) |
178.4 |
|
(146 |
)% |
| Adjusted free cash flow
(deficit) from continuing operations(1) |
(25.3 |
) |
44.0 |
(158 |
)% |
(62.0 |
) |
192.6 |
|
(132 |
)% |
| Cash provided by operating
activities from discontinued operations |
— |
|
— |
— |
% |
— |
|
143.9 |
|
(100 |
)% |
| Net cash flow from
discontinued operations(2)(3) |
— |
|
— |
— |
% |
— |
|
47.8 |
|
(100 |
)% |
| Additions to property, plant
and equipment (“PP&E”) |
27.9 |
|
46.9 |
(41 |
)% |
275.1 |
|
118.9 |
|
131 |
% |
| Capital expenditures -
total(1) |
15.4 |
|
28.1 |
(45 |
)% |
73.2 |
|
93.3 |
|
(22 |
)% |
|
Sustaining capital expenditures(1) |
15.3 |
|
25.7 |
(40 |
)% |
71.1 |
|
88.0 |
|
(19 |
)% |
|
Non-sustaining capital expenditures(1) |
0.1 |
|
2.4 |
(96 |
)% |
2.1 |
|
5.3 |
|
(60 |
)% |
| Net (loss) earnings from
continuing operations per common share -
basic(4) |
(0.59 |
) |
0.93 |
(163 |
)% |
(0.29 |
) |
1.51 |
|
(119 |
)% |
| Net (loss) earnings per common
share - $/share basic(2)(4) |
(0.59 |
) |
0.93 |
(163 |
)% |
(0.29 |
) |
(1.29 |
) |
(77 |
)% |
| Adjusted net (loss) earnings
from continuing operations per common share -
basic(1)(4) |
(0.06 |
) |
0.12 |
(150 |
)% |
(0.04 |
) |
0.50 |
|
(108 |
)% |
|
Adjusted net (loss) earnings per common share - $/share
basic(1)(2)(4) |
(0.06 |
) |
0.12 |
(150 |
)% |
(0.04 |
) |
0.79 |
|
(105 |
)% |
|
Operating highlights (continuing operations
basis) |
|
|
|
|
|
|
| Gold produced (oz) |
53,222 |
|
91,197 |
(42 |
)% |
243,867 |
|
308,141 |
|
(21 |
)% |
| Gold sold (oz) |
49,443 |
|
90,312 |
(45 |
)% |
242,193 |
|
314,757 |
|
(23 |
)% |
| Average market gold price
($/oz) |
1,728 |
|
1,795 |
(4 |
)% |
1,800 |
|
1,799 |
|
— |
% |
| Average realized gold price
($/oz )(5) |
1,352 |
|
1,504 |
(10 |
)% |
1,446 |
|
1,485 |
|
(3 |
)% |
| Copper produced (000s
lbs) |
16,909 |
|
16,993 |
— |
% |
73,864 |
|
73,275 |
|
1 |
% |
| Copper sold (000s lbs) |
15,374 |
|
17,184 |
(11 |
)% |
73,392 |
|
78,017 |
|
(6 |
)% |
| Average market copper price
($/lb) |
3.63 |
|
4.40 |
(18 |
)% |
3.99 |
|
4.23 |
|
(6 |
)% |
| Average realized copper price
($/lb)(5) |
3.43 |
|
3.59 |
(4 |
)% |
2.95 |
|
2.92 |
|
1 |
% |
| Molybdenum sold (000s
lbs) |
4,040 |
|
2,361 |
71 |
% |
13,448 |
|
11,461 |
|
17 |
% |
| Average
market molybdenum price ($/lb) |
21.49 |
|
18.89 |
14 |
% |
18.73 |
|
15.98 |
|
17 |
% |
|
Unit costs (continuing operations basis) |
|
|
|
|
|
|
| Gold production costs
($/oz) |
790 |
|
550 |
44 |
% |
681 |
|
604 |
|
13 |
% |
| All-in sustaining costs on a
by-product basis ($/oz)(1) |
987 |
|
591 |
67 |
% |
860 |
|
649 |
|
33 |
% |
| All-in costs on a by-product
basis ($/oz)(1) |
1,572 |
|
732 |
115 |
% |
1,201 |
|
785 |
|
53 |
% |
| Gold - All-in sustaining costs
on a co-product basis ($/oz)(1) |
1,308 |
|
829 |
58 |
% |
1,112 |
|
891 |
|
25 |
% |
| Copper production costs
($/lb) |
2.00 |
|
1.79 |
12 |
% |
1.70 |
|
1.51 |
|
13 |
% |
| Copper - All-in sustaining
costs on a co-product basis – ($/lb)(1) |
2.40 |
|
2.34 |
3 |
% |
2.12 |
|
1.94 |
|
9 |
% |
(1) Non-GAAP financial measure. All
per unit costs metrics are expressed on a metal sold basis. See
discussion under “Non-GAAP and Other Financial Measures”.
(2) Inclusive of the results from the Kumtor Mine prior
to the loss of control on May 15, 2021.
(3) Calculated as the sum of cash flow provided by
operating activities from discontinued operations, cash flow used
in investing activities from discontinued operations and cash flow
used in financing activities from discontinued operations.
(4) As at December 31, 2022, the Company had 218,428,681
common shares issued and outstanding.
(5) This supplementary financial measure within the
meaning of National Instrument 52-112 - Non-GAAP and Other
Financial Measures Disclosure (“NI 51-112”) is calculated as a
ratio of revenue from the consolidated financial statements and
units of metal sold and includes the impact from the Mount Milligan
Streaming Arrangement, copper hedges and mark-to-market adjustments
on metal sold not yet finally settled.
Overview of Consolidated
Results
Although during 2021, the Company remained the
legal owner of KGC, due to the seizure of the Kumtor Mine and the
related actions by the Kyrgyz Republic and Kyrgyzaltyn, the Company
derecognized the assets and liabilities of the Kumtor Mine in the
statements of financial position and presented its financial and
operating results prior to the loss of control as discontinued
operations for the year ended December 31, 2021. As a result, the
Company’s consolidated results from continuing operations discussed
in this MD&A exclude the Kumtor Mine’s operations, unless
otherwise noted.
Fourth Quarter 2022 compared to Fourth
Quarter 2021
Net loss of $130.1 million was recognized in the
fourth quarter 2022, compared to net earnings of $274.9 million in
the fourth quarter 2021. Decrease in net earnings was primarily due
to:
- lower earnings
from mine operations of $33.0 million in the fourth quarter of 2022
compared to earnings from mine operations of $88.1 million in the
fourth quarter of 2021 primarily due to no ounces of gold sold at
the Öksüt Mine, lower gold ounces and copper pounds sold and lower
average realized copper prices at the Mount Milligan Mine and
higher production costs at the Molybdenum BU. Higher production
costs at the Molybdenum BU were primarily due to higher average
molybdenum prices paid for third-party molybdenum concentrate, an
increase in pounds of molybdenum roasted, and the effect of higher
production costs from the mix of products produced and sold in the
period. A decrease in earnings from mine operations was partially
offset by lower production costs and DDA at the Öksüt Mine due to
the suspension of gold room operations at the ADR plant and lower
DDA at the Mount Milligan Mine primarily attributable to the
increase in proven and probable reserves;
- a non-cash
impairment loss of $138.2 million (net of tax) recognized in the
fourth quarter of 2022 related to the Kemess Project compared to an
impairment reversal $117.3 million (net of tax) recognized in the
fourth quarter of 2021 related to the Mount Milligan Mine;
- higher
exploration and development costs primarily relating to various
drilling activities and technical studies undertaken at the
Goldfield Project and at the Mount Milligan Mine; and
- lower income tax
recovery primarily resulting from the draw-down of the deferred tax
assets recognized in the fourth quarter of 2021 at the Mount
Milligan Mine, partially offset by the impact of the suspension of
operations and an inflationary adjustment recorded to the tax basis
of property, plant and equipment at the Öksüt Mine.
The decrease in net earnings was partially
offset by a reclamation recovery of $3.4 million in the fourth
quarter of 2022 compared to reclamation expense of $24.3 million in
the fourth quarter of 2021, resulting from an increase in the
risk-free interest rates applied to discount the estimated future
reclamation cash flows, partially offset by an increase in
underlying future reclamation cash flows impacted by various
factors, including higher short-term inflation and an increase in
the scope of reclamation activities at the Endako Mine and Thompson
Creek Mine. In addition, there was a decrease in other
non-operating expenses due to a decrease in legal costs and related
expenses incurred in connection with the seizure of the Kumtor
Mine, a non-cash gain on derecognition of the employee health plan
benefit provision at the Langeloth Facility upon termination of the
plan and higher interest income earned on the Company’s cash
balance from rising interest rates.
Adjusted net lossNG of $13.7 million
was recognized in the fourth quarter of 2022, compared to adjusted
net earningsNG of $35.4 million in the fourth quarter of
2021. The decrease in adjusted net earningsNG was
primarily due to lower earnings from mine operations and higher
exploration and development costs and income tax expense, partially
offset by lower non-operating expenses as outlined above.
The adjusting items to net loss in the fourth
quarter of 2022 were:
- $138.2 million, net of tax, related to
the non-cash impairment loss of the Kemess Project;
- $14.0 million of
deferred income tax recovery resulting from an inflationary
adjustment recorded to the tax basis of property, plant and
equipment at the Öksüt Mine;
- $4.4 million
non-cash gain on derecognition of the employee health plan benefit
provision at the Langeloth Facility upon termination of the plan;
and
- $3.4 million
reclamation provision revaluation recovery at sites on care and
maintenance in the Molybdenum BU primarily attributable to an
increase in the risk-free interest rates applied to discount the
estimated future reclamation cash flows.
The adjusting items to net earnings in the fourth
quarter of 2021 were:
- $11.3 million of legal and other
costs related to the seizure of the Kumtor Mine;
- $24.2 million
reclamation provision revaluation expense at sites on care and
maintenance in the Molybdenum BU, resulting primarily from the
change in estimated future reclamation cash flows and a decrease in
the discount rate applied to these cash flows;
- $132.7 million
of income tax adjustments related primarily to the recognition of a
deferred tax asset related to the Mount Milligan Mine;
- $117.3 million,
net of tax, related to the impairment reversal of the Mount
Milligan Mine; and
- $25.0 million
gain on the sale of the Greenstone project as a result of the
construction decision milestone at the Greenstone project,
triggering an additional payment to the Company by no later than
December 2023.
Cash used in operating activities was $9.8 million
in the fourth quarter of 2022, compared to cash provided by
operating activities of $61.8 million in the fourth quarter of
2021. The decrease in cash provided by operating activities was
primarily due to no ounces of gold sold at the Öksüt Mine, and
lower average realized copper prices, lower gold ounces and copper
pounds sold at the Mount Milligan Mine. In addition, there was an
unfavourable working capital change at the Mount Milligan from the
effect of timing of concentrate shipments and timing of vendor
payments and an unfavourable working capital change at the Öksüt
Mine from the buildup of stockpiles and heap leach pad inventory,
timing of vendor payments and lower collections of VAT refunds. The
overall decrease in cash provided by operating activities was
partially offset by a favourable working capital change from the
effect of a reduction in molybdenum inventory at the Molybdenum
BU.
Free cash flow deficitNG of $25.3
million was recognized in the fourth quarter of 2022, compared to
free cash flowNG of $38.7 million in the fourth quarter
of 2021. The decrease in free cash flowNG was primarily
due to lower cash provided by operating activities as outlined
above, partially offset by lower sustaining capital
expendituresNG.
Year ended December 31, 2022 compared
to 2021
Net loss of $77.2 million was recognized in 2022,
compared to net loss of $381.8 million in 2021. The decrease in net
loss was primarily due to a loss of $926.4 million recognized on
the change of control of the Kumtor Mine in 2021.
Net loss from continuing operations of $77.2
million was recognized in 2022, compared to net earnings from
continuing operations of $446.9 million in 2021. The decrease was
primarily due to:
- lower earnings
from mine operations of $178.5 million in 2022 compared to $292.0
million in 2021 primarily due to lower ounces of gold sold at the
Öksüt Mine. In addition, there were higher production costs at the
Molybdenum BU from higher average molybdenum prices paid for
third-party molybdenum concentrate to obtain product inventory to
be processed, an increase in the pounds of molybdenum roasted and
increased production costs due to rising inflation impacting
ingredients, freight and contract services. There was also a
decrease in earnings from mine operations at the Mount Milligan
Mine from higher production costs and lower gold ounces and copper
pounds sold. Higher production costs at the Mount Milligan Mine
were mainly driven by higher mining, milling and administrative
expenses due to the impact of rising inflation in Canada. Mining
costs were impacted by higher diesel prices and higher consumption
of diesel in the period. Milling costs were higher primarily due to
higher liner costs and higher salaries and wages, partially offset
by lower contractor costs. Administrative costs were higher
primarily due to an increase in salaries and wages, an increase in
recruiting and insurance costs and higher consulting costs related
to various information technology and environment projects. The
decrease in earnings from mine operations was partially offset by
the weakening of the Canadian dollar relative to the US dollar
between the periods, and lower production costs and DDA at the
Öksüt Mine due to the suspension of gold room operations at the ADR
plant;
- a non-cash
impairment loss of $138.2 million (net of tax) recognized in the
fourth quarter of 2022 related to the Kemess Project compared to an
impairment reversal $117.3 million (net of tax) recognized in the
fourth quarter of 2021 related to the Mount Milligan Mine;
- higher
exploration and development costs primarily due to various drilling
activities and technical studies undertaken at the Goldfield
Project, and brownfield exploration activities at the Mount
Milligan;
- higher corporate
administration costs primarily due to management changes and
associated severance payments, an increase in consulting costs and
software costs from various information technology projects,
including the implementation of the Company-wide enterprise
resource planning system and an increase in travel expenses;
- a gain of $97.3
million on the sale of the Company’s interest in the Greenstone
Partnership recognized in 2021; and
- income tax
expense of $32.8 million in 2022 compared to income tax recovery of
$44.0 million in 2021 primarily resulting from the drawdown in 2022
of deferred tax assets recognized in the fourth quarter of 2021 at
the Mount Milligan Mine, partially offset by the impact of the
suspension of operations and an inflation adjustment recorded to
the tax basis of property, plant and equipment at the Öksüt
Mine.
The decrease in net earnings from continuing
operations was partially offset by a $94.2 million reclamation
provision revaluation at sites on care and maintenance in the
Molybdenum BU primarily attributable to an increase in the
risk-free interest rates applied to discount the estimated future
reclamation cash flows. In addition, there was a decrease in other
non-operating expenses from higher interest income earned on the
Company’s cash balance from rising interest rates, a non-cash gain
on the derecognition of the employee health plan benefit provision
at the Langeloth Facility in connection with the termination of the
plan and a decrease in legal costs and related expenses incurred in
connection with the seizure and the loss of control of the Kumtor
Mine and the Arrangement Agreement.
The Company did not report any earnings related to
discontinued operations in 2022. Net loss from discontinued
operations was $828.7 million in 2021.
Adjusted net loss from continuing
operationsNG was $9.4 million in 2022, compared to
adjusted net earningsNG from continuing operations of
$149.2 million in 2021. The decrease in adjusted net earnings from
continuing operationsNG was due to lower earnings from
mine operations and higher corporate administration costs,
exploration and development costs and income tax expense, partially
offset by lower non-operating expenses, as outlined above
The adjusting items to net loss in 2022
include:
- $138.2 million, net of tax, related
to the non-cash impairment loss of the Kemess Project;
- $15.0 million of
legal costs and other related expenses directly related to the
seizure of the Kumtor Mine;
- $94.2 million
reclamation provision revaluation at sites on care and maintenance
in the Molybdenum BU, resulting primarily from an increase in the
discount rate applied to these cash flows, partially offset by an
increase in the estimated future reclamation cash flows;
- $13.2 million of
deferred income tax adjustments mainly resulting from the effect of
foreign exchange rate changes on the temporary differences between
accounting and tax bases of the Mount Milligan Mine, the Kemess
Project, and other comprehensive income as well as an inflation
adjustment recorded to the tax basis of property, plant and
equipment at the Öksüt Mine; and
- $4.4 million
non-cash gain on the derecognition of the employee health plan
benefit provision at the Langeloth Facility in connection with the
termination of the plan.
The adjusting items to net earnings from continuing
operations in 2021 were:
- $25.5 million of legal costs and
other related expenses directly related to the seizure of the
Kumtor Mine;
- $24.1 million
reclamation provision revaluation expense at sites on care and
maintenance in the Molybdenum BU, resulting primarily from an
increase in the estimated future reclamation cash flows and a
decrease in the discount rate applied to these cash flows;
- $132.7 million
of income tax adjustments related primarily to the recognition of a
deferred tax asset related to the Mount Milligan Mine;
- $117.3 million,
net of tax, related to the impairment reversal of the Mount
Milligan Mine; and
- $97.3 million
gain on the sale of the Greenstone Partnership.
Cash used in operating activities from
continuing operations was $2.0 million in 2022 compared to cash
provided by operating activities from continuing operations of
$270.9 million in 2021. The decrease in cash provided by operating
activities from continuing operations was primarily due to a
decrease in gold ounces sold at the Öksüt Mine and an unfavourable
change in working capital from the build up of stored
gold-in-carbon inventories, stockpiles and heap leach pad
inventory. In addition, there were higher cash taxes paid in
relation to the Öksüt Mine from withholding tax expense incurred on
dividend payments and taxation at the full statutory income tax
rate due to utilization of Öksüt’s Investment Incentive Certificate
as of the end of 2021 and the recognition of taxable gains from the
effect of foreign exchange rate changes on monetary assets and
liabilities in taxable income. In addition, there was a decrease in
gold ounces and copper pounds sold and higher production costs at
the Mount Milligan Mine as noted above and an unfavourable working
capital change from the effect of timing of vendor and other
payments and the effect of timing of cash collection on concentrate
sales at the Mount Milligan Mine. Partially offsetting the decrease
in cash provided by operating activities was a favourable working
capital change at the Molybdenum BU from the implementation of a
revised business plan to reduce inventory.
Free cash flow deficitNG from
continuing operations of $82.9 million was recognized in 2022
compared to free cash flowNG from continuing operations
of $178.4 million in 2021. The decrease in free cash
flowNG was primarily due to lower cash provided by
operating activities as outlined above, partially offset by lower
sustaining capital expendituresNG.
2023 Outlook
The full year 2023 outlook for the Mount
Milligan Mine (unchanged from the Company’s January 16, 2023 news
release) and comparative actual results for 2022 are set out in the
following table:
|
Mount Milligan
Mine(1) |
Units(2) |
2022 |
2023
Guidance |
|
Production |
|
|
|
|
Unstreamed gold production |
(Koz) |
123 |
104 -111 |
|
Streamed gold production |
(Koz) |
66 |
56 - 59 |
|
Total gold
production(3) |
(Koz) |
189 |
160 - 170 |
|
Unstreamed copper production |
(Mlb) |
60 |
49 - 57 |
|
Streamed copper production |
(Mlb) |
14 |
11 - 13 |
|
Copper
production(3) |
(Mlb) |
74 |
60 - 70 |
|
Costs(4) |
|
|
|
| Gold production costs |
($/oz) |
767 |
900 - 950 |
| All-in sustaining costs on a
by-product basisNG |
($/oz) |
630 |
1,075 - 1,125 |
| All-in costs on a by-product
basisNG |
($/oz) |
704 |
1,125 - 1,175 |
| All-in sustaining costs on a
co-product basisNG |
($/oz) |
956 |
1,150 - 1,200 |
| Copper production costs |
($/lb) |
1.70 |
1.90 - 2.15 |
| All-in
sustaining costs on a co-product basisNG |
($/lb) |
2.12 |
2.75 - 3.00 |
|
Capital Expenditures |
|
|
|
| Additions to PP&E |
($M) |
49.2 |
65 - 70 |
|
Total Capital
ExpendituresNG |
($M) |
54.7 |
65 - 70 |
|
SustainingNG |
($M) |
53.1 |
65 - 70 |
|
Non-sustainingNG |
($M) |
1.6 |
— |
|
Depreciation, depletion and amortization |
($M) |
79.2 |
65 - 80 |
|
British Columbia mineral tax |
($M) |
1.3 |
1 - 3 |
- The Mount
Milligan Mine is subject to an arrangement with RGLD Gold AG and
Royal Gold, Inc. (together, “Royal Gold”) which entitles them to
purchase 35% and 18.75% of gold and copper produced, respectively,
and requires Royal Gold to pay $435 per ounce of gold and 15% of
the spot price per metric tonne of copper delivered (“Mount
Milligan Streaming Arrangement”). Using an assumed market gold
price of $1,600 per ounce and a blended copper price of $3.55 per
pound for 2023, the Mount Milligan Mine’s average realized gold and
copper price would be $1,192 per ounce and $2.98 per pound,
respectively, when factoring in the Mount Milligan Streaming.
Arrangement. The blended copper price of $3.55 per pound factors in
2023 copper hedges and a market price of $3.25 per pound for the
unhedged portion.
- Unit costs
include a credit for forecasted copper sales treated as by-product
for all-in sustaining costs. Production for copper and gold
reflects estimated metallurgical losses resulting from handling of
the concentrate and metal deductions levied by smelters.
- Gold and copper
production at the Mount Milligan Mine assumes recoveries of 66% and
81%, respectively. 2023 gold ounces and copper pounds sold are
expected to be consistent with production.
- Units noted as
($/oz) relate to gold ounces and ($/lb) relate to copper
pounds.
The full year 2023 outlook for the Goldfield
Project, Kemess Project, the Molybdenum BU and corporate
administration, and comparative actual results for 2022 are set out
in the following table:
|
OtherCosts |
Units |
2022 |
2023
Guidance |
|
Goldfield Project - Project Development Costs |
($M) |
18.9 |
15 - 20 |
|
Goldfield Project - Exploration Costs |
($M) |
10.6 |
10 |
|
All Other Exploration Projects |
($M) |
40.5 |
25 - 35 |
|
Total Exploration and Project
Development(1) |
($M) |
70.0 |
50 - 65 |
| Kemess Project Care &
Maintenance Costs |
($M) |
14.6 |
15 - 17 |
| Molybdenum BU Free Cash Flow
DeficitNG |
($M) |
10.1 |
45 - 80 |
|
Corporate Administration Costs(2) |
($M) |
47.2 |
40 - 45 |
- The exploration and project
development costs include both expensed exploration and project
development costs as well as capitalized exploration costs and
exclude business development expenses. Approximately $3.0 million
and $1.0 million of these capitalized exploration costs are also
included in 2023 sustaining capital expendituresNG
estimates for Mount Milligan Mine and Öksüt Mine, respectively,
compared to $3.1 million and $1.2 million of capitalized
exploration costs for in 2022.
- 2022 actual
costs include severance costs of $7.9 million and consulting and
software costs of $4.1 million from various information technology
projects, including the implementation of the Company-wide
enterprise resource planning system.
Mount Milligan Mine Production
Profile
Mount Milligan Mine’s 2023 gold production is
expected to be in the range of 160,000 to 170,000 ounces compared
to 189,177 ounces produced in 2022. Copper production is expected
to be in the range of 60 to 70 million pounds compared to 73.9
million pounds produced in 2022. The Mount Milligan Mine’s 2023
gold production and copper production is expected to be slightly
higher in the second half of the year, driving a higher proportion
of concentrate sales into the fourth quarter of 2023. The Company
expects approximately 30% to 35% of concentrate sales to occur in
the fourth quarter of 2023. The lower production compared to the
2022 is due to mine sequencing. The Company continues to optimize
the life of mine plan for Mount Milligan and anticipates increases
in both gold and copper production for 2024 and 2025 when compared
to the annual figures included in the most recent Technical Report
for the mine.
Mount Milligan Mine Cost
Profile
Mount Milligan Mine gold production costs are
expected to be in the range of $900 to $950 per ounce sold in 2023.
Mount Milligan Mine gold production costs in the year ended
December 31, 2022 were $767 per ounce sold. Mount Milligan Mine
gold production cost guidance range in 2023 is higher than the $767
per ounce sold in the year ended December 31, 2022 primarily due to
lower ounces of gold sold and higher operating costs at the Mount
Milligan Mine in 2023, driven by the current inflationary
environment. Inflationary cost pressures have been noted in various
areas of the Mount Milligan Mine’s operations, mainly labour,
energy and consumables such as grinding media, tires, equipment
parts and diesel fuel.
Copper production costs at the Mount Milligan
Mine are expected to be in the range of $1.90 to $2.15 per pound
sold for the 2023 year compared to $1.70 per copper pound sold in
the year ended December 31, 2022 and reflect lower copper pounds
sold and higher operating costs in 2023 compared to the prior year
as noted above.
The Mount Milligan Mine’s all-in sustaining
costs on a by-product basisNG in 2023 are expected to be
in the range of $1,075 to $1,125 per ounce sold. Mount
Milligan Mine’s all-in sustaining costs on a by-product
basisNG were $630 per ounce sold in the year ended
December 31, 2022. In 2023, all-in sustaining costs on a by-product
basisNG are expected to increase due to higher
production costs per ounce as outlined above, higher capital
expenditures, and lower copper by-credits from lower copper sales
estimated for 2023, using a copper price of $2.98 per pound after
reflecting the streaming arrangement with Royal Gold and existing
hedges in place as of December 31, 2022, compared to 2022.
Mount Milligan Mine Capital
Expenditures
Additions to PP&E, an IFRS accounting figure
includes certain non-cash additions to PP&E such as changes in
future reclamation costs and capitalization of leases. Capital
expendituresNG, which comprise sustaining capital
expendituresNG and non-sustaining capital
expendituresNG, exclude such non-cash additions to
PP&E. The Mount Milligan Mine’s additions to PP&E in 2023
are expected to be in the range of $65 to $70 million compared to
$49.2 million in the year ended December 31, 2022. Total capital
expendituresNG in 2023 are expected to be in the range
of $65 to $70 million, consistent with 2023 expected additions to
PP&E and slightly higher than 2022 capital
expendituresNG of $54.7 million, primarily due to
additional capital expenditures related to water management
projects and major mining equipment overhauls.
Mount Milligan Mine Depreciation,
Depletion and Amortization (DD&A)
Mount Milligan Mine’s DD&A included in costs of
sales for 2023 is expected to be in the range of $65 to $80
million, compared to $79.2 million in 2022. DD&A at the Mount
Milligan Mine in 2023 is estimated to lower than in 2022 primarily
due to a lower estimate for gold and copper concentrate sales
volumes in 2023 due to mine sequencing as noted above.
Mount Milligan Mine Current
Taxes
The Mount Milligan Mine is subject to the British
Columbia mineral tax, which is estimated to be between $1 and $3
million in 2023 compared to $4.7 million in 2022.
Öksüt Mine
Due to the continued suspension of gold
production activities at the Öksüt Mine, the Company did not issue
2023 guidance for the Öksüt Mine. It is estimated that the Öksüt
Mine will incur average cash expenditures of approximately $7
to $10 million per month while its doré bar production remains
suspended. As of December 31, 2022, the carrying value of stored
gold-in-carbon inventory was $46.9 million.
Molybdenum Business
Unit
The Company’s 2023 expenditures for the
Molybdenum BU’s care and maintenance sites are estimated to be
between $30 and $35 million. Expenditures at the Endako Mine
are expected to be between $12 to $15 million, including
approximately $6 to $8 million of care and maintenance costs and $6
to $7 million of reclamation expenditures primarily relating to
work on the closure spillway for Tailings Pond 2.
For the Thompson Creek Mine, 2023 expenditures
are expected to be approximately $18 to $20 million, including $9
to $10 million of care and maintenance costs and $9 to 10
million of costs associated with project advancement including
early site works, project de-risking activities such as
geotechnical drilling and additional engineering costs as the
Company continues to assess a potential restart of the mine. The
molybdenum price has increased significantly in recent months from
around $15 per pound in August 2022 to $38 per pound in early
February 2023, creating a positive price environment for molybdenum
miners. The Company plans to issue a pre-feasibility study (“PFS”)
on the Thompson Creek Mine in the third quarter of 2023.
During 2022, the Company streamlined operations
at the Langeloth Facility to operate with lower inventory levels on
hand. The recent run-up in the molybdenum prices in excess of $30
per pound results in additional cash outflow being required to
purchase and maintain the same inventory levels, while finished
molybdenum products will also ultimately be sold at these higher
prices. If molybdenum prices remain elevated above 2022 levels,
this would result in increased working capital requirements at the
Langeloth Facility in 2023, with the expected additional investment
in working capital being approximately $15 million at a molybdenum
price of $20 per pound and $45 million at a molybdenum price of $30
per pound.
The free cash flow deficitNG at the
Molybdenum BU is expected to be in the range of $45 to $80 million,
inclusive of care and maintenance expenses, reclamation
expenditures, Thompson Creek project advancement activities, and
required investments in Langeloth working capital, which are highly
dependent on market molybdenum prices.
Exploration Expenditures (excluding
Project Development costs)
Exploration expenditures in 2023 are expected to
be $35 to $45 million, including $10 million (2022 - $11 million)
towards the Goldfield Project, and $25 to $35 million for all other
exploration projects. Exploration expenditures in 2023 include
brownfield exploration at the Mount Milligan Mine of $10 to $12
million (2022 - $15 million) and Öksüt Mine of $3 to $5 million
(2022 - $5 million) and the balance for greenfield and generative
exploration programs.
Goldfield Project
The Goldfield Project costs include both
exploration and project development costs and are expected to be in
the range of $25 to $30 million for 2023 including $15 to $20
million for project development costs and $10 million for
exploration costs as outlined above. The 2022 project development
costs and exploration costs related to the Goldfield Project
amounted to $29.5 million, including $18.9 million for project
development costs and $10.6 million for exploration costs. Ongoing
exploration activities will focus on expanding the resources around
the known deposits and on drill testing of peripheral targets
within the property. The Company is targeting an initial resource
estimate by mid-year 2023 followed by an updated resource estimate
accompanied by feasibility study.
Kemess Project
The Kemess Project will continue to be on a care
and maintenance in 2023 with expected care and maintenance costs
expected to be in the range from $15 to $17 million for 2023,
consistent with 2022 care and maintenance costs at the Kemess
Project of $14.6 million. This includes engineering design and
construction costs associated with the decommissioning of the
Kemess South tailings storage facility sedimentation pond and
associated works.
Corporate
Administration
Corporate and administration expenses for 2023
are expected to be in the range of $40 to $45 million (including $6
to $8 million of stock-based compensation expenses). Corporate and
administration expenses in 2022 were $47.2 million, including
severance costs of $7.9 million, consulting and software costs of
$4.1 million from various information technology projects,
including the implementation of the Company-wide enterprise
resource planning system and stock-based compensation expense of
$0.9 million. The corporate and administration expenses are
expected to be lower in 2023 compared to 2022 due to lower costs
related to the implementation of a new enterprise resource planning
software system and lower severance costs.
2023 Material
Assumptions
Other material assumptions or factors not
mentioned above but used to forecast production and costs for 2023,
after giving effect to the hedges in place as at December 31, 2022,
include the following:
- a market gold
price of $1,600 per ounce, and an average realized gold price at
the Mount Milligan Mine of $1,192 per ounce after reflecting the
streaming arrangement with Royal Gold (35% of the Mount Milligan
Mine’s gold is sold to Royal Gold for $435 per ounce).
- a market price of
$3.25 per pound for the unhedged portion of copper production,
representing a blended copper price of $3.55 per pound that gives
effect to the hedges in place as at December 31, 2022 resulting in
an average realized copper price at the Mount Milligan Mine of
$2.98 per pound after reflecting the streaming arrangement with
Royal Gold (18.75% of the Mount Milligan Mine’s copper is sold at
15% of the spot price per metric tonne).
- exchange rates:
$1USD:$1.30 CAD, $1USD:18.0 Turkish lira.
- diesel fuel price
assumption of $1.00/litre (CAD$1.30/litre) at the Mount Milligan
Mine.
Mount Milligan Streaming
Arrangement
Production at the Mount Milligan Mine is subject
to an arrangement with Royal Gold pursuant to which Royal Gold is
entitled to purchase 35% of the gold produced and 18.75% of the
copper production at the Mount Milligan Mine for $435 per
ounce of gold delivered and 15% of the spot price of copper
delivered (the “Mount Milligan Streaming Arrangement”). To satisfy
its obligations under the Mount Milligan Streaming Arrangement the
Company purchases refined gold and copper warrants and arranges for
their delivery to Royal Gold. The difference between the cost of
the purchases of refined gold and copper warrants, and the
corresponding amounts payable to the Company under the Mount
Milligan Streaming Arrangement is recorded as a reduction of
revenue and not a cost of operating the mine.
Other Material
Assumptions
Other material assumptions used in forecasting
production and costs for 2023 can be found under the heading
“Caution Regarding Forward-Looking Information” in this
document. Production, cost, and capital expenditure forecasts for
2023 are forward-looking information and are based on key
assumptions and subject to material risk factors that could cause
actual results to differ materially and which are discussed under
the heading “Risks That Can Affect Centerra’s Business” in the
Company’s most recent AIF.
2023 Sensitivities
Mount Milligan Mines’ costs and cash flows for
2023 are sensitive to changes in certain key inputs. The Company
has estimated the impact of any such changes on Mount Milligan
Mine’s costs and cash flows as follows:
|
|
|
Impact on
($ millions) |
Impact on
($ per ounce sold) |
|
|
|
Production
Costs &
Taxes |
Capital
Costs |
Cash flows |
All-in sustaining costs on
a by-product basis per
ounceNG |
|
Gold price(1)(2) |
$50/oz |
0.2 - 0.3 |
— |
5.0 - 5.5 |
1.0 - 1.5 |
Copper price(1)(2)
|
-10% |
0.2 - 0.3 |
— |
5.0 - 8.0 |
30.0 - 50.0 |
|
+10% |
1.0 - 1.2 |
— |
25.0 - 28.0 |
160.0 - 165.0 |
|
Diesel fuel(1) |
10% |
0.8 - 1.1 |
0.1 - 0.2 |
0.9 - 1.3 |
6.0 - 7.5 |
|
Canadian dollar(1)(3) |
10 cents |
7.5 - 9.5 |
1.5 - 2.0 |
9.0 - 11.5 |
60.0 - 70.0 |
(1) Includes the effect of the
Company’s copper, diesel fuel and Canadian dollar hedging programs,
with current 2023 exposure coverage of approximately 42%, 54% and
64%, respectively.
(2) Excludes the effect of 33,672
ounces of gold with an average provisional price of $1,831 per
ounce and 17.4 million pounds of copper with an average provisional
price of $3.81 per pound outstanding under contracts awaiting final
settlement in future months as of December 31, 2022.
(3) Appreciation of the currency
against the US dollar results in higher costs and lower cash flow
and earnings, depreciation of the currency against the US dollar
results in decreased costs and increased cash flow and
earnings.
Recent Events and
Developments
Update on Öksüt Mine
Operations
On March 18, 2022, Centerra announced that it
had temporarily suspended gold doré bar production at the Öksüt
Mine due to mercury detected in the gold room at the ADR plant.
Subsequent to the detection of mercury in the gold room, urine
samples were collected from full-time employees and contractors
working in and around the gold room and analyzed at an independent
certified medical laboratory. Although elevated mercury values were
detected in 12 individuals, following their medical examinations,
each of them have been cleared to return to full time duty at the
mine. The Company continues to monitor and support the health care
needs of its workers. In conjunction with the engineered solution
for the gold room at the ADR plant, the Company revised all related
health and safety protocols necessary for the installation and safe
operation of the new equipment and systems in accordance with the
manufacturer’s recommendations and regulatory standards.
After ceasing gold room operations in March
2022, the affected areas were professionally cleaned, and any
contaminated material was removed and properly disposed of. An
engineered solution was developed with the assistance of external
consultants to ensure that mercury levels are detected, monitored
and captured to prevent exposure to personnel and to safeguard the
environment. The Company completed construction of a mercury
abatement system to allow processing of mercury bearing ores below
the original budget of $5 million and it continues to work with
relevant authorities to obtain the required approvals to restart
gold room operations at the ADR plant. Once operations resume, the
ADR plant is expected to have sufficient production capacity to
process up to approximately 35,000 ounces of gold per month.
From the date of suspension of gold room
operations through to August 2022, the Company continued to process
ore into gold-in-carbon form and has approximately 100,000
recoverable ounces of stored gold-in-carbon as at December 31,
2022, having incurred substantially all associated production costs
with all material production costs incurred (excluding royalty
charges). In addition, the Öksüt Mine had approximately 200,000
recoverable ounces of gold in the ore stockpiles and on the heap
leach pad as at December 31, 2022.
Permitting
In May 2022 the Öksüt Mine was inspected by the
Ministry of Environment, Urbanization and Climate Change (the
“Ministry of Environment”). The Ministry of Environment informed
the Öksüt Mine of a number of deficiencies relating to the Öksüt
Mine’s environmental impact assessment (“EIA”). The Company worked
to address the majority of the deficiencies and following several
further discussions with the Ministry of Environment, (i) the
Company determined that an updated EIA should be prepared and
submitted to clarify various production and other capacity limits
and to align the EIA production levels with current operating
plans; (ii) the Öksüt Mine suspended leaching of ore on the heap
leach pad and ceased using activated carbon on site effective late
August 2022 though mining, crushing and stacking activities
continued in line with existing EIA limits for the remainder of
2022.
The Öksüt Mine has built substantial inventories
of gold-in-carbon, ore stacked on the heap leach pad and ore
stockpiles and has therefore paused crushing and stacking
activities. The Öksüt Mine is currently focusing mining activities
on the Phase 5 pit wall pushback to expand the Keltepe pit.
The Öksüt Mine’s application to update its EIA
was submitted to regulators at the end of August 2022 and the new
updated EIA was submitted in January 2023. The Company is working
with Turkish officials and other stakeholders on the regulatory
review and approval of its EIA and other permits that may be
required to allow for a timely full restart of all operations.
The Company is also engaged in other ordinary
course permitting matters and in January 2023 it received notice of
approval of its operating license extension application for a
period of 10 years as well as approval of an enlarged grazing land
permit to allow expansion of the Keltepe and Güneytepe pits as
planned.
Normal Course Issuer
Bid
On October 11, 2022, Centerra announced the
Toronto Stock Exchange had accepted its notice of intention to
proceed with a normal course issuer bid (“NCIB”). Under the NCIB,
Centerra may purchase for cancellation up to an aggregate of
15,610,813 common shares in the capital of the Company during the
twelve-month period commencing on October 13, 2022 and ending on
October 12, 2023, representing 10% of the public float. Any
tendered Common Shares taken up and paid for Centerra under the
NCIB will be cancelled.
During year ended December 31, 2022, the Company
repurchased and cancelled 2,183,900 common shares for the total
consideration of $11.2 million (C$15 million) under its NCIB
program.
Acquisition of Goldfield
Project
On February 28, 2022, Centerra announced the
completion of the acquisition of Gemfield Resources LLC, owner of
the Goldfield Project, from Waterton Nevada Splitter, LLC. The
final purchase consideration comprised $176.7 million in cash paid
at closing, including reimbursement of $1.7 million incurred by the
seller for the construction of a water supply infrastructure, and a
$31.5 million deferred milestone payment. At the option of
Centerra, the deferred milestone payment is payable in cash or
common shares of the Company and becomes payable the earlier of 18
months following the closing of the transaction or the date a
construction decision is approved by its Board of Directors with
respect to the project, among other things.
The Goldfield Project is a conventional
open-pit, heap leach project located in Nevada, USA, a Tier 1
mining jurisdiction, and contains three known deposits. The Company
believes that the project has upside potential from its large,
under-explored land position in an established mining area in
Nevada. The project increases Centerra's exposure to North America
and provides an asset that can act as a foothold for further
opportunities in the United States.
Drill programs at the Goldfield Project were
commenced in June 2022, following the purchase of the project in
February 2022. Drill programs included infill, resource expansion,
and exploration drilling as well as metallurgical, geotechnical,
and hydrogeochemical drilling, in support of an initial resource to
be completed by mid-year 2023 and an updated resource estimate
accompanied by a feasibility study thereafter. The 2022 reverse
circulation (“RC”) and diamond drill programs included 149
exploration, infill, and resource expansion holes, 16 metallurgical
holes, 17 geotechnical holes, 22 condemnation holes, and two
water monitoring wells. Exploration drilling in 2022 principally
targeted gold mineralization below and adjacent to the known
mineralization at the Gemfield and Goldfield Main deposits. As of
the end of 2022, a total of 48,765 metres of drilling was completed
in 206 drill holes (200 holes were completed and six holes were
abandoned due to ground conditions).
Responsible Gold Mining Principles
(“RGMPs”)
The Company completed Year 2 assurance of the
RGMPs and published its 2021 RGMP Progress Report in March 2022
(2021 RGMP Progress Report). For the remainder of 2022, the company
progressed activities towards closing gaps and achieved a full
rollout of the RGMPs at its operating sites in the fourth quarter
of 2022. A Year 3 RGMP conformance report along with an independent
assurance letter is expected to be integrated into the Company’s
2022 Environmental and Social Governance Report to be issued by
mid-year 2023.
Global Supply Chain Disruption and
Inflation Pressures
Centerra continues to assess the resiliency of
its supply chains, maintain increased mine site inventories of key
materials and fixed asset components and has increased its stock of
key supplies to mitigate supply chain risks. Additionally, the
Company is pursuing an active sourcing strategy to identify
potential alternatives for its critical supplies that can be
purchased in alternative countries to reduce the risk of extended
lead-times while trying to maintain an optimal cost structure. The
Company also continues to monitor for any adverse impact on the
global supply chain and consequences from the Russian invasion in
Ukraine and the earthquake in the southeastern portion of Türkiye;
however, the supply of critical consumables and reagents to the
Company’s sites has not been affected to date.
The Company is affected by the current
inflationary environment and its impact on certain operating costs.
A significant portion of the upward pressure on prices has been
attributed to the rising costs of labour, energy and consumables.
At the Öksüt Mine, the impact of hyperinflation on labour costs and
slightly higher electricity costs was more than offset by the
continuing devaluation of the Turkish lira. While there has been
minimal impact on its operations at the Öksüt Mine to date, the
Company is currently anticipating increases in cyanide and
activated carbon prices in the future.
Update on the Mount Milligan Mine’s
life of mine (“LOM”) plan
On October 4, the Company announced a mine life
extension for the Mount Milligan Mine by over four years extending
operations into 2033 and an increase in proven and probable gold
mineral reserves from the 2021 year-end mineral reserve and
resources summary by 1.1 million contained ounces (from 1.8 million
to 2.9 million) and copper mineral reserves by 260 million
contained pounds (from 736 million to 996 million).
The Technical Report pursuant to National
Instrument 43-101, titled “Technical Report on The Mount Milligan
Mine” with an effective date of December 31, 2021 (“Mount Milligan
Mine Technical Report”), was filed on SEDAR at www.sedar.com and EDGAR
at www.sec.gov/edgar on
November 7, 2022.
Executive Management
Changes
The Company announced appointment of Paul
Chawrun as its new Chief Operating Officer in August 2022.
On September 6, Paul Wright, a director of
Centerra, replaced Scott Perry as President and Chief Executive
Officer of Centerra. Mr. Wright will act as interim President and
Chief Executive Officer to manage the Company through a leadership
transition period. The Board continues to work with an executive
search firm to select Centerra’s next Chief Executive Officer.
Kumtor Mine
On July 29, 2022, Centerra announced that it had
completed a transaction contemplated by the Global Arrangement
Agreement dated April 4, 2022 (the “Arrangement Agreement”) with,
among others, Kyrgyzaltyn and the Kyrgyz Republic to effect a
separation of the parties, including through the disposition of
Centerra’s ownership of the Kumtor Mine and its investment in the
Kyrgyz Republic, the purchase for cancellation by Centerra of
Kyrgyzaltyn’s 77,401,766 Centerra common shares, the termination of
Kyrgyzaltyn’s involvement in the Company, and the resolution of
disputes (the “Transaction”).
As a result of the completion of the
Transaction, Centerra has repurchased and cancelled all of
Kyrgyzaltyn’s 77,401,766 Centerra common shares in exchange for,
among other things, Centerra’s 100% equity interest in its two
Kyrgyz subsidiaries, and indirectly, the Kumtor Mine, with
Kyrgyzaltyn and the Kyrgyz Republic assuming all responsibility for
the Kumtor mine, including all reclamation and environmental
obligations, and aggregate cash payments of approximately $93
million (a portion of which was withheld on account of Canadian
withholding taxes payable by Kyrgyzaltyn and a portion of which was
paid to the Company’s financial advisors as transaction costs). The
completion of the Transaction resulted in:
- Full and final releases of all past,
present and future claims of the parties.
- Termination of legal proceedings
involving the parties in all jurisdictions with no admissions of
liability. This includes:
- Any and all cases, proceedings,
investigations, inquiries or other actions by the Kyrgyz Republic,
Kyrgyzaltyn or any other Kyrgyz governmental entity or any person
acting on behalf of and/or for the benefit of any such person
against Centerra and the other persons and entities released under
the Arrangement Agreement (the “Kyrgyz Proceedings”) were withdrawn
and terminated to Centerra’s sole satisfaction;
- The parties have jointly sought the
termination of the international arbitration proceedings that were
previously commenced by the Company, KGC and Kumtor Operating
Company (“KOC”) against the Kyrgyz Republic and Kyrgyzaltyn;
- Centerra has agreed
to consent to an order setting aside the judgement issued in the
Ontario Superior Court of Justice against Mr. Tengiz Bolturuk on
February 15, 2022; and
- Chapter 11 proceedings in U.S.
Bankruptcy Court for the Southern District of New York involving
KGC and KOC were dismissed.
- Resolution of the inter-company
balance between Centerra and KGC in part by paying $50 million to
KGC on closing of the Arrangement and, as to the balance, by way of
set off against an offsetting dividend to be declared by KGC
immediately prior to closing of the Arrangement.
- The resignation from Centerra’s
Board of Directors of Kyrgyzaltyn’s two nominees and the
termination of the shareholders agreement between, among others,
Centerra and Kyrgyzaltyn.
- Termination of all agreements
entered into by Centerra in respect of the Kumtor Mine vis-à-vis
Centerra’s rights and obligations.
Further details on the terms of the Arrangement
Agreement and the Transaction can be found in Centerra’s April 4,
2022 news release and in Centerra’s management information circular
in respect of the special meeting of Centerra shareholders held on
July 25, 2022 to approve the Transaction, copies of which are
available on SEDAR at www.sedar.com and on
EDGAR at www.sec.gov/edgar.
Risks That Can Affect Centerra’s
Business
Overview
The Company’s business contains significant risk
due to the nature of mining, exploration, and development
activities. Certain risk factors, including but not limited to
those listed below, are similar across the mining industry while
others are specific to Centerra. The risk factors below may include
details of how Centerra seeks to mitigate these risks where
possible. For additional discussion of risk factors please refer to
the Company’s most recent Annual Information Form (the “AIF”),
which is available on the Company’s website www.centerragold.com, at
SEDAR at www.sedar.com and
EDGAR at www.sec.gov/edgar.
The Company is subject to risks that can have a
material effect on the profitability, future cash flow,
decommissioning and reclamation costs, financial condition of the
Company and its stated mineral reserves. Some of these risks relate
to the mining industry in general, and others apply to specific
properties, operations or planned operations. The Company has
implemented an enterprise risk management (“ERM”) program which
applies to all of its operations and corporate offices. The program
is based on leading international risk management standards and
industry best practice. It employs both a bottom-up and top-down
approach to identify and address risks from all sources that
threaten the achievement of the Company’s objectives. Each
operating site and project are responsible for identifying,
assessing, mitigating, and monitoring risk. Efforts are coordinated
by appointed “Risk Champions” who facilitate the process and
provide regular reporting to Centerra’s corporate risk
function.
The ability to deliver on the Company’s vision,
strategic objectives and operating guidance depends on Centerra’s
ability to understand and appropriately respond to the
uncertainties or “risks” the Company faces that may prevent
Centerra from achieving the Company’s objectives. In order to
achieve this, Centerra:
- Maintains a framework that permits
the Company to manage risk effectively and in a manner that creates
the greatest value through risk informed decision making;
- Integrates a
process for managing risk into all the Company’s important
decision-making processes so that Centerra reduces the effect of
uncertainty on achieving the Company’s objectives;
- Actively monitors
key controls the Company relies on to achieve Centerra’s objectives
so that they remain in place and are effective at all times;
and,
- Provides
assurance to senior management and relevant committees of the Board
on the effectiveness of key risk management activities.
The risk management program at Centerra
considers the full life of mine cycle from exploration through to
closure. All aspects of the operation and the Company’s
stakeholders are considered when identifying risks. As such, the
Company’s risk management program encompasses a broad range of
risks including technical, financial, commercial, social,
reputational, environmental, governance, health and safety,
political and human resources related risks.
Board and Committee
Oversight
The Board of Directors has oversight
responsibilities for the policies, processes and systems for the
identification, assessment, and management of the Company’s
principal strategic, financial, and operational risks. Each of the
Board’s standing committees is responsible for overseeing risks
related to their area of responsibility and reviewing the policies,
standards and actions undertaken to mitigate such risks.
Management Oversight
The Company’s executive team meets regularly to
review the risks facing the organization and to discuss the
implementation and effectiveness of mitigation actions.
Principal Risks
The following section describes the risks that
are most material to the Company’s business. This is not a complete
list of the potential risks the Company faces; there may be others
the Company is not aware of, or risks that the Company feels are
not material today that could become material in the future. For a
more comprehensive discussion about the Company’s risks, see the
most recent Form 40-F/AIF on file with the SEC and Canadian
provincial securities regulatory authorities and see the
“Caution Regarding Forward-Looking Information” in this
MD&A.
Strategic, Legal and Planning Risks
Strategic, legal and planning risks include
political risks associated with the Company’s operations in
Türkiye, United States and Canada, including potential uncertainty
created the impact of changes in, or more aggressive enforcement of
laws, regulations and government practices including with respect
to the environment and including unjustified civil or criminal
action against the Company, its affiliates, or its current or
former employees; risk of failure of Centerra or its operations to
comply with such laws, regulations or government practices and the
potentially significant consequences thereof, including potential
fines and penalties, loss of permits, interruptions or cessation of
operations and loss of reputation; risks that community activism
may result in increased contributory demands or business
interruptions; delays or refusals to grant required permits and
licenses; status of the Company’s relationships with local
communities; Indigenous claims and consultation issues relating to
the Company’s properties which are in proximity to Indigenous
communities; risks of actions taken by the Kyrgyz Republic, or any
of its instrumentalities, in connection with the Company’s prior
ownership of the Kumtor Mine or the Global Arrangement Agreement;
including unjustified civil or criminal action against the Company,
its affiliates, or its current or former employees; the risks
related to outstanding litigation affecting the Company; the impact
of any sanctions imposed by Canada, the United States or other
jurisdictions against various Russian and Turkish individuals and
entities; the impact of constitutional changes or political events
or elections in any country that the Company operates in; risks
that the Company experiences delay or disruption in its
applications for new or amended EIA or other permits at the Öksüt
Mine; potential defects of title in the Company’s properties that
are not known as of the date hereof; the inability of the Company
and its subsidiaries to enforce their legal rights in certain
circumstances; conflicts of interest among its board members; risks
related to anti-corruption legislation; Centerra’s future
exploration and development activities not being successful;
Centerra not being able to replace mineral reserves and resources;
risks related to mineral reserves and resources being imprecise;
production and cost estimates, including decommissioning and
reclamation costs, may be inaccurate; Indigenous claims and
consultative issues relating to the Company’s properties which are
in proximity to Indigenous communities; reputational risks,
particularly in light of the increase in social media; inability to
identify new opportunities and to grow the business; large
fluctuations in the Company’s trading price that are beyond the
Company’s control or ability to predict and mitigate; potential
risks related to kidnapping or acts of terrorism.
Financial Risks
The Company is subject to risks related to its
financial position and total liquidity, including sensitivity of
the Company’s business to the volatility of gold, copper,
molybdenum and other mineral prices; the use of provisionally-
priced sales contracts for production at the Mount Milligan Mine;
reliance on a few key customers for the gold-copper concentrate at
the Mount Milligan Mine and gold doré at the Öksüt Mine; use of
commodity derivatives; the imprecision of the Company’s mineral
reserves and resources estimates and the assumptions they rely on;
the accuracy of the Company’s production and cost estimates;
inflationary pressures on key input prices, the imprecision of the
Company’s mineral reserves and resources estimates and the
assumptions they rely on; the accuracy of the Company’s production
and cost estimates; inflationary pressures on key input prices;
sensitivity to fuel price volatility; the impact of currency
fluctuations; global financial conditions; access to future
financing including the impact of environmental, social and
corporate governance practices and reporting on the Company’s
ability to obtain future financing or accessing capital; the impact
of restrictive covenants in the Company’s credit facility which
may, among other things, restrict the Company from pursuing certain
business activities or making distributions from its subsidiaries
or making distributions to its shareholders; the Company’s ability
to obtain future financing; the impact of global financial
conditions; the effect of market conditions on the Company’s
short-term investments; the Company’s ability to make payments,
including any payments of principal and interest on the Company’s
debt facilities, which depends on the cash flow of its
subsidiaries; the ability to obtain adequate insurance coverage;
and changes to taxation laws in the jurisdictions where the Company
operates.
Operational Risks
Mining and metals processing involve significant
production and operational risks. Some of these risks are outside
of the Company’s control or ability to predict and mitigate. Some
of these risks extend beyond the production life of the property in
question. Risks include, but are not limited to, the following:
unanticipated ground and water conditions; shortages of water for
processing activities; adjacent or adverse land or mineral
ownership that results in constraints on current or future mine
operations; geological risks, including earthquakes and other
natural disasters; wildfires; metallurgical and other processing
risks; unusual or unexpected mineralogy or rock formations; ground
or slope failures; pit flooding; the integrity of tailings storage
facilities and the management thereof, including as to stability,
compliance with laws, regulations, licenses and permits,
controlling seepages and storage of water where applicable; the
stability of the pit walls at the Company’s operations leading to
structural cave-ins, wall failures or rock-slides; flooding or
fires; equipment failures or performance problems; periodic
interruptions due to inclement or hazardous weather conditions or
operating conditions and other force majeure events; the risk of
having sufficient water to continue operations at the Mount
Milligan Mine and achieve expected mill throughput; seismic
activity; wildfires; lower than expected ore grades or recovery
rates; interruption of energy supply; the Company’s ability to
attract and retain qualified personnel; the occurrence of any
labour unrest or disturbance and the ability of the Company to
successfully renegotiate collective agreements when required; the
availability of drilling and related equipment in the area where
mining operations will be conducted; the failure of equipment or
processes to operate in accordance with specifications or
expectations including mechanical breakdowns; the risk that
Centerra’s workforce and operations may be exposed to widespread
epidemic including, but not limited to, the COVID-19 pandemic;
inherent risks associated with the use of sodium cyanide in the
mining operations; the ability of the Company to address physical
and transition risks from climate change and sufficiently manage
stakeholder expectations on climate-related issues; regulations
regarding greenhouse gas emissions and climate change; competition
for mineral acquisition opportunities; the success of the Company’s
future exploration and development activities, including the
financial and political risks inherent in carrying out exploration
activities; the Company’s ability to manage its projects
effectively and to mitigate the potential lack of availability of
contractors, budget and timing overruns and project resources; the
Company’s ability to accurately predict decommissioning and
reclamation costs and the assumptions they rely on; attracting and
retaining qualified personnel; long lead-times required for
equipment and supplies given the remote location of some of the
Company’s operating properties, changes to, or delays in the
Company’s supply chain and transportation routes, including
cessation or disruption in rail and shipping networks whether
caused by decisions of third-party providers or force majeure
events (including, but not limited to, flooding, wildfires,
COVID-19, or other global events such as wars); reliance on a
limited number of suppliers for certain consumables, equipment and
components; risks associated with the conduct of joint
ventures/partnerships; the adequacy of the Company’s insurance to
mitigate the cost impacts of operational and corporate risks; third
party risks arising from outsourcing and other vendor contracts the
security of critical operating systems and the risk of cyber
incidents such as. cyber crime, malware/ransomware causing system
downtime, data breaches, fines and penalties.
Market Conditions
Commodities
The Company's profitability is materially
affected by the market price of metals, primarily the prices of
gold, copper and molybdenum. Metal prices fluctuate widely and are
affected by numerous factors beyond the Company's control.
| |
Average spot price
|
|
|
Three months ended December 31, |
Years ended December 31, |
|
|
2022 |
2021 |
% Change |
2022 |
2021 |
% Change |
|
Gold (per oz) |
1,728 |
1,795 |
(4 |
)% |
1,800 |
1,799 |
— |
% |
| Copper (per lb) |
3.63 |
4.40 |
(18 |
)% |
3.99 |
4.23 |
(6 |
)% |
|
Molybdenum (per lb) |
21.39 |
18.89 |
13 |
% |
18.73 |
15.98 |
17 |
% |
In the fourth quarter of 2022, the average gold
price decreased when compared to the fourth quarter of 2021,
whereas the average gold price for the year ended December 31, 2022
was relatively consistent with prior period. The gold price
fluctuated significantly in 2022 with a lowest price of $1,625 per
ounce in the fourth quarter and a highest price in the first
quarter of 2022 of $2,023 per ounce. Subsequent to the end of 2022,
the gold price increased. The gold price was impacted by a variety
of factors, including the effects investor changing allocation
between gold and US dollars depending on interest rate expectation,
the effects of the COVID-19 pandemic lockdown measures,
geopolitical tensions and rising inflation, along with a shift in
monetary policy by central banks, and significant decline in
confidence of cryptocurrency as a store of value, among other
factors.
In the fourth quarter of 2022 and year ended
December 31, 2022, the average copper price decreased when compared
to the fourth quarter of 2021 and year ended December 31, 2021. The
copper price fluctuated significantly in 2022 with a lowest price
of $3.18 per pound and a highest price of $4.87 per pound,
ultimately trading in a tighter range of $3.37 to $3.87 per
pound in the fourth quarter of 2022. The decrease through the
second half of the year and fourth quarter is attributable to
concerns regarding inflationary pressures potentially pushing the
global economy into recession, thereby lowering global demand for
the metal. The latter half of the fourth quarter of 2022 saw a rise
in copper prices and increased optimism surrounding the metal with
the price increasing to above $4.00 per pound subsequent to the end
of the year.
In the fourth quarter of 2022, the average
molybdenum price increased when compared to the fourth quarter of
2021, whereas the average molybdenum price for the year ended
December 31, 2022 was relatively consistent with prior period. The
molybdenum price increased rapidly in the latter half of the fourth
quarter of 2022 as demand increased with a return to the market of
buyers in China as well as projections indicating potential supply
deficit for the near term and longer term. Moving forward, the
molybdenum price is expected to be impacted by Chinese supply and
demand, including the increase in the number of global
infrastructure projects and declining by-product molybdenum
production at a number of copper mines around the world, among
other factors.
Foreign Exchange
The Company receives its revenue through the
sale of gold, copper and molybdenum in US dollars. The Company has
operations in Canada, including its corporate head office, Türkiye
and the United States.
The exchange rate of the Canadian dollar and
Turkish lira relative to the US dollar is an important financial
driver for the Company for the following reasons:
- all revenues are earned in US
dollars;
- a significant
portion, approximately 50%, of operating and capital costs at the
Öksüt Mine are incurred in Turkish lira;
- a majority, approximately 90%, of
operating and capital costs at the Mount Milligan Mine are incurred
in Canadian dollars;
Approximately 61% (2021 - 57%) of the Company’s
combined expenditures from continuing operations were incurred in
currencies other than the US dollar during the year ended December
31, 2022.
The performance of these currencies during the
periods ended December 31, 2022 and 2021 is as follows:
|
|
Average market exchange rate |
|
|
Three months ended December
31, |
Years ended December
31, |
|
|
2022 |
2021 |
% Change |
2022 |
2021 |
% Change |
|
USD-CAD |
1.36 |
1.26 |
8% |
1.30 |
1.25 |
4% |
|
USD-Turkish Lira |
18.61 |
11.16 |
67% |
16.57 |
8.89 |
86% |
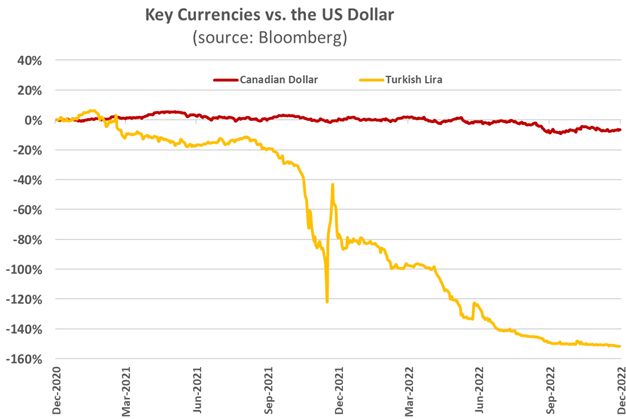
On average, the Canadian dollar weakened against
the US dollar for the fourth quarter and year ended December 31,
2022 when compared to the fourth quarter and year ended December
31, 2021. The USD/CAD currency pairing, ended the year at $1.36
compared to $1.26 as at December 31, 2021. The closing price at
December 31, 2022 was in line with the average price for the fourth
quarter. The US dollar strengthened against most currencies,
inclusive of the Canadian dollar as strong actions increasing
interest rates to combat inflation has been taken by the US Federal
Open Market Committee, along with global recessionary concerns
creating a flight to the safe haven currency.
On average the Turkish lira weakened relative to
the US dollar for the fourth quarter and year ended December 31,
2022 when compared to the fourth quarter and year ended December
31, 2021, ending the year at 18.7. The devaluation of the Turkish
lira is being offset by persistent high levels of inflation in
Türkiye. The Company expects this trend of high inflation in
Türkiye to continue in the near term, but has seen a decrease in
the rate of inflationary increases more recently.
The Company utilizes its foreign exchange
hedging program in order to manage its exposure to adverse
fluctuations in the Canadian dollar, relative to the US dollar, see
“Financial Instruments”. The Company does not currently hedge the
Turkish lira.
Diesel Fuel
Fuel costs at Centerra’s continuing operations
represent approximately 7% of production costs. The prices for
Mount Milligan Mine’s diesel fuel are based on a supply agreement
for weekly deliveries and priced at the Prince George Rack Rate.
The Prince George Rack Rate reflects general benchmark movements,
plus additional costs such as seasonal premiums for winterizing,
costs to meet regulatory requirements and transportation costs.
Mining operations at the Öksüt Mine are outsourced, and the fuel
operating cost is included in the outsourcing contract costs, based
on the published local retail diesel market price.
The Company utilizes its diesel hedging program
in order to manage its exposure to adverse fluctuations in diesel
fuel prices, see “Financial Instruments” section of this
MD&A.
Liquidity and Capital
Resources
The Company’s total liquidity position as
December 31, 2022 was $923.4 million, representing a cash balance
of $531.9 million and $391.5 million available under a corporate
credit facility. Credit Facility availability is reduced by
outstanding letters of credit, amounting to $8.5 million as at
December 31, 2022.
As a result of the loss of control of the Kumtor
Mine in the second quarter of 2021, the Company derecognized the
assets and liabilities of the Kumtor Mine in the statements of
financial position and presented its financial and operating
results prior to the loss of control as discontinued operations for
the first quarter of 2021. As a result, the Company’s consolidated
cash flow results from continuing operations discussed in this
MD&A (including prior periods) exclude the Kumtor Mine’s
operations, unless otherwise noted.
Fourth Quarter 2022 compared to Fourth
Quarter 2021
See the Overview of Consolidated Results
section in this MD&A for the discussion of cash used in
operating activities.
Cash used in investing activities of $15.5
million was recognized in the fourth quarter of 2022 compared to
cash used in investing activities from continuing operations of
$13.1 million in the fourth quarter of 2021. The increase is
primarily due to proceeds received on the disposition of PP&E
in 2021, partially offset by lower PP&E additions at the Mount
Milligan Mine in fourth quarter of 2022 compared to 2021.
Cash used in financing activities during the
fourth quarter of 2022 was $23.5 million compared to $13.1 million
in the fourth quarter of 2021. The increase was primarily due to
the repurchase and cancellation of Centerra common shares under the
Company’s NCIB program.
Year ended December 31, 2022 compared
to 2021
See the Overview of Consolidated Results
section in this MD&A for the discussion of cash provided by
operating activities.
Cash used in investing activities of $255.6
million was recognized in 2022 compared to cash provided by
investing activities from continuing operations of $132.5 million
in 2021. The cash used in investing activities was primarily due to
the acquisition of the Goldfield Project of $176.7 million,
partially offset by lower PP&E additions at the Mount Milligan
and Öksüt Mines. Cash provided by investing activities from
continuing operations in 2021 includes proceeds received from the
sale of the Company’s 50% interest in the Greenstone Partnership of
$210.3 million.
Cash used in financing activities of $157.7
million was recognized in 2022 compared to $49.1 million in 2021.
The increase was primarily due to repurchase and cancellation of
approximately 77,401,766 Centerra common shares held by Kyrgyzaltyn
as part of the Transaction contemplated by the Arrangement
Agreement and the repurchase and cancellation of approximately
2,183,900 Centerra common shares under the Company’s NCIB
program.
Financial Performance
As previously disclosed, the Company lost
control of the Kumtor Mine in May 2021 and, accordingly, the Kumtor
Mine has been classified as a discontinued operation. The financial
and operating data below is presented on a continuing operations
basis and thus excludes the Kumtor Mine for all periods discussed,
unless otherwise noted.
Fourth Quarter 2022 compared to Fourth
Quarter 2021
Revenue of $208.3 million was recognized in the
fourth quarter of 2022 compared to $251.1 million in the fourth
quarter of 2021. The decrease in revenue was primarily due to no
ounces of gold sold at the Öksüt Mine, lower gold ounces and copper
pounds sold and lower average realized copper prices at the Mount
Milligan Mine. The overall decrease in revenue was partially offset
by higher average realized molybdenum prices and an increase in the
pounds of molybdenum sold at the Molybdenum BU.
Gold production was 53,222 ounces in the fourth
quarter of 2022 compared to 91,197 ounces in the fourth quarter of
2021. Gold production in the fourth quarter of 2022 included 53,222
ounces of gold from the Mount Milligan Mine compared to 59,529
ounces in the fourth quarter of 2021 primarily due to lower gold
head grades and slightly lower recoveries, partially offset by
higher mill throughput. There were no gold ounces produced at the
Öksüt Mine in the fourth quarter of 2022 compared to 31,668 ounces
in the fourth quarter of 2021 due to the continued suspension of
gold room operations at the ADR plant.
Copper production at the Mount Milligan Mine was
16.9 million pounds in the fourth quarter of 2022 compared to 17.0
million pounds in the fourth quarter of 2021. The slight decrease
was primarily due to lower copper grades, partially offset by
higher mill throughput and higher recoveries.
The Langeloth Facility roasted 4.6 million
pounds and sold 4.0 million pounds of molybdenum in the fourth
quarter of 2022, compared to 2.5 million pounds and 2.4 million
pounds, respectively in the fourth quarter of 2021. This increase
in the molybdenum roasted was primarily due to execution on the
business plan to streamline molybdenum inventory volumes held and
partially due to an increase in molybdenum concentrate available
for roasting, resulting from an increase in concentrate supply.
Cost of sales of $175.3 million was recognized
in the fourth quarter of 2022 compared to $163.0 million in the
fourth quarter of 2021. The increase was primarily attributable to
higher production costs at the Molybdenum BU as a result of higher
average molybdenum prices paid to purchase third-party molybdenum
concentrate to be processed and an increase in pounds of molybdenum
roasted and sold. The overall increase in cost of sales was
partially offset by the lower DDA at the Mount Milligan Mine
primarily attributable to the increase in proven and probable
reserves as well as no cost of sales at the Öksüt Mine due to all
production costs and DDA being capitalized to production
inventory.
Gold production costs were $790 per ounce in the
fourth quarter of 2022 compared to $550 per ounce in the fourth
quarter of 2021. The increase was primarily due to lower gold
ounces sold at the Mount Milligan Mine and the Öksüt Mine. The
increase was partially offset by slightly lower production costs at
the Mount Milligan Mine due to a decrease in gold ounces sold,
partially offset by higher mining and administrative expenses due
to the impact of rising inflation in Canada. No gold production
costs were reported at the Öksüt Mine in the fourth quarter of 2022
as there was no gold sold.
All-in sustaining costs on a by-product
basisNG from continuing operations were $987 per ounce
in the fourth quarter of 2022 compared to $591 per ounce in the
fourth quarter of 2021. The increase in all-in sustaining costs on
a by-product basisNG was primarily due to a decrease in
ounces of gold sold, an increase in corporate administration
expenses, a decrease in by-product credits from lower pounds of
copper sold, partially offset by a decrease in sustaining capital
expendituresNG.
All-in costs on a by-product basisNG
from continuing operations were $1,572 per ounce in the fourth
quarter of 2022 compared to $732 per ounce in the fourth quarter of
2021. The increase was primarily due to higher all-in sustaining
costs on a by-product basisNG as noted above, and higher
exploration and project development costs mostly related to the
Goldfield Project.
Expensed exploration and evaluation expenditures
of $23.5 million were recognized in the fourth quarter of 2022
compared to $7.3 million in the fourth quarter of 2021. The
increase was primarily due to drilling activities and technical
studies undertaken as part of project development activities at the
Goldfield Project, and the brownfield exploration activities at the
Mount Milligan Mine. The total expenditures of $23.5 million
recognized in the fourth quarter of 2022 comprised of:
- $8.0 million of
project development costs at the Goldfield Project (nil in the
fourth quarter of 2021);
- $6.2 million of
drilling and related costs at the Goldfield Project (nil in the
fourth quarter of 2021);
- $2.1 million of
drilling and related costs at the Mount Milligan Mine ($1.1 million
in the fourth quarter of 2021);
- $1.4 million of
drilling and related costs at the Öksüt Mine ($0.6 million in the
fourth quarter of 2021); and
- $5.8 million of
drilling and related costs across the Company’s other exploration
projects ($5.6 million in the fourth quarter of 2021).
A non-cash impairment loss of $145.9 million
($138.2 million, net of tax) was recognized in the fourth quarter
of 2022, related to the Kemess Project. The impairment loss
reflects the lack of capital allocation to fund the project’s
advancement in 2023 or near future. An impairment reversal of
$160.0 million ($117.3 million, net of tax) was recognized in the
fourth quarter of 2021, related to the Mount Milligan Mine.
Reclamation recovery was $3.5 million in the
fourth quarter of 2022 compared to reclamation expense of $24.3
million in the fourth quarter of 2021. The $3.5 million reclamation
recovery at sites on care and maintenance in the Molybdenum BU was
primarily attributable to an increase in the risk-free interest
rates applied to discount the estimated future reclamation cash
flows, partially offset by an increase in underlying future
reclamation cash flows impacted by various factors, including
higher short-term inflation and an increase in the scope of
reclamation activities at the Endako Mine and the Thompson Creek
Mine.
Other non-operating income of $9.2 million was
recognized in the fourth quarter of 2022 compared to other
non-operating expenses of $9.4 million in the fourth quarter of
2021. The decrease in expenses was primarily due to a decrease in
litigation and related costs incurred in connection with the
seizure of the Kumtor Mine, non-cash gain on derecognition of the
employee health plan benefit provision at the Langeloth Facility in
connection with the termination of the plan and higher interest
income earned on the Company’s cash balance from rising interest
rates.
The Company recognized an income tax recovery of
$25.1 million in the fourth quarter of 2022, comprising current
income tax expense of $0.6 million and a deferred income tax
recovery of $25.7 million, compared to an income tax recovery of
$61.6 million in the fourth quarter of 2021, comprising current
income tax expense of $32.0 million and deferred income tax
recovery of $93.6 million. The decrease in income tax recovery was
primarily due to the drawdown in 2022 of the deferred tax assets
recognized in the fourth quarter of 2021 at the Mount Milligan
Mine, partially offset by the suspension of operations at the Öksüt
Mine, the tax impact of the non-cash impairment loss recognized at
the Kemess Project, and an inflation adjustment recorded to the tax
basis of property, plant and equipment at the Öksüt Mine.
Year ended December 31, 2022 compared
to 2021
Revenue of $850.2 million was recognized in 2022
compared to $900.1 million in 2021. The decrease in revenue was
primarily due to a decrease in ounces of gold sold at the Öksüt
Mine and a decrease in ounces of gold and pounds of copper sold at
the Mount Milligan Mine, partially offset by higher molybdenum
prices and an increase in pounds of molybdenum sold at the
Molybdenum BU.
Gold production was 243,867 ounces in 2022
compared to 308,141 ounces in 2021. Gold production in 2022
included 189,177 ounces of gold from the Mount Milligan Mine,
compared to 196,438 ounces in 2021, primarily due to lower gold
grades, partially offset by higher recoveries and higher throughput
as a result of higher mill runtime. The Öksüt Mine produced 54,691
ounces of gold in 2022 compared to 111,703 ounces of gold in 2021,
primarily due to suspension of gold room operations at the ADR
plant in March 2022.
Copper production at the Mount Milligan Mine was
73.9 million pounds in 2022 compared to 73.3 million pounds in
2021. The slight increase was due to higher throughput a result of
higher mill runtime and higher recoveries, partially offset by
lower copper grades.
The Langeloth Facility roasted and 13.5 million
pounds and sold 13.4 million pounds of molybdenum in 2022 compared
to 10.3 million pounds and 11.5 million pounds, respectively, in
2021. The increase in the molybdenum roasted and sold was primarily
due to the execution on the business plan to reduce molybdenum
inventory volumes held and partially due to an increase in
molybdenum concentrate available for roasting, resulting from an
increase in concentrate supply.
Cost of sales of $671.7 million was recognized
in 2022 compared to $608.2 million in 2021. The increase was
primarily due to higher production costs at the Molybdenum BU
related to higher average molybdenum prices paid to obtain product
inventory to be processed, an increase in the pounds of molybdenum
roasted and increased input costs due to rising inflation impacting
ingredients, freight and contract services. In addition, there were
higher production costs at the Mount Milligan Mine due to higher
mining, processing and administrative expenses due to the impact of
rising inflation in Canada and the onset of pricing pressure on
input costs. Mining costs were impacted by higher spending on
equipment spare parts, higher diesel prices and higher consumption
of diesel in the period, partially offset by the effects of the
Company’s hedging program. Processing costs were higher primarily
due to higher liner costs and higher salaries and wages, partially
offset by lower contractor costs. Administrative costs were higher
primarily due to an increase in salaries and wages, an increase in
recruiting and insurance costs and higher consulting costs related
to various information technology and environmental projects.
Partially offsetting the increase in production costs at the Mount
Milligan Mine was the weakening of the Canadian dollar relative to
the US dollar between the periods. In addition, there was a
decrease in cost of sales at the Öksüt Mine primarily due to the
weakening of the Turkish lira relative to the US dollar and
capitalization of all mining, processing and administrative costs
and DDA incurred in the second, third and fourth quarter of 2022 to
production inventory as no gold ounces were sold. The overall
decrease in production costs at the Öksüt Mine was partially offset
by higher mining contractor costs from higher fuel prices and a
lower strip ratio, resulting in a lower portion of mining costs
being capitalized. In addition, there were higher processing costs
from an increase in hauling costs due to the higher fuel prices and
an increase in site administrative costs due to higher consulting
costs related to various information technology projects.
Gold production costs from continuing operations
were $681 per ounce in 2022 compared to $604 per ounce in 2021. The
increase in gold production costs per ounce from continuing
operations was primarily due to a decrease in gold sold at the
Mount Milligan Mine and the Öksüt Mine and the increase in
production costs at the Mount Milligan Mine as noted above. The
decrease was primarily due to lower production costs, partially
offset by an increase in the royalty rate used in the calculation
of royalties payable and lower ounces sold at the Öksüt Mine. The
decrease in production costs at the Öksüt Mine was primarily due to
the higher mining and processing grade in 2022 and capitalization
of all mining, processing and site administrative costs incurred in
the second, third and fourth quarter of 2022 to production
inventory as no gold ounces were sold. The decrease in production
costs was partially offset by higher mining contractor costs from
higher fuel prices and a lower strip ratio, resulting in a lower
portion of mining costs being capitalized. In addition, there was
an increase in processing costs due to higher hauling costs from
higher fuel prices and an increase in site administrative costs due
to higher insurance costs, consulting costs related to various
information technology projects and higher community and social
spending costs. In 2022, the Company did not experience significant
impact on the operations of the Öksüt Mine from the Russian
invasion in Ukraine as no critical consumables or reagents are
sourced directly from Ukraine or Russia.
All-in sustaining costs on a by-product
basisNG from continuing operations were $860 per ounce
in 2022 compared to $649 per ounce in 2021. The increase was
primarily due to a decrease in ounces of gold sold at the Mount
Milligan Mine and at the Öksüt Mine, lower by-product credits from
a decrease in pounds of copper sold and higher corporate
administration costs, partially offset by lower sustaining capital
expendituresNG at the Mount Milligan Mine.
All-in costs on a by-product basisNG
were $1,201 per ounce in 2022 compared to $785 per ounce in 2021.
The increase was due to higher all-in sustaining costs on a
by-product basisNG and higher exploration and project
development costs mostly related to the Goldfield Project.
Expensed exploration and evaluation costs were
$66.5 million in 2022, compared to $26.1 million in 2021. The
increase was primarily due to various drilling activities and
technical studies undertaken as part of project development
activities at the Goldfield Project, and the brownfield exploration
activities at the Mount Milligan Mine. The total expenditures of
$66.5 million recognized in 2022 comprised of:
- $18.9 million of
project development costs at the Goldfield Project (nil in
2021);
- $10.6 million of
drilling and related costs at the Goldfield Project (nil in
2021);
- $12.2 million of
drilling and related costs at the Mount Milligan Mine ($5.6 million
in 2021);
- $3.9 million of
drilling and related costs at the Öksüt Mine ($1.5 million in
2021); and
- $20.9 million of
drilling and related costs across the Company’s other exploration
projects ($19.0 million in 2021).
Corporate administration expenses were $47.2
million in 2022, compared to $27.1 million in 2021. The increase
was primarily due to management changes and associated severance
payments, an increase in consulting costs and software costs from
various information technology projects, including the
implementation of the Company-wide enterprise resource planning
system and an increase in travel expenses.
Reclamation recovery, which primarily relates to
movement in the reclamation liabilities in the Company’s Molybdenum
BU sites currently on care and maintenance, was $94.0 million in
2022 compared to the reclamation expense of $23.3 million in 2021.
The reclamation recovery was primarily due to an increase in the
risk-free interest rates applied to discount the estimated future
reclamation cash flows. This was partially offset by an increase in
underlying future reclamation cash flows impacted by various
factors, including higher inflation and an increase in the scope of
reclamation activities required.
A gain on sale of $72.3 million (excluding
contingent receivable consideration) was recognized in the first
quarter of 2021 on the disposal of the Company’s 50% interest in
the Greenstone Partnership.
Other non-operating income of $1.9 million was
recognized in 2022 compared to other non-operating expenses of
$23.5 million in 2021. The decrease in expenses was primarily due
to a decrease in litigation and related costs incurred in
connection with the seizure of the Kumtor Mine, gain on
derecognition of the employee health plan benefit provision at the
Langeloth Facility and higher interest income earned on the
Company’s cash balance from rising interest rates.
Income tax expense of $32.8 million, comprising
current income tax expense of $37.1 million and deferred income tax
recovery of $4.3 million, was recognized in 2022, compared to an
income tax recovery of $44.0 million, comprising current income tax
expense of $40.1 million and deferred income tax recovery of $84.1
million in 2021. The increase in income tax expense was primarily
due to the drawdown of the deferred tax assets recognized in 2021
at the Mount Milligan Mine, partially offset by the impact of the
suspension of operation at the Öksüt Mine, the tax impact on the
non-cash impairment loss recognized at the Kemess Project, and an
inflationary adjustment recorded to the tax basis of property,
plant and equipment at the Öksüt Mine.
Net loss from discontinued operations was $828.7
million in 2021. Net loss from discontinued operation was primarily
due to the loss on the change of control of the Kumtor Mine of
$926.4 million recognized in the second quarter of 2021.
Financial Instruments
The Company seeks to manage its exposure to
fluctuations in diesel fuel prices, commodity prices and foreign
exchange rates by entering into derivative financial instruments
from time-to-time. The hedge positions for each of these programs
as at December 31, 2022 are summarized as follows:
|
|
|
|
Average Strike Price |
Settlements
(% of exposure
hedged)(3) |
As at
December 31, 2022 |
|
Instrument |
Unit |
Type |
|
2023 |
|
2024 |
2025 |
2023 |
2024 |
2025 |
Total
position(2) |
Fair value
($'000's) |
|
|
|
|
|
|
|
|
|
|
|
|
| FX
Hedges |
|
|
|
|
|
|
|
|
|
|
| USD/CAD zero-cost collars |
CAD |
Fixed |
$1.26/$1.32 |
$1.28/$1.35 |
$1.32/$1.39 |
$266.0 M (41%) |
$159.0 M |
$72.0 M |
$497.0 M |
(9,195 |
) |
|
USD/CAD forward contracts |
CAD |
Fixed |
|
1.27 |
|
1.31 |
N/A |
$145.0 M
(23%) |
$93.0 M |
N/A |
$238.0 M |
(8,723 |
) |
|
Total |
|
|
|
|
|
$411.0 M (64%) |
$252.0 M |
$72.0 M |
$735.0 M |
(17,918 |
) |
|
|
|
|
|
|
|
|
|
|
|
|
| Fuel
Hedges |
|
|
|
|
|
|
|
|
|
|
| ULSD zero-cost collars |
Barrels |
Fixed |
$86/$93 |
N/A |
N/A |
19,500 (13%) |
N/A |
N/A |
19,500 |
628 |
|
| ULSD
swap contracts |
Barrels |
Fixed |
$92 |
$93 |
N/A |
63,200 (41%) |
25,200 |
N/A |
88,400 |
2,295 |
|
|
Total |
|
|
|
|
|
82,700 (54%) |
25,200 |
N/A |
107,900 |
2,923 |
|
|
|
|
|
|
|
|
|
|
|
|
|
| Copper
Hedges(1): |
|
|
|
|
|
|
|
|
|
| Copper
zero-cost collars |
Pounds |
Fixed |
$4.00/$4.91 |
$4.00/$5.06 |
N/A |
22.8 M (42%) |
9.9 M |
N/A |
32.7 M |
12,147 |
|
|
|
|
|
|
|
|
|
|
|
|
|
|
Gold/Copper Hedges (Royal Gold
deliverables):(2) |
| Gold forward contracts |
Ounces |
Float |
N/A |
N/A |
N/A |
21,797 |
N/A |
N/A |
21,797 |
1,402 |
|
| Copper
forward contracts |
Pounds |
Float |
N/A |
N/A |
N/A |
2.6M |
N/A |
N/A |
2.6 M |
(13 |
) |
(1) The copper hedge ratio is based on
the forecasted copper pounds sold, net of the streaming arrangement
with Royal Gold.
(2) Royal Gold hedging program with a market price
determined on closing of the contract.
(3) % of exposure hedged is calculated with reference to
to expected expenditure incurred in Canadian dollars, fuel consumed
and copper pounds sold as outlined in the “Outlook” section and
might be subject to change.
The realized (loss) gain recorded in the
consolidated statements of loss was as follows:
| |
Three months ended December
31, |
Years ended December 31, |
| ($
millions) |
2022 |
|
2021 |
|
% Change |
2022 |
2021 |
|
% Change |
|
Foreign exchange hedges |
(3,336 |
) |
3,789 |
|
(188 |
)% |
779 |
17,543 |
|
(96 |
)% |
| Fuel hedges |
2,138 |
|
945 |
|
126 |
% |
8,778 |
20,631 |
|
(57 |
)% |
| Copper
hedges |
969 |
|
(13,150 |
) |
(107 |
)% |
3,470 |
(50,259 |
) |
(107 |
)% |
The Company’s zero-cost copper collars are
settled based on monthly average copper prices, protecting a price
floor with participation to the upside of the call strike price.
See more details on the Company’s policy and accounting treatment
in note 26 of the consolidated financial statements for the year
ended December 31, 2022.
As at December 31, 2022, Centerra has not
entered into any off-balance sheet arrangements with special
purpose entities, nor does it have any unconsolidated
affiliates.
| Balance Sheet
Review |
|
|
($millions) |
December 31, 2022 |
December 31, 2021 |
December 31, 2020 |
|
Total Assets |
2,335.9 |
2,676.6 |
3,136.0 |
| Total
Liabilities |
525.6 |
633.0 |
670.0 |
|
Current Liabilities |
274.8 |
227.4 |
257.8 |
|
Non-current Liabilities |
250.8 |
405.6 |
412.2 |
|
Total Equity |
1,810.3 |
2,043.6 |
2,466.0 |
As a result of the loss of control of the Kumtor
Mine in the second quarter of 2021, the Company deconsolidated the
assets and liabilities of KGC, a 100%-owned subsidiary that holds
the Kumtor Mine, in the Company’s consolidated statements of
financial position. The assets and liabilities presented as at
December 31, 2022 and December 31, 2021 do not include the Kumtor
Mine.
Cash as at December 31, 2022 was $531.9 million
compared to $947.2 million as at December 31, 2021. The decrease
was primarily due to cash consideration of $176.7 million paid on
closing for the acquisition of Goldfield Project, consideration of
$104.5 million paid to repurchase and cancel Kyrgyzaltyn’s
77,401,766 Centerra common shares as part of the Transaction
contemplated by the Arrangement Agreement and 2,183,900 Centerra
shares under a Normal Course Issuer Bid, a free cash flow
deficitNG of $82.9 million and dividends paid of $47.7
million during the year ended December 31, 2022.
Amounts receivable as at December 31, 2022 were
$92.2 million compared to $76.8 million at December 31, 2021. The
increase was primarily due to an increase in molybdenum sales and
timing of cash collection on these sales.
Total inventories as at December 31, 2022 were
$316.8 million compared to $221.2 million at December 31, 2021. The
increase in inventories was primarily due to stored gold-in-carbon
inventory, stockpiles inventory and heap leach pad inventory being
accumulated at the Öksüt Mine due to the suspension of gold room
operations at the ADR plant at the Öksüt Mine. In addition, there
was an increase in molybdenum inventory at the Molybdenum Business
Unit primarily due to a sudden rise of molybdenum prices, resulting
in a large mark-to-market adjustment, partially offset by execution
on the business plan to reduce molybdenum inventory volumes
held.
Other current assets at December 31, 2022 was
$49.8 million compared to $25.8 million at December 31, 2021. The
increase was primarily due to the reclassification of the $25.0
million receivable from Orion related to Greenstone project from a
non-current assets to a current assets.
The carrying value of PP&E as at December
31, 2022 was $1.27 billion and consistent with the balance as at
December 31, 2021. In 2022, the Company recorded PP&E additions
of $208.2 million resulting from the acquisition of the Goldfield
Project and PP&E additions of $73.3 million related to ongoing
capital projects at existing mines and projects, partially offset
by the non-cash impairment loss of $145.9 million at the Kemess
Project and the DDA of PP&E in the normal course of operations
during the period.
Deferred income tax assets as at December 31,
2022 were $61.9 million compared to $101.3 million as at December
31, 2021. The decrease was primarily due to the tax effects of
reversal of temporary differences between accounting and tax bases
of the balances related to the Mount Milligan Mine, including the
impact of foreign exchange rate changes on the temporary
differences.
Income tax payable as at December 31, 2022 was
$1.9 million compared to $25.3 million at December 31, 2021. The
decrease was primarily due to tax payments made during the period
and the decrease in current income taxes on income from the Öksüt
Mine as a result of the suspension of gold room operations at the
ADR plant.
Accounts payable and accrued liabilities as at
December 31, 2022 were $199.4 million compared to $186.8 million at
December 31, 2021. The increase was primarily due to higher trade
payables accrued expenses due to effect of timing of vendor
payments and an increase in mark-to-market payable relating to the
purchase of molybdenum from higher molybdenum price. The increase
was partially offset by the lower amounts due to Royal Gold under
the Mount Milligan Streaming Arrangement from lower copper prices
as well as lower amount due on the settlement of derivatives from
the payments made in 2022 and lower provision for share-based
compensation primarily due to the effect of the decrease in the
Company’s share price.
The other current liabilities as at December 31,
2022 were $73.5 million compared to $15.3 million at December 31,
2021. The increase was primarily due to increase in the fair value
of derivative liabilities, the increase in the current portion of
the provision for reclamation for the Endako Mine and Kemess
Project, the deferred revenue recognized at Mount Milligan Mine
related to the advance payment received on the gold and copper
concentrate for which no revenue was recognized in December 2022
and the deferred milestone payment of $30.9 million related to the
acquisition of the Goldfield Project being re-classified to a
current liability.
Deferred income tax liabilities as at December
31, 2022 were $8.7 million compared to $54.9 million at December
31, 2021. The decrease was primarily due to the tax effects of
reversals of temporary differences between accounting and tax bases
of the balances related to the Kemess Project and the Öksüt Mine,
and the tax impact of the non-cash impairment loss at the Kemess
Project recognized at December 31, 2022.
The long-term portion of the provision for
reclamation as at December 31, 2022 was $227.9 million compared to
$331.3 million at December 31, 2021. The decrease was primarily due
to an increase in the risk-free interest rates applied to discount
the estimated future reclamation cash flows, partially offset by an
increase in the underlying future reclamation cash flows at all of
the sites due to a variety of factors, including higher short-term
inflation rates, timing of reclamation activities and updates to
the reclamation closure plans.
Share capital as at December 31, 2022 was $886.5
million compared to $984.1 million at December 31, 2021. The
decrease was primarily the result of the completion of the
Arrangement Agreement and the repurchase and cancellation of all of
Kyrgyzaltyn’s 77,401,766 Centerra common shares in exchange for the
aggregate cash payments of approximately $93.4 million, inclusive
of withholding taxes and certain transaction costs. In addition,
the Company repurchased and cancelled 2,183,900 Centerra common
shares with a value of $11.2 million under the Normal Course Issuer
Bid during the fourth quarter of 2022.
Contractual Obligations
The following table summarizes Centerra’s
contractual obligations as of December 31, 2022:
| ($
millions) |
|
2023 |
|
2024 |
|
2025 |
|
2026 |
|
Thereafter |
Total |
|
Contractual commitments(1) |
$ |
329.2 |
$ |
117.9 |
$ |
— |
$ |
— |
$ |
— |
$ |
447.1 |
| Reclamation
provisions(2) |
|
11.4 |
|
12.2 |
|
0.3 |
|
9.6 |
|
351.9 |
|
385.4 |
| Lease
obligations |
|
3.6 |
|
3.1 |
|
1.0 |
|
0.9 |
|
1.3 |
|
10.0 |
|
Total |
$ |
344.2 |
$ |
133.2 |
$ |
1.3 |
$ |
10.5 |
$ |
353.2 |
$ |
842.5 |
(1) Excludes trade payables and
accrued liabilities. Primarily relates to purchases of molybdenum
concentrate under contracts with various mines around the
world.
(2) Mining operations are subject to environmental
regulations that require companies to reclaim and remediate land
disturbed by mining operations. The Company has submitted
closure plans to the appropriate governmental agencies which
estimate the nature, extent and costs of reclamation for each of
its mining properties. Expected reclamation cash flows are
presented above on an undiscounted basis. Reclamation provisions
recorded in the Company’s consolidated financial statements are
measured at the expected value of future cash flows discounted to
their present value using a risk-free interest rate.
2023 Liquidity and Capital Resources
Analysis
The Company believes that it has sufficient
capital resources to satisfy its 2023 mandatory expenditure
commitments (including the contractual obligations set out above)
and discretionary expenditure commitments. The following table sets
out expected capital requirements and resources for 2023:
| 2023 Mandatory
Commitments ($ millions): |
|
| Contractual
obligations(1) |
$ |
344.2 |
| Accounts payable and accrued
liabilities (as at December 31, 2022) |
|
199.4 |
| Net
income taxes payable (as at December 31, 2022) |
|
1.9 |
|
Total 2023 mandatory expenditure commitments |
$ |
545.5 |
|
|
|
| 2023 Discretionary
Commitments(2): |
|
| Expected capital
expendituresNG |
$ |
67.5 |
|
Expected exploration and evaluation costs(3) |
|
57.5 |
|
Total 2023 discretionary expenditure commitments |
$ |
125.0 |
|
Total 2023 mandatory and discretionary expenditure
commitments |
$ |
670.5 |
(1) From the Contractual Obligations
table.
(2) From the Outlook table, mid-point of the range.
(3) Excludes exploration costs expected to be
capitalized which are included in the expected capital
expendituresNG.
Operating Mines and Facilities
Mount Milligan Mine
The Mount Milligan Mine is an open-pit mine
located in north central British Columbia, Canada producing a gold
and copper concentrate. Production at the Mount Milligan Mine is
subject to an arrangement with Royal Gold pursuant to which Royal
Gold is entitled to purchase 35% of the gold produced and 18.75% of
the copper production at the Mount Milligan Mine for $435 per ounce
of gold delivered and 15% of the spot price per metric tonne of
copper delivered. To satisfy its obligations under the Mount
Milligan Streaming Arrangement, the Company purchases refined gold
ounces and copper warrants and arranges for delivery to Royal Gold.
The difference between the cost of the purchases of refined gold
ounces and copper warrants and the corresponding amounts payable to
the Company under the Mount Milligan Streaming Arrangement is
recorded as a reduction of revenue and not a cost of operating the
mine.
Mount Milligan Mine Financial and Operating
Results
| |
Three months ended December 31, |
Years ended December 31, |
|
($millions, except as noted) |
2022 |
|
2021 |
|
%
Change |
2022 |
|
2021 |
|
%
Change |
|
Financial Highlights: |
|
|
|
|
|
|
|
Gold revenue |
66.8 |
|
78.9 |
|
(15 |
)% |
248.6 |
|
267.9 |
|
(7 |
)% |
| Copper revenue |
52.7 |
|
61.7 |
|
(15 |
)% |
216.5 |
|
227.7 |
|
(5 |
)% |
| Other by-product revenue |
1.7 |
|
2.0 |
|
(15 |
)% |
7.4 |
|
10.3 |
|
(28 |
)% |
| Total revenue |
121.2 |
|
142.6 |
|
(15 |
)% |
472.5 |
|
505.9 |
|
(7 |
)% |
| Production costs |
69.8 |
|
70.0 |
|
— |
% |
269.0 |
|
256.8 |
|
5 |
% |
| Depreciation, depletion, and
amortization ("DDA") |
15.8 |
|
21.7 |
|
(27 |
)% |
79.2 |
|
83.9 |
|
(6 |
)% |
| Earnings from mine
operations |
35.6 |
|
50.9 |
|
(30 |
)% |
124.3 |
|
165.2 |
|
(25 |
)% |
| Impairment reversal |
— |
|
(160.0 |
) |
(100 |
)% |
— |
|
(160.0 |
) |
(100 |
)% |
| Earnings from
operations(1) |
29.7 |
|
207.8 |
|
(86 |
)% |
100.1 |
|
309.2 |
|
(68 |
)% |
| Cash provided by mine
operations |
26.5 |
|
63.5 |
|
(58 |
)% |
161.6 |
|
268.9 |
|
(40 |
)% |
| Free cash flow from mine
operations(2) |
15.6 |
|
46.2 |
|
(66 |
)% |
100.4 |
|
201.5 |
|
(50 |
)% |
| Additions to property, plant
and equipment |
14.6 |
|
28.9 |
|
(49) % |
49.2 |
|
83.7 |
|
(41) % |
| Capital expenditures -
total(2) |
10.0 |
|
22.4 |
|
(55 |
)% |
54.7 |
|
70.8 |
|
(23 |
)% |
|
Sustaining capital expenditures(2) |
9.9 |
|
20.2 |
|
(51 |
)% |
53.1 |
|
66.7 |
|
(20 |
)% |
|
Non-sustaining capital expenditures(2) |
0.1 |
|
2.2 |
|
(95 |
)% |
1.6 |
|
4.1 |
|
(61 |
)% |
|
Operating Highlights: |
|
|
|
|
|
|
| Tonnes mined (000s) |
10,185 |
|
10,152 |
|
— |
% |
44,362 |
|
43,588 |
|
2 |
% |
| Tonnes ore mined (000s) |
4,578 |
|
3,554 |
|
29 |
% |
19,420 |
|
18,323 |
|
6 |
% |
| Tonnes processed (000s) |
5,504 |
|
5,448 |
|
1 |
% |
21,348 |
|
20,900 |
|
2 |
% |
| Process plant head grade gold
(g/t) |
0.47 |
|
0.53 |
|
(11 |
)% |
0.42 |
|
0.46 |
|
(9 |
)% |
| Process plant head grade
copper (%) |
0.19 |
% |
0.20 |
% |
(5 |
)% |
0.20 |
% |
0.21 |
% |
(5 |
)% |
| Gold recovery (%) |
65.5 |
% |
65.9 |
% |
(1 |
)% |
66.9 |
% |
65.8 |
% |
2 |
% |
| Copper recovery (%) |
79.5 |
% |
74.8 |
% |
6 |
% |
81.9 |
% |
78.3 |
% |
5 |
% |
| Concentrate produced
(dmt) |
40,222 |
|
37,161 |
|
8 |
% |
163,918 |
|
162,250 |
|
1 |
% |
| Gold produced (oz)
(3) |
53,222 |
|
59,529 |
|
(11 |
)% |
189,177 |
|
196,438 |
|
(4 |
)% |
| Gold sold
(oz)(3) |
49,444 |
|
58,642 |
|
(16 |
)% |
187,490 |
|
203,103 |
|
(8 |
)% |
| Average realized gold price -
combined ($/oz)(3)(4) |
1,352 |
|
1,345 |
|
1 |
% |
1,326 |
|
1,319 |
|
1 |
% |
| Copper produced (000s
lbs)(3) |
16,909 |
|
16,993 |
|
— |
% |
73,864 |
|
73,275 |
|
1 |
% |
| Copper sold (000s
lbs)(3) |
15,374 |
|
17,184 |
|
(11 |
)% |
73,392 |
|
78,017 |
|
(6 |
)% |
| Average
realized copper price - combined ($/lb)(3)(4) |
3.43 |
|
3.59 |
|
(4 |
)% |
2.95 |
|
2.92 |
|
1 |
% |
|
Unit Costs: |
|
|
|
|
|
|
| Gold production costs
($/oz) |
790 |
|
670 |
|
18 |
% |
767 |
|
683 |
|
12 |
% |
| All-in sustaining costs on a
by-product basis ($/oz)(2) |
629 |
|
518 |
|
21 |
% |
630 |
|
508 |
|
24 |
% |
| All-in costs on a by-product
basis ($/oz)(2)(5) |
672 |
|
573 |
|
17 |
% |
704 |
|
556 |
|
27 |
% |
| Gold - All-in sustaining costs
on a co-product basis ($/oz)(2) |
950 |
|
883 |
|
8 |
% |
956 |
|
883 |
|
8 |
% |
| Copper production costs
($/lb) |
2.00 |
|
1.79 |
|
12 |
% |
1.70 |
|
1.51 |
|
13 |
% |
| Copper - All-in sustaining
costs on a co-product basis ($/lb)(2) |
2.40 |
|
2.34 |
|
3 |
% |
2.12 |
|
1.94 |
|
9 |
% |
(1) Includes exploration and
evaluation costs and marketing and selling costs. 2021 figures
include the impact of impairment reversal.
(2) Non-GAAP financial measure. See discussion under
“Non-GAAP and Other Financial Measures”.
(3) Mount Milligan production and sales are presented on
a 100%-basis. Under the Mount Milligan Streaming Arrangement, Royal
Gold is entitled to 35% of gold ounces sold and 18.75% of copper
sold. Royal Gold pays $435 per ounce of gold delivered and 15% of
the spot price per metric tonne of copper delivered.
(4) This supplementary financial measure within the
meaning of 52-112 is calculated as a ratio of revenue from the
consolidated financial statements and units of metal sold
includes the impact from the Mount Milligan Streaming Arrangement,
copper hedges and mark-to-market adjustments on metal sold that had
not yet settled under contract.
(5) Includes the impact from the Mount Milligan
Streaming Arrangement and the impact of copper hedges.
Fourth Quarter 2022 compared to Fourth
Quarter 2021
Earnings from mine operations of $35.6 million were
recognized in the fourth quarter of 2022 compared to $50.9 million
in the fourth quarter of 2021. The decrease was primarily due to
lower gold ounces and copper pounds sold, and lower average
realized copper prices, partially offset by lower DDA primarily
attributable to the increase in proven and probable reserves as a
result of a life-of-mine update in 2022.
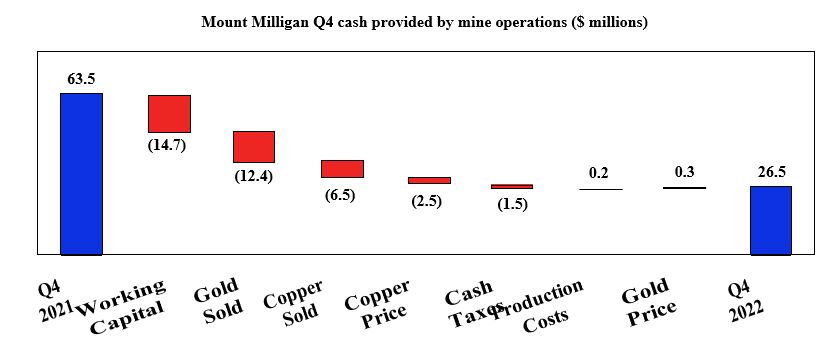
Cash provided by mine operations of $26.5
million was recognized in the fourth quarter of 2022 compared to
$63.5 million in the fourth quarter of 2021. The decrease was
primarily due to lower average realized copper prices, lower gold
ounces and copper pounds sold and an unfavourable working capital
change. The unfavourable working capital change in the fourth
quarter of 2022 as compared to the fourth quarter of 2021 was
primarily due to the effect of the timing of concentrate shipments
and the timing of vendor payments.
Free cash flowNG from mine operations
of $15.6 million was recognized in the fourth quarter of 2022
compared to $46.2 million in the fourth quarter of 2021 primarily
due to a decrease in cash provided by mine operations, partially
offset by lower sustaining capital expendituresNG.
During the fourth quarter of 2022, mining
activities were carried out in phases 4, 7, and 9 of the open pit.
Total tonnes mined were 10.2 million tonnes in the fourth quarter
of 2022 and 10.2 million in the fourth quarter of 2021.
Total process plant throughput for the fourth
quarter of 2022 was 5.5 million tonnes, averaging 59,829 tonnes per
calendar day, compared to 5.4 million tonnes, averaging 59,223
tonnes per calendar day in the fourth quarter of 2021. The increase
in throughput in the fourth quarter of 2022 was primarily due to
higher SAG mill runtime compared to the fourth quarter of 2021,
which had a longer scheduled shutdown for the SAG mill
relining.
Gold production was 53,222 ounces in the fourth
quarter of 2022 compared to 59,529 ounces in the fourth quarter of
2021 due to lower gold head grades and slightly lower recoveries,
partially offset by higher mill throughput. During the fourth
quarter of 2022, the average gold grades and recoveries were 0.47
g/t and 65.5% compared to 0.53 g/t and 65.9% in the fourth quarter
of 2021. Total copper production was 16.9 million pounds in the
fourth quarter of 2022 compared to 17.0 million pounds in the
fourth quarter of 2021.The slight decrease was due to lower copper
grades, partially offset by higher mill throughput and higher
recoveries. During the fourth quarter of 2022, the average copper
grade and recoveries were 0.19% and 79.5% compared to 0.20% and
74.8% in the fourth quarter of 2021. The Staged Flotation Reactors
circuit has been operating since the beginning of May 2022. Circuit
optimization and completion of full commissioning was completed in
the fourth quarter of 2022 and initial results indicate elevated
recoveries. The site management team plans to continue optimization
efforts in 2023 to achieve steady operation at lower head
grades.
Gold production costs were $790 per ounce in the
fourth quarter of 2022 compared to $670 per ounce in fourth quarter
of 2021. The increase was primarily due to lower gold ounces sold,
partially offset by slightly lower production costs.
Slightly lower production costs were primarily
due to a decrease in gold ounces sold, partially offset by higher
mining and site administrative expenses due to the impact of rising
inflation in Canada. Mining costs were impacted by higher spending
on equipment spare parts, higher consumption of diesel in the
period and higher diesel prices, partially offset by the effect of
the Company’s hedging program. Higher administrative costs were due
to an increase in insurance costs and an increase in higher
consulting costs related to various information technology and
environmental projects. The weakening of the Canadian dollar
relative to the US dollar between the periods helped to partially
offset some of the cost increases.
Copper production costs were $2.00 per pound in
the fourth quarter of 2022 compared to $1.79 per pound in the
fourth quarter of 2021. The increase was primarily due to a higher
allocation of costs to copper production costs, due to the relative
changes in the market prices of gold and copper, and a decrease in
copper pounds sold.
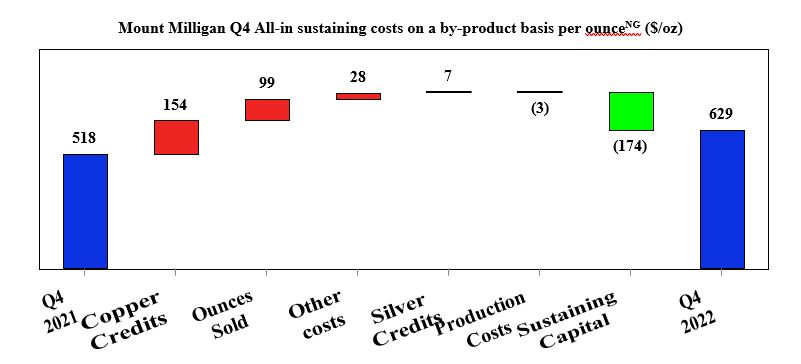
All-in sustaining costs on a by-product
basisNG were $629 per ounce in the fourth quarter of
2022 compared to $518 per ounce in the fourth quarter of 2021. The
increase was primarily due to lower gold ounces sold, lower copper
credits as a result of lower copper pounds sold and lower average
realized copper prices, partially offset by lower sustaining
capital expendituresNG.
All-in costs on a by-product basisNG
were $672 per ounce in the fourth quarter of 2022 compared to $573
per ounce in the fourth quarter of 2021. The increase was due to
higher all-in-sustaining costs on a by-product basisNG
as noted above, partially offset by a decrease in non-sustaining
capital expenditures.
Year ended December 31, 2022 compared
to 2021
Earnings from mine operations of $124.3 million
were recognized in 2022 compared to $165.2 million in 2021. The
decrease was primarily due to lower gold ounces and copper pounds
sold and higher production costs, partially offset by slightly
higher average realized gold and copper prices and lower DDA
primarily attributable to the increase in proven and probable
reserves as a result of a life-of-mine update in 2022.
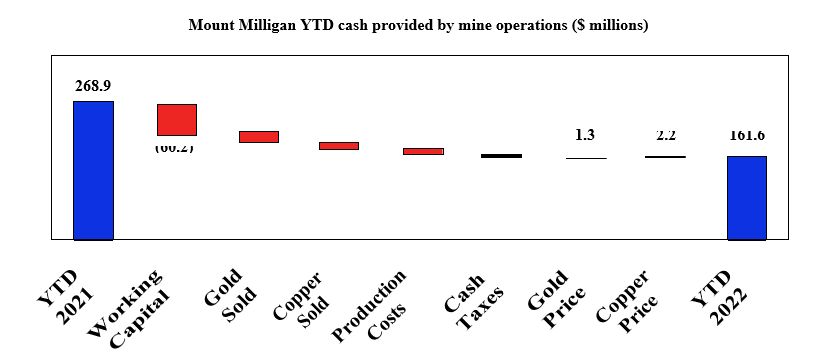
Cash provided by mine operations of $161.6 million
was recognized in 2022 compared to $268.9 million in 2021. The
decrease was primarily due to a decrease in gold ounces and copper
pounds sold, higher production costs and an unfavourable change in
working capital from the timing of vendor payments and timing of
cash collection on concentrate sales.
Free cash flowNG from mine operations
of $100.4 million was recognized in 2022 compared to $201.5 million
in 2021. The decrease was primarily due to lower cash provided by
mine operations, partially offset by lower sustaining capital
expenditures.
During 2022, mining activities were carried out
in Phases 4, 7, 8 and 9 of the open pit. Total tonnes mined were
44.4 million tonnes in 2022 compared to 43.6 million tonnes mined
in 2021. The increased tonnage was primarily due to an increase in
truck hours, partially offset by changes in haulage cycles.
The process plant throughput was 21.3 million
tonnes, averaging 58,488 tonnes per calendar day, compared to 20.9
million tonnes in 2021, averaging 57,261 tonnes per calendar day.
The increase in throughput was primarily due to higher mill runtime
as a result of fewer scheduled major shutdowns executed in 2022
compared to 2021. Process plant throughput for 2022 set a new
annual record for the Mount Milligan Mine.
Gold production was 189,177 ounces in 2022
compared to 196,438 ounces in 2021. The decrease was due to lower
gold grades, partially offset by higher recoveries and higher
throughput as a result of higher mill runtime. During 2022, the
average gold grade was 0.42 g/t and recoveries were 66.9% compared
to 0.46 g/t and 65.8% in 2021. Total copper production was 73.9
million pounds in 2022 compared to 73.3 million pounds in 2021. The
slight increase was due to higher throughput a result of higher
mill runtime and higher recoveries, partially offset by lower
copper grades. The Staged Flotation Reactors circuit has been
operating since beginning of May 2022 and initial results indicate
elevated recoveries.
Gold production costs were $767 per ounce in
2022 compared to $683 per ounce in 2021. The increase was primarily
due to higher production costs and higher mining, processing and
administrative expenses due to the impact of rising inflation in
Canada. Mining costs were impacted by higher spending on equipment
spare parts, higher diesel prices and higher consumption of diesel
in the period, partially offset by the effects of the Company’s
hedging program. Processing costs were higher primarily due to
higher liner costs and higher salaries and wages, partially offset
by lower contractor costs. Administrative costs were higher
primarily due to an increase in salaries and wages, an increase in
recruiting and insurance costs and higher consulting costs related
to various information technology and environment projects. The
weakening of the Canadian dollar relative to the US dollar between
the periods helped to partially offset some of the cost
increases.
Copper production costs were $1.70 per pound in
2022 compared to $1.51 per pound in 2021, primarily due a decrease
in copper pounds sold and higher production costs as noted
above.
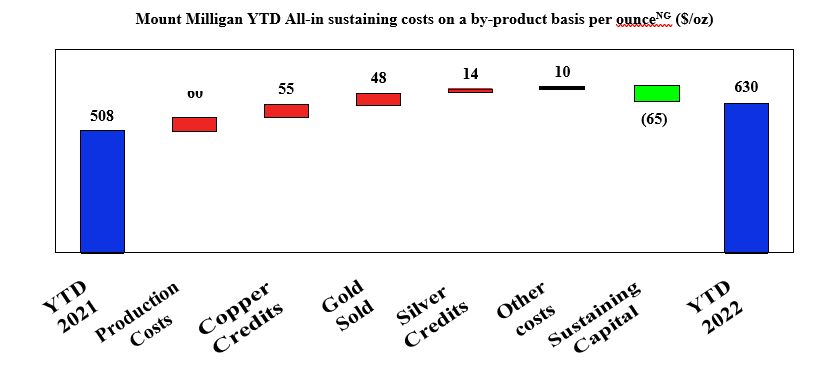
All-in sustaining costs on a by-product
basisNG were $630 per ounce for 2022 compared to $508
per ounce in 2021. The increase was primarily due to a decrease in
gold ounces sold, lower by-product credits from lower lower copper
pounds sold and higher production costs as noted above, partially
offset by lower sustaining capital expenditures.
All-in costs on a by-product basisNG
were $704 per ounce in 2022 compared to $556 per ounce in 2021. The
increase was due to higher all-in sustaining costs on a by-product
basisNG and higher exploration expenses, partially
offset by a decrease in non-sustaining capital expenditures.
Öksüt Mine
The Öksüt Mine is located in Türkiye
approximately 300 kilometres southeast of Ankara and 48 kilometres
south of Kayseri, the provincial capital. The nearest
administrative centre is at Develi, located approximately 10
kilometres north of the mine site. The Öksüt Mine achieved
commercial production on May 31, 2020.
As outlined in the Recent Events and
Developments section in this MD&A above, the Öksüt Mine
suspended gold doré bar production at the Öksüt Mine in early March
2022 due to mercury having been detected in the gold room at the
ADR plant and subsequently suspended leaching operations in August
2022. Processing of material into stored gold-in-carbon inventory
also ceased in August 2022. As a result, some of the results for
the three months and year ended December 31, 2022 are not directly
comparable to the corresponding prior periods.
Öksüt Mine Financial and Operating
Results
| |
Three months ended December
31, |
Years ended December
31, |
|
($millions, except as noted) |
2022 |
|
2021 |
%
Change |
2022 |
|
2021 |
%
Change |
|
Financial Highlights: |
|
|
|
|
|
|
|
Revenue |
— |
|
56.9 |
(100 |
)% |
101.6 |
|
199.4 |
(49 |
)% |
| Production costs |
— |
|
10.4 |
(100 |
)% |
21.1 |
|
51.1 |
(59 |
)% |
| Depreciation, depletion, and
amortization ("DDA") |
— |
|
7.8 |
(100 |
)% |
12.6 |
|
30.2 |
(58 |
)% |
| Earnings from mine
operations |
— |
|
38.7 |
(100 |
)% |
67.9 |
|
118.1 |
(43 |
)% |
| (Loss) earnings from
operations(1) |
(3.4 |
) |
39.2 |
(109 |
)% |
61.3 |
|
116.4 |
(47 |
)% |
| Cash (used in) provided by
mine operations |
(11.9 |
) |
39.5 |
(130 |
)% |
(17.5 |
) |
131.7 |
(113 |
)% |
| Free cash flow (deficit) from
mine operations(2) |
(16.5 |
) |
35.3 |
(147 |
)% |
(33.5 |
) |
111.6 |
(130 |
)% |
| Additions to property, plant
and equipment |
5.1 |
|
9.3 |
(45 |
)% |
14.2 |
|
24.9 |
(43 |
)% |
| Capital expenditures -
total(2) |
4.6 |
|
4.3 |
7 |
% |
16.0 |
|
19.6 |
(18 |
)% |
|
Sustaining capital expenditures(2) |
4.6 |
|
4.1 |
12 |
% |
16.0 |
|
18.8 |
(15 |
)% |
|
Non-sustaining capital expenditures(2) |
— |
|
0.2 |
(100 |
)% |
— |
|
0.8 |
(100 |
)% |
|
Operating Highlights: |
|
|
|
|
|
|
| Tonnes mined (000s) |
995 |
|
3,820 |
(74 |
)% |
9,159 |
|
15,251 |
(40 |
)% |
| Tonnes ore mined (000s) |
715 |
|
1,410 |
(49 |
)% |
6,455 |
|
4,352 |
48 |
% |
| Ore mined - grade (g/t) |
1.62 |
|
2.18 |
(26 |
)% |
1.85 |
|
1.54 |
20 |
% |
| Ore crushed (000s) |
749 |
|
1,047 |
(28 |
)% |
3,678 |
|
3,947 |
(7 |
)% |
| Tonnes of ore stacked
(000s) |
752 |
|
1,064 |
(29 |
)% |
3,776 |
|
3,969 |
(5 |
)% |
| Heap leach grade (g/t) |
1.90 |
|
2.42 |
(21 |
)% |
1.83 |
|
1.54 |
19 |
% |
| Heap leach contained ounces
stacked |
45,820 |
|
82,943 |
(45 |
)% |
222,625 |
|
195,990 |
14 |
% |
| Gold produced (oz) |
— |
|
31,668 |
(100 |
)% |
54,691 |
|
111,703 |
(51 |
)% |
| Additions to stored
gold-in-carbon inventory (Koz)(4) |
— |
|
— |
— |
% |
100-105 |
|
— |
100 |
% |
| Gold sold (oz) |
— |
|
31,670 |
(100 |
)% |
54,704 |
|
111,654 |
(51 |
)% |
| Average
realized gold price ($/oz)(3) |
— |
|
1,796 |
(100 |
)% |
1,857 |
|
1,786 |
4 |
% |
|
Unit Costs: |
|
|
|
|
|
|
| Gold production costs
($/oz) |
n/a |
|
328 |
n/a |
|
386 |
|
457 |
(16 |
)% |
| All-in sustaining costs on a
by-product basis ($/oz)(2) |
n/a |
|
495 |
n/a |
|
791 |
|
668 |
18 |
% |
| All-in costs on a by-product
basis ($/oz)(2) |
n/a |
|
501 |
n/a |
|
891 |
|
694 |
28 |
% |
(1) Includes exploration and evaluation
costs.
(2) Non-GAAP financial measure. See discussion under
“Non-GAAP and Other Financial Measures”.
(3) This supplementary financial measure, within the
meaning of 52-112, is calculated as a ratio of revenue from the
consolidated financial statements and units of metal sold.
(4) Represents a subset of the recoverable ounces in the
ADR inventory as of December 31, 2022.
Fourth Quarter 2022 compared to Fourth
Quarter 2021
No earnings from mine operations were reported
in the fourth quarter of 2022 as a result of no ounces of gold sold
due to the suspension of gold room operations at the ADR plant.
Earnings from mine operations were $38.7 million in the fourth
quarter of 2021.
Cash used in mine operations of $11.9 million
was recognized in the fourth quarter of 2022, compared to cash
provided by mine operations of $39.5 million in the fourth quarter
of 2021. The decrease was primarily due to no ounces of gold sold
and an unfavorable working capital change partially offset by lower
production costs. The unfavorable change in working capital was
primarily due to buildup of stockpiles and heap leach pad inventory
and timing of vendor payments and lower collections of VAT
refunds.
Free cash flow deficit from mine
operationsNG of $16.5 million was recognized in the
fourth quarter of 2022, compared to the free cash flow from mining
operationsNG of $35.3 million in the fourth quarter of
2021. The decrease was primarily due to a decrease in cash provided
by mine operations due to no ounces of gold being sold during the
quarter.
Mining activities in the fourth quarter of 2022
were carried out in phase 4 of the Keltepe pit and in phase 2 of
the Güneytepe pit. Total tonnes mined were 1.0 million tonnes in
the fourth quarter of 2022 compared to 3.8 million tonnes in the
fourth quarter of 2021. The decrease in tonnes mined was primarily
due to not receiving a pasture land permit that would otherwise
have allowed the Company to expand the footprint of the current
pits and increase the amount of waste available to be mined as well
as unfavourable weather conditions. Approval of the enlarged
pasture land permit was received in January 2023.
Processing activities in the fourth quarter of
2022 were focused on the preparation and stacking of the heap leach
pad. In the fourth quarter of 2022 the Öksüt Mine stacked 0.8
million tonnes at an average grade of 1.90 g/t, containing 45,820
ounces of gold, compared to 1.1 million tonnes stacked at an
average grade of 2.42 g/t, containing 82,943 ounces of gold in the
fourth quarter of 2021. The decrease in contained ounces stacked in
the fourth quarter of 2022 was primarily due to lower mined grade
and current EIA crusher limits.
No gold production was reported in the fourth
quarter of 2022 due to the suspension of gold room operations at
the ADR plant. Gold production in the fourth quarter of 2021 was
31,668 ounces. No gold production costs were reported in the fourth
quarter of 2022 as there was no gold sold. Gold production costs
per ounce were $328 in the fourth quarter of 2021.
During the fourth quarter of 2022, mining,
stockpiling, crushing and stacking continued at the site throughout
the quarter. However, leaching was suspended in August 2022. Gold
material inventory was being accumulated in carbon and stored in
bags onsite. As of December 31, 2022, there was a balance of
recoverable ounces of approximately 100,000 in the stored
gold-in-carbon inventory as compared to nil as of December 31,
2021. These stored gold-in-carbon recoverable ounces represent
additional ounces to the 54,690 ounces produced as gold doré prior
to the suspension of gold room operations in the ADR plant. In
addition, the Öksüt Mine had approximately 200,000 recoverable
ounces of gold in ore stockpiles and on the heap leach pad as at
December 31, 2022.
As of December 31, 2022, the weighted average
cost in inventory per recoverable ounce, which excludes royalty
costs, was $442 as compared to $500 as of December 31, 2021. The
weighted average cost in inventory per recoverable ounce includes a
portion of production costs and an attributable portion of DDA
capitalized to production inventory.
| ADR
plant inventory |
December 31, 2022 |
December 31, 2021 |
|
Weighted average production cost in inventory per recoverable
ounce |
$ |
232 |
$ |
251 |
|
Weighted average DDA in inventory per recoverable ounce |
|
210 |
|
249 |
|
Weighted average cost in inventory per recoverable ounce |
$ |
442 |
$ |
500 |
The weighted-average production cost in
inventory per ounce of gold has not been significantly affected by
the suspension of gold room operations in the ADR plant. In the
fourth quarter of 2022, the Company did not experience any
significant impact on the operations of the Öksüt Mine from the
Russian invasion in Ukraine as no critical consumables or reagents
are sourced directly from Ukraine or Russia. Certain reagents and
consumables may be indirectly impacted by the Russian invasion in
Ukraine in the future, and the Company continues to monitor for any
impact on its operations. The Company also has not experienced any
significant impact on the operation of the Öksüt Mine from the
earthquake in the southeastern portion of the country.
All-in sustaining costs on a by-product
basisNG or all-in costs on a by-product
basisNG per ounce were not reported in the fourth
quarter of 2022 as no ounces of gold were sold. All-in sustaining
costs on a by-product basisNG and all-in costs on a
by-product basisNG in the fourth quarter of 2021 were
$495 and $501 per ounce, respectively.
Year ended December 31, 2022 compared
to 2021
Earnings from mine operations were $67.9 million in
2022 compared with $118.1 million in 2021. The decrease was
primarily due to a decrease in ounces of gold sold.
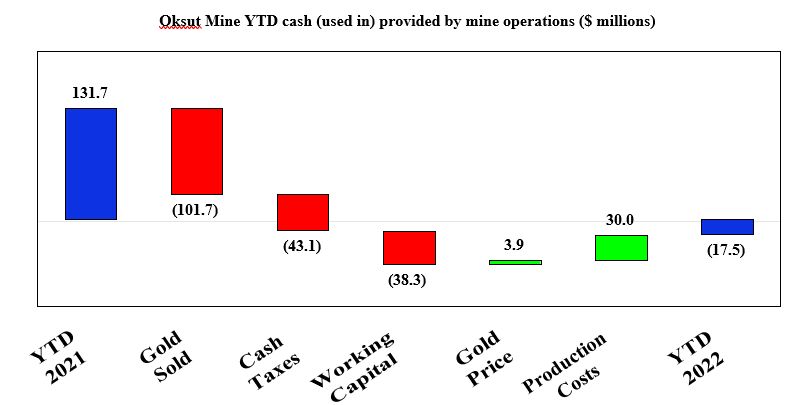
Cash used in mine operations was $17.5 million
in 2022 compared with cash provided by mine operations of $131.7
million in 2021. The decrease was primarily due to lower ounces of
gold sold, higher cash taxes paid and an unfavorable working
capital change, partially offset by lower production costs. The
higher cash taxes paid were primarily due to a higher withholding
tax expense incurred on a dividend distribution and taxation at the
full statutory income tax rate due to utilization of investment
incentive certificate available to be used as of the end of 2021
and the recognition of taxable gains from the effect of foreign
exchange rate changes on monetary assets and liabilities. The
unfavorable working capital change was primarily due to cash
utilized to build-up stored gold-in-carbon inventory as well
stockpiles and heap leach pad inventory, timing of vendor payments
and lower collection of VAT refund.
Free cash flow deficitNG from mine
operations was $33.5 million in 2022 compared with the free cash
flowNG of $111.6 million in 2021. The decrease was
primarily due to lower cash provided by mine operations partially
offset by lower sustaining capital expendituresNG mainly
from lower capitalized stripping costs.
Mining activities in 2022 were carried out in
phase 4 of the Keltepe pit and in phase 2 of the Güneytepe pit.
Total tonnes mined were 9.2 million tonnes in 2022 compared to 15.3
million tonnes in 2021. The decrease in tonnes mined was primarily
due to not receiving a pasture land permit that would otherwise
have allowed the Company to expand the footprint of the current
pits and increase the amount of waste available to be mined.
Approval of the enlarged pasture land permit was received in
January 2023.
Processing activities in 2022 were mostly
focused on the preparation, stacking and irrigation of the heap
leach pad, with 3.8 million tonnes stacked at an average grade of
1.83 g/t containing 222,625 ounces of gold compared with 4.0
million tonnes stacked in 2021 at an average grade of 1.54 g/t
containing 195,990 ounces of gold. The decrease in in ore tonnes
stacked was primarily due to current EIA crusher limits, partially
offset by the lower strip ratio. The increase in contained ounces
stacked in 2022 was primarily due to ore mined from a portion of
the Keltepe pit with higher grade mineralization.
Gold production was 54,691 ounces in 2022
compared to 111,703 ounces in 2021, primarily due to suspension of
gold room operations in the ADR plant in March 2022.
Gold production costs were $386 per ounce in
2022 compared with $457 per ounce in 2021. The decrease was
primarily due to lower production costs and lower ounces sold. The
decrease in production costs was primarily due to the weakening of
the Turkish lira relative to the US dollar and capitalization of
all mining, processing and administrative costs incurred in the
second, third and fourth quarter of 2022 to production inventory as
no gold ounces were sold. The decrease in production costs was
partially offset by higher mining contractor costs from higher fuel
prices and a lower strip ratio, resulting in a lower portion of
mining costs being capitalized. In addition, there was an increase
in processing costs from higher hauling costs from higher fuel
prices and an increase in site administrative costs due to higher
consulting costs related to various information technology
projects.
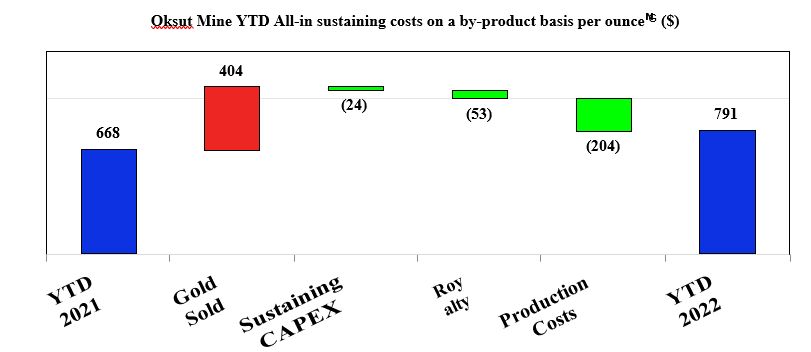
All-in sustaining costs on a by-product
basisNG were $791 per ounce in 2022 compared with $668
per ounce in 2021. The increase was primarily due to a decrease in
ounces of gold sold, partially offset by lower production costs and
lower sustaining capital expendituresNG mainly from
lower capitalized stripping expenditures.
All-in costs on a by-product basisNG
were $891 per ounce in 2022 compared with $694 per ounce in 2021.
The increase was primarily due to higher all-in sustaining costs on
a by-product basisNG and higher exploration
expenditures.
Molybdenum Business
Unit
The Molybdenum BU includes the Langeloth
Facility in Pennsylvania and two North American molybdenum mines
that are currently on care and maintenance: the Thompson Creek Mine
in Idaho and the 75%-owned Endako Mine in British Columbia.
The Company continues to evaluate strategic
options for the Molybdenum Business Unit, including a potential
restart of the Thompson Creek Mine, with due consideration given to
global molybdenum prices currently trading above $30 per pound and
the long term economic outlook for supply and demand forecasts.
Molybdenum BU Financial and Operating
Results
| |
Three months ended December
31, |
Years ended December 31, |
|
($millions, except as noted) |
2022 |
|
2021 |
|
% Change |
2022 |
|
2021 |
|
% Change |
|
Financial Highlights: |
|
|
|
|
|
|
|
Total revenue |
87.2 |
|
51.6 |
|
69 |
% |
276.1 |
|
194.8 |
|
42 |
% |
| Production costs |
88.3 |
|
51.5 |
|
71 |
% |
284.5 |
|
179.7 |
|
58 |
% |
| Depreciation, depletion, and
amortization ("DDA") |
1.4 |
|
1.5 |
|
(7 |
)% |
5.2 |
|
6.4 |
|
(19 |
)% |
| (Loss) earnings from mine
operations |
(2.5 |
) |
(1.4 |
) |
79 |
% |
(13.6 |
) |
8.7 |
|
(256 |
)% |
| Care and maintenance costs -
Molybdenum mines |
5.5 |
|
4.3 |
|
28 |
% |
18.4 |
|
14.6 |
|
26 |
% |
| Reclamation (recovery)
expense |
(3.4 |
) |
24.1 |
|
(114 |
)% |
(94.0 |
) |
23.2 |
|
(505 |
)% |
| Other operating expenses |
0.6 |
|
0.6 |
|
— |
% |
1.9 |
|
2.2 |
|
(14 |
)% |
| Net (loss) earnings from
operations |
(5.2 |
) |
(30.4 |
) |
(83 |
)% |
60.1 |
|
(31.4 |
) |
(291 |
)% |
| Cash provided by (used in)
operations |
8.6 |
|
(15.8 |
) |
(154 |
)% |
(9.3 |
) |
(37.3 |
) |
(75 |
)% |
| Free cash flow (deficit) from
operations(1) |
8.6 |
|
(17.2 |
) |
(150 |
)% |
(10.4 |
) |
(39.8 |
) |
(74 |
)% |
| Additions to property, plant
and equipment |
0.8 |
|
1.4 |
|
(43 |
)% |
1.8 |
|
2.5 |
|
(28 |
)% |
| Total
capital expenditures(1) |
0.8 |
|
1.4 |
|
(43 |
)% |
1.9 |
|
2.5 |
|
(24 |
)% |
|
Operating Highlights: |
|
|
|
|
|
|
| Mo roasted (lbs) |
4,550 |
|
2,475 |
|
84 |
% |
13,497 |
|
10,286 |
|
31 |
% |
| Mo sold (lbs) |
4,040 |
|
2,361 |
|
71 |
% |
13,448 |
|
11,461 |
|
17 |
% |
| Average market Mo price
($/lb) |
21.49 |
|
18.89 |
|
14 |
% |
18.73 |
|
15.98 |
|
17 |
% |
(1) Non-GAAP financial measure. See
discussion under “Non-GAAP and Other Financial Measures”.
Fourth Quarter 2022 compared to Fourth
Quarter 2021
Net loss from operations of $5.2 million were
recognized in the fourth quarter of 2022 compared to net loss of
$30.4 million in the fourth quarter of 2021. The decrease in net
loss from operations was mainly due to a reclamation recovery
during the fourth quarter of 2022 compared to a reclamation expense
during the fourth quarter of 2021 from an increase in the risk-free
interest rates applied to the underlying future reclamation cash
flows in the fourth quarter of 2022. Partially offsetting a
decrease in net loss from operations was an increase in loss from
mine operations primarily due to higher average molybdenum prices
paid to obtain third-party molybdenum concentrate to be processed
and increased production costs due to rising inflation impacting
ingredients, freight and contract services.
Cash provided by operations of $8.6 million was
recognized in the fourth quarter of 2022, compared to cash used in
operations of $15.8 million in the fourth quarter of 2021. The
increase in cash provided by operations is primarily due to a
favourable working capital movement from the effect of a reduction
in molybdenum inventory. The total working capital balance of the
Molybdenum BU was $105.9 million at December 31, 2022 compared to
$121.8 million at September 30, 2022.
Free cash flow from operationsNG of
$8.6 million was recognized in the fourth quarter of 2022, compared
to free cash flow deficit from operationsNG of $17.2
million in the fourth quarter of 2021. The increase was primarily
due to a decrease in working capital as noted above.
The Langeloth Facility roasted and 4.6 million
pounds and sold 4.0 million pounds of molybdenum in the fourth
quarter of 2022, compared to 2.5 million pounds and 2.4 million
pounds, respectively in the fourth quarter of 2021. This increase
in the molybdenum roasted was primarily due to the execution of the
business plan to reduce its molybdenum inventory volumes held and
partially due to an increase in molybdenum concentrate available
for roasting, resulting from a increase in concentrate supply.
In the fourth quarter of 2022, the market
molybdenum price continued to increase, averaging $26.13 per pound
during December 2022 and reaching $31.85 per pound on December 31,
2022. While this trend resulted in a positive impact on 523,000
pounds sold at spot prices in December 2022, it has a negative
impact on pounds purchased at lower provisional prices in November
and December 2022 that are expected to settle at higher prices in
the first quarter of 2023, resulting in a cash outflow. At December
31, 2022, there were 3.3 million pounds of purchased molybdenum
outstanding under contracts awaiting final settlement in first
quarter of 2023. All these pounds were adjusted to a market price
of $31.00 per pound at the end of the year, resulting in an
increase to molybdenum inventory of $28.5 million from previously
recorded provisional prices.
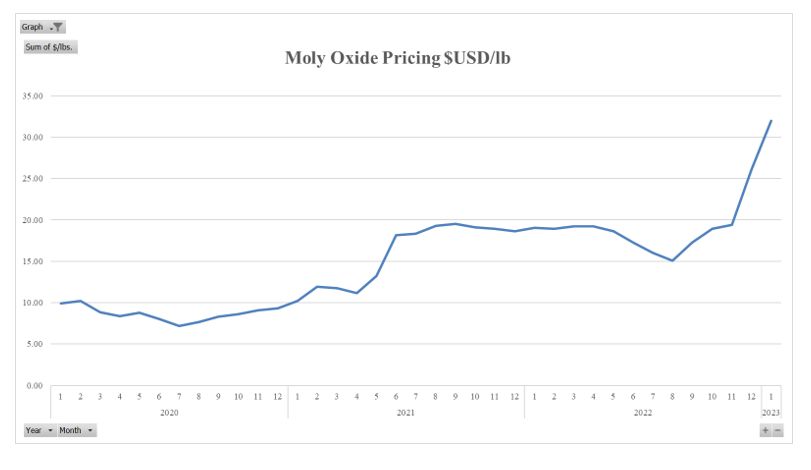
Year ended December 31, 2022 compared
to 2021
Net earnings from operations of $60.1 million
were recognized in 2022 compared to net loss from operations of
$31.4 million in 2021. The increase in net earnings from operations
was mainly from a reclamation recovery compared to a reclamation
expense in 2021 primarily due to an increase in the risk-free
interest rates applied to the underlying future reclamation cash
flows, partially offset by an increase in loss from mine
operations. An increase in loss from mine operations was primarily
due to higher average molybdenum prices paid for third-party
molybdenum concentrate to be processed and increased production
costs due to rising inflation impacting ingredients, freight and
contract services. Cash used in operations was $9.3 million in 2022
compared to cash used in operations of $37.3 million in 2021. The
decrease in cash used in operations was primarily due to a
favourable working capital movement due to implementation of a
revised business plan to reduce inventory quantities on hand. This
was partially offset by higher maintenance costs associated with an
unplanned acid plant shutdown extending for longer than one month
early in 2022.
Free cash flow deficit from
operationsNG of $10.4 million was recognized in 2022
compared to $39.8 million in 2021, primarily due to lower cash used
in operations, as noted above.
The Langeloth Facility roasted and sold 13.5
million pounds and 13.4 million pounds of molybdenum, respectively,
in 2022 compared to 10.3 million pounds and 11.5 million pounds,
respectively, in 2021. The increase in the molybdenum roasted and
sold was primarily due to due to the execution of the business plan
to reduce its molybdenum inventory volumes held and partially due
to an increase in molybdenum concentrate available for roasting,
resulting from a increase in concentrate supply.
Discontinued Operations
Kumtor Mine
As a result of the loss of control, the Kumtor
Mine was reclassified as a discontinued operation in the second
quarter of 2021. Consequently, the Company is presenting no
financial and operating results pertaining to the year ended
December 31, 2022.
Kumtor Mine Financial and Operating
Results
($millions, except as noted)
|
|
Three months ended
December 31, |
|
Years ended
December 31, |
|
|
2022 |
2021 |
|
2022 |
2021 |
| Financial
Highlights: |
|
— |
|
— |
|
| Revenue |
— |
— |
|
— |
264.1 |
|
| Production costs |
— |
— |
|
— |
72.6 |
|
| Depreciation, depletion and
amortization |
— |
— |
|
— |
57.9 |
|
| Earnings from mine
operations |
— |
— |
|
— |
133.6 |
|
| Loss on the change of control
of the Kumtor Mine |
— |
— |
|
— |
(926.4 |
) |
| Net earnings from discontinued
operations |
— |
— |
|
— |
(828.7 |
) |
| Cash provided by operating
activities from discontinued operations |
— |
— |
|
— |
143.9 |
|
| Cash used in investing
activities from discontinued operations |
— |
— |
|
— |
96.1 |
|
| Net cash flow from
discontinued operations |
— |
— |
|
— |
47.8 |
|
| Free
cash flow from discontinued operations(1) |
— |
— |
|
— |
53.7 |
|
|
Operating Highlights: |
|
— |
|
— |
|
| Tonnes mined (000s) |
— |
— |
|
— |
74,261 |
|
| Tonnes ore mined (000s) |
— |
— |
|
— |
1,298 |
|
| Tonnes processed (000s) |
— |
— |
|
— |
2,343 |
|
| Process plant head grade
(g/t) |
— |
— |
|
— |
2.52 |
|
| Gold recovery
(%)(2) |
— |
— |
|
— |
71.5 |
% |
| Gold produced (oz) |
— |
— |
|
— |
139,830 |
|
| Gold
sold (oz) |
— |
— |
|
— |
147,800 |
|
|
Unit Costs: |
|
— |
|
— |
|
| Gold production costs
($/oz) |
— |
— |
|
— |
491 |
|
| All-in sustaining costs on a
by-product basis ($/oz)(1) |
— |
— |
|
— |
929 |
|
| All-in costs on a by-product
basis ($/oz)(1) |
— |
— |
|
— |
1,414 |
|
(1) Non-GAAP measure. See discussion
under “Non-GAAP and Other Financial Measures”.
(2) Metallurgical recoveries are based on recovered
gold, not produced gold.
Sale of Interest in Greenstone
Partnership
On January 19, 2021, the Company completed the
sale of its 50% interest in the Greenstone Partnership with final
cash consideration received of $210.0 million, net of adjustments,
and recognized an initial gain on sale of $72.3 million (excluding
any contingent consideration). Pursuant to an agreement dated
December 15, 2020, with Orion Resource Partners (USA) LP and
Premier Gold Mines Limited, the Company was entitled to receive
further contingent consideration, payable no later than 24 months
after the construction decision on the Greenstone project and upon
the project achieving certain production milestones.
In the fourth quarter of 2021, the Greenstone
project was approved for construction and thus the initial
contingency payment of $25.0 million became receivable and owing
from Orion, payable no later than December 2023. As a result, the
Company recognized an additional gain on the sales of its interest
in the Greenstone Partnership of $25.0 million in the fourth
quarter of 2021.
The remaining contingent payments are payable no
later than 30 days following the date on which a cumulative
production milestone of (i) 250,000 ounces; (ii) 500,000 ounces;
and, (iii) 750,000 ounces have been achieved. The amounts are
payable in US dollars, equal to the product of 11,111 and the
20-day average gold market price on the business day immediately
prior to the date of the payment. The Company did not attribute any
value to these contingent payments as of December 31, 2022 due to
significant uncertainty associated with the Greenstone project.
Annual Results – Previous Three
Years
As a result of the loss of control of the Kumtor
Mine, the Company deconsolidated the results of the Kumtor Mine and
presented its financial results as a discontinued operation,
separate from the Company’s consolidated financial results.
Accordingly, the annual results presented below were updated
retrospectively to reflect the impact of discontinued operations
accounting.
|
$millions, except per share data |
2022 |
|
2021 |
|
2020 |
|
Revenue |
850 |
|
900 |
|
721 |
|
Net (loss) earnings from continuing operations (1) |
(77 |
) |
447 |
|
16 |
|
Basic (loss) earnings per share - continuing operations |
(0.29 |
) |
1.51 |
|
0.05 |
|
Diluted (loss) earnings per share - continuing operations |
(0.31 |
) |
1.48 |
|
0.05 |
|
Net (loss) earnings(2) |
(77 |
) |
(382 |
) |
409 |
|
Basic (loss) earnings per share(2) |
(0.29 |
) |
(1.29 |
) |
1.39 |
|
Diluted (loss) earnings per share(2) |
(0.31 |
) |
(1.29 |
) |
1.37 |
|
Cash dividends declared per common share (C$) |
0.28 |
|
0.24 |
|
0.18 |
(1) Net loss in 2022 reflects the impact
of non-cash impairment loss at the Kemess Project. Net earnings
from continuing operations in 2021 reflects the impact of
impairment reversal at the Mount Milligan Mine.
(2) Net loss in 2021 reflects the impact of
derecognition of the Kumtor Mine.
Quarterly Results – Previous Eight
Quarters
As a result of the loss of control of the Kumtor
Mine, the Company deconsolidated the results of the Kumtor Mine and
presented its financial results as a discontinued operation,
separate from the Company’s consolidated financial results.
Accordingly, the quarterly results presented below were updated
retrospectively to reflect the impact of discontinued operations
accounting.
|
$millions, except per share data |
2022 |
2021 |
|
quarterly data unaudited |
Q4 |
Q3 |
Q2 |
Q1 |
Q4 |
Q3 |
Q2 |
Q1 |
|
Revenue |
208 |
|
179 |
|
168 |
|
295 |
251 |
221 |
202 |
|
226 |
|
Net (loss) earnings from continuing operations(1) |
(130 |
) |
(34 |
) |
(3 |
) |
89 |
275 |
28 |
33 |
|
111 |
|
Basic (loss) earnings per share - continuing operations |
(0.59 |
) |
(0.14 |
) |
(0.01 |
) |
0.30 |
0.93 |
0.09 |
0.11 |
|
0.38 |
|
Diluted (loss) earnings per share - continuing operations |
(0.59 |
) |
(0.15 |
) |
(0.01 |
) |
0.30 |
0.92 |
0.09 |
0.10 |
|
0.37 |
|
Net (loss) earnings(2) |
(130 |
) |
(34 |
) |
(3 |
) |
89 |
275 |
28 |
(852 |
) |
167 |
|
Basic (loss) earnings per share(2) |
(0.59 |
) |
(0.14 |
) |
(0.01 |
) |
0.30 |
0.93 |
0.09 |
(2.87 |
) |
0.57 |
|
Diluted (loss) earnings per share(2) |
(0.59 |
) |
(0.15 |
) |
(0.01 |
) |
0.30 |
0.92 |
0.09 |
(2.87 |
) |
0.55 |
(1) Net loss in Q4 2022 reflects the
impact of non-cash impairment loss at the Kemess Project. Net
earnings from continuing operations in Q4 2021 reflects the impact
of impairment reversal at the Mount Milligan Mine.
(2) Net loss in Q2 2021 reflects the impact of
derecognition of the Kumtor Mine.
Related Party Transactions
Kyrgyzaltyn
The breakdown of sales transactions in the normal
course of business with Kyrgyzaltyn, prior to the loss of control
event in respect of the Kumtor Mine, is as follows:
|
|
Three months ended December 31, |
|
Years ended December 31, |
|
|
|
2022 |
|
|
2021 |
|
|
2022 |
|
|
2021 |
|
|
Gross gold and silver sales to Kyrgyzaltyn |
$ |
— |
|
$ |
— |
|
$ |
— |
|
$ |
265,407 |
|
| Deduct:
refinery and financing charges |
|
— |
|
|
— |
|
|
— |
|
|
(1,248 |
) |
|
Net revenue received from
Kyrgyzaltyn(1) |
$ |
— |
|
$ |
— |
|
$ |
— |
|
$ |
264,159 |
|
(1) Presented in
results from discontinued operations.
On July 29, 2022, the Company announced the
closing of the Arrangement Agreement. As a result of the completion
of the Arrangement Agreement, the Company repurchased and cancelled
all of Kyrgyzaltyn’s 77,401,766 Centerra common shares in exchange
for the aggregate cash payments of approximately $93.3 million,
including a portion of which was withheld on account of Canadian
withholding taxes payable by Kyrgyzaltyn and $7.0 million paid in
direct and incremental transaction costs to effect the
Transaction.
Transactions with key management
personnel
The Company transacts with key management
personnel, who have authority and responsibility to plan, direct
and control the activities of the Company and receive compensation
for services rendered in that capacity. Key management personnel
include members of the Board of Directors and members of the senior
leadership team.
During the years ended December 31, 2022 and 2021,
remuneration to key management personnel was as follows:
|
|
|
2022 |
|
2021 |
|
Director fees earned and other compensation |
$ |
740 |
$ |
754 |
| Salaries and
benefits(1) |
|
12,568 |
|
7,830 |
|
Share-based compensation |
|
273 |
|
1,894 |
|
Total compensation |
$ |
13,581 |
$ |
10,478 |
(1) Includes severance costs of $7.9
million.
Accounting Estimates, Policies and
Changes
Accounting Estimates
The preparation of the Company’s consolidated
financial statements in accordance with IFRS requires management to
make estimates and judgments that affect the amounts reported in
the consolidated financial statements and accompanying notes.
Management’s estimates and underlying
assumptions are reviewed on an ongoing basis. Any changes or
revisions to estimates and underlying assumptions are recognized in
the period in which the estimates are revised and in any future
periods affected. Changes to these critical accounting estimates
could have a material impact on the consolidated financial
statements.
The key sources of estimation uncertainty and
judgment used in the preparation of the consolidated financial
statements that might have a significant risk of causing a material
adjustment to the carrying value of assets and liabilities and
earnings are outlined in note 4 of the consolidated financial
statements for the year ended December 31, 2022.
Disclosure Controls and Procedures and
Internal Control Over Financial Reporting
The Company’s management, including the Interim
CEO and CFO, is responsible for the design of disclosure controls
and procedures (“DC&P”) and internal controls over financial
reporting (“ICFR”). Centerra adheres to the Committee of Sponsoring
Organizations of the Treadway Commission’s (“COSO”) revised 2013
Internal Control Framework for the design of its ICFR. There was no
material change to the Company’s internal controls over financial
reporting that occurred during 2022 that has materially affected,
or is reasonably likely to materially affect, the Company’s
internal controls over financial reporting.
The evaluation of DC&P and ICFR was carried
out under the supervision of and with the participation of
management, including Centerra’s Interim CEO and CFO. Based on
these evaluations, the Interim CEO and the CFO concluded that the
design of these DC&P and ICFR was effective throughout
2022.
Non-GAAP and Other Financial
Measures
This MD&A contains “specified financial
measures” within the meaning of NI 52-112, specifically the
non-GAAP financial measures, non-GAAP ratios and supplementary
financial measures described below. Management believes that the
use of these measures assists analysts, investors and other
stakeholders of the Company in understanding the costs associated
with producing gold and copper, understanding the economics of gold
and copper mining, assessing operating performance, the Company’s
ability to generate free cash flow from current operations and on
an overall Company basis, and for planning and forecasting of
future periods. However, the measures have limitations as
analytical tools as they may be influenced by the point in the life
cycle of a specific mine and the level of additional exploration or
other expenditures a company has to make to fully develop its
properties. The specified financial measures used in this MD&A
do not have any standardized meaning prescribed by IFRS and may not
be comparable to similar measures presented by other issuers, even
as compared to other issuers who may be applying the World Gold
Council (“WGC”) guidelines. Accordingly, these specified financial
measures should not be considered in isolation, or as a substitute
for, analysis of the Company’s recognized measures presented in
accordance with IFRS.
Definitions
As a result of the seizure of the Kumtor Mine by
the Kyrgyz Republic on May 15, 2021 and the loss of control of the
mine, the Company presented the results from the Kumtor Mine as a
discontinued operation, separate from the Company’s continuing
operations. Consequently, the following non-GAAP financial measures
were added in this MD&A: adjusted net (loss) earnings from
continuing operations; free cash flow (deficit) from continuing
operations and adjusted free cash flow (deficit) from continuing
operations, and the following non-GAAP ratio was added in this
MD&A: adjusted net (loss) earnings from continuing operations
per common share (basic and diluted). These measures are calculated
in a similar fashion as the equivalent non-GAAP financial measures
and ratios presented on a total basis, inclusive of both continuing
operations and discontinued operations.
The following is a description of the non-GAAP
financial measures, non-GAAP ratios and supplementary financial
measures used in this MD&A:
- All-in
sustaining costs on a by-product basis per ounce is a non-GAAP
ratio calculated as all-in sustaining costs on a by-product basis
divided by ounces of gold sold. All-in sustaining costs on a
by-product basis is a non- GAAP financial measure calculated as the
aggregate of production costs as recorded in the consolidated
statements of loss, refining and transport costs, the cash
component of capitalized stripping and sustaining capital
expenditures, lease payments related to sustaining assets,
corporate general and administrative expenses, accretion expenses,
asset retirement depletion expenses, copper and silver revenue and
the associated impact of hedges of by-product sales revenue (added
in the current period and applied retrospectively to the previous
period). When calculating all-in sustaining costs on a by-product
basis, all revenue received from the sale of copper from the Mount
Milligan Mine, as reduced by the effect of the copper stream, is
treated as a reduction of costs incurred. All-in sustaining costs
on a by-product basis for the Kumtor Mine excludes revenue-based
taxes. A reconciliation of all-in sustaining costs on a by-product
basis to the nearest IFRS measure is set out below. Management uses
these measures to monitor the cost management effectiveness of each
of its operating mines.
- All-in
sustaining costs on a co-product basis per ounce of gold or per
pound of copper, is a non-GAAP ratio calculated as all-in
sustaining costs on a co-product basis divided by ounces of gold or
pounds of copper sold, as applicable. All-in sustaining costs on a
co-product basis is a non-GAAP financial measure based on an
allocation of production costs between copper and gold based on the
conversion of copper production to equivalent ounces of gold. The
Company uses a conversion ratio for calculating gold equivalent
ounces for its copper sales calculated by multiplying the copper
pounds sold by estimated average realized copper price and dividing
the resulting figure by estimated average realized gold price. For
the fourth quarter and year ended December 31, 2022, 394 pounds and
450 pounds, respectively, of copper were equivalent to one ounce of
gold. All-in sustaining costs on a co-product basis for the Kumtor
Mine excludes revenue-based taxes. A reconciliation of all-in
sustaining costs on a co-product basis to the nearest IFRS measure
is set out below. Management uses these measures to monitor the
cost management effectiveness of each of its operating mines.
- Sustaining
capital expenditures and Non-sustaining capital
expenditures are non-GAAP financial measures. Sustaining
capital expenditures are defined as those expenditures required to
sustain current operations and exclude all expenditures incurred at
new operations or major projects at existing operations where these
projects will materially benefit the operation. Non-sustaining
capital expenditures are primarily costs incurred at ‘new
operations’ and costs related to ‘major projects at existing
operations’ where these projects will materially benefit the
operation. A material benefit to an existing operation is
considered to be at least a 10% increase in annual or life of mine
production, net present value, or reserves compared to the
remaining life of mine of the operation. A reconciliation of
sustaining capital expenditures and non-sustaining capital
expenditures to the nearest IFRS measures is set out below.
Management uses the distinction of the sustaining and
non-sustaining capital expenditures as an input into the
calculation of all-in sustaining costs per ounce and all-in costs
per ounce.
- All-in
costs on a by-product
basis per ounce is a non-GAAP ratio
calculated as all-in costs on a by-product basis divided by ounces
sold. All-in costs on a by-product basis is a non-GAAP financial
measure which includes all-in sustaining costs on a by-product
basis, exploration and study costs, non-sustaining capital
expenditures, care and maintenance and predevelopment costs. All-in
costs on a by-product basis per ounce for the Kumtor Mine include
revenue-based taxes. A reconciliation of all-in costs on a
by-product basis to the nearest IFRS measures is set out below.
Management uses these measures to monitor the cost management
effectiveness of each of its operating mines.
- Adjusted net
(loss) earnings is a non-GAAP financial measure calculated by
adjusting net (loss) earnings as recorded in the consolidated
statements of loss and comprehensive loss for items not associated
with ongoing operations. The Company believes that this generally
accepted industry measure allows the evaluation of the results of
continuing income-generating capabilities and is useful in making
comparisons between periods. This measure adjusts for the impact of
items not associated with ongoing operations. A reconciliation of
adjusted net (loss) earnings to the nearest IFRS measures is set
out below. Management uses this measure to monitor and plan for the
operating performance of the Company in conjunction with other data
prepared in accordance with IFRS.
- Adjusted net
(loss) earnings from continuing operations is a non-GAAP
financial measure calculated by adjusting net earnings from
continuing operations as recorded in the consolidated statements of
loss and comprehensive loss for items not associated with
continuing operations. This measure adjusts for the impact of items
not associated with continuing operations. A reconciliation of
adjusted net earnings from continuing operations to the nearest
IFRS measures is set out below. Management uses this measure to
monitor and plan for the operating performance of continuing
operations of the Company in conjunction with other data prepared
in accordance with IFRS.
- Free cash
flow (deficit) from continuing operations is a non-GAAP
financial measure calculated as cash provided by operating
activities from continuing operations less property, plant and
equipment additions. A reconciliation of free cash flow from
continuing operations to the nearest IFRS measures is set out
below. Management uses this measure to monitor the amount of cash
available to reinvest in the Company and allocate for shareholder
returns.
- Free cash
flow (deficit) from mine operations is a non-GAAP financial
measure calculated as cash provided by mine operations less
property, plant and equipment additions. A reconciliation of free
cash flow from mine operations to the nearest IFRS measures is set
out below. Management uses this measure to monitor the degree of
self-funding of each of its operating mines and facilities.
- Free cash
flow from discontinued operations is a non-GAAP financial
measure calculated as cash provided by operating activities from
discontinued operations less property, plant and equipment
additions associated with discontinued operations. A reconciliation
of free cash flow from discontinued operations to the nearest IFRS
measures is set out below.
- Adjusted
free cash flow (deficit) from operations is a non-GAAP
financial measure calculated as free cash flow adjusted for items
not associated with ongoing operations. A reconciliation of
adjusted free cash flow from operations to the nearest IFRS
measures is set out below. Management uses this measure to monitor
the amount of cash from ongoing operations available to reinvest in
the Company and allocate for shareholder returns.
- Average
realized gold price is a supplementary financial measure
calculated by dividing the different components of gold sales
(including third party sales, mark-to-market adjustments, final
pricing adjustments and the fixed amount received under the Mount
Milligan Streaming Arrangement) by the number of ounces sold.
Management uses this measure to monitor its sales of gold ounces
against the average market gold price.
- Average
realized copper price is a supplementary financial measure
calculated by dividing the different components of copper sales
(including third party sales, mark-to-market adjustments, final
pricing adjustments and the fixed amount received under the Mount
Milligan Streaming Arrangement) by the number of pounds sold.
Management uses this measure to monitor its sales of gold ounces
against the average market copper price.
- Total
liquidity is a supplementary financial measure calculated as
cash and cash equivalents and amount available under the corporate
credit facility. Credit Facility availability is reduced by
outstanding letters of credit. Management uses this measure to
determine if the Company can meet all of its commitments, execute
on the business plan, and to mitigate the risk of economic
downturns.
Certain unit costs, including all-in
sustaining costs on a by-product basis (including and excluding
revenue-based taxes) per ounce, are non-GAAP ratios which include
as a component certain non-GAAP financial measures including all-in
sustaining costs on a by-product basis which can be reconciled as
follows:
|
|
Three months ended December 31, |
|
|
Consolidated(2) |
Mount Milligan |
Öksüt |
|
Kumtor |
|
(Unaudited - $millions, unless otherwise
specified) |
2022 |
|
2021 |
|
2022 |
|
2021 |
|
2022 |
2021 |
|
2022 |
2021 |
|
Production costs attributable to gold |
39.0 |
|
49.7 |
|
39.0 |
|
39.3 |
|
— |
10.4 |
|
— |
— |
|
Production costs attributable to copper |
30.8 |
|
30.7 |
|
30.8 |
|
30.7 |
|
— |
— |
|
— |
— |
| Total
production costs excluding molybdenum segment, as reported |
69.8 |
|
80.4 |
|
69.8 |
|
70.0 |
|
— |
10.4 |
|
— |
— |
| Adjust
for: |
|
|
|
|
|
|
|
|
|
| Third
party smelting, refining and transport costs |
3.5 |
|
2.3 |
|
3.5 |
|
2.2 |
|
— |
0.1 |
|
— |
— |
|
By-product and co-product credits |
(54.3 |
) |
(63.8 |
) |
(54.3 |
) |
(63.8 |
) |
— |
— |
|
— |
— |
| Adjusted
production costs |
19.0 |
|
18.9 |
|
19.0 |
|
8.4 |
|
— |
10.5 |
|
— |
— |
| Corporate
general administrative and other costs |
12.1 |
|
7.3 |
|
0.4 |
|
(0.1 |
) |
— |
— |
|
— |
— |
|
Reclamation and remediation - accretion (operating sites) |
1.7 |
|
1.5 |
|
0.5 |
|
0.5 |
|
1.2 |
1.0 |
|
— |
— |
|
Sustaining capital expenditures |
14.5 |
|
24.3 |
|
9.9 |
|
20.2 |
|
4.6 |
4.1 |
|
— |
— |
|
Sustaining leases |
1.5 |
|
1.4 |
|
1.3 |
|
1.3 |
|
0.2 |
0.1 |
|
— |
— |
| All-in
sustaining costs on a by-product basis |
48.8 |
|
53.4 |
|
31.1 |
|
30.3 |
|
6.0 |
15.7 |
|
— |
— |
|
Exploration and evaluation costs |
23.0 |
|
6.4 |
|
2.0 |
|
1.1 |
|
1.4 |
— |
|
— |
— |
|
Non-sustaining capital expenditures(1) |
0.1 |
|
2.4 |
|
0.1 |
|
2.2 |
|
— |
0.2 |
|
— |
— |
| Care and
maintenance and other costs |
5.8 |
|
4.0 |
|
— |
|
— |
|
1.3 |
— |
|
— |
— |
| All-in
costs on a by-product basis |
77.7 |
|
66.2 |
|
33.2 |
|
33.6 |
|
8.7 |
15.9 |
|
— |
— |
| Ounces
sold (000s) |
49.4 |
|
90.3 |
|
49.4 |
|
58.6 |
|
— |
31.7 |
|
— |
— |
| Pounds
sold (millions) |
15.4 |
|
17.2 |
|
15.4 |
|
17.2 |
|
— |
— |
|
— |
— |
| Gold
production costs ($/oz) |
790 |
|
550 |
|
790 |
|
670 |
|
n/a |
328 |
|
— |
— |
| All-in
sustaining costs on a by-product basis ($/oz) |
987 |
|
591 |
|
629 |
|
518 |
|
n/a |
495 |
|
— |
— |
| All-in
costs on a by-product basis ($/oz) |
1,572 |
|
732 |
|
672 |
|
573 |
|
n/a |
501 |
|
— |
— |
| Gold -
All-in sustaining costs on a co-product basis ($/oz) |
1,308 |
|
829 |
|
950 |
|
883 |
|
n/a |
495 |
|
— |
— |
| Copper
production costs ($/pound) |
2.00 |
|
1.79 |
|
2.00 |
|
1.79 |
|
n/a |
n/a |
|
n/a |
n/a |
|
Copper - All-in sustaining costs on a co-product basis
($/pound) |
2.40 |
|
2.34 |
|
2.40 |
|
2.34 |
|
n/a |
n/a |
|
n/a |
n/a |
(1) Non-sustaining
capital expenditures are distinct projects designed to have a
significant increase in the net present value of the mine. In the
current quarter, non-sustaining capital expenditures include costs
related to the installation of the staged flotation reactors at the
Mount Milligan Mine.
Certain unit costs, including all-in
sustaining costs on a by-product basis (including and excluding
revenue-based taxes) per ounce, are non-GAAP ratios which include
as a component certain non-GAAP financial measures including all-in
sustaining costs on a by-product basis which can be reconciled as
follows:
|
|
Years ended December 31, |
|
|
Consolidated(2) |
Mount Milligan |
Öksüt |
|
Kumtor(3) |
|
(Unaudited - $millions, unless otherwise
specified) |
2022 |
|
2021 |
|
2022 |
|
2021 |
|
2022 |
2021 |
|
2022 |
2021 |
|
Production costs attributable to gold |
164.9 |
|
189.9 |
|
143.8 |
|
138.8 |
|
21.1 |
51.1 |
|
— |
72.6 |
|
Production costs attributable to copper |
125.1 |
|
118.0 |
|
125.1 |
|
118.0 |
|
— |
— |
|
— |
— |
| Total
production costs excluding molybdenum segment, as reported |
290.0 |
|
307.9 |
|
268.9 |
|
256.8 |
|
21.1 |
51.1 |
|
— |
72.6 |
| Adjust
for: |
|
|
|
|
|
|
|
|
|
| Third
party smelting, refining and transport costs |
12.1 |
|
11.1 |
|
11.9 |
|
10.1 |
|
0.2 |
1.0 |
|
— |
1.2 |
|
By-product and co-product credits |
(223.8 |
) |
(238.0 |
) |
(223.8 |
) |
(238.0 |
) |
— |
— |
|
— |
— |
| Community
costs related to current operations |
— |
|
— |
|
— |
|
— |
|
— |
— |
|
— |
2.6 |
| Adjusted
production costs |
78.3 |
|
81.0 |
|
57.0 |
|
28.9 |
|
21.3 |
52.1 |
|
— |
76.4 |
| Corporate
general administrative and other costs |
47.8 |
|
27.7 |
|
1.1 |
|
1.0 |
|
— |
— |
|
— |
— |
|
Reclamation and remediation - accretion (operating sites) |
7.2 |
|
4.9 |
|
1.8 |
|
1.8 |
|
5.4 |
3.1 |
|
— |
0.3 |
|
Sustaining capital expenditures |
69.1 |
|
85.5 |
|
53.1 |
|
66.7 |
|
16.0 |
18.8 |
|
— |
60.6 |
|
Sustaining lease payments |
5.8 |
|
5.4 |
|
5.1 |
|
4.8 |
|
0.6 |
0.6 |
|
— |
— |
| All-in
sustaining costs on a by-product basis |
208.2 |
|
204.5 |
|
118.1 |
|
103.2 |
|
43.3 |
74.6 |
|
— |
137.3 |
|
Revenue-based taxes |
— |
|
— |
|
— |
|
— |
|
— |
— |
|
— |
37.0 |
|
Exploration and study costs |
65.7 |
|
23.6 |
|
12.2 |
|
5.6 |
|
3.8 |
2.1 |
|
— |
8.8 |
|
Non-sustaining capital expenditures(1) |
2.1 |
|
5.3 |
|
1.6 |
|
4.1 |
|
— |
0.8 |
|
— |
25.9 |
| Care and
maintenance and other costs |
14.8 |
|
14.1 |
|
— |
|
— |
|
1.7 |
— |
|
— |
— |
| All-in
costs on a by-product basis |
290.8 |
|
247.4 |
|
131.9 |
|
112.9 |
|
48.8 |
77.5 |
|
— |
209.0 |
| Ounces
sold (000s) |
242.2 |
|
314.8 |
|
187.5 |
|
203.1 |
|
54.7 |
111.7 |
|
— |
147.8 |
| Pounds
sold (millions) |
73.4 |
|
78.0 |
|
73.4 |
|
78.0 |
|
— |
— |
|
— |
— |
| Gold
production costs ($/oz) |
681 |
|
604 |
|
767 |
|
683 |
|
386 |
457 |
|
— |
491 |
| All-in
sustaining costs on a by-product basis ($/oz) |
860 |
|
649 |
|
630 |
|
508 |
|
791 |
668 |
|
— |
929 |
| All-in
costs on a by-product basis ($/oz) |
1,201 |
|
785 |
|
704 |
|
556 |
|
891 |
694 |
|
— |
1,414 |
| Gold -
All-in sustaining costs on a co-product basis ($/oz) |
1,112 |
|
891 |
|
956 |
|
883 |
|
791 |
668 |
|
— |
929 |
| Copper
production costs ($/pound) |
1.70 |
|
1.51 |
|
1.70 |
|
1.51 |
|
n/a |
n/a |
|
n/a |
n/a |
|
Copper - All-in sustaining costs on a co-product basis
($/pound) |
2.12 |
|
1.94 |
|
2.12 |
|
1.94 |
|
n/a |
n/a |
|
n/a |
n/a |
(1) Non-sustaining capital
expenditures are distinct projects designed to have a significant
increase in the net present value of the mine. In the current year,
non-sustaining capital expenditures include costs related to the
installation of the staged flotation reactors at the Mount Milligan
Mine.
(2) Presented on a continuing operations basis,
excluding the results from the Kumtor Mine.
(3) Results from the period ended December 31, 2021 from
the Kumtor Mine are prior to the seizure of the mine on May 15,
2021.
Adjusted net (loss) earnings is a
non-GAAP financial measure and can be reconciled as
follows:
|
|
Three months ended December 31, |
Years ended December 31, |
|
($millions, except as noted) |
|
2022 |
|
|
2021 |
|
|
2022 |
|
|
2021 |
|
|
Net (loss) earnings |
$ |
(130.1 |
) |
$ |
274.9 |
|
$ |
(77.2 |
) |
$ |
(381.8 |
) |
|
Adjust for items not associated with ongoing operations: |
|
|
|
|
|
Loss of control of the Kumtor Mine |
|
— |
|
|
— |
|
|
— |
|
|
926.4 |
|
|
Kumtor Mine legal costs and other related costs |
|
— |
|
|
11.3 |
|
|
15.0 |
|
|
27.5 |
|
|
Gain from the discontinuance of Kumtor Mine hedge instruments |
|
— |
|
|
— |
|
|
— |
|
|
(15.3 |
) |
|
Impairment loss (reversal), net of tax |
|
138.2 |
|
|
(117.3 |
) |
|
138.2 |
|
|
(117.3 |
) |
|
Gain on the sale of Greenstone property |
|
— |
|
|
(25.0 |
) |
|
— |
|
|
(97.3 |
) |
|
Reclamation (recovery) expense at sites on care and
maintenance |
|
(3.4 |
) |
|
24.2 |
|
|
(94.2 |
) |
|
24.1 |
|
|
Gain on derecognition of the employee health plan benefit provision
at the Langeloth Facility |
|
(4.4 |
) |
|
— |
|
|
(4.4 |
) |
|
— |
|
|
Income and mining tax adjustments(1) |
|
(14.0 |
) |
|
(132.7 |
) |
|
13.2 |
|
|
(132.7 |
) |
|
Adjusted net (loss) earnings |
$ |
(13.7 |
) |
$ |
35.4 |
|
$ |
(9.4 |
) |
$ |
233.6 |
|
Net (loss) earnings per share - basic |
$ |
(0.59 |
) |
$ |
0.93 |
|
$ |
(0.29 |
) |
$ |
(1.29 |
) |
|
Net (loss) earnings per share - diluted |
$ |
(0.59 |
) |
$ |
0.92 |
|
$ |
(0.31 |
) |
$ |
(1.29 |
) |
|
Adjusted net (loss) earnings per share -
basic |
$ |
(0.06 |
) |
$ |
0.12 |
|
$ |
(0.04 |
) |
$ |
0.79 |
|
|
Adjusted net (loss) earnings per share -
diluted |
$ |
(0.06 |
) |
$ |
0.12 |
|
$ |
(0.04 |
) |
$ |
0.77 |
|
(1) Income tax
adjustments reflect the impact of foreign currency translation on
deferred income taxes and an election made under local legislation
to account for inflation and increase the tax value of Öksüt Mine’s
assets.
Adjusted net (loss) earnings from
continuing operations is a non-GAAP financial measure and can be
reconciled as follows:
|
|
Three months ended December 31, |
Years ended December 31, |
|
($millions, except as noted) |
|
2022 |
|
|
2021 |
|
|
2022 |
|
|
2021 |
|
|
Net (loss) earnings from continuing
operations |
$ |
(130.1 |
) |
$ |
274.9 |
|
$ |
(77.2 |
) |
$ |
446.9 |
|
|
Adjust for items not associated with ongoing operations: |
|
|
|
|
|
Kumtor Mine litigation and other related costs |
|
— |
|
|
11.3 |
|
|
15.0 |
|
|
25.5 |
|
|
Impairment loss (reversal), net of tax |
|
138.2 |
|
|
(117.3 |
) |
|
138.2 |
|
|
(117.3 |
) |
|
Gain on the sale of Greenstone property |
|
— |
|
|
(25.0 |
) |
|
— |
|
|
(97.3 |
) |
|
Reclamation (recovery) expense at sites on care and
maintenance |
|
(3.4 |
) |
|
24.2 |
|
|
(94.2 |
) |
|
24.1 |
|
|
Gain on derecognition of the employee health plan benefit provision
at the Langeloth Facility |
|
(4.4 |
) |
|
— |
|
|
(4.4 |
) |
|
— |
|
|
Income tax adjustments(1) |
|
(14.0 |
) |
|
(132.7 |
) |
|
13.2 |
|
|
(132.7 |
) |
|
Adjusted net (loss) earnings from continuing
operations |
$ |
(13.7 |
) |
$ |
35.4 |
|
$ |
(9.4 |
) |
$ |
149.2 |
|
Net (loss) earnings from continuing operations per share -
basic |
$ |
(0.59 |
) |
$ |
0.93 |
|
$ |
(0.29 |
) |
$ |
1.51 |
|
|
Net (loss) earnings from continuing operations per share -
diluted |
$ |
(0.59 |
) |
$ |
0.92 |
|
$ |
(0.31 |
) |
$ |
1.48 |
|
|
Adjusted net (loss) earnings from continuing operations per
share - basic |
$ |
(0.06 |
) |
$ |
0.12 |
|
$ |
(0.04 |
) |
$ |
0.50 |
|
|
Adjusted net (loss) earnings from continuing operations per
share - diluted |
$ |
(0.06 |
) |
$ |
0.12 |
|
$ |
(0.04 |
) |
$ |
0.50 |
|
(1) Income tax
adjustments reflect the impacts of foreign currency translation on
deferred income taxes and an election made under local legislation
to account for inflation and increase the tax value of Öksüt Mine’s
assets.
Free cash flow (deficit) from
continuing operations and adjusted free cash flow (deficit) from
continuing operations are non-GAAP financial measures and can be
reconciled as follows:
|
|
Three months ended December 31, |
|
|
Consolidated |
Mount Milligan |
Öksüt |
Molybdenum |
Other |
|
|
|
2022 |
|
|
2021 |
|
|
2022 |
|
|
2021 |
|
|
2022 |
|
|
2021 |
|
|
2022 |
|
2021 |
|
|
2022 |
|
|
2021 |
|
|
Cash (used in) provided by operating activities from
continuing operations(1) |
$ |
(9.8 |
) |
$ |
61.8 |
|
$ |
26.5 |
|
$ |
63.5 |
|
$ |
(11.9 |
) |
$ |
39.5 |
|
$ |
8.6 |
$ |
(15.8 |
) |
$ |
(33.0 |
) |
$ |
(25.4 |
) |
|
Deduct: |
|
|
|
|
|
|
|
|
|
|
|
Property, plant & equipment
additions(1) |
|
(15.5 |
) |
|
(23.1 |
) |
|
(10.9 |
) |
|
(17.3 |
) |
|
(4.6 |
) |
|
(4.2 |
) |
|
— |
|
(1.4 |
) |
|
— |
|
|
(0.2 |
) |
|
Free cash flow (deficit) from continuing
operations |
$ |
(25.3 |
) |
$ |
38.7 |
|
$ |
15.6 |
|
$ |
46.2 |
|
$ |
(16.5 |
) |
$ |
35.3 |
|
$ |
8.6 |
$ |
(17.2 |
) |
$ |
(33.0 |
) |
$ |
(25.6 |
) |
|
Adjust for: |
|
|
|
|
|
|
|
|
|
|
|
Kumtor Mine legal and other related costs |
|
— |
|
|
5.3 |
|
|
— |
|
|
— |
|
|
— |
|
|
— |
|
|
— |
|
— |
|
|
— |
|
|
5.3 |
|
|
Adjusted free cash flow (deficit) from continuing
operations |
$ |
(25.3 |
) |
$ |
44.0 |
|
$ |
15.6 |
|
$ |
46.2 |
|
$ |
(16.5 |
) |
$ |
35.3 |
|
$ |
8.6 |
$ |
(17.2 |
) |
$ |
(33.0 |
) |
$ |
(20.3 |
) |
(1) As presented in
the Company’s consolidated statements of cash flows.
|
|
Years ended December 31, |
|
|
Consolidated |
Mount Milligan |
Öksüt |
Molybdenum |
Other |
|
|
|
2022 |
|
|
2021 |
|
|
2022 |
|
|
2021 |
|
|
2022 |
|
|
2021 |
|
|
2022 |
|
|
2021 |
|
|
2022 |
|
|
2021 |
|
|
Cash provided by (used in) operating activities from
continuing
operations(1) |
$ |
(2.0 |
) |
$ |
270.9 |
|
$ |
161.6 |
|
$ |
268.9 |
|
$ |
(17.5 |
) |
$ |
131.7 |
|
$ |
(9.3 |
) |
$ |
(37.3 |
) |
$ |
(136.8 |
) |
$ |
(92.4 |
) |
|
Deduct: |
|
|
|
|
|
|
|
|
|
|
|
Property, plant & equipment additions at continuing
operations(1) |
|
(80.9 |
) |
|
(92.5 |
) |
|
(61.2 |
) |
|
(67.4 |
) |
|
(16.0 |
) |
|
(20.1 |
) |
|
(1.1 |
) |
|
(2.5 |
) |
|
(2.6 |
) |
|
(2.5 |
) |
|
Free cash flow (deficit) from continuing
operations |
$ |
(82.9 |
) |
$ |
178.4 |
|
$ |
100.4 |
|
$ |
201.5 |
|
$ |
(33.5 |
) |
$ |
111.6 |
|
$ |
(10.4 |
) |
$ |
(39.8 |
) |
$ |
(139.4 |
) |
$ |
(94.9 |
) |
|
Adjust for: |
|
|
|
|
|
|
|
|
|
|
|
Kumtor Mine legal and other related costs |
|
20.9 |
|
|
14.2 |
|
|
— |
|
|
— |
|
|
— |
|
|
— |
|
|
— |
|
|
— |
|
|
20.9 |
|
|
14.2 |
|
|
Adjusted free cash flow (deficit) from continuing
operations |
$ |
(62.0 |
) |
$ |
192.6 |
|
$ |
100.4 |
|
$ |
201.5 |
|
$ |
(33.5 |
) |
$ |
111.6 |
|
$ |
(10.4 |
) |
$ |
(39.8 |
) |
$ |
(118.5 |
) |
$ |
(80.7 |
) |
(1) As presented in
the Company’s consolidated statements of cash flows.
Free cash flow from discontinued
operations is a non-GAAP financial measure and can be reconciled as
follows:
|
|
Three months ended December 31, |
Years ended December 31, |
|
|
|
2022 |
|
2021 |
|
2022 |
|
2021 |
|
|
Cash provided by operating activities from discontinued
operations(1) |
$ |
— |
$ |
— |
$ |
— |
$ |
143.9 |
|
|
Deduct: |
|
|
|
|
|
Additions to property, plant & equipment from discontinued
operations(1) |
|
— |
|
— |
|
— |
|
(90.2 |
) |
|
Free cash flow from discontinued operations |
$ |
— |
$ |
— |
$ |
— |
$ |
53.7 |
|
(1) As presented in the Company’s
consolidated statements of cash flows.
Sustaining
capital expenditures and
non-sustaining capital expenditures are non-GAAP measures and can
be reconciled as follows:
|
|
Three months ended December 31, |
|
|
Consolidated |
Mount Milligan |
Öksüt |
Molybdenum |
Other |
|
|
|
2022 |
|
|
2021 |
|
|
2022 |
|
|
2021 |
|
|
2022 |
|
|
2021 |
|
|
2022 |
|
2021 |
|
2022 |
|
|
2021 |
|
|
Additions to
PP&E(1) |
$ |
27.9 |
|
$ |
46.9 |
|
$ |
14.6 |
|
$ |
28.9 |
|
$ |
5.1 |
|
$ |
9.3 |
|
$ |
0.8 |
$ |
1.4 |
$ |
7.4 |
|
$ |
7.3 |
|
| Adjust
for: |
|
|
|
|
|
|
|
|
|
|
|
Costs capitalized to the ARO assets |
|
(11.7 |
) |
|
(17.9 |
) |
|
(4.4 |
) |
|
(5.3 |
) |
|
— |
|
|
(5.2 |
) |
|
— |
|
— |
|
(7.3 |
) |
|
(7.4 |
) |
|
Costs capitalized to the ROU assets |
|
(0.2 |
) |
|
(1.3 |
) |
|
— |
|
|
(1.5 |
) |
|
(0.2 |
) |
|
0.2 |
|
|
— |
|
— |
|
— |
|
|
— |
|
|
Other(2) |
|
(0.6 |
) |
|
0.4 |
|
|
(0.2 |
) |
|
0.3 |
|
|
(0.3 |
) |
|
— |
|
|
— |
|
— |
|
(0.1 |
) |
|
0.1 |
|
|
Capital expenditures |
$ |
15.4 |
|
$ |
28.1 |
|
$ |
10.0 |
|
$ |
22.4 |
|
$ |
4.6 |
|
$ |
4.3 |
|
$ |
0.8 |
$ |
1.4 |
$ |
— |
|
$ |
— |
|
|
Sustaining capital expenditures |
|
15.3 |
|
|
25.7 |
|
|
9.9 |
|
|
20.2 |
|
|
4.6 |
|
|
4.1 |
|
|
0.8 |
|
1.4 |
|
— |
|
|
— |
|
|
Non-sustaining capital expenditures |
|
0.1 |
|
|
2.4 |
|
|
0.1 |
|
|
2.2 |
|
|
— |
|
|
0.2 |
|
|
— |
|
— |
|
— |
|
|
— |
|
(1) As presented in
the note 28 of the Company’s consolidated financial statements.
(2) Includes reclassification of
insurance and capital spares from supplies inventory to
PP&E.
|
|
Years ended December 31, |
|
|
Consolidated |
Mount Milligan |
Öksüt |
Molybdenum |
Other |
|
|
|
2022 |
|
|
2021 |
|
|
2022 |
|
2021 |
|
|
2022 |
|
|
2021 |
|
|
2022 |
|
2021 |
|
2022 |
|
|
2021 |
|
|
Additions to
PP&E(1) |
$ |
275.1 |
|
$ |
118.9 |
|
$ |
49.2 |
$ |
83.7 |
|
$ |
14.2 |
|
$ |
24.9 |
|
$ |
1.8 |
$ |
2.5 |
$ |
209.9 |
|
$ |
7.8 |
|
| Adjust
for: |
|
|
|
|
|
|
|
|
|
|
|
Costs capitalized to the ARO assets |
|
6.4 |
|
|
(17.8 |
) |
|
5.5 |
|
(5.3 |
) |
|
1.9 |
|
|
(5.20 |
) |
|
— |
|
— |
|
(1.0 |
) |
|
(7.3 |
) |
|
Costs capitalized to the ROU assets |
|
(0.4 |
) |
|
(6.9 |
) |
|
— |
|
(6.8 |
) |
|
(0.4 |
) |
|
(0.1 |
) |
|
— |
|
— |
|
— |
|
|
— |
|
|
Costs relating to the acquisition of Goldfield Project |
|
(208.2 |
) |
|
— |
|
|
— |
|
— |
|
|
— |
|
|
— |
|
|
— |
|
— |
|
(208.2 |
) |
|
— |
|
|
Other(2) |
|
0.3 |
|
|
(0.9 |
) |
|
— |
|
(0.8 |
) |
|
0.3 |
|
|
— |
|
|
0.1 |
|
— |
|
(0.1 |
) |
|
(0.1 |
) |
|
Capital expenditures |
$ |
73.2 |
|
$ |
93.3 |
|
$ |
54.7 |
$ |
70.8 |
|
$ |
16.0 |
|
$ |
19.6 |
|
$ |
1.9 |
$ |
2.5 |
$ |
0.6 |
|
$ |
0.4 |
|
|
Sustaining capital expenditures |
|
71.1 |
|
|
88.0 |
|
|
53.1 |
|
66.7 |
|
|
16.0 |
|
|
18.8 |
|
|
1.9 |
|
2.5 |
|
0.1 |
|
|
— |
|
|
Non-sustaining capital expenditures |
|
2.1 |
|
|
5.3 |
|
|
1.6 |
|
4.1 |
|
|
— |
|
|
0.8 |
|
|
— |
|
— |
|
0.5 |
|
|
0.4 |
|
(1) As presented in
the note 28 of the Company’s consolidated financial statements.
(2) Includes reclassification of
insurance and capital spares from supplies inventory to
PP&E.
Mineral Reserves and Mineral
Resources
The Company has released the results of the
updated mineral reserve and mineral resource estimates for the
Mount Milligan Mine, the Öksüt Mine, and the Kemess Property as of
December 31, 2022. The 2021 mineral reserves and resources estimate
excludes the Greenstone project which was divested on January 19,
2021 as well the Kumtor Mine.
Mount Milligan’s mineral reserves and mineral
resources are presented on a 100%-basis. Sales of gold and copper
from the Mount Milligan Mine are subject to the Mount Milligan
Streaming Arrangement whereby RGLD Gold AG (“Royal Gold”) is
entitled to 35% and 18.75% of gold and copper sales respectively.
Under this streaming arrangement, Royal Gold pays Centerra $435 per
ounce of gold delivered and 15% of the spot price per metric tonne
of copper delivered.
|
Total gold mineral reserves and
resources |
|
|
Gold (000s attributable ounces
contained)(3)(4) |
2022 |
2021 |
|
Total proven and probable mineral reserves |
5,453 |
5,936 |
| Total measured and indicated
mineral resources(1) |
6,053 |
6,153 |
|
Total inferred mineral resources(1)(2) |
926 |
899 |
(1) Mineral resources are in addition
to mineral reserves. Mineral resources do not have demonstrated
economic viability.
(2) Inferred mineral resources have a great amount
of uncertainty as to their existence and as to whether they can be
mined economically. It cannot be assumed that all or part of the
inferred mineral resources will ever be upgraded to a higher
category.
(3) Production at the Mount Milligan Mine is subject to
a streaming agreement which entitles Royal Gold to 35% of gold
sales from the Mount Milligan Mine. Under the streaming
arrangement, Royal Gold will pay $435 per ounce of gold delivered.
Mineral resources for the Mount Milligan property are presented on
a 100%-basis.
(4) On November 7, 2022, the Company released the Mount
Milligan Mine Technical Report for mineral resources and mineral
reserves at the Mount Milligan Mine. The Mount Milligan Mine
Technical Report added 1.1 million ounces of gold and 260 million
pounds of copper as of December 31, 2021. The balances as of
December 31, 2021 are inclusive of the updated figures included in
the Mount Milligan Mine Technical Report.
|
Total copper mineral reserves and
resources |
|
|
Copper (millions of pounds
contained)(3)(4) |
2022 |
2021 |
|
Total proven and probable mineral reserves |
1,532 |
1,366 |
| Total measured and indicated
mineral resources(1) |
6,453 |
5,551 |
|
Total inferred mineral resources(1)(2) |
559 |
499 |
(1) Mineral resources are in addition
to mineral reserves. Mineral resources do not have demonstrated
economic viability.
(2) Inferred mineral resources have a
great amount of uncertainty as to their existence and as to whether
they can be mined economically. It cannot be assumed that all or
part of the inferred mineral resources will ever be upgraded to a
higher category.
(3) Production at the Mount Milligan Mine is subject to
a streaming agreement which entitles Royal Gold to 18.75% of copper
sales from the Mount Milligan mine. Under the streaming
arrangement, Royal Gold will pay 15% of the spot price per metric
tonne of copper delivered. Mineral resources for the Mount Milligan
property are presented on a 100% basis.
(4) On November 7, 2022, the Company released the Mount
Milligan Mine Technical Report for mineral resources and mineral
reserves at the Mount Milligan Mine. The Mount Milligan Mine
Technical Report added 1.1 million ounces of gold and 260 million
pounds of copper as of December 31, 2021. The balances as of
December 31, 2021 are inclusive of the updated figures included in
the Mount Milligan Mine Technical Report.
|
Total molybdenum mineral reserves and
resources |
|
|
Molybdenum (millions of pounds
contained)(1)(3)(4) |
2022 |
2021 |
|
Total proven and probable mineral reserves |
— |
— |
| Total measured and indicated
mineral resources(2) |
762 |
636 |
|
Total inferred mineral resources(3) |
56 |
50 |
(1) Centerra’s equity interests are
Berg property 100%, Thompson Creek Mine 100%, and Endako Mine 75%.
In December 2020, the Berg property was optioned to a third party
which has the right to acquire a 70% interest in the property over
a period of up to five years.
(2) Mineral resources are in addition to mineral
reserves. Mineral resources do not have demonstrated economic
viability.
(3) Inferred mineral resources have a great amount of
uncertainty as to their existence and as to whether they can be
mined economically. It cannot be assumed that all or part of the
inferred mineral resources will ever be upgraded to a higher
category.
Material assumptions used to determine mineral
reserves and mineral resources are as follows:
|
|
2022 |
|
2021 |
|
Gold price |
|
|
|
|
Gold mineral reserves ($/oz) |
1,200-1,350 |
|
1,250-1,350 |
| Gold mineral resources
($/oz) |
1,275-1,550 |
|
1,450-1,550 |
| |
|
|
|
| Copper
price |
|
|
|
| Copper mineral reserves
($/lb) |
2.50-3.25 |
|
3.00 |
| Copper mineral resources
($/lb) |
3.10-3.50 |
|
3.50 |
| |
|
|
|
| Molybdenum
price |
|
|
|
| Molybdenum mineral resources
($/lb) |
10.00-14.00 |
|
14.00 |
| |
|
|
|
| Foreign exchange
rates |
|
|
|
| 1 USD : Canadian dollar |
1.25-1.33 |
|
1.25-1.30 |
| 1 USD :
Turkish lira |
7.50 |
|
7.50 |
Qualified Person & QA/QC –
Non-Exploration (including Production information)
Jean-Francois St-Onge, Professional Engineer,
member of the Professional Engineer of Ontario (PEO) and Centerra’s
Senior Director, Technical Services, has reviewed and approved the
scientific and technical information related to mineral reserves
contained in this news release. Mr. St-Onge is a Qualified Person
within the meaning of Canadian Securities Administrator’s NI 43-101
Standards of Disclosure for Mineral Projects.
Lars Weiershäuser, PhD, PGeo, and Centerra’s
Director of Geology, has reviewed and approved the scientific and
technical information related to mineral resources estimates
contained in this news release. Dr. Weiershäuser is a Qualified
Person within the meaning of Canadian Securities Administrator’s NI
43-101 Standards of Disclosure for Mineral Projects.
All mineral reserve and resources have been
estimated in accordance with the standards of the Canadian
Institute of Mining, Metallurgy and Petroleum and NI 43-101.
All other scientific and technical information
presented in this document, including the production estimates,
were prepared in accordance with the standards of the Canadian
Institute of Mining, Metallurgy and Petroleum and NI 43-101 and
were reviewed, verified, and compiled by Centerra’s geological and
mining staff under the supervision of W. Paul Chawrun, Professional
Engineer, member of the Professional Engineers of Ontario (PEO) and
Centerra’s Vice President and Chief Operating Officer and Anna
Malevich, Professional Engineer, member of the Professional
Engineers of Ontario (PEO) and Centerra’s Senior Director, Projects
each of whom is a qualified person for the purpose of NI
43-101.
The Mount Milligan Mine is described in a
technical report pursuant to NI 43-101 dated November 7, 2022 (with
an effective date of December 31, 2021) and filed on SEDAR at
www.sedar.com and
EDGAR at www.sec.gov/edgar. The
technical report describes the exploration history, geology, and
style of gold mineralization at the Mount Milligan deposit. Sample
preparation, analytical techniques, laboratories used, and quality
assurance and quality control protocols used during the exploration
drilling programs are done consistent with industry standards while
independent certified assay labs are used.
The Öksüt Mine is described in a technical
report pursuant to NI 43-101 dated September 3, 2015 and filed on
SEDAR at www.sedar.com. The
technical report describes the exploration history, geology, and
style of gold mineralization at the Öksüt deposit. Sample
preparation, analytical techniques, laboratories used, and quality
assurance and quality control protocols used during the exploration
drilling programs are done consistent with industry standards while
independent certified assay labs are used.
Centerra Gold Inc.
Consolidated Statements of Financial Position
|
As at December 31, |
|
|
2022 |
|
|
|
2021 |
|
(Expressed in thousands of United States
dollars) |
|
|
|
|
| |
|
|
|
|
|
Assets |
|
|
|
|
Current assets |
|
|
|
|
|
Cash and cash equivalents |
|
$ |
531,916 |
|
|
$ |
947,230 |
|
Amounts receivable |
|
|
92,161 |
|
|
|
76,841 |
|
Inventories |
|
|
316,799 |
|
|
|
221,220 |
|
Other current assets |
|
|
49,784 |
|
|
|
25,802 |
| |
|
|
990,660 |
|
|
|
1,271,093 |
| |
|
|
|
|
| Property, plant and
equipment |
|
|
1,272,792 |
|
|
|
1,272,091 |
| Deferred income tax
assets |
|
|
61,900 |
|
|
|
101,300 |
| Other non-current assets |
|
|
10,557 |
|
|
|
32,084 |
| |
|
|
1,345,249 |
|
|
|
1,405,475 |
| Total
assets |
|
$ |
2,335,909 |
|
|
$ |
2,676,568 |
| |
|
|
|
|
| Liabilities and
shareholders' equity |
|
|
|
|
| Current liabilities |
|
|
|
|
|
Accounts payable and accrued liabilities |
|
$ |
199,433 |
|
|
$ |
186,820 |
|
Income tax payable |
|
|
1,890 |
|
|
|
25,253 |
|
Other current liabilities |
|
|
73,529 |
|
|
|
15,281 |
| |
|
|
274,852 |
|
|
|
227,354 |
| |
|
|
|
|
| Deferred income tax
liabilities |
|
|
8,719 |
|
|
|
54,861 |
| Provision for reclamation |
|
|
227,867 |
|
|
|
331,312 |
| Other non-current
liabilities |
|
|
14,180 |
|
|
|
19,425 |
| |
|
|
250,766 |
|
|
|
405,598 |
| Shareholders'
equity |
|
|
|
|
|
Share capital |
|
|
886,479 |
|
|
|
984,095 |
|
Contributed surplus |
|
|
29,564 |
|
|
|
30,809 |
|
Accumulated other comprehensive (loss) income |
|
|
(3,323 |
) |
|
|
6,829 |
|
Retained earnings |
|
|
897,571 |
|
|
|
1,021,883 |
| |
|
|
1,810,291 |
|
|
|
2,043,616 |
| Total liabilities and
shareholders' equity |
|
$ |
2,335,909 |
|
|
$ |
2,676,568 |
| Commitments and
contingencies |
|
|
|
|
Centerra Gold Inc.
Consolidated Statements of (Loss) Earnings and
Comprehensive (Loss) Income
| |
Three months ended December 31, |
|
Years ended December 31, |
|
(Expressed in thousands of United States
dollars) |
|
2022 |
|
|
|
2021 |
|
|
|
2022 |
|
|
|
2021 |
|
|
|
|
|
|
|
|
|
|
| |
|
|
|
|
|
|
|
| |
|
|
|
|
|
|
|
|
Revenue |
$ |
208,304 |
|
|
$ |
251,082 |
|
|
$ |
850,194 |
|
|
$ |
900,141 |
|
| |
|
|
|
|
|
|
|
| Cost of sales |
|
|
|
|
|
|
|
|
Production costs |
|
158,096 |
|
|
|
131,985 |
|
|
|
574,622 |
|
|
|
487,676 |
|
|
Depreciation, depletion and amortization |
|
17,169 |
|
|
|
31,044 |
|
|
|
97,053 |
|
|
|
120,505 |
|
| Earnings from mine
operations |
|
33,039 |
|
|
|
88,053 |
|
|
|
178,519 |
|
|
|
291,960 |
|
| |
|
|
|
|
|
|
|
| Exploration and evaluation
costs |
|
23,481 |
|
|
|
7,263 |
|
|
|
66,516 |
|
|
|
26,082 |
|
| Corporate administration |
|
11,775 |
|
|
|
7,458 |
|
|
|
47,247 |
|
|
|
27,134 |
|
| Care and maintenance
expense |
|
10,276 |
|
|
|
8,251 |
|
|
|
33,006 |
|
|
|
28,723 |
|
| Impairment loss
(reversal) |
|
145,903 |
|
|
|
(160,000 |
) |
|
|
145,903 |
|
|
|
(160,000 |
) |
|
Reclamation (recovery) expense |
|
(3,469 |
) |
|
|
24,260 |
|
|
|
(94,021 |
) |
|
|
23,347 |
|
| Other
operating expenses |
|
6,374 |
|
|
|
2,367 |
|
|
|
16,661 |
|
|
|
12,759 |
|
| (Loss) earnings from
operations |
|
(161,301 |
) |
|
|
198,454 |
|
|
|
(36,793 |
) |
|
|
333,915 |
|
| |
|
|
|
|
|
|
|
| Gain on sale of Greenstone
Partnership |
|
— |
|
|
|
(25,000 |
) |
|
|
— |
|
|
|
(97,274 |
) |
| Other non-operating (income)
expenses |
|
(9,167 |
) |
|
|
9,426 |
|
|
|
(1,883 |
) |
|
|
23,493 |
|
| Finance costs |
|
3,069 |
|
|
|
761 |
|
|
|
9,523 |
|
|
|
4,762 |
|
| (Loss) earnings before
income tax |
|
(155,203 |
) |
|
|
213,267 |
|
|
|
(44,433 |
) |
|
|
402,934 |
|
| Income tax (recovery)
expense |
|
(25,120 |
) |
|
|
(61,613 |
) |
|
|
32,776 |
|
|
|
(44,015 |
) |
| Net (loss) earnings
from continuing operations |
|
(130,083 |
) |
|
|
274,880 |
|
|
|
(77,209 |
) |
|
|
446,949 |
|
| Net loss from discontinued
operations |
|
— |
|
|
|
— |
|
|
|
— |
|
|
|
(828,717 |
) |
| Net (loss)
earnings |
$ |
(130,083 |
) |
|
$ |
274,880 |
|
|
$ |
(77,209 |
) |
|
$ |
(381,768 |
) |
| |
|
|
|
|
|
|
|
| Other Comprehensive
Loss |
|
|
|
|
|
|
|
| Items that may be
subsequently reclassified to earnings: |
|
|
|
|
|
|
|
| Gain on translation of foreign
operation |
|
— |
|
|
|
— |
|
|
|
— |
|
|
|
31 |
|
| Changes in fair value of
derivative instruments |
|
(641 |
) |
|
|
(2,705 |
) |
|
|
(9,588 |
) |
|
|
(4,802 |
) |
| Other comprehensive
loss |
|
(641 |
) |
|
|
(2,705 |
) |
|
|
(9,588 |
) |
|
|
(4,771 |
) |
| Total comprehensive
(loss) income |
$ |
(130,724 |
) |
|
$ |
272,175 |
|
|
$ |
(86,797 |
) |
|
$ |
(386,539 |
) |
| |
|
|
|
|
|
|
|
| (Loss) earnings per
share - continuing operations: |
|
|
|
|
|
|
|
| Basic |
$ |
(0.59 |
) |
|
$ |
0.93 |
|
|
$ |
(0.29 |
) |
|
$ |
1.51 |
|
| Diluted |
$ |
(0.59 |
) |
|
$ |
0.92 |
|
|
$ |
(0.31 |
) |
|
$ |
1.48 |
|
| (Loss) earnings per
share: |
|
|
|
|
|
|
|
| Basic |
$ |
(0.59 |
) |
|
$ |
0.93 |
|
|
$ |
(0.29 |
) |
|
$ |
(1.29 |
) |
| Diluted |
$ |
(0.59 |
) |
|
$ |
0.92 |
|
|
$ |
(0.31 |
) |
|
$ |
(1.29 |
) |
| |
|
|
|
|
|
|
|
| Cash dividends
declared per common share (C$) |
$ |
0.07 |
|
|
$ |
0.07 |
|
|
$ |
0.28 |
|
|
$ |
0.24 |
|
Centerra Gold Inc.
Consolidated Statements of Cash Flows
| |
Three months ended
December 31, |
Years ended
December 31, |
|
(Expressed in thousands of United States
dollars) |
|
2022 |
|
|
2021 |
2022 |
|
|
2021 |
|
| |
|
|
|
|
|
|
|
|
|
| Operating
activities |
|
|
|
|
|
|
|
|
| Net (loss)
earnings from continuing operations |
$ |
(130,083 |
) |
$ |
274,880 |
|
$ |
(77,209 |
) |
$ |
446,949 |
|
| |
|
|
|
|
|
|
|
|
|
| Adjustments: |
|
|
|
|
|
|
|
|
| |
Depreciation, depletion and
amortization |
|
19,626 |
|
|
32,433 |
|
|
103,429 |
|
|
126,374 |
|
| |
Reclamation (recovery)
expense |
|
(3,469 |
) |
|
24,260 |
|
|
(94,021 |
) |
|
23,347 |
|
| |
Share-based compensation
expense |
|
1,850 |
|
|
446 |
|
|
770 |
|
|
1,364 |
|
| |
Finance costs |
|
3,069 |
|
|
760 |
|
|
9,523 |
|
|
4,762 |
|
| |
Income tax (recovery)
expense |
|
(25,120 |
) |
|
(61,613 |
) |
|
32,776 |
|
|
(44,015 |
) |
| |
Income taxes paid |
|
(760 |
) |
|
(9,597 |
) |
|
(55,628 |
) |
|
(17,182 |
) |
| |
Gain on sale of Greenstone
Partnership |
|
— |
|
|
(25,000 |
) |
|
— |
|
|
(97,274 |
) |
| |
Impairment loss
(reversal) |
|
145,903 |
|
|
(160,000 |
) |
|
145,903 |
|
|
(160,000 |
) |
| |
Other |
|
(1,316 |
) |
|
(3,392 |
) |
|
(3,491 |
) |
|
(646 |
) |
| |
|
9,700 |
|
|
73,177 |
|
|
62,052 |
|
|
283,679 |
|
| Changes in working
capital |
|
(19,522 |
) |
|
(11,365 |
) |
|
(64,032 |
) |
|
(12,771 |
) |
| Cash (used
in) provided by operating activities from continuing
operations |
|
(9,822 |
) |
|
61,812 |
|
|
(1,980 |
) |
|
270,908 |
|
| |
Cash provided by operating
activities from discontinued operations |
|
— |
|
|
— |
|
|
— |
|
|
143,853 |
|
| Cash (used
in) provided by operating activities |
|
(9,822 |
) |
|
61,812 |
|
|
(1,980 |
) |
|
414,761 |
|
| |
|
|
|
|
|
|
|
|
|
| Investing
activities |
|
|
|
|
|
|
|
|
| |
Property, plant and equipment
additions |
|
(15,495 |
) |
|
(23,118 |
) |
|
(80,930 |
) |
|
(92,500 |
) |
| |
Acquisition of Goldfield
Project |
|
— |
|
|
— |
|
|
(176,737 |
) |
|
— |
|
| |
Proceeds from sale of
Greenstone Partnership |
|
— |
|
|
— |
|
|
— |
|
|
210,291 |
|
| |
Proceeds from disposition of
property, plant and equipment |
|
— |
|
|
— |
|
|
2,025 |
|
|
11,868 |
|
| |
Decrease in other assets |
|
— |
|
|
9,980 |
|
|
— |
|
|
2,848 |
|
| |
Decrease in other assets |
|
— |
|
|
— |
|
|
|
|
|
| Cash (used
in) provided by investing activities from continuing
operations |
|
(15,495 |
) |
|
(13,138 |
) |
|
(255,642 |
) |
|
132,507 |
|
| |
Cash used in investing
activities from discontinued operations |
|
— |
|
|
— |
|
|
— |
|
|
(96,081 |
) |
| Cash (used
in) provided by investing activities |
|
(15,495 |
) |
|
(13,138 |
) |
|
(255,642 |
) |
|
36,426 |
|
| |
|
|
|
|
|
|
|
|
|
| Financing
activities |
|
|
|
|
|
|
|
|
| |
Dividends paid |
|
(11,474 |
) |
|
(11,998 |
) |
|
(47,667 |
) |
|
(45,044 |
) |
| |
Payment of borrowing
costs |
|
(598 |
) |
|
(561 |
) |
|
(2,255 |
) |
|
(2,654 |
) |
| |
Repayment of lease
obligations |
|
(1,677 |
) |
|
(1,585 |
) |
|
(6,755 |
) |
|
(6,476 |
) |
| |
Proceeds from common shares
issued |
|
1,369 |
|
|
998 |
|
|
3,484 |
|
|
5,037 |
|
| |
Repurchase and cancellation of
shares |
|
(11,159 |
) |
|
— |
|
|
(104,499 |
) |
|
— |
|
| Cash used
in financing activities |
|
(23,539 |
) |
|
(13,146 |
) |
|
(157,692 |
) |
|
(49,137 |
) |
| (Decrease)
increase in cash during the period |
$ |
(48,856 |
) |
$ |
35,528 |
|
$ |
(415,314 |
) |
$ |
402,050 |
|
| Cash at beginning
of the period |
|
580,772 |
|
|
911,702 |
|
|
947,230 |
|
|
545,180 |
|
| Cash at
end of the period |
$ |
531,916 |
|
$ |
947,230 |
|
$ |
531,916 |
|
$ |
947,230 |
|
The consolidated financial statements for the
year ended December 31, 2022 and 2021 and the MD&A for the
year ended December 31, 2022 and 2021 have been filed on SEDAR
at www.sedar.com and
EDGAR at www.sec.gov/edgar and are available on
the Company’s website at: www.centerragold.com.
A PDF accompanying this announcement is available
at:
http://ml.globenewswire.com/Resource/Download/27e324b7-24ae-4c68-b626-04132b499f55
Charts accompanying this announcement are available
at:
https://www.globenewswire.com/NewsRoom/AttachmentNg/f1684536-eef2-48c4-848a-e47309f1e3fd
https://www.globenewswire.com/NewsRoom/AttachmentNg/15afb6aa-81ff-48bc-96c4-3669d655ce5a
https://www.globenewswire.com/NewsRoom/AttachmentNg/e718c117-02ca-4133-b5d5-500112bc3974
https://www.globenewswire.com/NewsRoom/AttachmentNg/894c4307-2cb7-4b81-8833-8999ffda3c65
https://www.globenewswire.com/NewsRoom/AttachmentNg/22f24eab-b4f1-4192-a0f4-ba1502836569
https://www.globenewswire.com/NewsRoom/AttachmentNg/422dfa14-56fc-4429-9e08-f9c28bc11f4a
https://www.globenewswire.com/NewsRoom/AttachmentNg/7720fefb-19a5-4065-8a76-aa7eafd58e92
https://www.globenewswire.com/NewsRoom/AttachmentNg/c98dd1ee-5e55-40ee-90fb-15e74cfe702a


Centerra Gold (TSX:CG)
Gráfico Histórico do Ativo
De Mar 2025 até Abr 2025

Centerra Gold (TSX:CG)
Gráfico Histórico do Ativo
De Abr 2024 até Abr 2025

