Solana To New ATH Before Christmas – Analyst Expects $300 Soon
12 Dezembro 2024 - 7:00PM
NEWSBTC
Solana (SOL) has faced a 23% retrace after hitting new all-time
highs at $264, testing the resilience of bullish momentum. Despite
this pullback, SOL’s price structure remains strong, with the token
holding firmly above a critical demand zone. This consolidation
phase indicates the market is gearing up for another potential
breakout as bullish sentiment persists. Related Reading: Bitcoin
Finds Support At $94.5K As STH Realized Prize Signals Strength
Renowned crypto analyst and investor Jelle recently shared a
technical analysis on X, expressing optimism about Solana’s future
price trajectory. According to Jelle, the retrace is a healthy
correction that allows SOL to build the strength needed for another
significant rally. He predicts that Solana will reach new all-time
highs before Christmas, setting the stage for an exciting close to
the year. With Solana maintaining its position above key levels and
investor interest remaining robust, all eyes are on the $264 mark
as bulls prepare to push the token into price discovery once again.
The coming weeks will be pivotal, with the potential for SOL to
reclaim its momentum and deliver significant gains. If the bullish
predictions hold true, Solana could solidify its position as one of
the standout performers in the crypto market this cycle. Solana
Price Action Signals Strength Solana (SOL) continues to show
bullish momentum, holding strong above $210, a critical support
level that previously acted as resistance. This price behavior
signals a healthy retrace, allowing the market to reset before
another potential move higher. Solana’s ability to maintain this
level reinforces the bullish narrative, suggesting that it’s
preparing for another upward push. Top crypto analyst Jelle
recently shared his insights on X, expressing confidence in
Solana’s price trajectory. Jelle’s technical analysis predicts that
SOL will reach new heights before Christmas, highlighting a price
target of $300 in the near term. He emphasizes that the current
consolidation phase is a positive sign, as it allows for
accumulation and builds the momentum necessary for a breakout.
However, despite the optimism, the possibility of a prolonged
consolidation phase looms if SOL fails to break its all-time high
(ATH). This scenario could lead to a temporary stagnation in price
action, with SOL ranging sideways as traders await a clearer market
direction. Such a consolidation phase would not necessarily be
bearish but could delay the anticipated rally. Related Reading:
Cardano Follows 2020 Bullish Pattern – Top Analyst Plans To Take
Profits Between $4 And $6 For Solana to meet Jelle’s $300 target,
bulls must reclaim and hold levels above the ATH, signaling
strength and renewed buyer interest. If successful, Solana is
poised to enter price discovery once again, securing its position
as a top-performing crypto asset in the current market cycle. SOL
Testing Liquidity Levels Solana (SOL) is currently trading at
$232, showing resilience after successfully holding key demand
levels at $210. This critical support has proven vital in
maintaining bullish momentum, allowing the price to recover and
consolidate above $222. The ability to stay above this mark has
strengthened investor confidence, with the focus now shifting to
higher targets. The next key resistance for SOL is $246. Breaking
above this level would not only signify a bullish breakout but also
position SOL to challenge and surpass its all-time high (ATH) of
$264. A confirmed breakout above $246 would signal renewed
momentum, potentially driving Solana into uncharted territory and
reigniting market excitement. Related Reading: PEPE Whales
Increased Their Holdings By $1.4 Billion Yesterday – Details
However, the bullish scenario depends on SOL’s ability to maintain
its upward trajectory. If the price struggles to break above the
$246 level in the coming weeks, it risks losing momentum. This
could lead to a broader correction, with traders eyeing the $210
demand zone once again as a critical area to watch. Featured image
from Dall-E, chart from TradingView
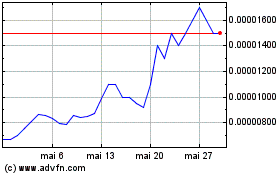
Pepe (COIN:PEPEUSD)
Gráfico Histórico do Ativo
De Dez 2024 até Jan 2025

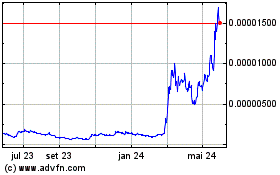
Pepe (COIN:PEPEUSD)
Gráfico Histórico do Ativo
De Jan 2024 até Jan 2025
