Ethereum Price Setting For a Big Move – Breakout Or Downturn?
26 Dezembro 2024 - 11:30AM
NEWSBTC
Ethereum has faced challenges in regaining its bullish momentum,
leaving the altcoin trading at a pivotal level. Ethereum is at the
center of attention investors who anticipate a potential rally in
the coming weeks. This optimism is fueled by expectations that
Ethereum’s resurgence could mark the beginning of a long-awaited
Altseason, bringing widespread gains across the altcoin market.
Related Reading: Bitcoin Is Forming A Symmetrical Triangle – Can
BTC Reclaim $100K? Top analyst Carl Runefelt recently shared a
compelling technical analysis on X, highlighting Ethereum’s
formation of a symmetrical triangle pattern in the 4-hour
timeframe. According to Runefelt, this pattern is a classic
precursor to a breakout, with a bullish target set above $3,980.
Such a move would signal a strong return to upward momentum for
Ethereum, reinforcing its position as a leading asset in the crypto
market. Market participants closely monitor this pattern, as a
confirmed breakout could catalyze a broader rally across altcoins.
However, Ethereum must first conquer this critical level to
solidify its bullish outlook. With the market at a crossroads, the
coming weeks will be decisive for Ethereum’s trajectory and its
role in sparking the next major phase of growth in the crypto
market. Ethereum Prepares For A Rally Ethereum has reclaimed
the $3,000 mark, maintaining a strong position after weeks of
consolidation. Currently, ETH is trading within a tight range,
capped by resistance at $3,550. This critical zone has captured the
attention of analysts and investors eager for Ethereum to break out
and surpass its yearly highs, signaling renewed bullish momentum.
Top analyst Carl Runefelt recently shared a detailed technical
analysis on X, emphasizing the symmetrical triangle pattern forming
on Ethereum’s 4-hour timeframe. According to Runefelt, this pattern
suggests a high probability of a significant price move, though the
direction remains uncertain. He forecasts a bullish target of
$3,980 if ETH breaks upward from the triangle. This level would
reaffirm Ethereum’s strength and likely inspire confidence among
market participants. Conversely, if the pattern breaks downward,
Runefelt predicts a retracement to $2,920, marking a critical test
of Ethereum’s ability to hold key support levels. Related Reading:
Solana Sees Consistent Capital Inflows Since 2023 – Liquidity
Influx Signals Growth The upcoming days are expected to be pivotal
for Ethereum as this symmetrical triangle nears its resolution.
Whether ETH surges past resistance or dips to retest support, the
outcome will have significant implications for its short-term
direction and long-term outlook. Investors are closely monitoring
these movements, awaiting signals of Ethereum’s next big move.
Price Action: Keeping An Eye On Key Demand Ethereum is
trading at $3,360, showing resilience after consolidating above the
critical $3,300 support level. This zone remains a key threshold
for bulls aiming to maintain momentum and push prices higher.
Holding above $3,300 is essential, as a breach of this level could
trigger a deeper correction, potentially retesting lower support
zones and dampening bullish sentiment. On the flip side, if ETH
establishes a solid base above $3,350, it could pave the way for a
swift recovery. A push beyond the $3,550 resistance mark would
likely reignite bullish momentum, setting Ethereum up to challenge
its yearly highs. This level represents a significant psychological
and technical milestone, and reclaiming it would signal strength in
the market. Related Reading: XRP Whales Keep Buying – Data Reveals
Smart Money Prepares For A Rally Ethereum’s ability to hold or
break these levels will determine its short-term trajectory.
Analysts are optimistic that a rally above $3,550 could lead to
rapid price gains. Reflecting renewed confidence in Ethereum’s
broader market performance. For now, ETH’s consolidation above
$3,300 signals cautious optimism, with the potential for an
explosive move in either direction depending on how these levels
are defended or broken. Featured image from Dall-E, chart from
TradingView
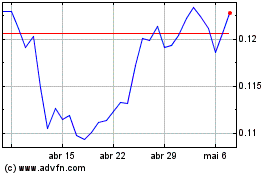
TRON (COIN:TRXUSD)
Gráfico Histórico do Ativo
De Nov 2024 até Dez 2024

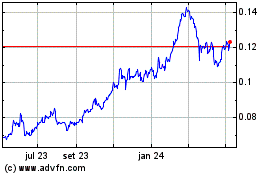
TRON (COIN:TRXUSD)
Gráfico Histórico do Ativo
De Dez 2023 até Dez 2024
