Technology had been the best performing sector in 2012 and it
easily outperformed the S&P 500 index. Starting in January,
however, this strength is apparently fading, with a big drop in
Apple’s shares underscoring the broad weakness in the large cap
technology ETF market (read: 3 Apple Proof ETFs).
Basically, the underperformers are from the large cap focused
tech funds like Select Sector SPDR Technology
(XLK), iShares
Dow Jones US Technology (IYW) and
Vanguard Information Technology Index Fund
(VGT). Software and
networking funds are also on the bottom list.
Still, it is not true to say that all the tech funds are lagging
(read: 5 Sector ETFs Surging to Start 2013). There are still some
of them that are surging and are not affected by the Apple issues
or the dull performances by many large caps. These include social
media, broad internet and emerging market technology funds that
have outpaced broad market expectations.
Below, we highlighted three top ETF performers which have not
only managed to stay over water, but have provided returns of high
single digits in the first month of 2013. These are expected to
continue with their bull run even with the sluggish performance
overall of the space.
Guggenheim China Technology ETF
(CQQQ)
Launched in December 2009, this fund targets the China market
and is leading the tech sector, though it has failed to attract
investors with just $19.6 million in AUM. It seeks to replicate the
price and performance of the AlphaShares China Technology Index,
before fees and expenses.
The ETF is highly concentrated on its top ten holdings, taking
up about 61% of the assets, suggesting that the return of the fund
is much more dependent on these companies. Despite its heavy
reliance, the fund generated double digits return in the first
month of the year (read: Why Earnings are Key for the Tech ETF
XLK).
CQQQ also pays a good 1.74% in annual dividends. This is because
it has lesser focus on large caps (26%) and a large part of it is
allocated toward mid and small caps securities.
Within the sector, Internet and mobile applications occupy the
top position in the basket with 41% share while electronic
components, communications equipment and semiconductors rounded to
top four. The product holds 37 securities in the basket, of which
three-fourths belong to mainland China companies and the rest goes
toward Hong Kong.
The fund is the high cost choice in the space, charging a fee of
70 bps a year. Additionally, investors have to pay an extra cost in
the form of a wide bid/ask spread due to its illiquid nature. CQQQ
has a Zacks Rank #3 or ‘Hold’ rating.
ETRACS Next Generation Internet ETN
(EIPO)
This note tracks the UBS Next Generation Internet Index and
provides exposure to the next generation Internet firms, generally
consisting of social networking, Internet software, and Internet
service stocks.
The product consists of 22 stocks and the benchmark imposes a
three-year age limit on holdings, ensuring that constituent
securities remain extremely relevant and at the forefront of the
industry.
In terms of individual holdings, the top spots are dominated by
developed market companies from the U.S. and Europe. Three
companies — like LinkedIn and Facebook — are the only ones to make
up at least 10% of the EIPO, ensuring a relatively high level of
concentration. In fact, the top ten holdings account for nearly
two-thirds of the total assets (read: New Leadership in the Tech
ETF Space?).
The ETF is heavily skewed towards small securities; large caps
make up just 10% of the total assets. Meanwhile, from a country
perspective, the U.S. accounts for close to two-thirds of its
assets, while China (15%), Russia (10%), the UK (8%), and Australia
(3%) round out the rest.
The fund has seen a solid run in the first month of the year,
adding more than 9%. However, volume and assets are again low for
this fund, ensuring a wide bid/ask spread along with a relatively
high expense ratio of 0.65%, thus increasing the total cost for
investors.
First Trust Dow Jones Internet Index Fund
(FDN)
The third solid ETF performer lies in the Internet segment of
the broad tech sector (read: Zacks Buy Ranked Internet ETF: FDN).
Launched in June 2006, this ETF tracks the Dow Jones Internet
Index, before fees and expenses.
The index measures the performance of companies that primarily
earn at least half of their revenues from the Internet business and
have a trading history of at least three months.
Holding 41 securities, the fund invests half of its assets in
top ten firms with Internet and mobile application as the top
sector within the tech. Google (GOOG), Amazon.com (AMZN) and eBay
(EBAY) are the top three elements in the basket and make up for a
combined 23% share.
Other firms hold no more than 5% of FDN. While large cap
accounts for 55% of the assets, mid and small cap take the
remaining portion in the basket (see more ETFs in the Zacks ETF
Center).
The product has delivered about 9% returns over one month but
yields very a meager 0.03% in annual dividends. It has managed
assets worth $835.7 million so far in the year (as of January 31),
charging investors 60 bps in fees per year. Trading in volume
of more than 160,000 shares per day, the fund has a relatively
tight bid/ask spread.
Currently, FDN has a Zacks Rank #1 or ‘Strong Buy’ rating. This
suggests that this product is expected to perform well over the
long haul, when compared to the other funds in the sector.
Want the latest recommendations from Zacks Investment Research?
Today, you can download 7 Best Stocks for the Next 30
Days. Click to get this free report >>
GUGG-CHINA TEC (CQQQ): ETF Research Reports
E-TRC NGI (EIPO): ETF Research Reports
FT-DJ INTRNT IX (FDN): ETF Research Reports
ISHARS-DJ TECH (IYW): ETF Research Reports
SPDR-TECH SELS (XLK): ETF Research Reports
To read this article on Zacks.com click here.
Zacks Investment Research
Want the latest recommendations from Zacks Investment Research?
Today, you can download 7 Best Stocks for the Next 30 Days. Click
to get this free report
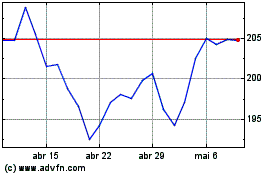
Technology Select Sector (AMEX:XLK)
Gráfico Histórico do Ativo
De Dez 2024 até Jan 2025

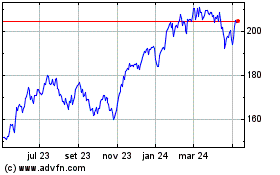
Technology Select Sector (AMEX:XLK)
Gráfico Histórico do Ativo
De Jan 2024 até Jan 2025
