It has been a brutal month in the REIT world as rising rates
have crushed these high yielders. Prices for many in this space
have slumped by more than 10% in the time frame, easily
underperforming other high yield stocks, as well as several longer
dated bonds as well.
This trend has stayed intact as rates for benchmark 10 year
government debt crossed the 2.9% mark, putting the three percent
level—a mark unimaginable six months ago-- in sight. And while the
prospect of the Fed tapering looking pretty likely, investors could
see further losses in the REIT corner of the market if yields do
hit this lofty mark (see Bet Against Real Estate with These Short
REIT ETFs).
Yet while the trend has certainly been poor for REITs lately,
Tuesday’s trading did offer up some good news finally. Global
markets tumbled pretty much around the world leading to a flight to
quality.
This helped to boost precious metals on the day, but the real
focus was again on the Treasury market. Global investors seemingly
piled into U.S. government debt pushing down rates close to the
2.8% level.
As you can imagine, REIT investors rallied around this news
pushing this sector higher on the day. In fact, besides some
continued strength in the commodity space—specifically in the
miners—REITs were actually leading for the session (see all the
Real Estate ETFs here).
ETF Options
For broad exposure to the REIT market, investors can look to any
number of REIT ETFs currently on the market. These have been
crushed lately, but if these trends continue may be decent short
term picks, assuming rates continue to consolidate.
Below, we highlight four of the most popular products in the
space for those who want a little more information on this in-focus
space:
Vanguard REIT ETF (VNQ)
This is easily the most popular REIT ETF on the market with
$16.6 billion in assets under management. The ETF is also a cheap
choice as costs come in at just 10 basis points a year for this
product.
In total, the product holds about 125 REITs in its basket, with
a roughly equal breakdown between large caps and then everything
else. Specialized REITs take the top spot (28.8%), followed by
retail REITs (27.7%) and then residential REITs (16.7%).
The ETF was up 2.5% for the session, though the product is still
down 10.2% over the past one month time frame. Still, the annual
yield remains robust at 3.9% for VNQ.
iShares U.S. Real Estate ETF (IYR)
This product is also a popular choice in the REIT market, as
volume is usually above 11 million shares a day. IYR is a bit
pricier than its counterpart though, as costs come in at 46 basis
points a year (see The Comprehensive Guide to REIT ETFs).
Total holdings come in just below 100 securities, though the
product does a solid job of spreading out assets, as just under 40%
are in the top ten. Specialty REITs again take the top spot (just
under 30%), while retail and industrial round out the top three at
just about 20% each.
This ETF added about 2.8% in Tuesday trading, while its one
month loss comes in at 9.7%. The product does pay out a little less
in yield though, coming in at 3.9% in 30-Day SEC terms and 3.8% for
a 12 month yield look.
iShares Cohen & Steers REIT ETF (ICF)
For another iShares look at the REIT market, investors have ICF.
This product tracks the Cohen & Steers Realty Major Index, a
benchmark of just 30 REITs charging investors 35 basis points a
year in fees for the exposure.
This product is heavily focused on large cap securities, as just
one-third of the total is devoted to mid caps or smaller. Top
individual holdings include Simon Property Group (SPG), Public
Storage (PSA), and HCP Inc. (HCP), and these three combine to
account for 21.8% of the total.
ICF is up roughly 2.4% in Tuesday trading, though it is still
down 10.8% in the trailing one month time frame. In terms of yield,
both the 30-Day SEC Yield and the 12-month yield come in around the
3.0% mark (see REIT ETFs Crushed: Time to Panic?).
DJ Wilshire REIT ETF (RWR)
SPDR’s entrant in the real estate market is also quite popular
as more than $2 billion is invested in the product while average
daily volume comes in at roughly 200,000 shares a day. This
product, which follows the Dow Jones U.S. Select REIT Index, is
also a cheap choice, charging investors just 25 basis points a year
in fees.
Once again this is a large cap focused product with small and
mid caps making up roughly 45% of the assets. Top sectors go
towards regional malls, apartments, and healthcare, all of which
make up at least 14.6% of assets.
The ETF added roughly 2.5% in Tuesday trading, though it has
lost about 10.4% in the past month. For yield, this fund is
currently sporting a 3.4% 30-Day SEC payout, while the annual
payout comes in at 3.3%.

Bottom Line
A rising rate environment has been terrible news for REIT ETFs,
pushing many down in recent weeks. Investors are clearly thinking
twice about the space given the rising expectations for tapering,
and concerns over housing in general with higher rates (see 3 ETFs
for Rising Interest Rates).
While this has been largely the trend as of late, REIT investors
received a temporary respite from the poor trading in Tuesday’s
session. REIT ETFs surged on this day as global markets retreated,
and U.S. yields followed.
Although it is unclear if this can continue—especially with
tapering pressures—it is good to see REITs finally having a solid
trading session, in what has otherwise been a pretty rough period
for this once-loved sector.
Want the latest recommendations from Zacks Investment Research?
Today, you can download 7 Best Stocks for the Next 30
Days. Click to get this free report >>
ISHARS-C&S REIT (ICF): ETF Research Reports
ISHARS-US REAL (IYR): ETF Research Reports
SPDR-DJ W REIT (RWR): ETF Research Reports
VIPERS-REIT (VNQ): ETF Research Reports
To read this article on Zacks.com click here.
Zacks Investment Research
Want the latest recommendations from Zacks Investment Research?
Today, you can download 7 Best Stocks for the Next 30 Days. Click
to get this free report
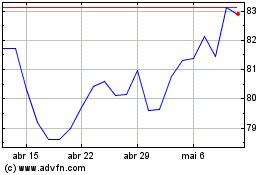
Vanguard Real Estate ETF (AMEX:VNQ)
Gráfico Histórico do Ativo
De Dez 2024 até Jan 2025

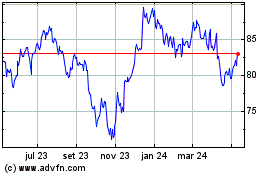
Vanguard Real Estate ETF (AMEX:VNQ)
Gráfico Histórico do Ativo
De Jan 2024 até Jan 2025
