| Company name: | FTSE 350 Automobiles & Parts |
| COD: | UB1010 | Trading Currency: | GBP |
| Market Sector: | | ISIN: | |
| Market Segment: | | Share Type: | IX |
| WWW Address: | | Description: | |
| Industry Sector: | |
| Price | Variação [%] | Bid | Offer | Abertura | MAX | MIN | Volume |
| 1,904.79 |  17.65 [0.94] 17.65 [0.94] | - | - | 1,887.14 | 1,905.93 | 1,886.34 | - |
| Market Cap. [m] | Shares In Issue [m] | Beta | EPS | DPS | PE Ratio | Yield | 52 Semanas |
| - | - | - | - | - | - | - | 2,079.05 - 1,749.29 |

FTSE 350 Automobiles & P... Key Figures| Key Figures | | (at previous day's close) |
| Market Cap. | - | m |
| Shares In Issue | - | m |
| Prev. Close | 1,887.14 | |
| PE Ratio | - | |
| Dividend Yield | - | % |
| EPS - basic | - | p |
| Dividend PS | - | p |
| Dividend Cover | - | |
| Cash Flow PS | - | p |
| Return On Equity (ROE) | - | % |
| Operating Margin | - | % |
| PEG Factor | - | |
| EPS Growth Rate | - | % |
| Dividends PS Growth Rate | - | % |
| Dívida Líquida | - | m |
| Gross Gearing | - | % |
| Quick Assets | - | m |
| Net Working Capital | - | m |
| Intangibles / Fixed Assets | - | % |
| Turnover PS | - | p |
| Pre-Tax Profit PS | - | p |
| Retained Profit PS | - | p |
| Cash PS | - | p |
| Net Cash PS | - | p |
| Net Tangible Asset Value PS * | - | p |
| Net Asset Value PS | - | p |
| Spread | - (-%) | |
| * Calculation based on Ordinary Capital figure as contained in last annual report, and the most recent shares in issue figure. Therefore the ratio might be exposed to inaccuracies. |
|
FTSE 350 Automobiles & P... Balance Sheet| %1$s Balance Sheet | | Sorry No Data Available |
|
Share Price Performance| Share Price Performance | | Sample Period † | MAX | MIN | | 1 Semana | 1,974.62 | 1,878.77 |
| 4 Semanas | 2,062.72 | 1,878.77 |
| 12 Semanas | 2,079.05 | 1,878.77 |
| 1 Ano | 2,079.05 | 1,749.29 |
Share Price Chart (5 years)| Share Price Chart (5 years) | 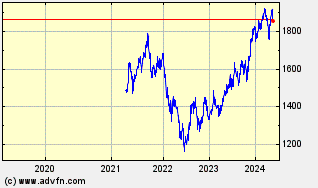 |
|
FTSE 350 Automobiles & P... Historic Returns| %1$s Historic Returns | | Período † | Abertura | VAB | % | Abertura Média | Vol Diário Médio [m] | Volume [m] | VWAP | | 1 Semana | 1,944.36 | -39.57 | -2.04 | 1,878.77 | - | | - |
| 4 Semanas | 2,041.33 | -136.54 | -6.69 | 1,878.77 | - | | - |
| 12 Semanas | 2,016.21 | -111.42 | -5.53 | 1,878.77 | - | | - |
| 26 Semanas | 1,816.97 | 87.82 | 4.83 | 1,790.94 | - | | - |
| 1 Ano | 1,900.59 | 4.20 | 0.22 | 1,749.29 | - | | - |
| 3 Anos | 1,374.52 | 530.27 | 38.58 | 1,157.87 | - | | - |
| 5 Anos | 94.47 | 1,810.32 | 1,916.29 | 94.47 | - | | - |
| † periods calculated are whole weeks rather than calendar months | |
|
FTSE 350 Automobiles & P... Key Management Ratios
|
FTSE 350 Automobiles & P... Investment Ratios| %1$s Investment Ratios | | (Market value analysis) at previous day's close |
| PQ Ratio | - | |
| PE Ratio | - | |
| Tobin's Q Ratio | - | |
| Tobin's Q Ratio (excl. intangibles) | - | |
| Dividend Yield | - | % |
| Market-to-Book Ratio | - | |
| Price-to-Pre-Tax Profit PS | - | |
| Price-to-Retained Profit PS | - | |
| Price-to-Cash Flow PS | - | |
| Price-to-Sales PS | - | |
| Price-to-Net Tangible Asset Value PS | - | |
| Price-to-Cash PS | - | |
| Net Working Capital PS | - | |
| Price Pct to Working Capital PS | - | % |
| Earnings Yield | - | % |
| Average PE | - | |
| Years in average | - | |
| PE to PE average | - | % |
|
FTSE 350 Automobiles & P... Financial Ratios| %1$s Financial Ratios | | (Leverage Ratios) |
| Debt Ratio | - | % |
| Debt-to-Equity Ratio | - | |
| Debt-to-Equity Ratio (excl. Intgbl) | - | |
| Debt-to-Equity Market Value | - | |
| Net Gearing | - | % |
| Net Gearing (excl. Intangibles) | - | % |
| Gross Gearing | - | % |
| Gross Gearing (excl. Intangibles) | - | % |
| Gearing Under 1 Year | - | % |
| Gearing Under 1 Year (excl. Intgbl) | - | % |
| Assets/Equity | - | |
| Cash/Equity | - | |
| (Liquidity Ratios) |
| Net Working Capital to Total Assets | - | % |
| Current Ratio | - | |
| Quick Ratio (Acid Test) | - | |
| Liquidity Ratio | - | |
| Cash & Equiv/Current Assets | - | % |
| (Solvency Ratios) |
| Enterprise Value | - | m |
| CFO/Sales | - | |
| CFO/Attributable Profit | - | |
| CFO/Assets | - | |
| CFO/Debt | - | |
| Total Debt/Equity Market Value | - | |
| Total Debt/Sales | - | |
| Total Debt/Pre-Tax Profit | - | |
| Total Debt | - | m |
| Total Debt/Net Current Assets | - | % |
| (Dodds - Graham Ratios) | | |
| 3 yr Compound Earnings Growth | - | % |
| 5 yr Compound Earnings Growth | - | % |
| 10 yr Compound Earnings Growth | - | % |
| Earn drops > 5% in 10yrs | - | |
| Beta coefficients | | Beta (60-Mnth) | Beta (36-Mnth) | | Sorry No Data Available | Sorry No Data Available |
|
FTSE 350 Automobiles & P... Operating Ratios| %1$s Operating Ratios | | (Profitability Ratios) |
| Return On Capital Employed (ROCE) | - | % |
| Return On Assets (ROA) | - | % |
| Net Profit Margin | - | % |
| Assets Turnover | - | |
| Return On Equity (ROE) | - | % |
| Return On Investment (ROI) | - | % |
| Dividend Payout Ratio | - | % |
| Plowback Ratio | 100.00 | % |
| Growth from Plowback Ratio | - | % |
| Net Income Of Revenues | - | % |
| (Asset Utilisation Multiples) |
| Shareholders Equity Turnover | - | |
| Fixed Assets Turnover | - | |
| Current Assets Turnover | - | |
| Net Working Capital Turnover | | |
| Inventory Turnover | - | |
| (Other Operating Ratios) |
| Total Assets-to-Sales | - | |
| Debtors-to-Sales | - | % |
| Debt Collection Period | - | Dias |
|
FTSE 350 Automobiles & P... Dividends
|
|
FTSE 350 Automobiles & P... Fundamentals |
|
|
FTSE 350 Automobiles & P... Balance Sheet
|
FTSE 350 Automobiles & P... Cash Flow Statement
| FTSE 350 Automobiles & P... Brokers| Broker infomation is not available for this class of stock. |
| | | | | | | | |
|
|
|
