MGM Announces Improved First Quarter Results Company Elects Early
Adoption of FASB Rules to Expense Stock Options LOS ANGELES, April
29 /PRNewswire-FirstCall/ -- Metro-Goldwyn-Mayer Inc. today
announced a 17 percent revenue increase, a sharply reduced net loss
and $13.0 million of net cash provided by operating activities for
the period ended March 31, 2004. (Logo:
http://www.newscom.com/cgi-bin/prnh/20011119/MGMLOGO ) Revenues in
the first quarter of 2004 rose 17 percent to $464.0 million,
compared to $395.2 million in last year's first quarter. Even
including a non-cash charge of $7.5 million, or $0.03 per share,
due to the Company's early election to expense employee stock
options under FASB guidelines, the first quarter net loss of $21.3
million, or $0.09 per share, was significantly lower than the net
loss of $55.8 million, or $0.22 per share, in the prior year
period. Commenting on these results, Alex Yemenidjian, Chairman and
Chief Executive Officer, said: "Our confidence in our ability to
continue to generate strong cash flow is the principal reason why
we decided to reward our shareholders with a tax-free extraordinary
dividend of $8.00 per share. Future cash flows give us significant
operating flexibility for both deleveraging and investing in our
operations, while preserving our ability to pursue strategic
opportunities." Chris McGurk, Vice Chairman and Chief Operating
Officer added: "Spectacular results from our global
self-distribution initiative in home entertainment were the primary
reason for our strong start in 2004. Worldwide DVD shipments
increased by 58% in the quarter, driven by a broad array of new
films, library films and TV programs." FIRST QUARTER 2004 OPERATING
HIGHLIGHTS: * Worldwide Home Entertainment revenues increased 44
percent. * Worldwide DVD unit shipments increased 58 percent. * MGM
Home Entertainment assumed full control of distribution in Germany,
France and Australia. * "Barbershop 2: Back in Business" was the
quarter's most successful release and will contribute strong first
cycle profits. * Worldwide Television Distribution renewed its
weekend movie partnership with UPN for a fifth season. * MGM
Networks continued to expand its international subscription base
outside Latin America, particularly in the Netherlands and in
Thailand. MGM Networks' reach now extends to 110 countries. *
Pursuant to the previously authorized share repurchase program, the
Company purchased 616,300 shares in the first quarter at an average
price of $16.87 per share. Metro-Goldwyn-Mayer Inc. (NYSE:MGM),
through its Metro-Goldwyn-Mayer Studios Inc. subsidiary, is
actively engaged in the worldwide production and distribution of
entertainment product, including motion pictures, television
programming, home video, interactive media, music, and licensed
merchandise. The Company owns the largest modern film library in
the world, consisting of approximately 4,000 titles. Its operating
units include MGM Pictures, United Artists, MGM Television
Entertainment, MGM Networks, MGM Distribution Co., MGM Worldwide
Television Distribution, MGM Home Entertainment, MGM On Stage, MGM
Consumer Products, MGM Music, MGM Interactive and MGM Online. In
addition, MGM has ownership interests in international television
channels reaching over 100 countries around the globe. For more
information on MGM, visit MGM Online at http://www.mgm.com/. This
news release contains forward-looking statements that are based
upon the Company's estimates and expectations concerning future
events and are subject to certain risks and uncertainties that
could cause actual results to differ materially from those
reflected in the forward-looking statements. These risks and
uncertainties include, among other things, future competitive and
market conditions, whether the Company's products achieve customer
acceptance, future business decisions, and other factors, including
those described in the Company's filings with the Securities and
Exchange Commission, all of which are difficult or impossible to
predict accurately and many of which are beyond the control of MGM.
In light of the significant uncertainties inherent in the
forward-looking information herein, the inclusion of such
information should not be regarded as a representation by the
Company or any other person that the Company's objectives or plans
will be realized. This press release shall not constitute an offer
to sell, or the solicitation of an offer to buy, any securities of
the Company. For further information, please contact Joseph
Fitzgerald of Metro-Goldwyn-Mayer Inc., +1-310-449-3660.
Metro-Goldwyn-Mayer Inc. Condensed Consolidated Results of
Operations Quarter Ended March 31, 2004 and 2003 Quarter Ended
March 31, In thousands, except share and per share data 2004 2003
(unaudited) Revenues: Feature films $408,824 $356,069 Television
programming 46,584 31,528 Other 8,588 7,594 Total revenues $463,996
$395,191 *EBITDA: Feature films $27,002 $(8,579) Television
programming (2,047) (2,442) Other 5,242 3,437 General and
administrative expenses (43,587) (26,232) *EBITDA (13,390) (33,816)
Depreciation (3,426) (5,239) Operating loss (16,816) (39,055)
Equity in net earnings (losses) of investees (1,199) 2,490 Interest
expense, net of amounts capitalized (1,087) (17,949) Interest and
other income, net 1,945 3,308 Loss before provision for income
taxes (17,157) (51,206) Income tax provision (4,113) (4,616) Net
loss $(21,270) $(55,822) Loss per share: Basic and diluted $(0.09)
$(0.22) Weighted average number of common shares outstanding: Basic
and diluted 237,645,948 248,469,650 * EBITDA, which is reconciled
to operating loss and net loss in the above table, is defined as
operating loss before depreciation. The Company believes that
EBITDA should be considered in addition to, not as a substitute for
or superior to, operating income, net earnings, net cash provided
by operating activities and other measures of financial performance
prepared in accordance with generally accepted accounting
principles ("GAAP"). The Company uses EBITDA as one of many
measures to evaluate both the operating performance of its business
segments and performance for compensation purposes. MGM believes
that EBITDA is also used by many investors, equity analysts and
others as a measure of performance to make informed investment
decisions. The EBITDA presented may not be comparable to similarly
titled measures reported by other companies. Metro-Goldwyn-Mayer
Inc. Condensed Consolidated Balance Sheets March 31, 2004 and
December 31, 2003 (In thousands, except share data) ASSETS March
31, December 31, 2004 2003 (unaudited) Cash and cash equivalents
$34,059 $61,894 Accounts and contracts receivable (net of allowance
for doubtful accounts of $65,147 and $46,671, respectively) 571,556
615,907 Film and television costs, net 1,838,540 1,788,225
Investments in and advances to affiliates 23,870 24,050 Property
and equipment, net 67,640 68,657 Goodwill 516,706 516,706 Other
assets 28,449 31,132 $3,080,820 $3,106,571 LIABILITIES AND
STOCKHOLDERS' EQUITY Liabilities: Bank and other debt $129,348 $813
Accounts payable and accrued liabilities 247,405 234,397 Accrued
participants' share 322,706 320,347 Income taxes payable 38,484
37,129 Advances and deferred revenues 80,772 72,908 Other
liabilities 109,681 112,606 Total liabilities 928,396 778,200
Commitments and contingencies Stockholders' equity: Preferred
stock, $.01 par value, 25,000,000 shares authorized, none issued --
-- Common stock, $.01 par value, 500,000,000 shares authorized,
251,960,505 shares issued 2,520 2,520 Additional paid-in capital
3,931,523 3,915,777 Accumulated other comprehensive income (loss)
(127) 2,046 Deficit (1,528,843) (1,507,573) Less: treasury stock,
at cost, 16,787,481 and 7,347,530 shares respectively (252,649)
(84,399) Total stockholders' equity 2,152,424 2,328,371 $3,080,820
$3,106,571 http://www.newscom.com/cgi-bin/prnh/20011119/MGMLOGO
http://photoarchive.ap.org/ DATASOURCE: Metro-Goldwyn-Mayer Inc.
CONTACT: Joseph Fitzgerald of Metro-Goldwyn-Mayer Inc.,
+1-310-449-3660 Web site: http://www.mgm.com/
Copyright
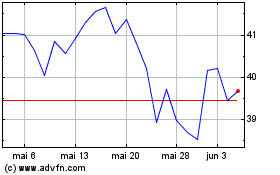
MGM Resorts (NYSE:MGM)
Gráfico Histórico do Ativo
De Jun 2024 até Jul 2024

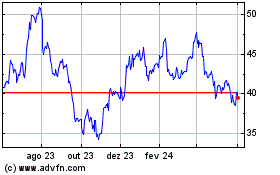
MGM Resorts (NYSE:MGM)
Gráfico Histórico do Ativo
De Jul 2023 até Jul 2024
