Earnings Preview: Halliburton - Analyst Blog
15 Abril 2011 - 5:00AM
Zacks
Major oilfield services provider
Halliburton Co. (HAL) is
scheduled to report its first quarter 2011 results on April 18,
2011, before the start of trading.
The Zacks Consensus Estimate for
the to-be-reported quarter is a profit of 59 cents per share (with
a downside potential of 1.7%) on revenue of $4.9 billion. In the
year-ago quarter, Halliburton recorded a gain of 28 cents per
share, while sales came in at $3.8 billion.
Fourth Quarter
Recap
Halliburton’s fourth-quarter 2010
results came in better than expected, helped by the strength and
sustainability of the all-important North American onshore activity
levels (to which the company is heavily exposed through its
market-share-leading pressure-pumping business).
Earnings per share, excluding
special items, came in at 68 cents, beating the Zacks Consensus
Estimate of 63 cents and were comfortably ahead of the year-ago
adjusted profit of 28 cents.
Revenues of $5.2 billion were 40.0%
greater than that achieved during the fourth quarter of 2009 and
also surpassed the Zacks Consensus Estimate of $4.9 billion, as
sales increased across the company’s business units.
(Read our full coverage on this
earnings report: Halliburton Posts Big Gain.)
Points to Ponder for
First Quarter
Halliburton enjoys a strong
competitive position within the global oilfield services markets.
We like the company’s broad and technologically-complex product and
service offerings, along with its robust financial profile.
It remains the best-positioned
company in the U.S. pressure pumping market, with significant
acreage positions in the highest profile plays, such as the
Haynesville, Eagle Ford shale and Bakken. In the near term,
Halliburton is likely to benefit from bullish U.S. land drilling
trends, where activity is tracking above expectations.
The key negative, in our view, is
the company’s recent assertion that March quarter results will be
adversely affected by abnormally seasonal weather and disruptions
in the Middle East/North Africa markets. The aggregate impact is
expected to be 5–8 cents per share for North American seasonality
and 3–4 cents per share associated with the North African unrest.
(Read our full coverage on this
story: Mid-East Crisis to Cut HAL's Profit.)
Agreement of
Analysts
As a result of the above-mentioned
factors, there has been a downward bias among the analysts
regarding Halliburton’s outlook. In particular, we see a notable
number of estimate revisions over the past 30 days.
Out of the 32 analysts covering the
stock, 13 have revised their estimates downward for the first
quarter of 2011, while 2 have gone in the opposite direction.
Magnitude of Estimate
Revisions
Consequent to analysts revising
estimates southward over the past 30 days, the Zacks Consensus
Estimate for the quarter has gone down by 3 cents (from $62 cents
to 59 cents).
Our
Recommendation
Halliburton shares currently retain
a Zacks #3 Rank, which translates into a short-term 'Hold' rating.
We are also maintaining our long-term '"Neutral'" recommendation on
the stock.
We like Halliburton’s leading
position in the global oilfield services market, along with its
broad and technologically-complex product and service offerings,
and its robust financial profile. Since the last few quarters, the
company has been benefiting from increased activity in the
unconventional oil and gas shale plays in North America, which have
more than made up for the drop in deepwater Gulf of Mexico
activity.
However, the world's second-largest
oilfield services company after Schlumberger Ltd.
(SLB) continues to feel pressure from
intense competition in the market, depressed natural gas prices and
the expected curtailment in incremental drilling projects.
As such, we see the stock
performing in line with the broader market and prefer to remain on
the sidelines.
HALLIBURTON CO (HAL): Free Stock Analysis Report
SCHLUMBERGER LT (SLB): Free Stock Analysis Report
Zacks Investment Research
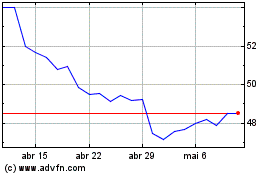
Schlumberger (NYSE:SLB)
Gráfico Histórico do Ativo
De Jun 2024 até Jul 2024

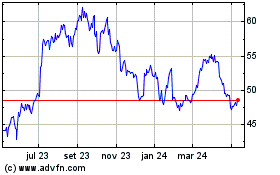
Schlumberger (NYSE:SLB)
Gráfico Histórico do Ativo
De Jul 2023 até Jul 2024
