Mixed 4Q for Baker Hughes - Analyst Blog
24 Janeiro 2012 - 8:00AM
Zacks
Baker
Hughes Inc. (BHI) delivered
impressive fourth quarter 2011 results, recording a year-over-year
jump in per share profit on strong domestic operations. The
company’s earnings of $1.22 a share showed a vast improvement from
77 cents earned a year ago. However, the quarterly results were
below the Zacks Consensus Estimate of $1.33.
In 2011, Baker
Hughes reported earnings of $4.20 per share compared to $2.06 per
share in 2010. But the earnings were below the Zacks Consensus
Estimate of $4.31 per share.
Revenue shot up
22% year over year to $5,387 million in the quarter from $4,423
million. The top line also exceeded the Zacks Consensus Estimate of
$5,462 million.
For 2011, revenue
stood at $19,831 million versus $14,414 million in 2010. However,
total revenue for the year missed the Zacks Consensus Estimate of
$19,898 million.
During the
reported quarter, the company experienced strong demand in North
America as the business fundamentals remained robust owing to
activity growth in the unconventional basins. Excluding Pressure
Pumping, all other groups - Drilling, Evaluation, Completion and
Production showed steady improvements. Internationally, the company
experienced solid top-line growth, margin also was strong at 16%
due to robust performance across all regions.
Segmental
Highlights
Of Baker Hughes’
total quarterly revenue, North America,
Europe/Africa/Russia/Caspian, Middle East/Asia-Pacific and Latin
America accounted for 52%, 17%, 14% and 11%, respectively. The
remainder was generated by the Industrial and Others
segment.
A strong
improvement in before-tax profit was noticed in
Europe/Africa/Russia/Caspian during the quarter. Pre-tax margin in
North America came in at 15%, compared with 22% in the year-earlier
quarter.
Latin America
recorded profit before-tax margin of 4% as against 9% in the
year-ago quarter, while it was 9% in Middle East/Asia-Pacific (down
from 10% in the fourth quarter 2010) and 11% (versus 8%) in
Europe/Africa/Russia/Caspian. The Industrial Services and Other
segment’s margin declined to a negative 7% from the prior-year
figure of positive 10%.
Liquidity
At the end of the
fourth quarter, Baker Hughes had $1,050 million in cash and cash
equivalents, while long-term debt was $3,845 million, representing
a debt-to-capitalization ratio of 19.4%. The company’s capital
expenditures were $810 million during the reported
quarter.
Outlook
Houston,
Texas-based Baker Hughes, the world's third-largest oilfield
services provider, is favorably positioned with significant
improvements in activity levels in both North America and the
international regions. The company’s strong portfolio of products
and services will help it generate better-than-average results in
the domestic market and enable it to further penetrate in the
international markets. The company also has a competitive set of
technologies, which allows it to pursue deepwater activity in the
GoM.
The company
expects its worldwide demand to improve further, particularly in
China, India, and other developing nations of Asia and the Middle
East, which will in turn boost its international spending. Activity
is also expected to climb in 2012 led by the steady improvement in
Latin America, Middle East and the deepwater markets and will
consequently support pricing improvements. Baker Hughes remains
committed to enhancing its international.
However, we remain
cautious about the tardy deepwater drilling in the U.S. Gulf
region. While deepwater activities have increased, the pace of
permits being issued has slowed significantly. Competition from the
heavyweight Schlumberger Ltd. (SLB) also remains a
headwind.
We maintain a
long-term Neutral recommendation on the stock.
BAKER-HUGHES (BHI): Free Stock Analysis Report
SCHLUMBERGER LT (SLB): Free Stock Analysis Report
To read this article on Zacks.com click here.
Zacks Investment Research
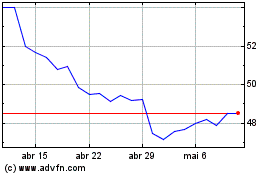
Schlumberger (NYSE:SLB)
Gráfico Histórico do Ativo
De Jun 2024 até Jul 2024

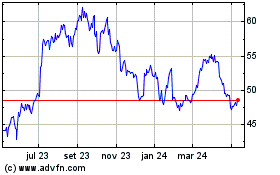
Schlumberger (NYSE:SLB)
Gráfico Histórico do Ativo
De Jul 2023 até Jul 2024
