How to Play the Texas Tea Momentum - Investment Ideas
23 Fevereiro 2012 - 10:00PM
Zacks
How to Play Texas Tea Momentum
How
to Play the Texas Tea Momentum
In May 2008 a call from a major brokerage was heard round the
world. It was the “super spike” in the price of oil which called
for prices to dramatically increase from the $115 level to an
unthinkable $150-$200 a barrel. This call came from the same
analyst that three years earlier saw $100 barrel crude when sweet
Texas tea was hovering close to $60. The earlier call was also a
somewhat unthinkable prospect.
Recently, we got another call from the same brokerage… just
a different analyst this time. The call isn’t quite the same,
but the idea is. Oil prices are expected to move higher. We will
leave the details of Iran or supply and demand out of this
discussion and focus on how we can best position our portfolio
based on this move. Of course you'll need to agree with the
basic thesis that oil will be moving higher and have some faith in
Goldman Sach's and thier research.
Who Benefits
The immediate thought of who benefits rests with the largest
players in the oil patch. Chevron (CVX), Exxon Mobil (XOM) and
ConocoPhillips (COP) come to mind. The services like Halliburton
Company (HAL) and Schlumberger (SLB) could also see some benefit as
a result.
One area that could see exaggerated benefit would be the
drillers. As oil prices continue to increase, the willingness of
speculators to search new sources of oil should lead to gains for
the drillers. Those that are succesfull at new holes in proven
reserves are even more attractive. Diamond Offshore Drilling
(DO) at $9 billion carries a small multiple of 9x trailing earnings
and is one of the largest drillers. As one of the biggest drillers,
the stock is protected from large price swings via
diversification.
Nabors Industries (NBR) is another driller that is a little
smaller Diamond Offshore Drilling at $6 billion in market
capitalization. A 10 year chart of NBR points out just how the
drillers of smaller size can be affected by a super spike in oil.
From early January of 2008 through late June 2008, NBR nearly
doubled.

Drilling deeper into the segment we reach Rowan Companies (RDC)
with a market capitalization of $4.8 billion. This stock did not
see the same spike that NBR saw in the 2008 time frame, mostly
because it is diversified into forestry and steel products.
Again, it's all a matter of preference and exactly how much pure
exposure you want to oil.
For the most speculative out there, the small (wildcat) drilling
companies can offer the some great potential returns, but also
carry significant risks. Pioneer Drilling (PDC) is about $600
million in market capitalization and already trades at a lofty 50x
trailing earnings. Its small size make it a potential M&A play
as well, but this stock does not come without its inherent risks.
As the price of oil returned from its super spike, PDC saw its
stock react like a gusher – a gusher that lost all of its pressure.
The stock slid from a high of $20 in June 2008 to $6.75 in October
of the same year and that wasn’t the bottom. Mid-March of 2009 saw
the stock reach rock bottom around the $3.50 level, a move that
underscores “what spikes up, is likely to spike down.”

Who has the most to
lose?
When oil spikes, the cost of fuel soars. Airlines generally feel
the effect of higher fuel costs more than other transportation
stocks as they have no other alternative fuel sources and in a
tough economic envirnment not much room to raise prices on
consumers. Many will view this as yet another reason to not own an
airline stock, as most airlines end up losing money and or going
bankrupt.
Another segment of the economy that gets hit during oil super
spikes is the automotive segment. Car makers saw sales of SUV’s and
other gas guzzlers plummeted in 2008 as consumers looked for better
gas mileage. Higher energy costs in general will hurt major
manufacturing companies like the auto-makers as well because of
increased production costs which equate to higher
margins.
Ford (F) saw its stock crumble during the super spike. There
were other factors that lead to the debacle that was the US auto
industry, but 2008 saw F move from a high of $8 to $1.50. Don’t
think that the US auto industry was alone, Toyota (TM) also saw a
“super spike” of its own. Shares of the Japanese car maker slid
throughout all of 2008, but saw a sizeable spike downward late in
the year losing one third its value.
Conclusion
Higher oil prices pump a crimp on all spending in the US economy,
but some sectors feel the pain more than others. Airlines and
automakers bear the brunt of it, but higher fuel costs send prices
higher on just about everything from food to computer parts. That
does not mean we cannot find a few areas of strength to take
advantage of big moves in the price of oil. Alternitives like
wind, solar and nat gas should also see a rise in prices.
Look for the "best in breed" in each alternitives sector to
be rewarded if oil prices continue to rise.
CONOCOPHILLIPS (COP): Free Stock Analysis Report
CHEVRON CORP (CVX): Free Stock Analysis Report
DIAMOND OFFSHOR (DO): Free Stock Analysis Report
FORD MOTOR CO (F): Free Stock Analysis Report
HALLIBURTON CO (HAL): Free Stock Analysis Report
NABORS IND (NBR): Free Stock Analysis Report
PIONEER DRILLNG (PDC): Free Stock Analysis Report
ROWAN COS INC (RDC): Free Stock Analysis Report
SCHLUMBERGER LT (SLB): Free Stock Analysis Report
TOYOTA MOTOR CP (TM): Free Stock Analysis Report
EXXON MOBIL CRP (XOM): Free Stock Analysis Report
To read this article on Zacks.com click here.
Zacks Investment Research
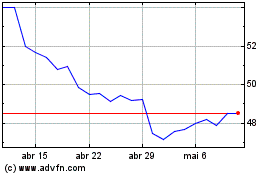
Schlumberger (NYSE:SLB)
Gráfico Histórico do Ativo
De Jun 2024 até Jul 2024

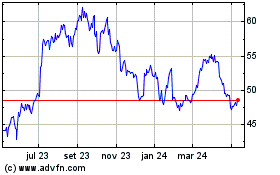
Schlumberger (NYSE:SLB)
Gráfico Histórico do Ativo
De Jul 2023 até Jul 2024
