The absence of major news and
significant domestic economic data meant that Friday’s quiet
trading session left the benchmarks languishing in the red zone.
Positive housing and jobs data lifted benchmarks to new multi-year
highs during the week, culminating in another green finish for the
benchmarks, except the Dow.
The Dow Jones Industrial Average
(DJI) shed 0.1% and closed at 12,977.57. The Standard & Poor
500 (S&P 500) lost 0.3% and finished Friday’s trading session
at 1,369.63. The Nasdaq Composite Index settled at 2,976.19, after
losing 0.4%. While the benchmarks hardly showed any significant
movements, the fear-gauge CBOE Volatility Index closed almost flat.
The VIX edged up 0.2% and closed at 17.29. Total volume on the New
York Stock Exchange (NYSE) was 3.36 billion shares. For 32% of the
stocks that advanced, 64% of the stocks were on the declining side.
The remaining stocks were left unchanged.
Coming to the advance-decline
ratio, the Dow had an equal number of gainers and decliners. Among
the 30 Dow components, International Business Machines (NYSE:IBM),
JP Morgan Chase & Co. (NYSE:JPM), Kraft Foods Inc. (NYSE:KFT),
AT&T Inc. (NYSE:T) and Verizon Communications Inc. (NYSE:VZ)
led the advancers with gains of 0.7%, 0.6%, 0.6%, 0.8% and 0.6%,
respectively. Decliners were led by American Express (NYSE:AXP),
Caterpillar, Inc. (NYSE:CAT), Cisco Systems, Inc. (NASDAQ:CSCO),
General Electric Company (NYSE:GE) and Microsoft Corporation
(NASDAQ:MSFT) which dropped 1.1%, 0.8%, 0.6%, 0.8% and 0.7%,
respectively.
On Thursday, Iranian media had
reported almost an hour before the closing bell that there was an
explosion in an unknown Saudi oil pipeline. However, soon after the
closing bell, this report was rubbished by a Saudi oil official.
Thus, with fears of supply disruption fading, oil prices dropped
from their 11-month high. On Friday, Energy SPDR Select Sector Fund
(XLE) lost 1.1% and stocks including ConocoPhillips (NYSE:COP),
Exxon Mobil Corporation (NYSE:XOM), Schlumberger (NYSE:SLB),
Halliburton Company (NYSE:HAL), National Oilwell Varco, Inc. Co
(NYSE:NOV) and Marathon Oil Corporation (NYSE:MRO) lost 0.7%, 0.6%,
1.5%, 1.2%, 2.2% and 2.2%, respectively.
While the day lacked action, an
initial public offering garnered tremendous gains. Consumer-review
website, YELP INC. (NYSE:YELP) debuted on the Street and gained
63.9% to settle at $24.58 a share. Earlier, the company had priced
its IPO at $15 per share. At these levels, the company was valued
at $1.43 billion and is trading at a level 17 times higher than its
revenues in 2011.
The last day of the week saw
benchmarks scale new heights buoyed by employment and housing data.
The Dow settled above 13, 000 on Tuesday, the first time since May
2008 and the S&P 500 was at its highest closing level since
June 2008. During the week, the S&P 500 also recorded its
longest winning streak since the one that concluded on January 23
this year. The Nasdaq too kept dwelling at levels last seen in
December 2000 or at the fag-end of the dot-com bubble.
Additionally, the tech-laden index crossed the 3, 000 mark on
Wednesday, but failed to sustain those high levels by the closing
bell.
Coming to the week’s positive
employment and housing data, the U.S. Department of Labor reported
that the advance figure for seasonally adjusted initial claims for
the week ending February 25 had dropped 2,000 to 351,000. On last
Monday, he National Association of Realtors reported that pending
home sales were on an uptrend and well above the year-ago level.
According to the report, the Pending Home Sales Index increased 2%
to 97 in January, up from a downwardly revised figure of 95.1 in
December.
The week did offer some dismal
economic data, but rising consumer confidence, increased business
activity in February, and better than expected GDP numbers helped
the benchmarks extend their stay in the green for the week. As for
the week, the Dow lost a mere 0.04%, but S&P 500 and Nasdaq
climbed 0.3% and 0.4%, respectively. The benchmarks are also
enjoying a healthy run for the year, with the Dow, S&P 500 and
Nasdaq up 6.2%, 8.9% and 14.2%, respectively for 2012 so far.
AMER EXPRESS CO (AXP): Free Stock Analysis Report
CATERPILLAR INC (CAT): Free Stock Analysis Report
CONOCOPHILLIPS (COP): Free Stock Analysis Report
CISCO SYSTEMS (CSCO): Free Stock Analysis Report
GENL ELECTRIC (GE): Free Stock Analysis Report
HALLIBURTON CO (HAL): Free Stock Analysis Report
INTL BUS MACH (IBM): Free Stock Analysis Report
JPMORGAN CHASE (JPM): Free Stock Analysis Report
MARATHON OIL CP (MRO): Free Stock Analysis Report
MICROSOFT CORP (MSFT): Free Stock Analysis Report
NATL OILWELL VR (NOV): Free Stock Analysis Report
SCHLUMBERGER LT (SLB): Free Stock Analysis Report
AT&T INC (T): Free Stock Analysis Report
VERIZON COMM (VZ): Free Stock Analysis Report
EXXON MOBIL CRP (XOM): Free Stock Analysis Report
To read this article on Zacks.com click here.
Zacks Investment Research
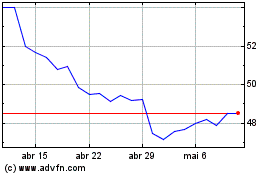
Schlumberger (NYSE:SLB)
Gráfico Histórico do Ativo
De Jun 2024 até Jul 2024

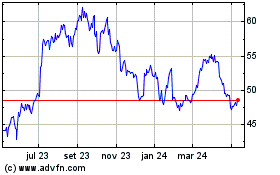
Schlumberger (NYSE:SLB)
Gráfico Histórico do Ativo
De Jul 2023 até Jul 2024
