Kimberly-Clark Up Over 9%, On Pace for Largest Percent Increase Since March 2020 -- Data Talk
22 Abril 2022 - 11:58AM
Dow Jones News
Kimberly-Clark Corporation (KMB) is currently at $140.08, up
$11.98 or 9.35%
--Would be highest close since Jan. 24, 2022, when it closed at
$141.80
--On pace for largest percent increase since March 13, 2020,
when it rose 9.7%
--Currently up six of the past seven days
--Currently up four consecutive days; up 12.1% over this
period
--Longest winning streak since Dec. 8, 2021, when it rose for
six straight trading days
--Best four day stretch since the four days ending March 30,
2020, when it rose 12.82%
--Up 13.74% month-to-date
--Down 1.99% year-to-date
--Down 11.81% from its all-time closing high of $158.84 on Aug.
12, 2020
--Up 6.03% from 52 weeks ago (April 23, 2021), when it closed at
$132.11
--Down 3.12% from its 52-week closing high of $144.59 on Jan.
10, 2022
--Up 19.18% from its 52-week closing low of $117.53 on March 11,
2022
--Traded as high as $141.40; highest intraday level since Jan.
25, 2022, when it hit $141.68
--Up 10.38% at today's intraday high; largest intraday percent
increase since March 16, 2000, when it rose as much as 12.78%
--Second best performer in the S&P 500 today
All data as of 10:22:37 AM ET
Source: Dow Jones Market Data, FactSet
(END) Dow Jones Newswires
April 22, 2022 10:43 ET (14:43 GMT)
Copyright (c) 2022 Dow Jones & Company, Inc.
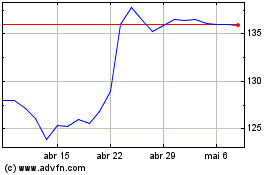
Kimberly Clark (NYSE:KMB)
Gráfico Histórico do Ativo
De Abr 2024 até Mai 2024

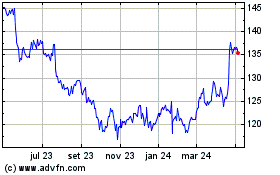
Kimberly Clark (NYSE:KMB)
Gráfico Histórico do Ativo
De Mai 2023 até Mai 2024
