3D SYSTEMS CORP false 0000910638 0000910638 2024-02-27 2024-02-27
UNITED STATES
SECURITIES AND EXCHANGE COMMISSION
Washington, D.C. 20549
FORM 8-K
CURRENT REPORT
Pursuant to Section 13 or 15(d)
of the Securities Exchange Act of 1934
Date of Report (Date of earliest event reported): February 27, 2024
3D SYSTEMS CORPORATION
(Exact name of registrant as specified in its charter)
|
|
|
|
|
| Delaware |
|
001-34220 |
|
95-4431352 |
| (State or Other Jurisdiction of Incorporation) |
|
(Commission File Number) |
|
(I.R.S. Employer Identification No.) |
333 Three D Systems Circle
Rock Hill, South Carolina 29730
(Address of Principal Executive Offices) (Zip Code)
(803) 326-3900
(Registrant’s telephone number, including area code)
N/A
(Former name or former address, if changed since last report)
Check the appropriate box below if the Form 8-K filing is intended to simultaneously satisfy the filing obligation of the registrant under any of the following provisions:
| ☐ |
Written communications pursuant to Rule 425 under the Securities Act (17 CFR 230.425) |
| ☐ |
Soliciting material pursuant to Rule 14a-12 under the Exchange Act (17 CFR 240.14a-12) |
| ☐ |
Pre-commencement communications pursuant to Rule 14d-2(b) under the Exchange Act (17 CFR 240.14d-2(b)) |
| ☐ |
Pre-commencement communications pursuant to Rule 13e-4(c) under the Exchange Act (17 CFR 240.13e-4(c)) |
Securities registered pursuant to Section 12(b) of the Act:
|
|
|
|
|
| Title of each class |
|
Trading Symbol(s) |
|
Name of each exchange on which registered |
| Common stock, par value $0.001 per share |
|
DDD |
|
New York Stock Exchange |
Indicate by check mark whether the registrant is an emerging growth company as defined in Rule 405 of the Securities Act of 1933 (§230.405 of this chapter) or Rule 12b-2 of the Securities Exchange Act of 1934 (§240.12b-2 of this chapter).
Emerging growth company ☐
If an emerging growth company, indicate by check mark if the registrant has elected not to use the extended transition period for complying with any new or revised financial accounting standards provided pursuant to Section 13(a) of the Exchange Act. ☐
| Item 2.02. |
Results of Operations and Financial Condition. |
On February 27, 2024, 3D Systems Corporation (the “Company”) issued a press release announcing the Company’s unaudited results of operations for the fourth quarter and year ended December 31, 2023 (the “Press Release”). A copy of the Press Release is furnished herewith as Exhibit 99.1 and is incorporated into this Item 2.02 by reference. The information in this Item 2.02 (and in the Press Release) shall not be deemed “filed” with the Securities and Exchange Commission (the “SEC”) for purposes of the Securities Exchange Act of 1934, as amended (the “Exchange Act”), nor incorporated by reference in any registration statement filed by the Company under the Securities Act of 1933, as amended (the “Securities Act”).
| Item 7.01. |
Regulation FD Disclosure. |
Included in the Press Release is the Company’s announcement of a delay of the release of its audited financial results for the year ended December 31, 2023 and the filing of its Annual Report on Form 10-K for the fiscal year ended December 31, 2023. Also included in the Press Release is an announcement that the Company plans to hold a conference call and webcast at 8:30 a.m., Eastern Time, on Wednesday, February 28, 2024, to discuss its anticipated fourth quarter and year ended December 31, 2023 financial results and other matters relating to the Company’s plans and operations. A copy of the Press Release, which contains additional information regarding how to access the conference call and webcast and how to listen to a recorded playback of the call after it is completed, is furnished herewith as Exhibit 99.1 and is incorporated into this Item 7.01 by reference. The slides to be presented on the webcast are furnished herewith as Exhibit 99.2 and incorporated into this Item 7.01 by reference.
The information in this Item 7.01 (and in the Press Release and slides) shall not be deemed “filed” with the SEC for purposes of the Exchange Act, nor incorporated by reference in any registration statement filed by the Company under the Securities Act.
| Item 9.01. |
Financial Statements and Exhibits. |
(d) Exhibits.
SIGNATURE
Pursuant to the requirements of the Securities Exchange Act of 1934, the registrant has duly caused this report to be signed on its behalf by the undersigned hereunto duly authorized.
|
|
|
|
|
|
|
|
|
|
|
3D SYSTEMS CORPORATION |
|
|
|
|
| Date: February 28, 2024 |
|
|
|
By: |
|
/s/ Jeffrey A. Creech |
|
|
|
|
|
|
Jeffrey A. Creech |
|
|
|
|
|
|
Executive Vice President and Chief Financial Officer |
EXHIBIT 99.1
3D Systems Reports
Fourth Quarter
and Full Year 2023 Financial Results
(Unaudited)
ROCK HILL, South Carolina - February 27, 2024 - 3D Systems Corporation (NYSE:DDD) announced today its financial results for
the fourth quarter and full year ended December 31, 2023.
Fourth Quarter Financial Results (Unaudited)
(All numbers are unaudited and are presented in thousands, except per share amounts or otherwise noted)
| |
• |
|
Q4 2023 revenue of $114,848 decreased 13.5% compared to Q4 2022 due to significant softness in dental
orthodontics and depressed printer sales from delayed customer capex investments |
| |
• |
|
Q4 2023 gross profit margin of 40.4% and Non-GAAP gross profit margin(1) of 41.9%. Non-GAAP gross profit margin represents an increase from prior year primarily driven by product mix |
| |
• |
|
Q4 2023 Net loss of $300,412, diluted loss per share of $2.30, primarily driven by the non-cash impairment of goodwill and other intangible assets, and Non-GAAP diluted loss per share(1) was $0.11
|
| |
• |
|
Q4 2023 Adjusted EBITDA(1) decreased by $7,452 to a
loss of $12,260, primarily driven by lower revenue and an increase in operating expenses associated with investments in Regenerative Medicine and a short-term increase in consulting and outside services expenses |
Full Year 2023 Financial Results (Unaudited)
(All
numbers are unaudited and are presented in thousands, except per share amounts or otherwise noted)
| |
• |
|
2023 revenue of $488,069 decreased 9.3% compared to 2022 revenue of $538,031, primarily driven by the exceptional
softness in dental orthodontics and slower printer hardware sales |
| |
• |
|
2023 gross profit margin of 40.7% increased from 2022 gross profit margin of 39.8%. 2023 Non-GAAP gross profit margin(1) of 41.1% increased from 2022 Non-GAAP gross profit margin of 39.8%, primarily
driven by improved operational efficiencies and favorable mix |
| |
• |
|
2023 net loss of $370,432, diluted loss per share of $2.85, primarily driven in large part by the non-cash impairment of goodwill and other intangible assets, and Non-GAAP diluted loss per share(1) was $0.26
|
| |
• |
|
2023 Adjusted EBITDA(1) decreased by $18,744 to a
loss of $24,525, primarily driven by lower revenue and an increase in operating expenses associated with investments in Regenerative Medicine and an increase in consulting and outside services expenses |
| |
• |
|
In December 2023, the company repurchased $135,130 of its Convertible Senior Notes (“Convertible
Notes”) for $100,614 including transaction expenses, opportunistically reducing its outstanding debt by nearly 30% at a substantial discount to par-value |
| |
• |
|
Cash and cash equivalents of $331,525 position the company well for support of restructuring and efficiency
initiatives, as well as continuity in key growth investments |
|
|
|
|
|
|
|
|
|
|
|
|
|
|
|
|
|
| Unaudited |
|
Quarter Ended December 31, |
|
|
Year Ended December 31, |
|
| (in thousands, expect per share data) |
|
2023 |
|
|
2022 |
|
|
2023 |
|
|
2022 |
|
| Revenue |
|
$ |
114,848 |
|
|
$ |
132,732 |
|
|
$ |
488,069 |
|
|
$ |
538,031 |
|
| Gross profit margin |
|
$ |
46,348 |
|
|
$ |
54,630 |
|
|
$ |
198,812 |
|
|
$ |
214,233 |
|
| Operating loss |
|
$ |
(335,594 |
) |
|
$ |
(28,044 |
) |
|
$ |
(414,303 |
) |
|
$ |
(117,019 |
) |
| Net loss attributable to 3D Systems Corporation |
|
$ |
(300,412 |
) |
|
$ |
(25,553 |
) |
|
$ |
(370,432 |
) |
|
$ |
(122,711 |
) |
| Diluted loss per share |
|
$ |
(2.30 |
) |
|
$ |
(0.20 |
) |
|
$ |
(2.85 |
) |
|
$ |
(0.96 |
) |
| Non-GAAP measures for year-over-year
comparisons (1) |
|
|
|
|
|
|
|
|
|
|
|
|
|
| Non-GAAP gross profit margin |
|
|
41.9 |
% |
|
|
40.9 |
% |
|
|
41.1 |
% |
|
|
39.8 |
% |
| Adjusted EBITDA |
|
$ |
(12,260 |
) |
|
$ |
(4,808 |
) |
|
$ |
(24,525 |
) |
|
$ |
(5,781 |
) |
| Non-GAAP diluted loss per share |
|
$ |
(0.11 |
) |
|
$ |
(0.06 |
) |
|
$ |
(0.26 |
) |
|
$ |
(0.23 |
) |
| (1) |
See “Presentation of Information in this Press Release” below for a description, and the
Appendix for the reconciliation of non-GAAP measurements to the most closely comparable GAAP measure. |
Summary Comments on Results
Commenting on 2023 results
and the outlook for 2024, Dr. Jeffrey Graves, president and CEO of 3D Systems said, “Our fourth quarter revenue results reflect the significant headwinds created by ongoing macroeconomic and geopolitical volatility. As we exited the third
quarter, we had expected some of these broader pressures to moderate through year-end, as historical seasonality of increased consumption and year-end customer capex
spending would typically translate to an acceleration of revenues in the fourth quarter. While customer-driven pre-sales activities did accelerate as expected in the quarter, the same cannot be said for
revenue. Fortunately, based upon customer feedback, we view this as a market timing issue rather than any permanent trend in customer adoption rates for additive manufacturing, or a loss of market share for 3D Systems.”
“Reflecting on 2023 in its entirety, the most influential driver to our revenue performance was our dental orthodontic product line, with revenues
declining 39% from 2022 levels and essentially cut in half from their peak in 2021. However, adding to the pressure from this market was a sluggishness broadly in capex spending on new production capacity by both our Healthcare and Industrial
customers. These combined effects resulted in a significant revenue headwind for 2023. In response to this softness, we’ve undertaken a comprehensive restructuring initiative to reduce costs, improve margins through greater efficiencies, and
keep the company solidly on a path for sustained profitability and positive operating cash flow. The rise in gross margins, even in the face of declining volumes in 2023, is an early indicator of these efficiency improvements, which we expect to
continue throughout 2024.”
“It is important to note that we are different from others in the additive manufacturing industry in that we
have the broadest range of technology platforms, which we bring to market through two focused business units, Healthcare and Industrial Solutions. These platforms span metals, polymers and biologics, and, by necessity, require deep expertise in
hardware, software and materials development. This technology foundation, in which we have been heavily investing for the last two years, along with industry-leading
operational scale and an outstanding global reach, give us an ability to continue taking cost out of our business while preserving the critical investments needed to support the exciting growth
opportunities we see ahead. Our goal is to balance short-term profitability and cash performance in 2024, with the need to ensure continuity in essential R&D investments for growth. This balance is critical for two reasons. First, risks remain
in the world economic outlook, which could continue to impact sales in the short term. However, offsetting this pressure are a number of very targeted key-customer applications we expect to bring to market
over the next 12-18 months. Fortunately, to execute these restructuring and investment plans, we have a strong balance sheet with over $300 million in cash, and 0% interest debt that is not due until late
2026. This gives us an ability to thoughtfully restructure the business to drive profitability and cash performance, while supporting key customer-driven development programs that we believe will add meaningfully to our top line revenues in the
years ahead.”
Dr. Graves concluded, “Given the continuing risks we see to the world economy, we expect moderating but continued sales
pressures, which we are translating into relatively flat top line revenue expectations for the year. Given this, we will prioritize completion of our previously announced restructuring program, which includes headcount reductions, significant site
consolidations and a reduction in external spending. We believe these efforts, which will largely be completed by mid-year, will favorably impact both COGS and OPEX, further improve gross margins, and deliver
positive adjusted-EBITDA performance and operating cash flow for the full year. In parallel, we will continue our most important development programs that are now, after over two years of increased R&D investment, beginning to yield exciting
results. We expect these new additive solutions to materially change the way products are designed and manufactured and healthcare is delivered. We believe the path forward is very clear. In the short term, we will manage our costs to deliver
improving margins and cash performance in the face of economic uncertainty. As these clouds then lift, the opportunities for growth in our industry remain incredibly bright. We believe that this focus on our strategic initiatives will harmonize the
ability to deliver sustainable profitability this year, while preserving the exceptional opportunities we have to deliver long-term shareholder value in the years ahead.”
Summary of Fourth Quarter Results (Unaudited)
Revenue for the fourth quarter of 2023 decreased 13.5% to $114,848 compared to the same period last year, and revenue on a constant currency basis decreased
14.7%. The decline of revenue primarily reflects lower sales to certain dental orthodontic market customers and lower printer sales more broadly throughout the remaining portfolio due to macroeconomic factors that are negatively impacting demand.
Healthcare Solutions revenue decreased 15.7% to $51,188 compared to the prior year period, and revenue on a constant currency basis decreased 16.4% year
over year.
Industrial Solutions revenue decreased 11.6% to $63,660 compared to the prior year period, and revenue on a constant currency basis decreased
13.3% year over year.
Gross profit margin for the fourth quarter of 2023 was 40.4% compared to 41.2% in the same period last year. Non-GAAP gross profit margin was 41.9% compared to 40.9% in the same period last year and increased primarily due to favorable mix.
Net loss attributable to 3D Systems Corporation increased by $274,859 to a loss of $300,412 in the fourth quarter of 2023 compared to the same period in the
prior year. The increase in net loss attributable to 3D Systems Corporation primarily reflects $297,689 related to the impairment of goodwill and other intangible assets.
Adjusted EBITDA decreased by $7,452 to a loss of $12,260 in the fourth quarter of 2023 compared to the same period last year primarily driven by lower revenue
and an increase in operating expenses associated with investments in Regenerative Medicine and an increase in short-term consulting and outside services expenses.
Summary of Full-Year 2023 Results (Unaudited)
Revenue
for 2023 of $488,069 decreased 9.3% compared to the prior year. Revenue on a constant currency basis decreased 9.6%. The decline in revenue primarily reflects lower sales to certain dental orthodontic market customers due to macroeconomic factors
that are negatively impacting demand.
Healthcare Solutions revenue decreased 18.3% to $213,216, compared to the prior year, and revenue on a constant
currency basis decreased 18.6% year over year.
Industrial Solutions revenue decreased 0.8% to $274,853 compared to the prior year, and revenue on a
constant currency basis decreased 1.1% year over year.
Gross profit margin for the full year 2023 was 40.7% compared to 39.8% in the prior year. Non-GAAP gross profit margin was 41.1% for the full year 2023 compared to 39.8% in the prior year. Gross profit margin increased primarily driven by improved operational efficiencies and favorable mix.
Net loss attributable to 3D Systems Corporation for the full year 2023 increased by $247,721 to a loss of $370,432 compared to the prior year. The increase in
net loss attributable to 3D Systems Corporation primarily reflects an impairment of goodwill and other intangible assets, lower revenue and an increase in operating expenses associated with investments in our Regenerative Medicine business and an
increase in consulting and outside services expenses.
Adjusted EBITDA decreased by $18,744 to a loss of $24,525 in 2023 compared to last year primarily
driven by the unfavorable impact of lower volumes from dental orthodontics markets and an increase in operating expenses associated with investments in Regenerative Medicine and an increase in consulting and outside services expenses.
2024 Outlook
The company is providing full-year 2024 financial guidance as follows:
|
|
|
| Revenue: |
|
$475 - $505 million |
| Non-GAAP Gross Profit Margin: |
|
42% - 44% |
| Non-GAAP Operating Expense: |
|
$223 - $238 million |
| Adjusted EBITDA: |
|
Break even or better |
Financial Liquidity (Unaudited)
At December 31, 2023, cash and cash equivalents and short-term investments totaled $331,525 and decreased $237,212 since December 31, 2022. This
decrease resulted primarily from the repurchase of our Convertible Notes of $100,614, cash used in operations of $80,671, acquisitions and other investments, net of cash acquired, of $29,152, capital expenditures of $27,183, and taxes paid related
to net-share settlement of equity awards of $5,211, offset by a $3,492 effect of exchange rate changes on cash, cash equivalents and restricted cash. At December 31, 2023, the company had total debt, net
of deferred financing costs of $319,356.
Status of Audit; Delayed Form 10-K Filing
The unaudited financial data above remains subject to audit as the company continues its close process. Accordingly, actual results may differ from the
anticipated results shown above.
3D Systems will delay the filing of its Annual Report on Form 10-K for the
fiscal year ended December 31, 2023 and file a Form 12b-25, Notification of Late Filing, with the Securities and Exchange Commission, which extends the deadline to file the Form 10-K. The delay in filing is primarily due to additional time required by the company to complete its financial reporting close procedures. It has no impact on the company’s operations or on its ability to
discuss its anticipated 2023 results and 2024 outlook.
Q4 and FY 2023 Conference Call and Webcast
The company will host a conference call and simultaneous webcast to discuss these results on February 28, 2024, which may be accessed as follows:
Date: Wednesday, February 28, 2024
Time: 8:30 a.m. Eastern
Time
Listen via webcast: www.3dsystems.com/investor
Participate via telephone: 201-689-8345
A replay of the webcast will be available approximately two hours after the live presentation at
www.3dsystems.com/investor.
Forward-Looking Statements
Certain statements made in this release that are not statements of historical or current facts are forward-looking statements within the meaning of the Private
Securities Litigation Reform Act of 1995. Forward-looking statements involve known and unknown risks, uncertainties and other factors that may cause the actual results, performance or achievements of the company to be materially different from
historical results or from any future results or projections expressed or implied by such forward-looking statements. In many cases, forward looking statements can be identified by terms such as “believes,” “belief,”
“expects,” “may,” “will,” “estimates,” “intends,” “anticipates” or “plans” or the negative of these terms or other comparable terminology. Forward-looking statements are based
upon management’s beliefs, assumptions and current expectations and may include comments as to the company’s beliefs and expectations as to future events and trends affecting its business and are necessarily subject to uncertainties, many
of which are outside the control of the company. The factors described under the headings “Forward-Looking Statements” and “Risk Factors” in the company’s periodic filings with the Securities and Exchange Commission, as well
as other factors, could cause actual results to differ materially from those reflected or predicted in forward-looking statements. Although management believes that the expectations reflected in the forward-looking statements are reasonable,
forward-looking statements are not, and should not be relied upon as a guarantee of future performance or results, nor will they necessarily prove to be accurate indications of the times at which such performance or results will be achieved. The
forward-looking statements included are made only as the date of the statement. 3D Systems undertakes no obligation to update or revise any forward-looking statements made by management or on its behalf, whether as a result of future developments,
subsequent events or circumstances or otherwise, except as required by law.
Presentation of Information in this Press Release
3D Systems reports its financial results in accordance with GAAP. Management also reviews and reports certain non-GAAP
measures, including: non-GAAP gross profit, non-GAAP gross profit margin, non-GAAP diluted income (loss) per share, and Adjusted
EBITDA. These non-GAAP measures exclude certain items that management does not view as part of 3D Systems’ core results as they may be highly variable, may be unusual or infrequent, are difficult to
predict and can distort underlying business trends and results. Management believes that the non-GAAP measures provide useful additional insight into underlying business trends and results and provide
meaningful information regarding the comparison of period-over-period results. Additionally, management uses the non-GAAP measures for planning, forecasting and evaluating business and financial performance,
including allocating resources and evaluating results relative to employee compensation targets. 3D Systems’ non-GAAP measures are not calculated in accordance with or as required by GAAP and may not be
calculated in the same manner as similarly titled measures used by other companies. These non-GAAP measures should thus be considered as supplemental in nature and not considered in isolation or as a
substitute for the related financial information prepared in accordance with GAAP.
To calculate the non-GAAP measures, 3D Systems excludes the impact
of the following items:
| |
• |
|
amortization of intangible assets, a non-cash expense, as 3D
Systems’ intangible assets were primarily acquired in connection with business combinations; |
| |
• |
|
costs incurred in connection with acquisitions and divestitures, such as legal, consulting and advisory fees;
|
| |
• |
|
stock-based compensation expenses, a non-cash expense;
|
| |
• |
|
charges related to restructuring and cost optimization plans, impairment charges, including goodwill, and
divestiture gains or losses; |
| |
• |
|
certain compensation expense related to the 2021 Volumetric acquisition; and |
| |
• |
|
costs, including legal fees, related to significant or unusual litigation matters. |
Amortization of intangibles and acquisition and divestiture-related costs are excluded from non-GAAP measures as the
timing and magnitude of business combination transactions are not predictable, can vary significantly from period to period and the purchase price allocated to amortizable intangible assets and the related amortization period are unique to each
acquisition. Amortization of intangible assets will recur in future periods until such intangible assets have been fully amortized. While intangible assets contribute to the company’s revenue generation, the amortization of intangible assets
does not directly relate to the sale of the company’s products or services. Additionally, intangible assets amortization expense typically fluctuates based on the size and timing of the company’s acquisition activity. Accordingly, the
company believes excluding the amortization of intangible assets enhances the company’s and investors’ ability to compare the company’s past financial performance with its current performance and to analyze underlying business
performance and trends. Although stock-based compensation is a key incentive offered to certain of our employees, the expense is non-cash in nature, and we continue to evaluate our business performance
excluding stock-based compensation; therefore, it is excluded from non-GAAP measures. Stock-based compensation expenses will recur in future periods. Charges related to restructuring and cost optimization
plans, impairment charges, including goodwill, divestiture gains or losses, and the costs, including legal fees, related to significant or unusual litigation matters are excluded from non-GAAP measures as the
frequency and magnitude of these activities may vary widely from period to period. Additionally, impairment charges, including goodwill, are non-cash. Furthermore, the company believes the costs, including
legal fees, related to significant or unusual litigation matters are not indicative of our core business’ operations. Finally, 3D Systems excludes contingent consideration recorded as compensation expense related to the 2021 Volumetric
acquisition from non-GAAP measures as management evaluates financial performance excluding this expense, which is viewed by management as similar to acquisition consideration.
The matters discussed above are tax effected, as applicable, in calculating non-GAAP diluted income (loss) per share.
Adjusted EBITDA, defined as net income, plus income tax (provision) benefit, interest and other income (expense), net, stock-based compensation expense,
amortization of intangible assets, depreciation expense, and other non-GAAP adjustments, all as described above, is used by management to evaluate performance and helps measure financial performance
period-over-period.
A reconciliation of GAAP to non-GAAP financial measures is provided in the accompanying
schedules.
3D Systems does not provide forward-looking guidance for certain measures on a GAAP basis. The company is unable to provide a quantitative
reconciliation of forward-looking non-GAAP gross profit margin, Adjusted EBITDA, and non-GAAP operating expense to the most directly comparable forward-looking GAAP
measures without unreasonable effort because certain items, including litigation costs, acquisition expenses, stock-based compensation expense, intangible assets amortization expense, restructuring expenses, and goodwill impairment charges are
difficult to predict and estimate. These items are inherently uncertain and depend on various factors, many of which are beyond the company’s control, and as such, any associated estimate and its impact on GAAP performance could vary
materially.
About 3D Systems
More than 35 years ago, 3D Systems brought the innovation of 3D printing to the manufacturing industry. Today, as the leading additive manufacturing solutions
partner, we bring innovation, performance, and reliability to every interaction—empowering our customers to create products and business models never before possible. Thanks to our unique offering of hardware, software, materials and services,
each application-specific solution is powered by the expertise of our application engineers who collaborate with customers to transform how they deliver their products and services. 3D Systems’ solutions address a variety of advanced
applications in Healthcare and Industrial Solutions markets such as medical and dental, aerospace & defense, automotive and durable goods. More information on the company is available at www.3dsystems.com
Tables Follow
3D Systems Corporation
Unaudited Consolidated Balance Sheets
December 31, 2023 and December 31, 2022
|
|
|
|
|
|
|
|
|
| (in thousands, except par value) |
|
December 31,
2023 |
|
|
December 31,
2022 |
|
| ASSETS |
|
|
|
|
|
|
|
|
| Current assets: |
|
|
|
|
|
|
|
|
| Cash and cash equivalents |
|
$ |
331,525 |
|
|
$ |
388,134 |
|
| Short-term investments |
|
|
— |
|
|
|
180,603 |
|
| Accounts receivable, net of reserves — $3,389 and $3,114 |
|
|
102,104 |
|
|
|
93,886 |
|
| Inventories |
|
|
152,412 |
|
|
|
137,832 |
|
| Prepaid expenses and other current assets |
|
|
36,701 |
|
|
|
33,790 |
|
|
|
|
|
|
|
|
|
|
| Total current assets |
|
|
622,742 |
|
|
|
834,245 |
|
| Property and equipment, net |
|
|
64,461 |
|
|
|
58,072 |
|
| Intangible assets, net |
|
|
62,724 |
|
|
|
90,230 |
|
| Goodwill |
|
|
107,200 |
|
|
|
385,312 |
|
| Operating lease
right-of-use assets |
|
|
58,406 |
|
|
|
39,502 |
|
| Finance lease
right-of-use assets |
|
|
12,174 |
|
|
|
3,244 |
|
| Long-term deferred income tax assets |
|
|
4,230 |
|
|
|
7,038 |
|
| Other assets |
|
|
48,251 |
|
|
|
28,970 |
|
|
|
|
|
|
|
|
|
|
| Total assets |
|
$ |
980,188 |
|
|
$ |
1,446,613 |
|
|
|
|
|
|
|
|
|
|
| LIABILITIES, REDEEMABLE NON-CONTROLLING INTEREST AND
EQUITY |
|
|
|
|
|
|
|
|
| Current liabilities: |
|
|
|
|
|
|
|
|
| Current operating lease liabilities |
|
$ |
9,924 |
|
|
$ |
8,343 |
|
| Accounts payable |
|
|
49,757 |
|
|
|
53,826 |
|
| Accrued and other liabilities |
|
|
46,631 |
|
|
|
56,264 |
|
| Customer deposits |
|
|
8,206 |
|
|
|
6,911 |
|
| Deferred revenue |
|
|
30,448 |
|
|
|
26,464 |
|
|
|
|
|
|
|
|
|
|
| Total current liabilities |
|
|
144,966 |
|
|
|
151,808 |
|
| Long-term debt, net of deferred financing costs |
|
|
319,356 |
|
|
|
449,510 |
|
| Long-term operating lease liabilities |
|
|
56,795 |
|
|
|
38,499 |
|
| Long-term deferred income tax liabilities |
|
|
5,162 |
|
|
|
7,631 |
|
| Other liabilities |
|
|
33,399 |
|
|
|
47,461 |
|
|
|
|
|
|
|
|
|
|
| Total liabilities |
|
|
559,678 |
|
|
|
694,909 |
|
| Commitments and contingencies (Note 23) |
|
|
|
|
|
|
|
|
| Redeemable non-controlling interest |
|
|
2,006 |
|
|
|
1,760 |
|
| Stockholders’ equity: |
|
|
|
|
|
|
|
|
| Common stock, $0.001 par value, authorized 220,000 shares; shares issued 133,619 and 131,207 as of
December 31, 2023 and 2022, respectively |
|
|
134 |
|
|
|
131 |
|
| Additional paid-in capital |
|
|
1,577,382 |
|
|
|
1,547,597 |
|
| Accumulated deficit |
|
|
(1,114,394 |
) |
|
|
(743,962 |
) |
| Accumulated other comprehensive loss |
|
|
(44,618 |
) |
|
|
(53,822 |
) |
|
|
|
|
|
|
|
|
|
| Total stockholders’ equity |
|
|
418,504 |
|
|
|
749,944 |
|
|
|
|
|
|
|
|
|
|
| Total liabilities, redeemable non-controlling interest and
stockholders’ equity |
|
$ |
980,188 |
|
|
$ |
1,446,613 |
|
|
|
|
|
|
|
|
|
|
3D Systems Corporation
Unaudited Consolidated Statements of Operations
Year Ended December 31, 2023, 2022 and 2021
|
|
|
|
|
|
|
|
|
|
|
|
|
| |
|
Year Ended December 31, |
|
| (in thousands, except per share amounts) |
|
2023 |
|
|
2022 |
|
|
2021 |
|
| Revenue: |
|
|
|
|
|
|
|
|
|
|
|
|
| Products |
|
$ |
328,731 |
|
|
$ |
395,396 |
|
|
$ |
428,742 |
|
| Services |
|
|
159,338 |
|
|
|
142,635 |
|
|
|
186,897 |
|
|
|
|
|
|
|
|
|
|
|
|
|
|
| Total revenue |
|
|
488,069 |
|
|
|
538,031 |
|
|
|
615,639 |
|
| Cost of sales: |
|
|
|
|
|
|
|
|
|
|
|
|
| Products |
|
|
200,616 |
|
|
|
237,386 |
|
|
|
245,169 |
|
| Services |
|
|
88,641 |
|
|
|
86,412 |
|
|
|
106,692 |
|
|
|
|
|
|
|
|
|
|
|
|
|
|
| Total cost of sales |
|
|
289,257 |
|
|
|
323,798 |
|
|
|
351,861 |
|
|
|
|
|
|
|
|
|
|
|
|
|
|
| Gross profit |
|
|
198,812 |
|
|
|
214,233 |
|
|
|
263,778 |
|
| Operating expenses: |
|
|
|
|
|
|
|
|
|
|
|
|
| Selling, general and administrative |
|
|
212,101 |
|
|
|
244,181 |
|
|
|
227,697 |
|
| Research and development |
|
|
89,728 |
|
|
|
87,071 |
|
|
|
69,150 |
|
| Impairments of goodwill and intangible assets |
|
|
311,286 |
|
|
|
— |
|
|
|
— |
|
|
|
|
|
|
|
|
|
|
|
|
|
|
| Total operating expenses |
|
|
613,115 |
|
|
|
331,252 |
|
|
|
296,847 |
|
| Loss from operations |
|
|
(414,303 |
) |
|
|
(117,019 |
) |
|
|
(33,069 |
) |
| Interest and other income (expense), net |
|
|
44,362 |
|
|
|
(3,790 |
) |
|
|
352,609 |
|
|
|
|
|
|
|
|
|
|
|
|
|
|
| (Loss) income before income taxes |
|
|
(369,941 |
) |
|
|
(120,809 |
) |
|
|
319,540 |
|
| Benefit (provision) for income taxes |
|
|
526 |
|
|
|
(2,140 |
) |
|
|
2,512 |
|
| Loss on equity method investment, net of income taxes |
|
|
(1,282 |
) |
|
|
— |
|
|
|
— |
|
|
|
|
|
|
|
|
|
|
|
|
|
|
| Net (loss) income before redeemable non-controlling
interest |
|
|
(370,697 |
) |
|
|
(122,949 |
) |
|
|
322,052 |
|
| Less: net loss attributable to redeemable non-controlling
interest |
|
|
(265 |
) |
|
|
(238 |
) |
|
|
— |
|
|
|
|
|
|
|
|
|
|
|
|
|
|
| Net (loss) income attributable to 3D Systems Corporation |
|
$ |
(370,432 |
) |
|
$ |
(122,711 |
) |
|
$ |
322,052 |
|
|
|
|
|
|
|
|
|
|
|
|
|
|
| Net (loss) income per common share |
|
|
|
|
|
|
|
|
|
|
|
|
| Basic |
|
$ |
(2.85 |
) |
|
$ |
(0.96 |
) |
|
$ |
2.62 |
|
|
|
|
|
|
|
|
|
|
|
|
|
|
| Diluted |
|
$ |
(2.85 |
) |
|
$ |
(0.96 |
) |
|
$ |
2.55 |
|
|
|
|
|
|
|
|
|
|
|
|
|
|
| Weighted average shares outstanding: |
|
|
|
|
|
|
|
|
|
|
|
|
| Basic |
|
|
129,944 |
|
|
|
127,818 |
|
|
|
122,867 |
|
|
|
|
|
|
|
|
|
|
|
|
|
|
| Diluted |
|
|
129,944 |
|
|
|
127,818 |
|
|
|
126,334 |
|
|
|
|
|
|
|
|
|
|
|
|
|
|
3D Systems Corporation
Unaudited Consolidated Statements of Operations
Three Months Ended December 31, 2023, 2022 and 2021
|
|
|
|
|
|
|
|
|
|
|
|
|
| |
|
Three Months Ended December 31, |
|
| (in thousands, except per share amounts) |
|
2023 |
|
|
2022 |
|
|
2021 |
|
| Revenue: |
|
|
|
|
|
|
|
|
|
|
|
|
| Products |
|
$ |
74,763 |
|
|
$ |
94,734 |
|
|
$ |
117,572 |
|
| Services |
|
|
40,085 |
|
|
|
37,998 |
|
|
|
33,298 |
|
|
|
|
|
|
|
|
|
|
|
|
|
|
| Total revenue |
|
|
114,848 |
|
|
|
132,732 |
|
|
|
150,870 |
|
| Cost of sales: |
|
|
|
|
|
|
|
|
|
|
|
|
| Products |
|
|
47,174 |
|
|
|
55,541 |
|
|
|
64,918 |
|
| Services |
|
|
21,326 |
|
|
|
22,561 |
|
|
|
19,734 |
|
|
|
|
|
|
|
|
|
|
|
|
|
|
| Total cost of sales |
|
|
68,500 |
|
|
|
78,102 |
|
|
|
84,652 |
|
|
|
|
|
|
|
|
|
|
|
|
|
|
| Gross profit |
|
|
46,348 |
|
|
|
54,630 |
|
|
|
66,218 |
|
| Operating expenses: |
|
|
|
|
|
|
|
|
|
|
|
|
| Selling, general and administrative |
|
|
61,478 |
|
|
|
58,783 |
|
|
|
50,897 |
|
| Research and development |
|
|
22,775 |
|
|
|
23,891 |
|
|
|
19,163 |
|
| Impairments of goodwill and intangible assets |
|
|
297,689 |
|
|
|
— |
|
|
|
— |
|
|
|
|
|
|
|
|
|
|
|
|
|
|
| Total operating expenses |
|
|
381,942 |
|
|
|
82,674 |
|
|
|
70,060 |
|
| Loss from operations |
|
|
(335,594 |
) |
|
|
(28,044 |
) |
|
|
(3,842 |
) |
| Interest and other income (expense), net |
|
|
34,671 |
|
|
|
1,666 |
|
|
|
(1,787 |
) |
|
|
|
|
|
|
|
|
|
|
|
|
|
| Loss before income taxes |
|
|
(300,923 |
) |
|
|
(26,378 |
) |
|
|
(5,629 |
) |
| Benefit (provision) for income taxes |
|
|
930 |
|
|
|
771 |
|
|
|
(571 |
) |
| Loss on equity method investment, net of income taxes |
|
|
(535 |
) |
|
|
— |
|
|
|
— |
|
|
|
|
|
|
|
|
|
|
|
|
|
|
| Net loss before redeemable non-controlling
interest |
|
|
(300,528 |
) |
|
|
(25,607 |
) |
|
|
(6,200 |
) |
| Less: net loss attributable to redeemable non-controlling
interest |
|
|
(116 |
) |
|
|
(54 |
) |
|
|
— |
|
|
|
|
|
|
|
|
|
|
|
|
|
|
| Net loss attributable to 3D Systems Corporation |
|
$ |
(300,412 |
) |
|
$ |
(25,553 |
) |
|
$ |
(6,200 |
) |
|
|
|
|
|
|
|
|
|
|
|
|
|
| Net loss per share available to 3D Systems Corporation common stockholders |
|
|
|
|
|
|
|
|
|
|
|
|
| Basic |
|
$ |
(2.30 |
) |
|
$ |
(0.20 |
) |
|
$ |
(0.05 |
) |
|
|
|
|
|
|
|
|
|
|
|
|
|
| Diluted |
|
$ |
(2.30 |
) |
|
$ |
(0.20 |
) |
|
$ |
(0.05 |
) |
|
|
|
|
|
|
|
|
|
|
|
|
|
3D Systems Corporation
Unaudited Consolidated Statements of Cash Flows
|
|
|
|
|
|
|
|
|
|
|
|
|
| |
|
Year Ended
December 31, |
|
| (in thousands) |
|
2023 |
|
|
2022 |
|
|
2021 |
|
| Cash flows from operating activities: |
|
|
|
|
|
|
|
|
|
|
|
|
| Net (loss) income before redeemable non-controlling
interest |
|
$ |
(370,697 |
) |
|
$ |
(122,949 |
) |
|
$ |
322,052 |
|
| Adjustments to reconcile net (loss) income to net cash (used in) provided by operating
activities: |
|
|
|
|
|
|
|
|
|
|
|
|
| Depreciation, amortization and accretion of debt discount |
|
|
36,053 |
|
|
|
38,686 |
|
|
|
34,623 |
|
| Stock-based compensation |
|
|
23,367 |
|
|
|
42,415 |
|
|
|
55,153 |
|
| Loss on short-term investments |
|
|
6 |
|
|
|
3,146 |
|
|
|
— |
|
| Non-cash operating lease expense |
|
|
9,267 |
|
|
|
6,366 |
|
|
|
5,681 |
|
| Provision for inventory obsolescence and revaluation |
|
|
6,350 |
|
|
|
2,586 |
|
|
|
(2,909 |
) |
| Loss on hedge accounting de-designation and
termination |
|
|
— |
|
|
|
— |
|
|
|
721 |
|
| Provision for bad debts |
|
|
595 |
|
|
|
562 |
|
|
|
232 |
|
| Loss (gain) on the disposition of businesses, property, equipment and other assets |
|
|
6 |
|
|
|
104 |
|
|
|
(350,846 |
) |
| Gain on debt extinguishment |
|
|
(32,181 |
) |
|
|
— |
|
|
|
— |
|
| Provision for deferred income taxes and reserve adjustments |
|
|
(2,412 |
) |
|
|
(2,518 |
) |
|
|
(11,679 |
) |
| Loss on equity method investment |
|
|
1,282 |
|
|
|
— |
|
|
|
— |
|
| Impairments of assets |
|
|
313,204 |
|
|
|
4,095 |
|
|
|
1,676 |
|
| Changes in operating accounts: |
|
|
|
|
|
|
|
|
|
|
|
|
| Accounts receivable |
|
|
(6,793 |
) |
|
|
8,144 |
|
|
|
(11,912 |
) |
| Inventories |
|
|
(20,779 |
) |
|
|
(51,082 |
) |
|
|
7,866 |
|
| Prepaid expenses and other current assets |
|
|
(2,049 |
) |
|
|
8,229 |
|
|
|
(8,106 |
) |
| Accounts payable |
|
|
(5,526 |
) |
|
|
(3,787 |
) |
|
|
27,159 |
|
| Deferred revenue and customer deposits |
|
|
1,852 |
|
|
|
(6,947 |
) |
|
|
(3,325 |
) |
| Accrued and other liabilities |
|
|
(15,744 |
) |
|
|
10,702 |
|
|
|
(12,389 |
) |
| All other operating activities |
|
|
(16,472 |
) |
|
|
(7,773 |
) |
|
|
(5,850 |
) |
|
|
|
|
|
|
|
|
|
|
|
|
|
| Net cash (used in) provided by operating activities |
|
|
(80,671 |
) |
|
|
(70,021 |
) |
|
|
48,147 |
|
|
|
|
|
|
|
|
|
|
|
|
|
|
| Cash flows from investing activities: |
|
|
|
|
|
|
|
|
|
|
|
|
| Purchases of property and equipment |
|
|
(27,183 |
) |
|
|
(20,907 |
) |
|
|
(18,791 |
) |
| Purchases of short-term investments |
|
|
— |
|
|
|
(384,388 |
) |
|
|
— |
|
| Sales and maturities of short-term investments |
|
|
180,925 |
|
|
|
200,314 |
|
|
|
— |
|
| Proceeds from sale of assets and businesses, net of cash sold |
|
|
194 |
|
|
|
325 |
|
|
|
421,485 |
|
| Acquisitions and other investments, net of cash acquired |
|
|
(29,152 |
) |
|
|
(103,699 |
) |
|
|
(139,685 |
) |
| Other investing activities |
|
|
— |
|
|
|
— |
|
|
|
(2,454 |
) |
|
|
|
|
|
|
|
|
|
|
|
|
|
| Net cash provided by (used in) investing activities |
|
|
124,784 |
|
|
|
(308,355 |
) |
|
|
260,555 |
|
|
|
|
|
|
|
|
|
|
|
|
|
|
| Cash flows from financing activities: |
|
|
|
|
|
|
|
|
|
|
|
|
| Proceeds from borrowings |
|
|
— |
|
|
|
— |
|
|
|
460,000 |
|
| Debt issuance costs |
|
|
— |
|
|
|
— |
|
|
|
(13,466 |
) |
| Repayment of borrowings/long-term debt |
|
|
(100,614 |
) |
|
|
— |
|
|
|
(21,392 |
) |
| Purchase of non-controlling interests |
|
|
— |
|
|
|
(2,300 |
) |
|
|
(6,300 |
) |
| Taxes paid related to net-share settlement of equity
awards |
|
|
(5,211 |
) |
|
|
(10,864 |
) |
|
|
(12,619 |
) |
| Other financing activities |
|
|
(644 |
) |
|
|
(651 |
) |
|
|
(423 |
) |
|
|
|
|
|
|
|
|
|
|
|
|
|
| Net cash (used in) provided by financing activities |
|
|
(106,469 |
) |
|
|
(13,815 |
) |
|
|
405,800 |
|
|
|
|
|
|
|
|
|
|
|
|
|
|
| Effect of exchange rate changes on cash, cash equivalents and restricted cash |
|
|
3,492 |
|
|
|
(5,804 |
) |
|
|
(9,243 |
) |
|
|
|
|
|
|
|
|
|
|
|
|
|
| Net (decrease) increase in cash, cash equivalents and restricted cash |
|
|
(58,864 |
) |
|
|
(397,995 |
) |
|
|
705,259 |
|
|
|
|
|
|
|
|
|
|
|
|
|
|
| Cash, cash equivalents and restricted cash at the beginning of the year a |
|
|
391,975 |
|
|
|
789,970 |
|
|
|
84,711 |
|
|
|
|
|
|
|
|
|
|
|
|
|
|
| Cash, cash equivalents and restricted cash at the end of the year a |
|
$ |
333,111 |
|
|
$ |
391,975 |
|
|
$ |
789,970 |
|
|
|
|
|
|
|
|
|
|
|
|
|
|
| (a) |
The amounts for cash and cash equivalents shown above include restricted cash of $119, $114 and $313 as of
December 31, 2023, 2022 and 2021, respectively, which are included in prepaid expenses and other current assets. In addition, included in cash and cash equivalents above as of December 31, 2023 and 2022 is 1,467 and $3,727 of restricted
cash, which, is included in other non-current assets. |
| (b) |
Inventory is transferred to property and equipment at cost when we require additional machines for training or
demonstration or for placement into on demand manufacturing services locations |
Appendix
3D Systems Corporation
Unaudited Reconciliations of GAAP to Non-GAAP Measures
Three Months Ended December 31, 2023 and 2022.
Constant Currency Revenue (4)
|
|
|
|
|
|
|
|
|
|
|
|
|
|
|
|
|
|
|
|
|
|
|
|
|
| |
|
Three Months Ended December 31, |
|
|
Constant Currency (1) |
|
| (in thousands) |
|
2023 |
|
|
2022 |
|
|
$ Change |
|
|
% Change |
|
|
FX Effect (2) |
|
|
% Change (3) |
|
| Healthcare Solutions |
|
$ |
51,188 |
|
|
$ |
60,694 |
|
|
$ |
(9,506 |
) |
|
|
(15.7 |
)% |
|
$ |
454 |
|
|
|
(16.4 |
)% |
| Industrial Solutions |
|
|
63,660 |
|
|
|
72,038 |
|
|
|
(8,378 |
) |
|
|
(11.6 |
)% |
|
|
1,196 |
|
|
|
(13.3 |
)% |
|
|
|
|
|
|
|
|
|
|
|
|
|
|
|
|
|
|
|
|
|
|
|
|
|
| Total revenue |
|
$ |
114,848 |
|
|
$ |
132,732 |
|
|
$ |
(17,884 |
) |
|
|
(13.5 |
)% |
|
$ |
1,650 |
|
|
|
(14.7 |
)% |
|
|
|
|
|
|
|
|
|
|
|
|
|
|
|
|
|
|
|
|
|
|
|
|
|
| (1) |
To assist in the analysis of the Company’s revenue trends, the Company estimated the impact of foreign
exchange on year-over-year revenue growth by recasting revenue for the three months ended December 31, 2023 by applying the foreign exchange rates used to translate 2022 non-US functional currency revenue
to 2023 non-US functional currency revenue. |
| (2) |
Represents the estimated impact on “as reported” revenue due to changes in foreign currency exchange
rates |
| (3) |
Represents the % increase or decrease in revenue excluding the estimated “FX effect”
|
| (4) |
Amounts in table may not foot due to rounding |
|
|
|
|
|
|
|
|
|
|
|
|
|
|
|
|
|
|
|
|
|
|
|
|
|
| |
|
Year Ended December 31, |
|
|
Constant Currency (1) |
|
| (in thousands) |
|
2023 |
|
|
2022 |
|
|
$ Change |
|
|
% Change |
|
|
FX Effect (2) |
|
|
% Change (3) |
|
| Healthcare Solutions |
|
$ |
213,216 |
|
|
$ |
260,988 |
|
|
$ |
(47,772 |
) |
|
|
(18.3 |
)% |
|
$ |
817 |
|
|
|
(18.6 |
)% |
| Industrial Solutions |
|
|
274,853 |
|
|
|
277,043 |
|
|
|
(2,190 |
) |
|
|
(0.8 |
)% |
|
|
971 |
|
|
|
(1.1 |
)% |
|
|
|
|
|
|
|
|
|
|
|
|
|
|
|
|
|
|
|
|
|
|
|
|
|
| Total revenue |
|
$ |
488,069 |
|
|
$ |
538,031 |
|
|
$ |
(49,962 |
) |
|
|
(9.3 |
)% |
|
$ |
1,788 |
|
|
|
(9.6 |
)% |
|
|
|
|
|
|
|
|
|
|
|
|
|
|
|
|
|
|
|
|
|
|
|
|
|
| (1) |
To assist in the analysis of the Company’s revenue trends, the Company estimated the impact of foreign
exchange on year-over-year revenue growth by recasting revenue for the year ended December 31, 2023 by applying the foreign exchange rates used to translate 2022 non-US functional currency revenue to 2023
non-US functional currency revenue. |
| (2) |
Represents the estimated impact on “as reported” revenue due to changes in foreign currency exchange
rates |
| (3) |
Represents the % increase or decrease in revenue excluding the estimated “FX effect”
|
| (4) |
Amounts in table may not foot due to rounding |
Gross Profit and Gross Profit Margin (1)
|
|
|
|
|
|
|
|
|
|
|
|
|
|
|
|
|
| |
|
Three Months Ended December 31, |
|
| (in thousands) |
|
2023 |
|
|
2022 |
|
| |
|
Gross Profit |
|
|
Gross Profit
Margin (2) |
|
|
Gross Profit |
|
|
Gross Profit
Margin (2) |
|
| GAAP |
|
$ |
46,348 |
|
|
|
40.4 |
% |
|
$ |
54,630 |
|
|
|
41.2 |
% |
| Amortization expense included in Cost of sales |
|
|
382 |
|
|
|
|
|
|
|
(398 |
) |
|
|
|
|
| Restructuring expense included in Cost of sales |
|
|
1,427 |
|
|
|
|
|
|
|
— |
|
|
|
|
|
|
|
|
|
|
|
|
|
|
|
|
|
|
|
|
|
|
| Non-GAAP |
|
$ |
48,157 |
|
|
|
41.9 |
% |
|
$ |
54,232 |
|
|
|
40.9 |
% |
|
|
|
|
|
|
|
|
|
|
|
|
|
|
|
|
|
| (1) |
Amounts in table may not foot due to rounding |
| (2) |
Calculated as non-GAAP gross profit as a percentage of total revenue.
|
|
|
|
|
|
|
|
|
|
|
|
|
|
|
|
|
|
| |
|
Year Ended December 31, |
|
| (in thousands) |
|
2023 |
|
|
2022 |
|
| |
|
Gross Profit |
|
|
Gross Profit
Margin (2) |
|
|
Gross Profit |
|
|
Gross Profit
Margin (2) |
|
| GAAP |
|
$ |
198,812 |
|
|
|
40.7 |
% |
|
$ |
214,233 |
|
|
|
39.8 |
% |
| Amortization expense included in Cost of sales |
|
|
506 |
|
|
|
|
|
|
|
14 |
|
|
|
|
|
| Restructuring expense included in Cost of sales |
|
|
1,427 |
|
|
|
|
|
|
|
— |
|
|
|
|
|
|
|
|
|
|
|
|
|
|
|
|
|
|
|
|
|
|
| Non-GAAP |
|
$ |
200,745 |
|
|
|
41.1 |
% |
|
$ |
214,247 |
|
|
|
39.8 |
% |
|
|
|
|
|
|
|
|
|
|
|
|
|
|
|
|
|
| (1) |
Amounts in table may not foot due to rounding |
| (2) |
Calculated as non-GAAP gross profit as a percentage of total revenue.
|
Appendix
3D Systems Corporation
Unaudited Reconciliations of GAAP to Non-GAAP Measures
Three and Twelve Months Ended December 31, 2023 and 2022
Net Loss to Adjusted EBITDA (1)
|
|
|
|
|
|
|
|
|
|
|
|
|
|
|
|
|
| |
|
Three Months Ended December 31, |
|
|
Year Ended December 31, |
|
| (in thousands) |
|
2023 |
|
|
2022 |
|
|
2023 |
|
|
2022 |
|
| Net loss attributable to 3D Systems Corporation |
|
$ |
(300,412 |
) |
|
$ |
(25,553 |
) |
|
$ |
(370,432 |
) |
|
$ |
(122,711 |
) |
| Interest income, net |
|
|
(3,778 |
) |
|
|
(2,522 |
) |
|
|
(16,896 |
) |
|
|
(6,541 |
) |
| (Benefit) provision for income taxes |
|
|
(930 |
) |
|
|
(771 |
) |
|
|
(526 |
) |
|
|
2,140 |
|
| Depreciation expense |
|
|
5,656 |
|
|
|
5,104 |
|
|
|
21,346 |
|
|
|
21,096 |
|
| Amortization expense |
|
|
2,391 |
|
|
|
5,207 |
|
|
|
12,067 |
|
|
|
15,480 |
|
| Stock-based compensation expense |
|
|
8,224 |
|
|
|
10,980 |
|
|
|
23,367 |
|
|
|
42,489 |
|
| Acquisition and divestiture-related expense |
|
|
468 |
|
|
|
2,978 |
|
|
|
600 |
|
|
|
12,360 |
|
| Legal expense |
|
|
3,174 |
|
|
|
(1,418 |
) |
|
|
8,053 |
|
|
|
19,062 |
|
| Restructuring expense |
|
|
4,774 |
|
|
|
381 |
|
|
|
11,487 |
|
|
|
733 |
|
| Redeemable non-controlling interest |
|
|
(116 |
) |
|
|
(54 |
) |
|
|
(265 |
) |
|
|
(238 |
) |
| Loss (income) on equity method investment |
|
|
535 |
|
|
|
(90 |
) |
|
|
1,282 |
|
|
|
(90 |
) |
| Goodwill and other assets impairment charges |
|
|
298,647 |
|
|
|
3 |
|
|
|
312,858 |
|
|
|
18 |
|
| Gain on repurchase of debt |
|
|
(32,181 |
) |
|
|
— |
|
|
|
(32,181 |
) |
|
|
— |
|
| Other non-operating (income) expense |
|
|
1,288 |
|
|
|
947 |
|
|
|
4,715 |
|
|
|
10,421 |
|
|
|
|
|
|
|
|
|
|
|
|
|
|
|
|
|
|
| Adjusted EBITDA |
|
$ |
(12,260 |
) |
|
$ |
(4,808 |
) |
|
$ |
(24,525 |
) |
|
$ |
(5,781 |
) |
|
|
|
|
|
|
|
|
|
|
|
|
|
|
|
|
|
| (1) |
Amounts in table may not foot due to rounding |
Appendix
3D Systems Corporation
Unaudited Reconciliations of GAAP to Non-GAAP Measures
Three and Twelve Months Ended December 31, 2023 and 2022
Non-GAAP Diluted Loss per Share (1)(2)
|
|
|
|
|
|
|
|
|
|
|
|
|
|
|
|
|
| |
|
Three Months Ended December 31, |
|
|
Year Ended December 31, |
|
| (in dollars) |
|
2023 |
|
|
2022 |
|
|
2023 |
|
|
2022 |
|
| Diluted loss per share |
|
$ |
(2.30 |
) |
|
$ |
(0.20 |
) |
|
$ |
(2.85 |
) |
|
$ |
(0.96 |
) |
| Amortization expense |
|
|
0.02 |
|
|
|
0.04 |
|
|
|
0.09 |
|
|
|
0.12 |
|
| Stock-based compensation expense |
|
|
0.06 |
|
|
|
0.09 |
|
|
|
0.18 |
|
|
|
0.33 |
|
| Acquisition and divestiture-related expense |
|
|
— |
|
|
|
0.02 |
|
|
|
— |
|
|
|
0.10 |
|
| Legal expense |
|
|
0.02 |
|
|
|
(0.01 |
) |
|
|
0.06 |
|
|
|
0.17 |
|
| Restructuring expense |
|
|
0.04 |
|
|
|
— |
|
|
|
0.09 |
|
|
|
0.01 |
|
| Goodwill and other assets impairment charges |
|
|
2.30 |
|
|
|
— |
|
|
|
2.42 |
|
|
|
— |
|
| Gain on repurchase of debt |
|
|
(0.25 |
) |
|
|
— |
|
|
|
(0.25 |
) |
|
|
— |
|
|
|
|
|
|
|
|
|
|
|
|
|
|
|
|
|
|
| Non-GAAP diluted loss per share |
|
$ |
(0.11 |
) |
|
$ |
(0.06 |
) |
|
$ |
(0.26 |
) |
|
$ |
(0.23 |
) |
|
|
|
|
|
|
|
|
|
|
|
|
|
|
|
|
|
| (1) |
Amounts in table may not foot due to rounding |
| (2) |
Amounts in table are stated per share |
Exhibit 99.2 February 28, 2024 Fourth Quarter and Full Year 2023
Financial Results

Welcome and Participants Dr. Jeffrey Graves President & Chief
Executive Officer Jeffrey Creech Executive Vice President & Chief Financial Officer Andrew Johnson Executive Vice President, Chief Corporate Development Officer & Chief Legal Officer Mick McCloskey Vice President, Treasury & Investor
Relations To participate via phone, please dial: 1-201-689-8345 2
Forward Looking Statements Certain statements made in this presentation
that are not statements of historical or current facts are forward-looking statements within the meaning of the Private Securities Litigation Reform Act of 1995. Forward-looking statements involve known and unknown risks, uncertainties and other
factors that may cause the actual results, performance or achievements of the company to be materially different from historical results or from any future results or projections expressed or implied by such forward-looking statements. In many
cases, forward looking statements can be identified by terms such as “believes,” “belief,” “expects,” “may,” “will,” “estimates,” “intends,”
“anticipates” or “plans” or the negative of these terms or other comparable terminology. Forward-looking statements are based upon management’s beliefs, assumptions and current expectations and may include comments as
to the company’s beliefs and expectations as to future events and trends affecting its business and are necessarily subject to uncertainties, many of which are outside the control of the company. The factors described under the headings
“Forward-Looking Statements” and “Risk Factors” in the company’s periodic filings with the Securities and Exchange Commission, as well as other factors, could cause actual results to differ materially from those
reflected or predicted in forward-looking statements. Although management believes that the expectations reflected in the forward-looking statements are reasonable, forward-looking statements are not, and should not be relied upon as a guarantee of
future performance or results, nor will they necessarily prove to be accurate indications of the times at which such performance or results will be achieved. The forward- looking statements included are made only as the date of the statement. 3D
Systems undertakes no obligation to update or revise any forward-looking statements made by management or on its behalf, whether as a result of future developments, subsequent events or circumstances or otherwise, except as required by law Further,
we encourage you to review “Risk Factors” in Part 1 of our Annual Report on Form 10-K and Part II of our Quarterly Reports on Form 10-Q filed with the SEC as well as other information about us in our filings with the SEC. These are
available at www.SEC.gov. 3

Dr. Jeffrey Graves President & Chief Executive Officer 4
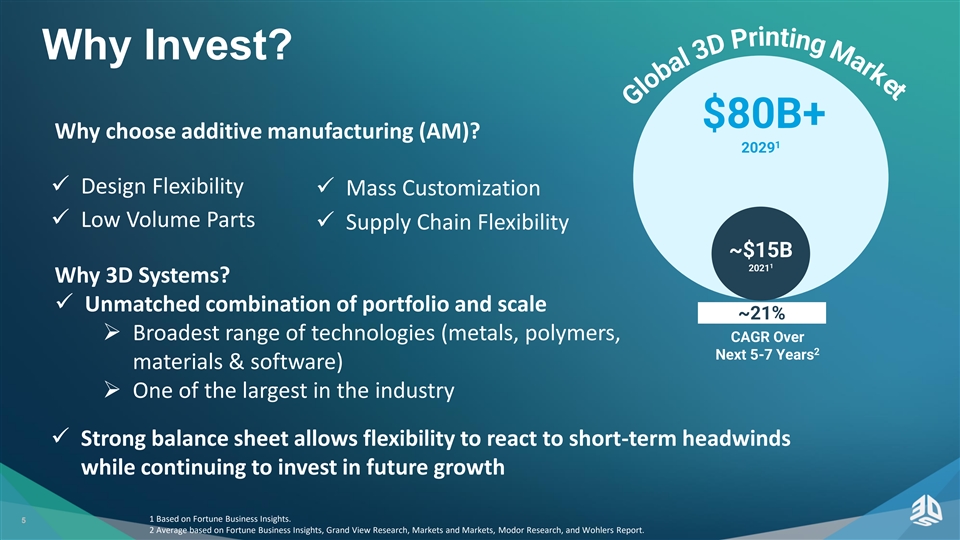
t e k r a M g n i t n Why Invest? $80B+ Why choose additive
manufacturing (AM)? 1 2029 ✓ Design Flexibility ✓ Mass Customization ✓ Low Volume Parts ✓ Supply Chain Flexibility ~$15B 1 2021 Why 3D Systems? ✓ Unmatched combination of portfolio and scale ~21% ➢ Broadest
range of technologies (metals, polymers, CAGR Over 2 Next 5-7 Years materials & software) ➢ One of the largest in the industry ✓ Strong balance sheet allows flexibility to react to short-term headwinds while continuing to invest in
future growth 5 1 Based on Fortune Business Insights. 2 Average based on Fortune Business Insights, Grand View Research, Markets and Markets, Modor Research, and Wohlers Report. i r P D 3 l a b o l G
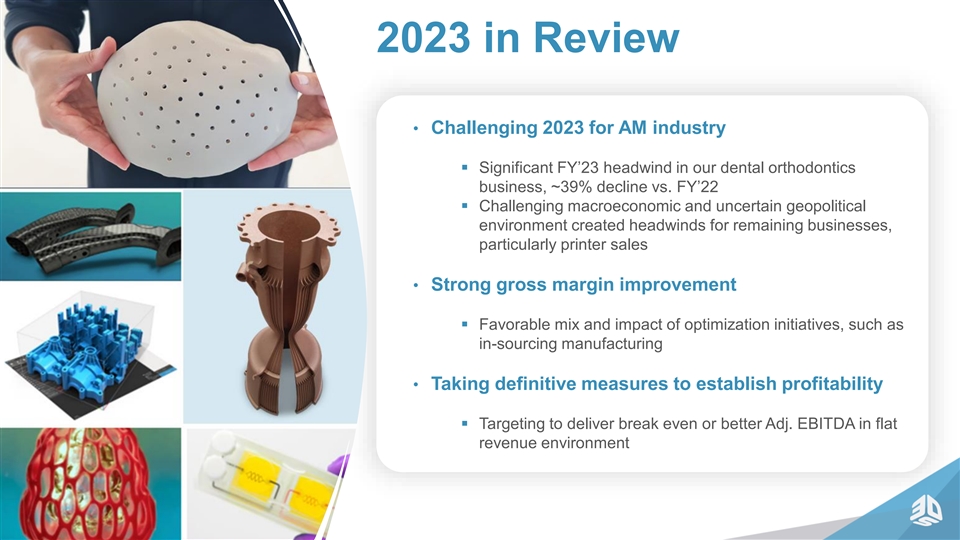
2023 in Review • Challenging 2023 for AM industry ▪
Significant FY’23 headwind in our dental orthodontics business, ~39% decline vs. FY’22 ▪ Challenging macroeconomic and uncertain geopolitical environment created headwinds for remaining businesses, particularly printer sales
• Strong gross margin improvement ▪ Favorable mix and impact of optimization initiatives, such as in-sourcing manufacturing • Taking definitive measures to establish profitability ▪ Targeting to deliver break even or better
Adj. EBITDA in flat revenue environment 6
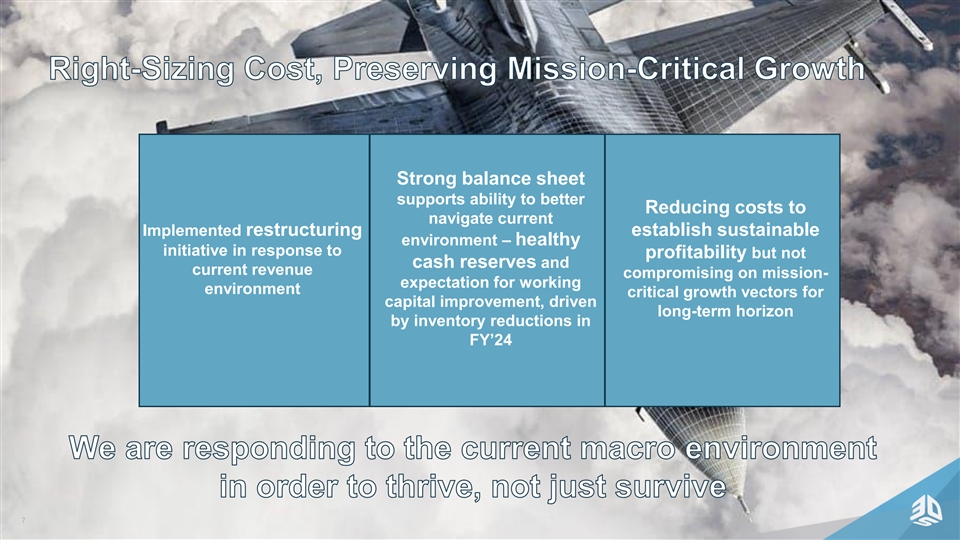
Right-Sizing Cost, Preserving Mission-Critical Growth Strong balance
sheet supports ability to better Reducing costs to navigate current Implemented restructuring establish sustainable environment – healthy initiative in response to profitability but not cash reserves and current revenue compromising on
mission- expectation for working environment critical growth vectors for capital improvement, driven long-term horizon by inventory reductions in FY’24 We are responding to the current macro environment in order to thrive, not just survive
7

End-to-End Solutions to Address Orthopedic Device Market Applications
throughout the human body CMF (Cranio-Maxillofacial) Spine Surgical Planning + Guides + Highest adoption of DMP 350 Implants technology for Titanium spine cages (~$2B) (~$10B) Targeted for Future Growth Hip & Knee Foot & Ankle DMP 350
Dual/Triple aggressively Surgical Planning + Guides + targeting Titanium, Cobalt Chrome Implants printing for large joints (~$4B) (~$20B) 8
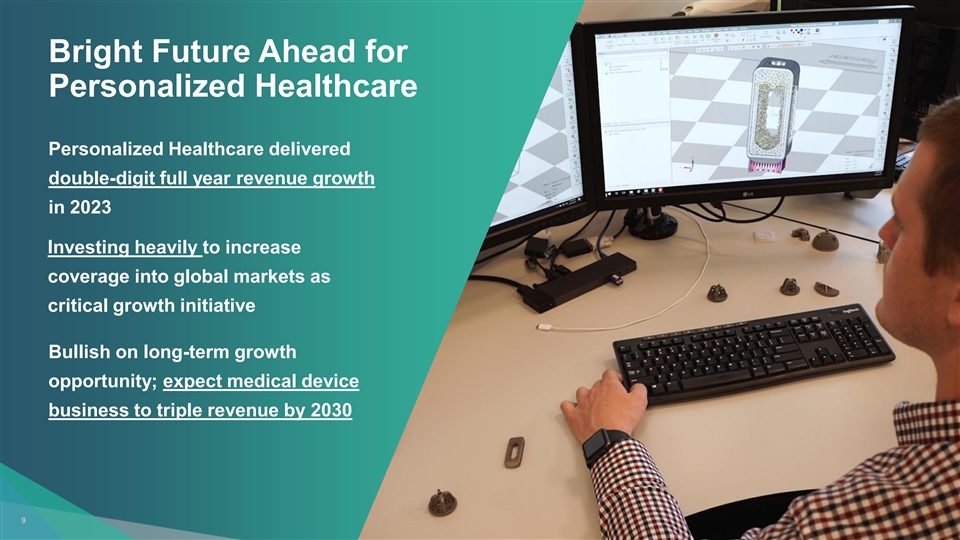
Bright Future Ahead for Option 2 (2 slides) – I prefer the two
slide Personalized Healthcare option. This image is very grainy. Where Personalized Healthcare delivered was this pulled from? double-digit full year revenue growth in 2023 Investing heavily to increase coverage into global markets as critical
growth initiative Bullish on long-term growth opportunity; expect medical device business to triple revenue by 2030 9

Jetted Dentures Two unique materials Industry First Solution Enable
production of superior monolithic dentures, combining beautiful aesthetics with outstanding performance, yielding a market-leading denture solution “The capabilities presented by the new jetted denture solution are unmatched in the industry.
The combination of 3D Distinctive break-resistance Systems’ high-speed printing technology and its unique materials Ensures long product life, meeting a critical patient requirement deliver dentures with superior durability and
aesthetics.” – Stephenie Goddard, CEO, Glidewell Expands addressable market New denture product family dramatically expands company’s addressable dental market, with denture demand estimated to exceed $2 billion by 2028
10

Industrial Metal Printing Innovation Semiconductor Capital Equipment,
Shipbuilding, Aerospace & Defense • AM generating greater momentum in semiconductors, shipbuilding, aerospace and defense • Lower technical barriers to entry with proven solutions for many materials and applications • Parts
consolidation enables accelerated time to market • Freedom of design facilitates improved performance • Continue to make important strides in helping to mitigate supply chain disruption 11
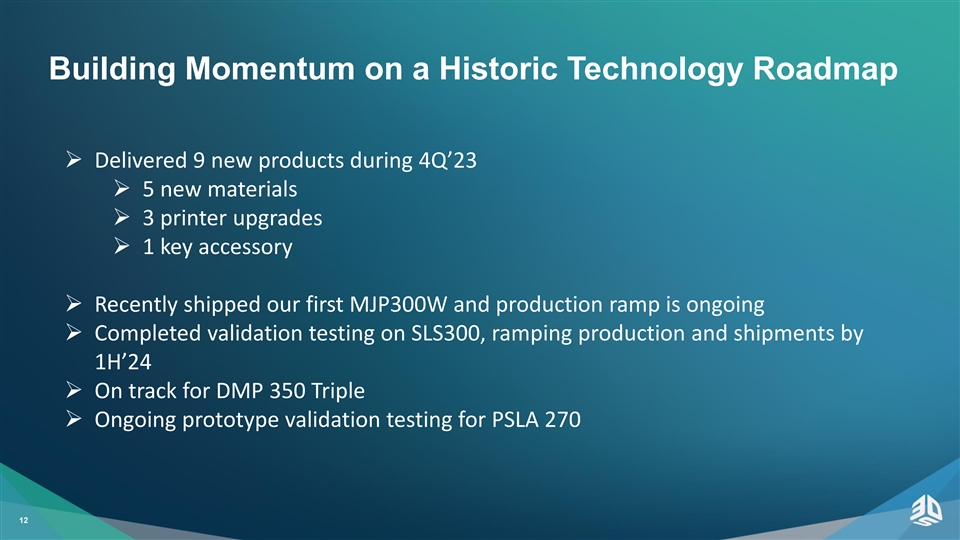
Building Momentum on a Historic Technology Roadmap ➢ Delivered 9
new products during 4Q’23 ➢ 5 new materials ➢ 3 printer upgrades ➢ 1 key accessory ➢ Recently shipped our first MJP300W and production ramp is ongoing ➢ Completed validation testing on SLS300, ramping
production and shipments by 1H’24 ➢ On track for DMP 350 Triple ➢ Ongoing prototype validation testing for PSLA 270 12

Regenerative Medicine Initiative Human Organs Regenerative Tissue
Program Drug Development Vascularized Breast Tissue Scaffold for Implantation & Cellularization Bioprinted “Organ-on-a-chip” Most Complex Object can accurately replicate organ-specific drug response in pre- Ever 3D Printed clinical
drug trials 3D printed human lung scaffold ✓ 2 Lobes ✓ 5,000 kilometers of vasculature ✓ 213 Million Alveoli ✓ 44 Trillion Voxels h-VIOS chip 2 with perfused vasculature Investing to reflect the increasing maturation of
our exciting new technology as we move from early-stage conceptual development toward commercial application…

Systemic Bio Simplifying the challenges in drug discovery 9 in 10 $2.6B
12 YEARS in development 1 2 DRUGS FAIL CLINICAL TRIALS 1 PER DRUG APPROVED FOR FDA APPROVAL • Wholly-owned subsidiary formed in 2022 • h-VIOS , proprietary organ- on-a-chip platform allows pharma companies to test their drug on
cellularized chip that mimics response in human organs during trials • Closed contracts with 2 out of 4 of world’s largest pharma companies in FY’23, with 5,000– 10,000compounds 5-10 1 growing pipeline for future 3 3 3 Phase
I Preclinical Approved Sciencedirect.com Nature.com FDA.gov 1 2 3
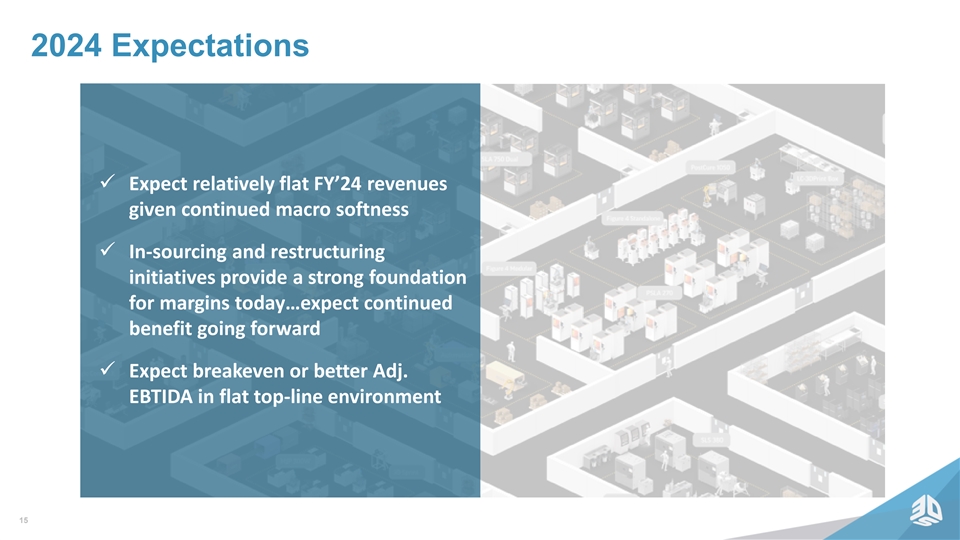
2024 Expectations ✓ Expect relatively flat FY’24 revenues
given continued macro softness ✓ In-sourcing and restructuring initiatives provide a strong foundation for margins today…expect continued benefit going forward ✓ Expect breakeven or better Adj. EBTIDA in flat top-line environment
15

Jeffrey Creech Chief Financial Officer 16

Full Year Revenue Summary ($ in millions) ISG HSG Consolidated $261
$277 $275 $538 $213 $488 FY’22 FY’23 FY’22 FY’23 FY’22 FY’23 • HSG declined ~18% YoY driven by • ISG revenues declined ~1% YoY • YoY revenue declined ~9% primarily headwind in dental orthodontics
driven by headwinds in dental largely impacted by lower printer business orthodontics business sales in tough macro backdrop • ~39% YoY decline in dental orthodontics • Tailwinds in Transportation, • Personalized Healthcare grew
~12% Aerospace & Defense and YoY Semiconductor offset by headwinds in Jewelry and other industrial markets 17

Q4 Revenue Summary ($ in millions) ISG HSG Consolidated $133 $72 $61
$115 $64 $51 Q4’22 Q4’23 Q4’22 Q4’23 Q4’22 Q4’23 • HSG declined ~16% YoY primarily • ISG revenues declined ~12% YoY, • YoY revenue declined ~14% due to decline in dental orthodontics primarily
driven by headwinds in primarily driven by broader macro- business YoY from consumer dental orthodontics business & related weakness across industrial spending headwinds customers in printer sales broader macro-related softness in •
Partial offset as Personalized printer sales Healthcare grew ~11% YoY • Partially offset by strong performing • Partially offset by Q4 growth in materials & services markets such as Aerospace & Defense and Semiconductors
18

Gross Profit Margin (Non-GAAP) Full Year Compare Fourth Quarter Compare
+100 bps +130 bps Full Year Drivers 41.9% 41.1% 40.9% • Continued execution of cost 39.8% optimization efforts & favorable mix Fourth Quarter Drivers • Predominantly favorable mix FY'22 FY'23 Q4'22 Q4'23 19 See Appendix for a
reconciliation of Non-GAAP Gross Profit Margin
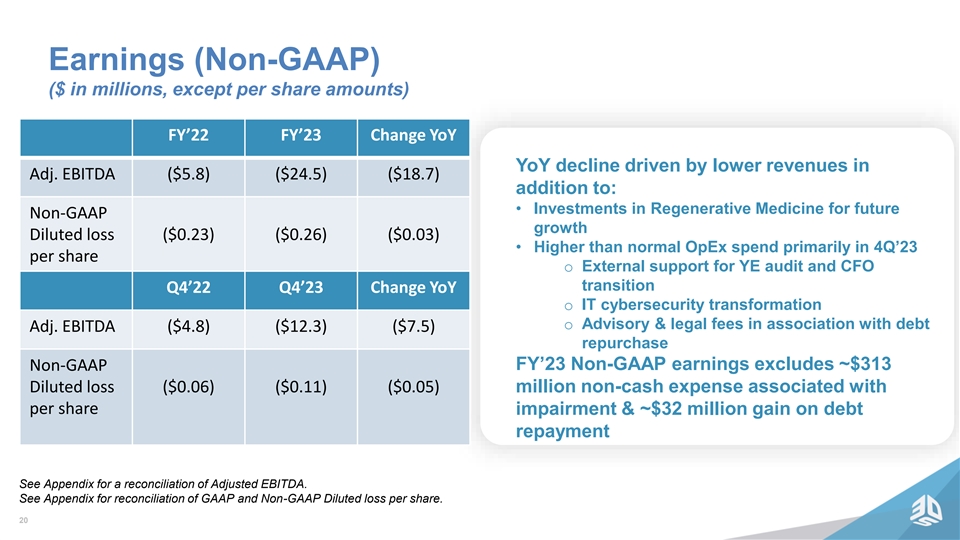
Earnings (Non-GAAP) ($ in millions, except per share amounts)
FY’22 FY’23 Change YoY YoY decline driven by lower revenues in Adj. EBITDA ($5.8) ($24.5) ($18.7) addition to: • Investments in Regenerative Medicine for future Non-GAAP growth Diluted loss ($0.23) ($0.26) ($0.03) • Higher
than normal OpEx spend primarily in 4Q’23 per share o External support for YE audit and CFO transition Q4’22 Q4’23 Change YoY o IT cybersecurity transformation o Advisory & legal fees in association with debt Adj. EBITDA ($4.8)
($12.3) ($7.5) repurchase Non-GAAP FY’23 Non-GAAP earnings excludes ~$313 Diluted loss ($0.06) ($0.11) ($0.05) million non-cash expense associated with per share impairment & ~$32 million gain on debt repayment See Appendix for a
reconciliation of Adjusted EBITDA. See Appendix for reconciliation of GAAP and Non-GAAP Diluted loss per share. 20

Strong Balance Sheet • Ended the quarter with $331.5 million of
cash • Invested cash throughout FY’23 - working capital (e.g. in- sourcing manufacturing), acquisitions and other investments (Wematter, Theradapative) and CapEx for growth programs • Opportunistically repurchased ~$135 million of
2026 Convertible Notes at substantial discount for ~$100 million cash in December to strengthen balance sheet • Current focus is on operational execution to improve working capital and deliver sustainable profitability 21

2024 Outlook Additional Commentary Full Year 2024 Guidance •
Expect current macroeconomic and uncertain geopolitical environment to continue impacting $475 – $505 million Revenue top-line • Mid-point of revenue essentially flat YoY, with Non-GAAP seasonally soft start for Q1’24, down QoQ
& YoY 42% – 44% Gross Margin • Expect sequential improvement throughout FY’24 after Q1 Non-GAAP $223 - $238 million • Gross margin improvement resulting from in- OpEx sourcing and efficiency initiatives • Break even
or better Adj. EBITDA driven by margin Adjusted Break even or better improvement and cost reductions EBITDA 22

Q&A Session 1-201-689-8345 23
Thank You Find out more at: www.3dsystems.com 24
Appendix ©2022 3D Systems, Inc. | All Rights Reserved.

Presentation of Information 3D Systems reports its financial results in
accordance with GAAP. Management also reviews and reports certain non-GAAP measures, including: non-GAAP revenue excluding divestitures and on a constant currency basis (sometimes referred to as excluding divestitures and FX effects), non-GAAP Gross
profit, non-GAAP Gross profit margin, non-GAAP Operating expenses, non-GAAP Operating (loss)/income, non-GAAP Interest and other income/(expense), net, non-GAAP Net income (loss), non-GAAP Basic and Diluted Income (Loss) per Share, adjusted EBITDA
and adjusted EBITDA Margin. These non-GAAP measures exclude certain special items that management does not view as part of 3D Systems’ underlying results as they may be highly variable, may be unusual or infrequent, are difficult to predict
and can distort underlying business trends and results. Management believes that the non-GAAP measures provide useful additional insight into underlying business trends and results and provide a more meaningful comparison of period-over-period
results. Additionally, management uses the non-GAAP measures for planning, forecasting and evaluating business and financial performance, including allocating resources and evaluating results relative to employee compensation targets. 3D
Systems’ non-GAAP measures are not calculated in accordance with or as required by GAAP and may not be calculated the same as similarly titled measures used by other companies. These non-GAAP measures should thus be considered as supplemental
in nature and not considered in isolation or as a substitute for the related financial information prepared in accordance with GAAP. A reconciliation of GAAP to non-GAAP financial measures is provided in the accompanying schedules in the Appendix.
3D Systems does not provide forward-looking guidance for certain measures on a GAAP basis. The company is unable to provide a quantitative reconciliation of forward-looking non-GAAP gross profit margins and non-GAAP operating expenses to the most
directly comparable forward-looking GAAP measures without unreasonable effort because certain items, including legal, acquisition expenses, stock-compensation expense, intangible amortization expense, restructuring expenses, and goodwill impairment,
are difficult to predict and estimate. These items are inherently uncertain and depend on various factors, many of which are beyond the company’s control, and as such, any associated estimate and its impact on GAAP performance could vary
materially. 26
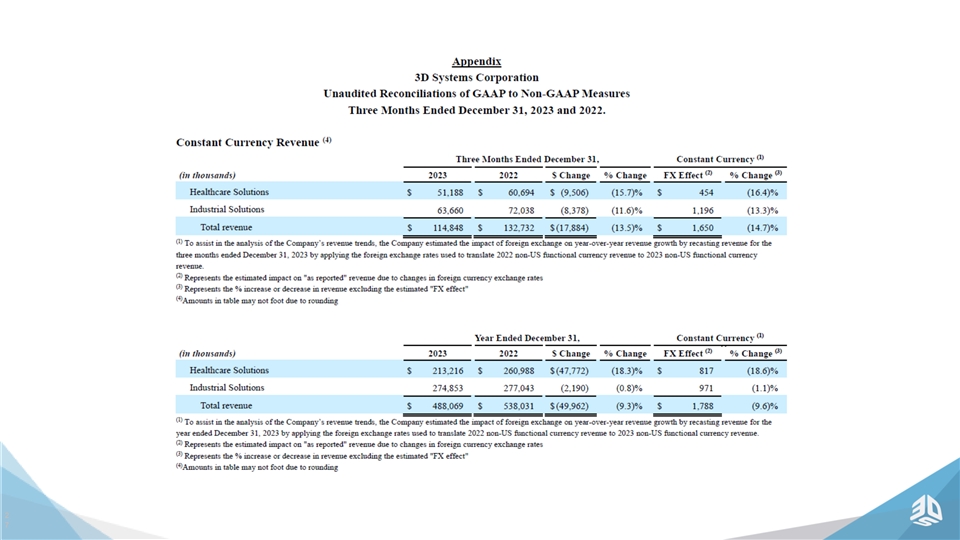
2 7

2 8

2 9
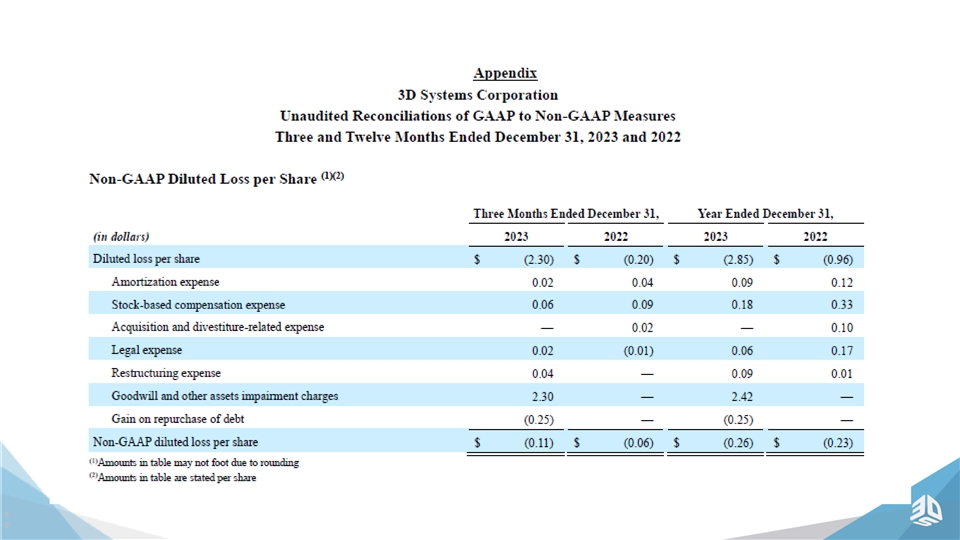
3 0
v3.24.0.1
| X |
- DefinitionBoolean flag that is true when the XBRL content amends previously-filed or accepted submission.
| Name: |
dei_AmendmentFlag |
| Namespace Prefix: |
dei_ |
| Data Type: |
xbrli:booleanItemType |
| Balance Type: |
na |
| Period Type: |
duration |
|
| X |
- DefinitionFor the EDGAR submission types of Form 8-K: the date of the report, the date of the earliest event reported; for the EDGAR submission types of Form N-1A: the filing date; for all other submission types: the end of the reporting or transition period. The format of the date is YYYY-MM-DD.
| Name: |
dei_DocumentPeriodEndDate |
| Namespace Prefix: |
dei_ |
| Data Type: |
xbrli:dateItemType |
| Balance Type: |
na |
| Period Type: |
duration |
|
| X |
- DefinitionThe type of document being provided (such as 10-K, 10-Q, 485BPOS, etc). The document type is limited to the same value as the supporting SEC submission type, or the word 'Other'.
| Name: |
dei_DocumentType |
| Namespace Prefix: |
dei_ |
| Data Type: |
dei:submissionTypeItemType |
| Balance Type: |
na |
| Period Type: |
duration |
|
| X |
- DefinitionAddress Line 1 such as Attn, Building Name, Street Name
| Name: |
dei_EntityAddressAddressLine1 |
| Namespace Prefix: |
dei_ |
| Data Type: |
xbrli:normalizedStringItemType |
| Balance Type: |
na |
| Period Type: |
duration |
|
| X |
- Definition
+ References
+ Details
| Name: |
dei_EntityAddressCityOrTown |
| Namespace Prefix: |
dei_ |
| Data Type: |
xbrli:normalizedStringItemType |
| Balance Type: |
na |
| Period Type: |
duration |
|
| X |
- DefinitionCode for the postal or zip code
| Name: |
dei_EntityAddressPostalZipCode |
| Namespace Prefix: |
dei_ |
| Data Type: |
xbrli:normalizedStringItemType |
| Balance Type: |
na |
| Period Type: |
duration |
|
| X |
- DefinitionName of the state or province.
| Name: |
dei_EntityAddressStateOrProvince |
| Namespace Prefix: |
dei_ |
| Data Type: |
dei:stateOrProvinceItemType |
| Balance Type: |
na |
| Period Type: |
duration |
|
| X |
- DefinitionA unique 10-digit SEC-issued value to identify entities that have filed disclosures with the SEC. It is commonly abbreviated as CIK. Reference 1: http://www.xbrl.org/2003/role/presentationRef
-Publisher SEC
-Name Exchange Act
-Number 240
-Section 12
-Subsection b-2
| Name: |
dei_EntityCentralIndexKey |
| Namespace Prefix: |
dei_ |
| Data Type: |
dei:centralIndexKeyItemType |
| Balance Type: |
na |
| Period Type: |
duration |
|
| X |
- DefinitionIndicate if registrant meets the emerging growth company criteria. Reference 1: http://www.xbrl.org/2003/role/presentationRef
-Publisher SEC
-Name Exchange Act
-Number 240
-Section 12
-Subsection b-2
| Name: |
dei_EntityEmergingGrowthCompany |
| Namespace Prefix: |
dei_ |
| Data Type: |
xbrli:booleanItemType |
| Balance Type: |
na |
| Period Type: |
duration |
|
| X |
- DefinitionCommission file number. The field allows up to 17 characters. The prefix may contain 1-3 digits, the sequence number may contain 1-8 digits, the optional suffix may contain 1-4 characters, and the fields are separated with a hyphen.
| Name: |
dei_EntityFileNumber |
| Namespace Prefix: |
dei_ |
| Data Type: |
dei:fileNumberItemType |
| Balance Type: |
na |
| Period Type: |
duration |
|
| X |
- DefinitionTwo-character EDGAR code representing the state or country of incorporation.
| Name: |
dei_EntityIncorporationStateCountryCode |
| Namespace Prefix: |
dei_ |
| Data Type: |
dei:edgarStateCountryItemType |
| Balance Type: |
na |
| Period Type: |
duration |
|
| X |
- DefinitionThe exact name of the entity filing the report as specified in its charter, which is required by forms filed with the SEC. Reference 1: http://www.xbrl.org/2003/role/presentationRef
-Publisher SEC
-Name Exchange Act
-Number 240
-Section 12
-Subsection b-2
| Name: |
dei_EntityRegistrantName |
| Namespace Prefix: |
dei_ |
| Data Type: |
xbrli:normalizedStringItemType |
| Balance Type: |
na |
| Period Type: |
duration |
|
| X |
- DefinitionThe Tax Identification Number (TIN), also known as an Employer Identification Number (EIN), is a unique 9-digit value assigned by the IRS. Reference 1: http://www.xbrl.org/2003/role/presentationRef
-Publisher SEC
-Name Exchange Act
-Number 240
-Section 12
-Subsection b-2
| Name: |
dei_EntityTaxIdentificationNumber |
| Namespace Prefix: |
dei_ |
| Data Type: |
dei:employerIdItemType |
| Balance Type: |
na |
| Period Type: |
duration |
|
| X |
- DefinitionLocal phone number for entity.
| Name: |
dei_LocalPhoneNumber |
| Namespace Prefix: |
dei_ |
| Data Type: |
xbrli:normalizedStringItemType |
| Balance Type: |
na |
| Period Type: |
duration |
|
| X |
- DefinitionBoolean flag that is true when the Form 8-K filing is intended to satisfy the filing obligation of the registrant as pre-commencement communications pursuant to Rule 13e-4(c) under the Exchange Act. Reference 1: http://www.xbrl.org/2003/role/presentationRef
-Publisher SEC
-Name Exchange Act
-Number 240
-Section 13e
-Subsection 4c
| Name: |
dei_PreCommencementIssuerTenderOffer |
| Namespace Prefix: |
dei_ |
| Data Type: |
xbrli:booleanItemType |
| Balance Type: |
na |
| Period Type: |
duration |
|
| X |
- DefinitionBoolean flag that is true when the Form 8-K filing is intended to satisfy the filing obligation of the registrant as pre-commencement communications pursuant to Rule 14d-2(b) under the Exchange Act. Reference 1: http://www.xbrl.org/2003/role/presentationRef
-Publisher SEC
-Name Exchange Act
-Number 240
-Section 14d
-Subsection 2b
| Name: |
dei_PreCommencementTenderOffer |
| Namespace Prefix: |
dei_ |
| Data Type: |
xbrli:booleanItemType |
| Balance Type: |
na |
| Period Type: |
duration |
|
| X |
- DefinitionTitle of a 12(b) registered security. Reference 1: http://www.xbrl.org/2003/role/presentationRef
-Publisher SEC
-Name Exchange Act
-Number 240
-Section 12
-Subsection b
| Name: |
dei_Security12bTitle |
| Namespace Prefix: |
dei_ |
| Data Type: |
dei:securityTitleItemType |
| Balance Type: |
na |
| Period Type: |
duration |
|
| X |
- DefinitionName of the Exchange on which a security is registered. Reference 1: http://www.xbrl.org/2003/role/presentationRef
-Publisher SEC
-Name Exchange Act
-Number 240
-Section 12
-Subsection d1-1
| Name: |
dei_SecurityExchangeName |
| Namespace Prefix: |
dei_ |
| Data Type: |
dei:edgarExchangeCodeItemType |
| Balance Type: |
na |
| Period Type: |
duration |
|
| X |
- DefinitionBoolean flag that is true when the Form 8-K filing is intended to satisfy the filing obligation of the registrant as soliciting material pursuant to Rule 14a-12 under the Exchange Act. Reference 1: http://www.xbrl.org/2003/role/presentationRef
-Publisher SEC
-Name Exchange Act
-Section 14a
-Number 240
-Subsection 12
| Name: |
dei_SolicitingMaterial |
| Namespace Prefix: |
dei_ |
| Data Type: |
xbrli:booleanItemType |
| Balance Type: |
na |
| Period Type: |
duration |
|
| X |
- DefinitionTrading symbol of an instrument as listed on an exchange.
| Name: |
dei_TradingSymbol |
| Namespace Prefix: |
dei_ |
| Data Type: |
dei:tradingSymbolItemType |
| Balance Type: |
na |
| Period Type: |
duration |
|
| X |
- DefinitionBoolean flag that is true when the Form 8-K filing is intended to satisfy the filing obligation of the registrant as written communications pursuant to Rule 425 under the Securities Act. Reference 1: http://www.xbrl.org/2003/role/presentationRef
-Publisher SEC
-Name Securities Act
-Number 230
-Section 425
| Name: |
dei_WrittenCommunications |
| Namespace Prefix: |
dei_ |
| Data Type: |
xbrli:booleanItemType |
| Balance Type: |
na |
| Period Type: |
duration |
|
3D Systems (NYSE:DDD)
Gráfico Histórico do Ativo
De Mar 2024 até Abr 2024

3D Systems (NYSE:DDD)
Gráfico Histórico do Ativo
De Abr 2023 até Abr 2024
