Form 8-K - Current report
28 Fevereiro 2024 - 6:22PM
Edgar (US Regulatory)
false 0001376339 0001376339 2024-02-28 2024-02-28
UNITED STATES
SECURITIES AND EXCHANGE COMMISSION
WASHINGTON, DC 20549
FORM 8-K
CURRENT REPORT
PURSUANT TO SECTION 13 OR 15(d)
OF THE SECURITIES EXCHANGE ACT OF 1934
Date of Report (Date of earliest event reported): February 28, 2024
MIMEDX GROUP, INC.
(Exact name of registrant as specified in charter)
|
|
|
|
|
| Florida |
|
001-35887 |
|
26-2792552 |
| (State or other jurisdiction of incorporation) |
|
(Commission File Number) |
|
(IRS Employer Identification No.) |
1775 West Oak Commons Ct., NE, Marietta GA 30062
(Address of principal executive offices) (Zip Code)
Registrant’s telephone number, including area code: (770) 651-9100
Check the appropriate box below if the Form 8-K filing is intended to simultaneously satisfy the filing obligation of the registrant under any of the following provisions (see General Instruction A.2. below):
| ☐ |
Written communications pursuant to Rule 425 under the Securities Act (17 CFR 230.425) |
| ☐ |
Soliciting material pursuant to Rule 14a-12 under the Exchange Act (17 CFR 240.14a-12) |
| ☐ |
Pre-commencement communications pursuant to Rule 14d-2(b) under the Exchange Act (17 CFR 240.14d-2(b)) |
| ☐ |
Pre-commencement communications pursuant to Rule 13e-4(c) under the Exchange Act (17 CFR 240.13e-4(c)) |
Securities registered pursuant to Section 12(b) of the Act:
|
|
|
|
|
| Title of each class |
|
Trading Symbol(s) |
|
Name of each exchange on which registered |
| Common Stock, $0.001 par value per share |
|
MDXG |
|
The Nasdaq Stock Market LLC |
Indicate by check mark whether the registrant is an emerging growth company as defined in Rule 405 of the Securities Act of 1933 (§ 230.405 of this chapter) or Rule 12b-2 of the Securities Exchange Act of 1934 (§ 240.12b-2 of this chapter).
Emerging growth company ☐
If an emerging growth company, indicate by check mark if the registrant has elected not to use the extended transition period for complying with any new or revised financial accounting standards provided pursuant to Section 13(a) of the Exchange Act. ☐
Important Cautionary Statement
This report includes forward-looking statements. Statements regarding: (i) future sales or sales growth; (ii) our 2024 financial goals and expectations for future financial results, including levels of net sales, Adjusted EBITDA, Adjusted EBITDA margin, corporate expenses and cash; (iii) our expectations regarding our new products, including EPIEFFECT; and (iv) demand for our products. Additional forward-looking statements may be identified by words such as “believe,” “expect,” “may,” “plan,” “goal,” “outlook,” “potential,” “will,” “preliminary,” and similar expressions, and are based on management’s current beliefs and expectations.
Forward-looking statements are subject to risks and uncertainties, and the Company cautions investors against placing undue reliance on such statements. Actual results may differ materially from those set forth in the forward-looking statements. Factors that could cause actual results to differ from expectations include: (i) future sales are uncertain and are affected by competition, access to customers, patient access to healthcare providers, the reimbursement environment and many other factors; (ii) the Company may change its plans due to unforeseen circumstances; (iii) the results of scientific research are uncertain and may have little or no value; (iv) our ability to sell our products in other countries depends on a number of factors including adequate levels of reimbursement, market acceptance of novel therapies, and our ability to build and manage a direct sales force or third party distribution relationship; (v) the effectiveness of amniotic tissue as a therapy for particular indications or conditions is the subject of further scientific and clinical studies; and (vi) we may alter the timing and amount of planned expenditures for research and development based regulatory developments. The Company describes additional risks and uncertainties in the Risk Factors section of its most recent annual report and quarterly reports filed with the Securities and Exchange Commission. Any forward-looking statements speak only as of the date of this report and the Company assumes no obligation to update any forward-looking statement.
Item 2.02 Results of Operations and Financial Condition.
On February 28, 2024, MiMedx Group, Inc. (the “Company”), issued a press release (the “Earnings Press Release”) announcing its results for the fourth quarter and full year ended December 31, 2023. A copy of the Earnings Press Release is attached hereto as Exhibit 99.1 and is incorporated herein by reference.
The foregoing information is furnished pursuant to Item 2.02, “Results of Operations and Financial Condition”, including Exhibit 99.1 attached hereto, and shall not be deemed “filed” for purposes of Section 18 of the Securities Exchange Act of 1934, as amended (the “Exchange Act”), or otherwise subject to the liabilities of that section. It may only be incorporated by reference into another filing under the Exchange Act or Securities Act of 1933, as amended (the “Securities Act”), if such subsequent filing specifically references this Form 8-K. All information in the Earnings Press Release speaks as of the date thereof and the Company does not assume any obligation to update said information in the future. In addition, the Company disclaims any inference regarding the materiality of such information which otherwise may arise as a result of its furnishing such information under Item 2.02 of this report on Form 8-K.
Item 7.01 Regulation FD Disclosure.
On February 28, 2024, at 5 p.m. Eastern Daylight Time, the Company intends to host a conference call and webcast (the “Earnings Call”) to discuss its financial and operating results for the fourth quarter and full year ended December 31, 2023. A copy of the slide presentation to be used by the Company in connection with the Earnings Call is attached hereto as Exhibit 99.2 and is incorporated herein by reference.
The foregoing information is furnished pursuant to Item 7.01, including Exhibit 99.2 attached hereto, and shall not be deemed “filed” for purposes of Section 18 of the Exchange Act, or otherwise subject to the liabilities of that section. It may only be incorporated by reference into another filing under the Exchange Act or Securities Act if such subsequent filing specifically references this Form 8-K.
Item 9.01 Financial Statements and Exhibits.
(d) Exhibits.
SIGNATURES
Pursuant to the requirements of the Exchange Act, the Registrant has duly caused this report to be signed on its behalf by the undersigned hereunto duly authorized.
|
|
|
|
|
|
|
|
|
|
|
|
|
MIMEDX GROUP, INC. |
|
|
|
|
| Date: February 28, 2024 |
|
|
|
By: |
|
/s/ Doug Rice |
|
|
|
|
|
|
Doug Rice Chief Financial Officer |
Exhibit 99.1
MIMEDX Announces Fourth Quarter and Full Year 2023 Operating and Financial Results
Net Sales Grew 17% Year-Over-Year for the Fourth Quarter and 20% for the Full Year
Fourth Quarter Net Income was $53 million, Inclusive of a $40 million One-Time Non-Cash Tax Benefit
Fourth Quarter Adjusted EBITDA of $21 million, or 24% of Net Sales
Management to Host Conference Call Today, February 28, 2024, at 4:30 PM ET
MARIETTA, Ga., February 28, 2024 — MiMedx Group, Inc. (Nasdaq: MDXG) (“MIMEDX” or the “Company”), today
announced operating and financial results for the fourth quarter and full year 2023.
Recent Operating and Financial Highlights:
| |
• |
|
Fourth quarter and full year 2023 net sales of $87 million and $321 million, reflecting 17% and 20%
year-over-year growth, respectively. |
| |
• |
|
GAAP Net Income for the fourth quarter and full year 2023 of $53 million and $58 million, respectively.
GAAP Net income margin for the fourth quarter and full year 2023 were also 62% and 18%, respectively. |
| |
• |
|
Adjusted EBITDA1 and Adjusted EBITDA Margin for the fourth
quarter 2023 of $21 million and 24%, respectively. |
| |
• |
|
Launched EPIEFFECT®, the latest addition to the
Company’s broad portfolio of Advanced Wound Care products. |
| |
• |
|
Announced conversion of outstanding Series B convertible preferred stock to common stock. |
| |
• |
|
Announced new senior secured credit facilities and debt refinancing in January 2024 and repaid $30 million
revolving credit facility portion with cash on hand earlier this week. |
Joseph H. Capper, MIMEDX Chief Executive Officer, commented,
“We are once again pleased to report on another impressive quarter of top-line growth, profitability and cash flow generation as we closed out a transformative 2023, driven by the improved alignment and
focus of the Company. Moreover, the 20% top-line growth we achieved for the full-year 2023 exceeded expectations and provides solid momentum going forward. Additionally, in a very short period of time, the
team has successfully unlocked robust cash flow generation that should continue to improve with scale over time.”
Mr. Capper continued,
“Given the commercial strength of the organization, we expect 2024 to be another noteworthy year with low double-digit net sales percentage growth and Adjusted EBITDA margin above 20%. Our improved cash flow generation and balance sheet
enhancements also provide the necessary support to accelerate our growth plan as we capitalize on the opportunities before us.”
| 1 |
Adjusted EBITDA and related margins, Adjusted Net Income and Adjusted EPS are
non-GAAP financial measures. See “Reconciliation of Non-GAAP Measures” for a reconciliation of Adjusted EBITDA and Adjusted Net Income to Net income (loss) and
Adjusted EPS to Diluted earnings per share, located in “Selected Unaudited Financial Information” of this release. |
|
|
|
|
|
|
|
|
|
|
|
|
|
|
|
|
|
| |
|
Three Months Ended December 31, |
|
|
Year Ended December 31, |
|
| |
|
2023 |
|
|
2022 |
|
|
2023 |
|
|
2022 |
|
| Net Income (loss) |
|
$ |
53,476 |
|
|
$ |
(415 |
) |
|
$ |
58,228 |
|
|
$ |
(30,197 |
) |
| Non-GAAP Adjustments: |
|
|
|
|
|
|
|
|
|
|
|
|
|
|
|
|
| Depreciation expense |
|
|
611 |
|
|
|
796 |
|
|
|
2,665 |
|
|
|
3,345 |
|
| Amortization of intangible assets |
|
|
192 |
|
|
|
182 |
|
|
|
762 |
|
|
|
701 |
|
| Interest expense, net |
|
|
1,593 |
|
|
|
1,450 |
|
|
|
6,457 |
|
|
|
5,016 |
|
| Income tax provision (benefit) expense |
|
|
(40,349 |
) |
|
|
28 |
|
|
|
(39,780 |
) |
|
|
206 |
|
| Investigation, restatement and related expenses |
|
|
524 |
|
|
|
3,406 |
|
|
|
5,176 |
|
|
|
12,177 |
|
| Share-based compensation |
|
|
4,385 |
|
|
|
1,868 |
|
|
|
17,178 |
|
|
|
12,666 |
|
| Expenses related to disbanding of Regenerative Medicine business unit |
|
|
785 |
|
|
|
— |
|
|
|
6,384 |
|
|
|
— |
|
| Reorganization expenses |
|
|
— |
|
|
|
— |
|
|
|
1,412 |
|
|
|
3,105 |
|
|
|
|
|
|
|
|
|
|
|
|
|
|
|
|
|
|
| Adjusted EBITDA |
|
$ |
21,217 |
|
|
$ |
7,315 |
|
|
$ |
58,482 |
|
|
$ |
7,019 |
|
|
|
|
|
|
|
|
|
|
|
|
|
|
|
|
|
|
| Adjusted EBITDA margin |
|
|
24.4 |
% |
|
|
9.8 |
% |
|
|
18.2 |
% |
|
|
2.6 |
% |
Fourth Quarter and Full Year 2023 Results Discussion2
Net Sales
MIMEDX reported net sales for the three months
ended December 31, 2023, of $87 million, compared to $74 million for the three months ended December 31, 2022, an increase of 17%. Net sales growth came from solid contributions in both the Wound & Surgical end markets and across
each of our main sites of service.
For the full year 2023, MIMEDX reported net sales of $321 million, compared to $268 million in the prior
year period, reflecting growth of 20%, which was also driven by a combination of contributions in Wound & Surgical and across our sites of service.
Gross Profit and Margin
Gross profit for the three
months ended December 31, 2023, was $73 million, an increase of $13 million as compared to the prior year period. Gross margin for the three months ended December 31, 2023 was 84.1%, compared to 80.7% in the prior year period. The
year-over-year improvement in gross margin was driven by favorable product mix and our continued execution on yield improvement projects.
For the full
year 2023, gross profit was $267 million, reflecting an increase of $47 million compared to the prior year period. Additionally, gross margin for the full year 2023 was 83.0%, compared to 82.0% for the full year 2022 and the improvement
was also driven by improved yields and a favorable product mix.
| 2 |
The following discussion of the Company’s fourth quarter and full year 2023 results are made on a
“continuing operations basis” and exclude the historical costs of the Regenerative Medicine business unit, which was disbanded beginning in June 2023. For a full discussion of the impact of these discontinued operations, please refer to
our Annual Report on Form 10-K filed with the Securities and Exchange Commission for the year ended December 31, 2023. |
Operating Expenses
Selling, general and administrative (“SG&A”) expenses for the three months ended December 31, 2023, were $54 million compared to
$50 million for the three months ended December 31, 2022. SG&A expense during the fourth quarter 2023 included increased sales commissions due to higher sales volumes.
For the full year 2023, SG&A expenses totaled $211 million, compared to $209 million for the prior year period, reflecting year over year growth
of 1.1%. The increase was driven by higher levels of sales commissions due to higher sales volumes, as well as increases in stock-based compensation in 2023. These increases were partially offset by a decrease in professional services related to
certain administrative expenses, including severance expenses associated with the departure of our former CEO in 2022.
Research and development expenses
were $2 million for the three months ended December 31, 2023, compared to $3 million for the three months ended December 31, 2022. For the full year 2023, research and development expenses remained essentially flat at $13 million
compared to 2022. Our R&D expenses in 2022 and 2023 were primarily driven by the development and launches of our newest products in the portfolio - AMNIOEFFECT, AXIOFILL and EPIEFFECT - along with additional early-stage Wound & Surgical
products in development.
Investigation, restatement and related expense for the three months ended December 31, 2023 was $1 million, compared to
$3 million for the three months ended December 31, 2022. For the full year 2023, investigation, restatement and related expenses totaled $5 million compared to $12 million in 2022. The decrease was related to negotiated reductions in
legal fees previously incurred. In addition, following the end of a legal proceeding, expenses under our last material proceeding involving indemnification of former officers and directors substantially ceased in 2023.
Net income from continuing operations for the three months and full year ended December 31, 2023, were $51 million and $67 million, respectively,
compared to a net income from continuing operations of $2 million for the three months ended December 31, 2022 and a net loss from continuing operations of $20 million for the year ended December 31, 2022. Net income from continuing
operations for the three months and full year ended December 31, 2023 were positively impacted by a $37 million income tax provision benefit, reflecting a non-cash reversal of a valuation allowance that
was previously recorded against the deferred tax asset balance. The reversal was a result of an analysis following the Company’s conclusion that the Company’s disbanded Regenerative Medicine segment qualified as a discontinued operation,
in concert with the Company’s operating results.
Cash and Cash Equivalents
As of December 31, 2023, the Company had $82 million of cash and cash equivalents compared to $66 million as of December 31, 2022 and
$81 million as of September 30, 2023. The increase during the year ended December 31, 2023 was primarily a result of year-over-year increases in net sales, which drove increases in collections from customers, as well as year-over-year decreases
in operating
expenses, partially offset by the $9.5 million repurchase of a portion of the shares of Series B Convertible Preferred Stock, held by certain funds managed by Hayfin Capital Management, LLP
in October 2023.
Financial Goals
The Company’s
goal is to deliver net sales percentage growth in the low double-digits annually.
In 2024, the Company expects to see continued growth in both the Wound
and Surgical end markets, despite more difficult prior year growth comparisons. In particular, the Company continues to anticipate solid growth in the private office setting driven by the recent launch of EPIEFFECT and ongoing changes in purchasing
behaviors related to Medicare reimbursement. Additionally, the Company expects to continue to drive growth across a variety of Surgical use cases as the body of evidence for utilization of its Surgical products, such as AMNIOEFFECT, continues to
grow.
For the full year 2024, the Company expects its Adjusted EBITDA as a percent of net sales to be above 20%.
Conference Call and Webcast
MIMEDX will host a
conference call and webcast to review its fourth quarter and full year 2023 results on Wednesday, February 28, 2024, beginning at 4:30 p.m., Eastern Time. The call can be accessed using the following information:
Webcast: Click here
U.S. Investors: 877-407-6184
International Investors: 201-389-0877
Conference ID: 13743067
A replay of the webcast will be available for approximately 30 days on the Company’s website at www.mimedx.com following the conclusion of the
event.
Important Cautionary Statement
This press
release includes forward-looking statements. Statements regarding: (i) future sales or sales growth; (ii) our 2024 financial goals and expectations for future financial results, including levels of net sales, Adjusted EBITDA, and Adjusted
EBITDA margin; (iii) our cash flows; (iv)our expectations regarding the use of our products, including EPIEFFECT and AMNIOEFFECT; and (v) continued growth in different care settings. Additional forward-looking statements may be identified
by words such as “believe,” “expect,” “may,” “plan,” “goal,” “outlook,” “potential,” “will,” “preliminary,” and similar expressions, and are based on
management’s current beliefs and expectations.
Forward-looking statements are subject to risks and uncertainties, and the Company cautions investors
against placing undue reliance on such statements. Actual results may differ materially from those set forth in the forward-looking statements. Factors that could cause actual results to differ from expectations include: (i) future sales are
uncertain and are affected by competition, access to customers,
patient access to healthcare providers, the reimbursement environment and many other factors; (ii) the Company may change its plans due to unforeseen circumstances; (iii) the results of
scientific research are uncertain and may have little or no value; (iv) our ability to sell our products in other countries depends on a number of factors including adequate levels of reimbursement, market acceptance of novel therapies, and our
ability to build and manage a direct sales force or third party distribution relationship; (v) the effectiveness of amniotic tissue as a therapy for particular indications or conditions is the subject of further scientific and clinical studies;
and (vi) we may alter the timing and amount of planned expenditures for research and development based on regulatory developments. The Company describes additional risks and uncertainties in the Risk Factors section of its most recent annual
report and quarterly reports filed with the Securities and Exchange Commission. Any forward-looking statements speak only as of the date of this press release and the Company assumes no obligation to update any forward-looking statement.
About MIMEDX
MIMEDX is a pioneer and leader focused on
helping humans heal. With more than a decade of helping clinicians manage chronic and other hard-to-heal wounds, MIMEDX is dedicated to providing a leading portfolio of
products for applications in the wound care, burn, and surgical sectors of healthcare. The Company’s vision is to be the leading global provider of healing solutions through relentless innovation to restore quality of life. For additional
information, please visit www.mimedx.com.
Contact:
Matt Notarianni
Investor Relations
470.304.7291
mnotarianni@mimedx.com
Selected Unaudited Financial Information
MiMedx Group, Inc.
Condensed Consolidated Balance Sheets
(in thousands) Unaudited
|
|
|
|
|
|
|
|
|
| |
|
December 31,
2023 |
|
|
December 31,
2022 |
|
| ASSETS |
|
|
|
|
|
|
|
|
| Current assets: |
|
|
|
|
|
|
|
|
| Cash and cash equivalents |
|
$ |
82,000 |
|
|
$ |
65,950 |
|
| Accounts receivable, net |
|
|
53,871 |
|
|
|
43,084 |
|
| Inventory |
|
|
21,021 |
|
|
|
13,183 |
|
| Prepaid expenses |
|
|
5,624 |
|
|
|
7,315 |
|
| Current assets of discontinued operations |
|
|
— |
|
|
|
1,331 |
|
| Other current assets |
|
|
1,745 |
|
|
|
3,335 |
|
|
|
|
|
|
|
|
|
|
| Total current assets |
|
|
164,261 |
|
|
|
134,198 |
|
| Property and equipment, net |
|
|
6,974 |
|
|
|
7,856 |
|
| Right of use asset |
|
|
2,132 |
|
|
|
3,400 |
|
| Goodwill |
|
|
19,441 |
|
|
|
19,441 |
|
| Intangible assets, net |
|
|
5,257 |
|
|
|
5,852 |
|
| Deferred tax asset |
|
|
40,777 |
|
|
|
— |
|
| Other assets |
|
|
205 |
|
|
|
148 |
|
| Noncurrent assets of discontinued operations |
|
|
— |
|
|
|
535 |
|
|
|
|
|
|
|
|
|
|
| Total assets |
|
$ |
239,047 |
|
|
$ |
171,430 |
|
|
|
|
|
|
|
|
|
|
| LIABILITIES, CONVERTIBLE PREFERRED STOCK, AND STOCKHOLDERS’ EQUITY (DEFICIT) |
|
|
|
|
|
|
|
|
| Current liabilities: |
|
|
|
|
|
|
|
|
| Accounts payable |
|
$ |
9,048 |
|
|
$ |
8,454 |
|
| Accrued compensation |
|
|
22,353 |
|
|
|
20,856 |
|
| Accrued expenses |
|
|
9,361 |
|
|
|
10,934 |
|
| Current liabilities of discontinued operations |
|
|
1,352 |
|
|
|
1,479 |
|
| Other current liabilities |
|
|
3,894 |
|
|
|
1,834 |
|
|
|
|
|
|
|
|
|
|
| Total current liabilities |
|
|
46,008 |
|
|
|
43,557 |
|
| Long term debt, net |
|
|
48,099 |
|
|
|
48,594 |
|
| Other liabilities |
|
|
2,223 |
|
|
|
4,773 |
|
|
|
|
|
|
|
|
|
|
| Total liabilities |
|
|
96,330 |
|
|
|
96,924 |
|
| Convertible preferred stock |
|
|
— |
|
|
|
92,494 |
|
| Total stockholders’ equity (deficit) |
|
|
142,717 |
|
|
|
(17,988 |
) |
|
|
|
|
|
|
|
|
|
| Total liabilities, convertible preferred stock, and stockholders’ equity (deficit) |
|
$ |
239,047 |
|
|
$ |
171,430 |
|
|
|
|
|
|
|
|
|
|
MiMedx Group, Inc.
Condensed Consolidated Statements of Operations
(in thousands, except share and per share amounts) Unaudited
|
|
|
|
|
|
|
|
|
|
|
|
|
|
|
|
|
| |
|
Three Months Ended
December 31, |
|
|
Year Ended December 31, |
|
| |
|
2023 |
|
|
2022 |
|
|
2023 |
|
|
2022 |
|
| Net sales |
|
$ |
86,832 |
|
|
$ |
74,375 |
|
|
$ |
321,477 |
|
|
$ |
267,841 |
|
| Cost of sales |
|
|
13,841 |
|
|
|
14,369 |
|
|
|
54,634 |
|
|
|
48,316 |
|
|
|
|
|
|
|
|
|
|
|
|
|
|
|
|
|
|
| Gross profit |
|
|
72,991 |
|
|
|
60,006 |
|
|
|
266,843 |
|
|
|
219,525 |
|
| Operating expenses: |
|
|
|
|
|
|
|
|
|
|
|
|
|
|
|
|
| Selling, general and administrative |
|
|
54,352 |
|
|
|
49,922 |
|
|
|
211,124 |
|
|
|
208,673 |
|
| Research and development |
|
|
2,434 |
|
|
|
2,955 |
|
|
|
12,665 |
|
|
|
12,701 |
|
| Investigation, restatement and related |
|
|
524 |
|
|
|
3,406 |
|
|
|
5,176 |
|
|
|
12,177 |
|
| Amortization of intangible assets |
|
|
192 |
|
|
|
182 |
|
|
|
762 |
|
|
|
701 |
|
|
|
|
|
|
|
|
|
|
|
|
|
|
|
|
|
|
| Operating income (loss) |
|
|
15,489 |
|
|
|
3,541 |
|
|
|
37,116 |
|
|
|
(14,727 |
) |
|
|
|
|
|
| Other expense, net |
|
|
|
|
|
|
|
|
|
|
|
|
|
|
|
|
| Interest expense, net |
|
|
(1,593 |
) |
|
|
(1,450 |
) |
|
|
(6,457 |
) |
|
|
(5,016 |
) |
| Other income (expense), net |
|
|
16 |
|
|
|
(3 |
) |
|
|
(26 |
) |
|
|
(4 |
) |
|
|
|
|
|
|
|
|
|
|
|
|
|
|
|
|
|
| Income (loss) from continuing operations before income tax provision |
|
|
13,912 |
|
|
|
2,088 |
|
|
|
30,633 |
|
|
|
(19,747 |
) |
| Income tax provision benefit (expense) |
|
|
37,375 |
|
|
|
(28 |
) |
|
|
36,806 |
|
|
|
(206 |
) |
|
|
|
|
|
|
|
|
|
|
|
|
|
|
|
|
|
| Net income (loss) from continuing operations |
|
$ |
51,287 |
|
|
$ |
2,060 |
|
|
$ |
67,439 |
|
|
$ |
(19,953 |
) |
| Income (loss) from discontinued operations, net of tax |
|
|
2,189 |
|
|
|
(2,475 |
) |
|
|
(9,211 |
) |
|
|
(10,244 |
) |
|
|
|
|
|
|
|
|
|
|
|
|
|
|
|
|
|
| Net income (loss) |
|
$ |
53,476 |
|
|
$ |
(415 |
) |
|
$ |
58,228 |
|
|
$ |
(30,197 |
) |
|
|
|
|
|
|
|
|
|
|
|
|
|
|
|
|
|
| Net income (loss) from continuing operations available to common shareholders |
|
$ |
44,829 |
|
|
$ |
390 |
|
|
$ |
55,796 |
|
|
$ |
(26,533 |
) |
|
|
|
|
|
|
|
|
|
|
|
|
|
|
|
|
|
| Basic net income (loss) per common share: |
|
|
|
|
|
|
|
|
|
|
|
|
|
|
|
|
| Continuing operations |
|
$ |
0.38 |
|
|
$ |
0.00 |
|
|
$ |
0.48 |
|
|
$ |
(0.24 |
) |
| Discontinued operations |
|
$ |
0.02 |
|
|
$ |
(0.02 |
) |
|
$ |
(0.08 |
) |
|
$ |
(0.09 |
) |
|
|
|
|
|
|
|
|
|
|
|
|
|
|
|
|
|
| Basic net income (loss) per common share: |
|
$ |
0.40 |
|
|
$ |
(0.02 |
) |
|
$ |
0.40 |
|
|
$ |
(0.33 |
) |
|
|
|
|
|
|
|
|
|
|
|
|
|
|
|
|
|
| Diluted net income (loss) per common share: |
|
|
|
|
|
|
|
|
|
|
|
|
|
|
|
|
| Continuing operations |
|
$ |
0.31 |
|
|
$ |
0.00 |
|
|
$ |
0.43 |
|
|
$ |
(0.24 |
) |
| Discontinued operations |
|
$ |
0.01 |
|
|
$ |
(0.02 |
) |
|
$ |
(0.06 |
) |
|
$ |
(0.09 |
) |
|
|
|
|
|
|
|
|
|
|
|
|
|
|
|
|
|
| Diluted net income (loss) per common share: |
|
$ |
0.32 |
|
|
$ |
(0.02 |
) |
|
$ |
0.37 |
|
|
$ |
(0.33 |
) |
|
|
|
|
|
|
|
|
|
|
|
|
|
|
|
|
|
| Weighted average common shares outstanding - basic |
|
|
119,367,482 |
|
|
|
113,676,496 |
|
|
|
116,495,810 |
|
|
|
112,909,266 |
|
| Weighted average common shares outstanding - diluted |
|
|
148,076,079 |
|
|
|
114,233,567 |
|
|
|
145,962,462 |
|
|
|
112,909,266 |
|
MiMedx Group, Inc.
Condensed Consolidated Statements of Cash Flows
(in thousands) Unaudited
|
|
|
|
|
|
|
|
|
|
|
|
|
|
|
|
|
| |
|
Three Months Ended
December 31, |
|
|
Year Ended December 31, |
|
| |
|
2023 |
|
|
2022 |
|
|
2023 |
|
|
2022 |
|
| Net cash flows provided by (used in) operating activities |
|
|
10,257 |
|
|
|
(5,624 |
) |
|
|
26,775 |
|
|
|
(17,893 |
) |
| Net cash flows used in investing activities |
|
|
(481 |
) |
|
|
(1,709 |
) |
|
|
(2,155 |
) |
|
|
(2,660 |
) |
| Net cash flows used in financing activities |
|
|
(8,940 |
) |
|
|
66 |
|
|
|
(8,570 |
) |
|
|
(580 |
) |
|
|
|
|
|
|
|
|
|
|
|
|
|
|
|
|
|
| Net change in cash |
|
$ |
836 |
|
|
$ |
(7,267 |
) |
|
$ |
16,050 |
|
|
$ |
(21,133 |
) |
Reconciliation of Non-GAAP Measures
In addition to our GAAP results, we provide certain non-GAAP metrics including Adjusted EBITDA, related margins, Free
Cash Flow, Adjusted Net Income, and Adjusted Earnings Per Share (“Adjusted EPS”). We believe that the presentation of these measures provides important supplemental information to management and investors regarding our performance. These
measurements are not a substitute for GAAP measurements. Company management uses these Non-GAAP measurements as aids in monitoring our ongoing financial performance from quarter-to-quarter and year-to-year on a regular basis and for benchmarking against comparable companies.
These non-GAAP financial measures reflect the exclusion of the following items:
| |
• |
|
Share-based compensation expense - expense recognized related to awards to various employees
pursuant to our share-based compensation plans. This expense is reflected amongst cost of sales, research and development expense, and selling, general, and administrative expense in the unaudited condensed consolidated statements of operations.
Refer to Note 11, Equity, in our Form 10-K for the year ended December 31, 2023 for details. |
| |
• |
|
Investigation, restatement, and related (benefit) expense - expenses incurred toward the legal defense of certain
former officers and directors, net of negotiated reductions and settlements of amounts previously advanced. This expense is reflected in the line of the same name in our unaudited condensed consolidated statements of operations.
|
| |
• |
|
Expenses related to the Disbanding of Regenerative Medicine - incremental expenses recognized or incurred
directly as a result of our announcement to disband our Regenerative Medicine segment. This reflects (i) write-downs of clinical trial assets, (ii) charges associated with the wind-down of contracts associated with our clinical trial
program, (iii) severance expenses incurred which were directly attributable to the disbanding, and (iv) impairment of goodwill. Severance expenses are reflected in research and development expense on the unaudited condensed consolidated
statements of operations. All other charges are reflected in restructuring expense in the unaudited condensed consolidated statements of operations. |
| |
• |
|
Reorganization expense - expenses incurred toward the realignment of our operating strategy. These expenses
primarily relate to severance expenses related to certain officers. These expenses are reflected as a component of selling, general, and administrative expense in the unaudited condensed consolidated statements of operations. |
| |
• |
|
Effects of antidilution - reflects the impact of reflecting certain transactions which are dilutive for purposes
of calculating EPS on a GAAP basis, but are antidilutive for purposes of calculating Adjusted EPS. For Q4 and FY 2023, this reflects the adjustment for dividends on the Company’s Series B Preferred Stock to the numerator and incremental shares
which would have been issued if the Series B Preferred Stock were converted at the beginning of the relevant period, weighted for the portion of the period that the shares were not converted, to the denominator. The reflection of this reduced the
denominator by 26.8 million and 27.5 million shares, respectively. |
| |
• |
|
Income Tax Adjustment - for purposes of calculating Adjusted Net Income (Loss) and Adjusted
Earnings Per Share, reflects our expectation of a long-term effective tax rate, which is normalized and balance sheet-agnostic. Actual reporting tax expense will be based on GAAP earnings, and may differ from the expected long-term effective tax
rate due to a variety of factors, including the tax treatment of various transactions included in GAAP net income and other reconciling items that are excluded in determining Adjusted Net Income (Loss) and Adjusted EPS. The long-term normalized
effective tax rate was 25% for each of the years ended December 31, 2023 and 2022. |
Adjusted EBITDA and Adjusted EBITDA margin
Adjusted EBITDA consists of GAAP net income (loss) excluding: (i) depreciation, (ii) amortization of intangibles, (iii) interest expense,
net, (iv) income tax provision, (v) investigation, restatement and related expenses, (vi) reorganization expenses related to severance charges for certain officers (vii) expenses related to disbanding of the Regenerative Medicine
business unit and (viii) share-based compensation.
Please refer to the tables at the beginning of this press release for reconciliation to GAAP net
income (loss).
Adjusted Net Income (Loss)
Adjusted
Net Income (Loss) provides a view of our operating performance, exclusive of certain items which are non-recurring or not reflective of our core operations. Management uses Adjusted Net Income to assess
Company financial performance.
Adjusted Net Income is defined as GAAP net income (loss) plus (i) investigation restatement and related expenses,
(ii) expenses related to disbanding our Regenerative Medicine business unit, (iii) reorganization expenses related to severance charges for certain officers, and (iv) the long-term adjusted effective income tax rate.
A reconciliation of GAAP Net Income to Adjusted Net Income appears in the table below (in thousands):
|
|
|
|
|
|
|
|
|
|
|
|
|
|
|
|
|
| |
|
Three Months Ended
December 31, |
|
|
Year Ended December 31, |
|
| |
|
2023 |
|
|
2022 |
|
|
2023 |
|
|
2022 |
|
| Net income (loss) |
|
$ |
53,476 |
|
|
$ |
(415 |
) |
|
$ |
58,228 |
|
|
$ |
(30,197 |
) |
| Investigation, restatement and related expenses |
|
|
524 |
|
|
|
3,406 |
|
|
|
5,176 |
|
|
|
12,177 |
|
| Expenses related to disbanding of Regenerative Medicine business unit |
|
|
785 |
|
|
|
— |
|
|
|
6,384 |
|
|
|
— |
|
| Reorganization expenses |
|
|
— |
|
|
|
— |
|
|
|
1,412 |
|
|
|
3,105 |
|
| Long-term adjusted effective income tax rate |
|
|
(43,958 |
) |
|
|
(726 |
) |
|
|
(47,635 |
) |
|
|
3,883 |
|
|
|
|
|
|
|
|
|
|
|
|
|
|
|
|
|
|
| Adjusted net income (loss) |
|
$ |
10,827 |
|
|
$ |
2,265 |
|
|
$ |
23,565 |
|
|
$ |
(11,032 |
) |
|
|
|
|
|
|
|
|
|
|
|
|
|
|
|
|
|
Adjusted Earnings Per Share
Adjusted Earnings Per Share is intended to provide a normalized view of earnings per share by removing items that may be irregular, one-time, or non-recurring from net income. This enables us to identify underlying trends in our business that could otherwise be masked by such items. Adjusted Earnings Per
Share consists of GAAP diluted earnings per share including adjustments for: (i) effects of antidilution, (ii) investigation, restatement and related expenses, (iii) reorganization expenses related to severance charges for certain
officers and (iv) long-term adjusted effective income tax rate.
A reconciliation of GAAP diluted earnings per share to Adjusted Earnings Per Share
appears in the table below (per diluted share):
|
|
|
|
|
|
|
|
|
|
|
|
|
|
|
|
|
| |
|
For the Three Months Ended
December 31, |
|
|
For the Year Ended
December 31, |
|
| |
|
2023 |
|
|
2022 |
|
|
2023 |
|
|
2022 |
|
| GAAP net income (loss) per common share - diluted |
|
$ |
0.32 |
|
|
$ |
(0.02 |
) |
|
$ |
0.37 |
|
|
$ |
(0.33 |
) |
| Effects of antidilution |
|
$ |
0.07 |
|
|
$ |
0.00 |
|
|
$ |
0.03 |
|
|
$ |
0.00 |
|
| Investigation, restatement and related (benefit) expense |
|
$ |
0.00 |
|
|
$ |
0.03 |
|
|
$ |
0.04 |
|
|
$ |
0.11 |
|
| Reorganization expenses |
|
$ |
0.00 |
|
|
$ |
0.00 |
|
|
$ |
0.01 |
|
|
$ |
0.03 |
|
| Expenses related to disbanding of Regenerative Medicine business unit |
|
$ |
0.01 |
|
|
$ |
0.00 |
|
|
$ |
0.05 |
|
|
$ |
0.00 |
|
| Long-term adjusted effective income tax rate |
|
$ |
(0.36 |
) |
|
$ |
0.00 |
|
|
$ |
(0.40 |
) |
|
$ |
0.03 |
|
|
|
|
|
|
|
|
|
|
|
|
|
|
|
|
|
|
| Adjusted Earnings Per Share |
|
$ |
0.04 |
|
|
$ |
0.01 |
|
|
$ |
0.10 |
|
|
$ |
(0.16 |
) |
|
|
|
|
|
|
|
|
|
|
|
|
|
|
|
|
|
| Weighted average common shares outstanding - adjusted (in millions) |
|
|
122.7 |
|
|
|
114.2 |
|
|
|
118.5 |
|
|
|
112.9 |
|
Free Cash Flow
Free Cash Flow is intended to provide a measure of our ability to generate cash in excess of capital investments. It provides management with a view of cash
flows which can be used to finance operational and strategic investments.
Free Cash Flow is defined as net cash provided by (used in) operating
activities less capital expenditures, including purchases of equipment.
A reconciliation of GAAP net cash flows provided by (used in) operating
activities to Free Cash Flow appears in the table below (in thousands):
|
|
|
|
|
|
|
|
|
|
|
|
|
|
|
|
|
| |
|
For the Three Months
Ended December 31, |
|
|
For the Year Ended
December 31, |
|
| |
|
2023 |
|
|
2022 |
|
|
2023 |
|
|
2022 |
|
| Net cash flows provided by (used in) operating activities |
|
|
10,257 |
|
|
|
(5,624 |
) |
|
|
26,775 |
|
|
|
(17,893 |
) |
| Capital expenditures, including purchases of equipment |
|
|
(427 |
) |
|
|
(667 |
) |
|
|
(1,987 |
) |
|
|
(1,514 |
) |
|
|
|
|
|
|
|
|
|
|
|
|
|
|
|
|
|
| Free Cash Flow |
|
$ |
9,830 |
|
|
$ |
(6,291 |
) |
|
$ |
24,788 |
|
|
$ |
(19,407 |
) |
|
|
|
|
|
|
|
|
|
|
|
|
|
|
|
|
|

Exhibit 99.2 Q4 & Full Year 2023 Results Conference Call February
28, 2024 helping humans heal.

Disclaimer & Cautionary Statements This presentation includes
forward-looking statements. Forward-looking statements are subject to risks and uncertainties, and the Company cautions investors against placing undue reliance on such statements. Actual results may differ materially from those set forth in the
forward-looking statements. Such forward-looking statements include statements regarding: • Future sales or sales growth; • Estimates of potential market size and demand for the Company’s current and future products; • Plans
for expansion outside of the U.S.; • The effectiveness of amniotic tissue as a therapy for any particular indication or condition; • Expected spending on research and development; • The Company’s long-term strategy and goals
for value creation, the status of its pipeline products, expectations for future products, and expectations for future growth and profitability 2

Disclaimer & Cautionary Statements Additional forward-looking
statements may be identified by words such as believe, expect, may, plan, potential, will, preliminary, and similar expressions, and are based on management's current beliefs and expectations. Forward-looking statements are subject to risks and
uncertainties, and the Company cautions investors against placing undue reliance on such statements. Actual results may differ materially from those set forth in the forward-looking statements. Factors that could cause actual results to differ from
expectations include: • Future sales are uncertain and are affected by competition, access to customers, patient access to hospitals and healthcare providers, the reimbursement environment and many other factors; • The future market for
the Company’s products can depend on regulatory approval of such products, which might not occur at all or when expected, and is based in part on assumptions regarding the number of patients who elect less acute and more acute treatment than
the Company’s products, market acceptance of the Company’s products, and adequate reimbursement for such therapies; • The process of obtaining regulatory clearances or approvals to market a biological product or medical device from
the FDA or similar regulatory authorities outside of the U.S. is costly and time consuming, and such clearances or approvals may not be granted on a timely basis, or at all, and the ability to obtain the rights to market additional, suitable
products depends on negotiations with third parties which may not be forthcoming; and • The Company describes additional risks and uncertainties in the Risk Factors section of its most recent annual report and quarterly reports filed with the
Securities and Exchange Commission. Any forward-looking statements speak only as of the date of this presentation and the Company assumes no obligation to update any forward- looking statement. 3

Joe Capper Chief Executive Officer helping humans heal.
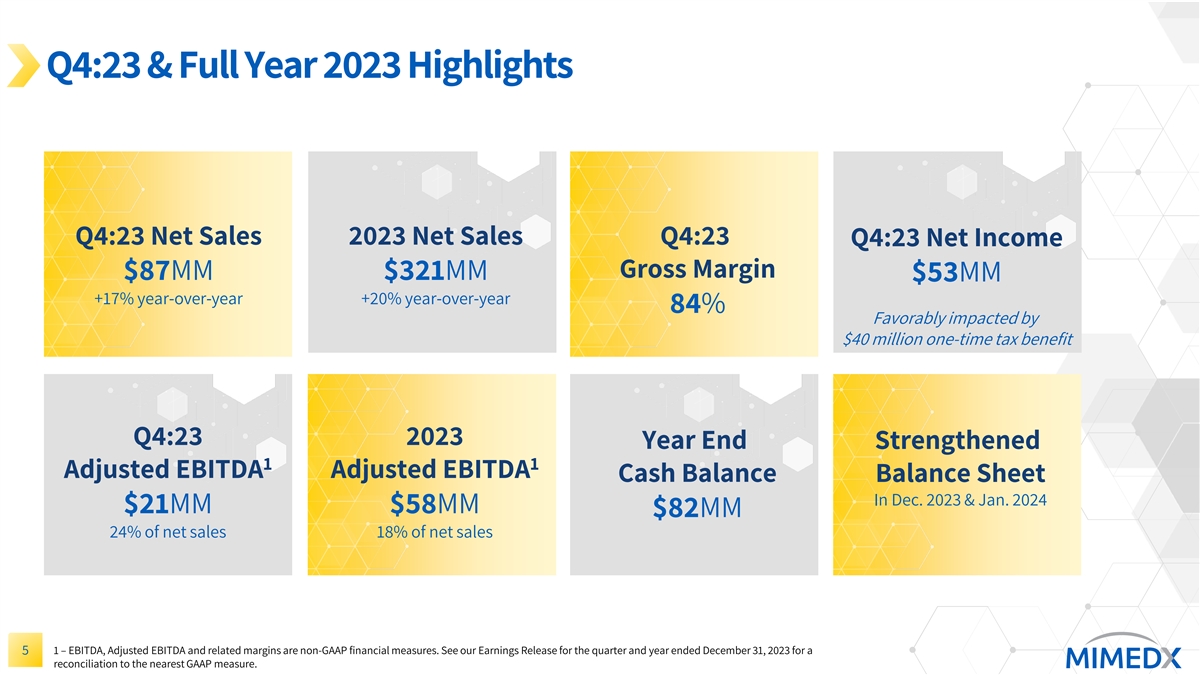
Q4:23 & Full Year 2023 Highlights Q4:23 Net Sales 2023 Net Sales
Q4:23 Q4:23 Net Income Gross Margin $87MM $321MM $53MM +17% year-over-year +20% year-over-year 84% Favorably impacted by $40 million one-time tax benefit Q4:23 2023 Year End Strengthened 1 1 Adjusted EBITDA Adjusted EBITDA Cash Balance Balance Sheet
In Dec. 2023 & Jan. 2024 $21MM $58MM $82MM 24% of net sales 18% of net sales 1 – EBITDA, Adjusted EBITDA and related margins are non-GAAP financial measures. See our Earnings Release for the quarter and year ended December 31, 2023 for a 5
reconciliation to the nearest GAAP measure.

Continuing to Execute on Strategic Priorities • Growth in all
sites-of-service Build leadership position in • Strong start for EPIEFFECT® - helping drive Wound & Surgical continued momentum in Private Office • Continued progress in building business in Japan • Working internally and
externally to expand our skin substitute portfolio beyond Develop opportunities in amniotic tissue adjacent markets • Expansion would increase addressable market and round out our product portfolio • Strong Gross Margin and Adjusted
EBITDA to close out 2023, positioning us well for 2024 Demonstrate corporate • Balance sheet improvements in late-2023 discipline around expenses and early-2024 simplify and strengthen our position to invest for growth helping humans heal.
6

Doug Rice Chief Financial Officer helping humans heal.

Q4:23 Net Sales Demonstrate Continued Commercial Momentum Total By Site
of Service Other $87 $8MM +72% $74 Private Office Hospital $28MM +24% $51MM +8% Q4:22 Q4:23 Fifth consecutive quarter of double-digit year-over-year net sales growth 8 $ millions
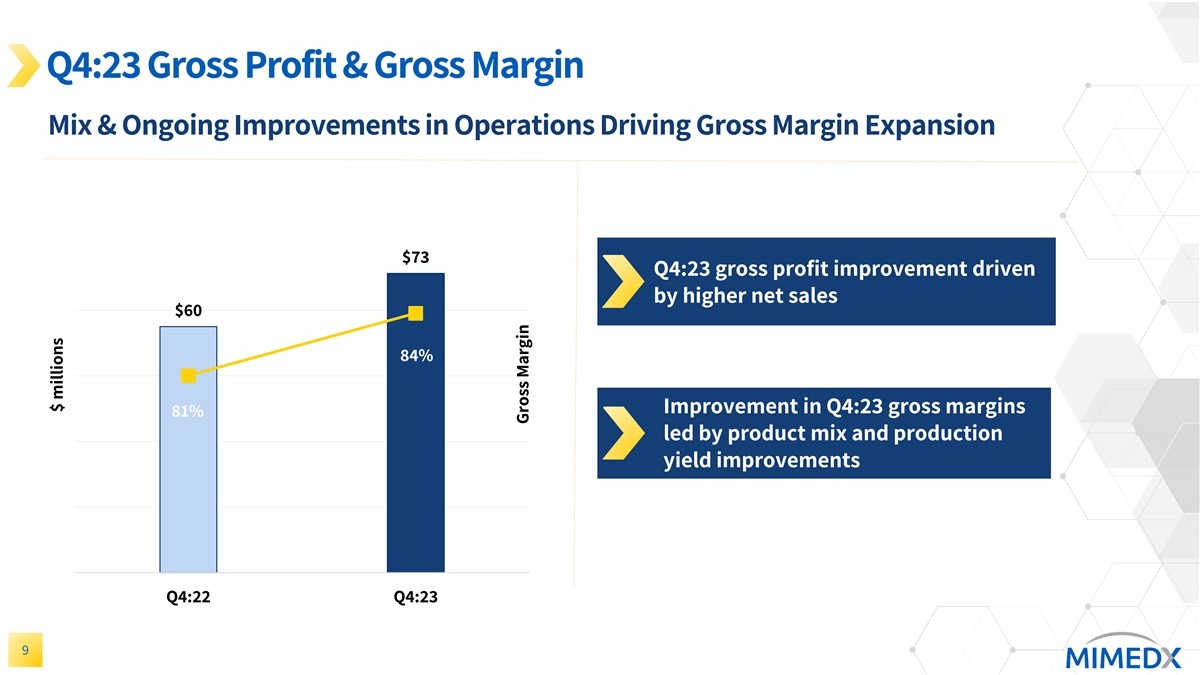
Q4:23 Gross Profit & Gross Margin Mix & Ongoing Improvements in
Operations Driving Gross Margin Expansion 80 $73 Q4:23 gross profit improvement driven by higher net sales $60 84% Improvement in Q4:23 gross margins 81% led by product mix and production yield improvements 0 Q4:22 Q4:23 9 $ millions Gross
Margin

Q4:23 Operating Expenses Q4:22 Ongoing operating $54 $50 Q4:23 expense
leverage as cost controls offset higher commission spend $3 $2 % of net sales 67% 63% 4 % 3% R&D SG&A Q4:23 GAAP net income favorably $53 impacted by one- time tax benefit $21 Second $7 consecutive quarter achieving $0 10% % of net sales
(0%) 62% 24% Adjusted EBITDA Adjusted EBITDA Net Income/Loss margin above 20% 10 $ millions $ millions
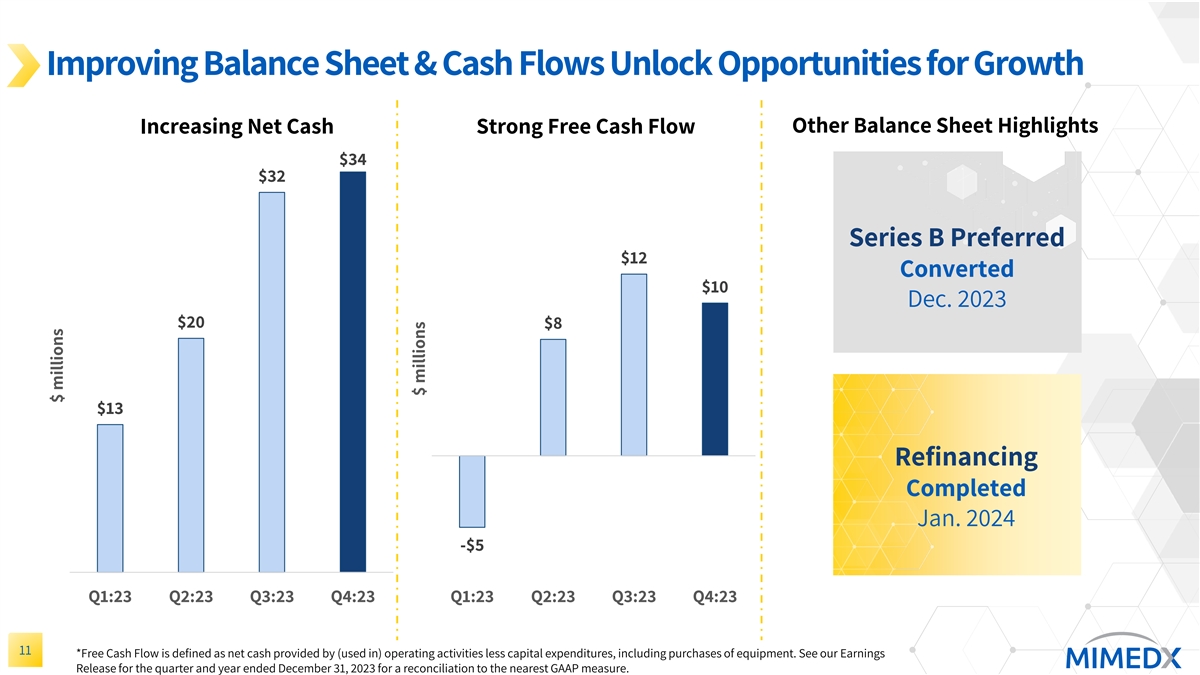
Improving Balance Sheet & Cash Flows Unlock Opportunities for
Growth Other Balance Sheet Highlights Increasing Net Cash Strong Free Cash Flow $34 $32 Series B Preferred $12 Converted $10 Dec. 2023 $20 $8 $13 Refinancing Completed Jan. 2024 -$5 Q1:23 Q2:23 Q3:23 Q4:23 Q1:23 Q2:23 Q3:23 Q4:23 11 *Free Cash Flow
is defined as net cash provided by (used in) operating activities less capital expenditures, including purchases of equipment. See our Earnings Release for the quarter and year ended December 31, 2023 for a reconciliation to the nearest GAAP
measure. $ millions $ millions

2023 In Summary +20% +110 basis point $58MM Net Sales Growth Gross
Margin Net Income Expansion Free Cash Flow Cash $58MM $25MM $82MM Adjusted EBITDA 18% of net sales helping humans heal. 12

Joe Capper Chief Executive Officer helping humans heal.

Summary Q4:23 & 2023 Year-Over-Year Net Sales Growth of 17% and
20%, Respectively Q4:23 Gross Profit Margin Increased to 84% Q4:23 Adjusted EBITDA of $21 Million (24% of Net Closing Out a Sales) Seminal Year at MIMEDX! Cash Balance Increased Nearly 25% in 2023 Simplified and Strengthened our Balance Sheet Full
Commercial Launch of EPIEFFECT Well Underway 14

* 2024 Outlook as of February 28, 2024 Anticipate Full Year Revenue
2024 Revenue Growth Percentage in the Low Growth Double-Digits Expect Adjusted EBITDA Margin for Full Year Profitability 2024 to be Above 20% *2024 Outlook provided as of February 28, 2024. Actual results may differ. We are not able to provide a
reconciliation of our Adjusted EBITDA margin expectation to the corresponding GAAP measure without unreasonable effort because of the uncertainty and variability of the nature and amount of the non-recurring and other items that are excluded from
such non-GAAP financial measures. Such adjustments 15 in future periods are generally expected to be similar to the kinds of charges excluded from such non-GAAP financial measures in prior periods. The exclusion of these charges and costs in future
periods could have a significant impact on our non-GAAP financial measures.

Closing Remarks, Q&A
v3.24.0.1
| X |
- DefinitionBoolean flag that is true when the XBRL content amends previously-filed or accepted submission.
| Name: |
dei_AmendmentFlag |
| Namespace Prefix: |
dei_ |
| Data Type: |
xbrli:booleanItemType |
| Balance Type: |
na |
| Period Type: |
duration |
|
| X |
- DefinitionFor the EDGAR submission types of Form 8-K: the date of the report, the date of the earliest event reported; for the EDGAR submission types of Form N-1A: the filing date; for all other submission types: the end of the reporting or transition period. The format of the date is YYYY-MM-DD.
| Name: |
dei_DocumentPeriodEndDate |
| Namespace Prefix: |
dei_ |
| Data Type: |
xbrli:dateItemType |
| Balance Type: |
na |
| Period Type: |
duration |
|
| X |
- DefinitionThe type of document being provided (such as 10-K, 10-Q, 485BPOS, etc). The document type is limited to the same value as the supporting SEC submission type, or the word 'Other'.
| Name: |
dei_DocumentType |
| Namespace Prefix: |
dei_ |
| Data Type: |
dei:submissionTypeItemType |
| Balance Type: |
na |
| Period Type: |
duration |
|
| X |
- DefinitionAddress Line 1 such as Attn, Building Name, Street Name
| Name: |
dei_EntityAddressAddressLine1 |
| Namespace Prefix: |
dei_ |
| Data Type: |
xbrli:normalizedStringItemType |
| Balance Type: |
na |
| Period Type: |
duration |
|
| X |
- Definition
+ References
+ Details
| Name: |
dei_EntityAddressCityOrTown |
| Namespace Prefix: |
dei_ |
| Data Type: |
xbrli:normalizedStringItemType |
| Balance Type: |
na |
| Period Type: |
duration |
|
| X |
- DefinitionCode for the postal or zip code
| Name: |
dei_EntityAddressPostalZipCode |
| Namespace Prefix: |
dei_ |
| Data Type: |
xbrli:normalizedStringItemType |
| Balance Type: |
na |
| Period Type: |
duration |
|
| X |
- DefinitionName of the state or province.
| Name: |
dei_EntityAddressStateOrProvince |
| Namespace Prefix: |
dei_ |
| Data Type: |
dei:stateOrProvinceItemType |
| Balance Type: |
na |
| Period Type: |
duration |
|
| X |
- DefinitionA unique 10-digit SEC-issued value to identify entities that have filed disclosures with the SEC. It is commonly abbreviated as CIK. Reference 1: http://www.xbrl.org/2003/role/presentationRef
-Publisher SEC
-Name Exchange Act
-Number 240
-Section 12
-Subsection b-2
| Name: |
dei_EntityCentralIndexKey |
| Namespace Prefix: |
dei_ |
| Data Type: |
dei:centralIndexKeyItemType |
| Balance Type: |
na |
| Period Type: |
duration |
|
| X |
- DefinitionIndicate if registrant meets the emerging growth company criteria. Reference 1: http://www.xbrl.org/2003/role/presentationRef
-Publisher SEC
-Name Exchange Act
-Number 240
-Section 12
-Subsection b-2
| Name: |
dei_EntityEmergingGrowthCompany |
| Namespace Prefix: |
dei_ |
| Data Type: |
xbrli:booleanItemType |
| Balance Type: |
na |
| Period Type: |
duration |
|
| X |
- DefinitionCommission file number. The field allows up to 17 characters. The prefix may contain 1-3 digits, the sequence number may contain 1-8 digits, the optional suffix may contain 1-4 characters, and the fields are separated with a hyphen.
| Name: |
dei_EntityFileNumber |
| Namespace Prefix: |
dei_ |
| Data Type: |
dei:fileNumberItemType |
| Balance Type: |
na |
| Period Type: |
duration |
|
| X |
- DefinitionTwo-character EDGAR code representing the state or country of incorporation.
| Name: |
dei_EntityIncorporationStateCountryCode |
| Namespace Prefix: |
dei_ |
| Data Type: |
dei:edgarStateCountryItemType |
| Balance Type: |
na |
| Period Type: |
duration |
|
| X |
- DefinitionThe exact name of the entity filing the report as specified in its charter, which is required by forms filed with the SEC. Reference 1: http://www.xbrl.org/2003/role/presentationRef
-Publisher SEC
-Name Exchange Act
-Number 240
-Section 12
-Subsection b-2
| Name: |
dei_EntityRegistrantName |
| Namespace Prefix: |
dei_ |
| Data Type: |
xbrli:normalizedStringItemType |
| Balance Type: |
na |
| Period Type: |
duration |
|
| X |
- DefinitionThe Tax Identification Number (TIN), also known as an Employer Identification Number (EIN), is a unique 9-digit value assigned by the IRS. Reference 1: http://www.xbrl.org/2003/role/presentationRef
-Publisher SEC
-Name Exchange Act
-Number 240
-Section 12
-Subsection b-2
| Name: |
dei_EntityTaxIdentificationNumber |
| Namespace Prefix: |
dei_ |
| Data Type: |
dei:employerIdItemType |
| Balance Type: |
na |
| Period Type: |
duration |
|
| X |
- DefinitionLocal phone number for entity.
| Name: |
dei_LocalPhoneNumber |
| Namespace Prefix: |
dei_ |
| Data Type: |
xbrli:normalizedStringItemType |
| Balance Type: |
na |
| Period Type: |
duration |
|
| X |
- DefinitionBoolean flag that is true when the Form 8-K filing is intended to satisfy the filing obligation of the registrant as pre-commencement communications pursuant to Rule 13e-4(c) under the Exchange Act. Reference 1: http://www.xbrl.org/2003/role/presentationRef
-Publisher SEC
-Name Exchange Act
-Number 240
-Section 13e
-Subsection 4c
| Name: |
dei_PreCommencementIssuerTenderOffer |
| Namespace Prefix: |
dei_ |
| Data Type: |
xbrli:booleanItemType |
| Balance Type: |
na |
| Period Type: |
duration |
|
| X |
- DefinitionBoolean flag that is true when the Form 8-K filing is intended to satisfy the filing obligation of the registrant as pre-commencement communications pursuant to Rule 14d-2(b) under the Exchange Act. Reference 1: http://www.xbrl.org/2003/role/presentationRef
-Publisher SEC
-Name Exchange Act
-Number 240
-Section 14d
-Subsection 2b
| Name: |
dei_PreCommencementTenderOffer |
| Namespace Prefix: |
dei_ |
| Data Type: |
xbrli:booleanItemType |
| Balance Type: |
na |
| Period Type: |
duration |
|
| X |
- DefinitionTitle of a 12(b) registered security. Reference 1: http://www.xbrl.org/2003/role/presentationRef
-Publisher SEC
-Name Exchange Act
-Number 240
-Section 12
-Subsection b
| Name: |
dei_Security12bTitle |
| Namespace Prefix: |
dei_ |
| Data Type: |
dei:securityTitleItemType |
| Balance Type: |
na |
| Period Type: |
duration |
|
| X |
- DefinitionName of the Exchange on which a security is registered. Reference 1: http://www.xbrl.org/2003/role/presentationRef
-Publisher SEC
-Name Exchange Act
-Number 240
-Section 12
-Subsection d1-1
| Name: |
dei_SecurityExchangeName |
| Namespace Prefix: |
dei_ |
| Data Type: |
dei:edgarExchangeCodeItemType |
| Balance Type: |
na |
| Period Type: |
duration |
|
| X |
- DefinitionBoolean flag that is true when the Form 8-K filing is intended to satisfy the filing obligation of the registrant as soliciting material pursuant to Rule 14a-12 under the Exchange Act. Reference 1: http://www.xbrl.org/2003/role/presentationRef
-Publisher SEC
-Name Exchange Act
-Section 14a
-Number 240
-Subsection 12
| Name: |
dei_SolicitingMaterial |
| Namespace Prefix: |
dei_ |
| Data Type: |
xbrli:booleanItemType |
| Balance Type: |
na |
| Period Type: |
duration |
|
| X |
- DefinitionTrading symbol of an instrument as listed on an exchange.
| Name: |
dei_TradingSymbol |
| Namespace Prefix: |
dei_ |
| Data Type: |
dei:tradingSymbolItemType |
| Balance Type: |
na |
| Period Type: |
duration |
|
| X |
- DefinitionBoolean flag that is true when the Form 8-K filing is intended to satisfy the filing obligation of the registrant as written communications pursuant to Rule 425 under the Securities Act. Reference 1: http://www.xbrl.org/2003/role/presentationRef
-Publisher SEC
-Name Securities Act
-Number 230
-Section 425
| Name: |
dei_WrittenCommunications |
| Namespace Prefix: |
dei_ |
| Data Type: |
xbrli:booleanItemType |
| Balance Type: |
na |
| Period Type: |
duration |
|
MiMedx (NASDAQ:MDXG)
Gráfico Histórico do Ativo
De Mar 2024 até Abr 2024

MiMedx (NASDAQ:MDXG)
Gráfico Histórico do Ativo
De Abr 2023 até Abr 2024
